


 , Jing Zhao 1,†, Wenjun Feng 1, Chao Wang 2, Yu Yan 1, Xiaowen Wang 3, Xin Li 1,*
1 Department of Neurology, Second Hospital of Tianjin Medical University, 300211 Tianjin, China
2 Department of Health and Medical/Geriatrics, Second Hospital of Tianjin Medical University, 300211 Tianjin, China
3 Department of Neurology, First Affiliated Hospital of Tianjin University of Traditional Chinese Medicine, 300073 Tianjin, China
†These authors contributed equally.
Abstract
To investigate topological brain network properties, intra- and inter-network network patterns, rich-club organization, structural-functional coupling, and their associations with cognitive impairment in elderly patients with cerebral small vessel disease (CSVD).
A total of 264 participants were enrolled: 60 healthy controls, 93 CSVD patients without mild cognitive impairment (CSVD-NMCI), and 111 CSVD patients with MCI (CSVD-MCI). All underwent neuropsychological testing and multimodal magnetic resonance imaging (MRI). Structural and functional networks were constructed, and graph theory was applied to assess global and local topology. Associations among network metrics, default mode network (DMN), frontoparietal control network (FPCN), dorsal attention network (DAN), rich-club connectivity, structural connectivity (SC)–functional connectivity (FC) coupling, and cognitive scores were examined.
CSVD patients exhibited significant global and nodal topological disruption (p < 0.05, Bonferroni correction). In CSVD-MCI, FC was reduced within the DMN and DAN but increased within the FPCN. FC within the DAN and between DMN–DAN was positively correlated with Auditory Verbal Learning Test (AVLT) performance. SC-FC coupling was significantly higher in CSVD-MCI than in CSVD-NMCI and controls (p < 0.05). Rich-club, feeder, and local connections were markedly impaired in CSVD-MCI and correlated with AVLT and Symbol Digit Modalities Test scores.
CSVD is associated with decreased network efficiency and elevated SC-FC coupling. Altered FC in the FPCN, DMN, and DAN may indicate compensatory mechanisms, whereas rich-club disruption may be key evidence for cognitive impairment. These findings provide novel insights into network dysfunction underlying cognitive decline in CSVD.
Keywords
- cerebral small vessel disease
- diffusion tensor imaging
- magnetic resonance imaging
- mild cognitive impairment
The prevalence of cerebrovascular disorders has steadily increased, largely in parallel with the growing burden of vascular risk factors in aging populations. Within this spectrum, cerebral small vessel disease (CSVD) has emerged as a leading contributor to neurological disability. Epidemiological data suggest that CSVD accounts for roughly one-quarter of ischemic strokes and nearly half of dementia cases worldwide [1]. Since the disease often develops insidiously and may remain clinically silent for years, CSVD-related mild cognitive impairment (MCI) is frequently overlooked. White-matter changes have been linked to decreased cognition in individuals with metabolic and vascular risk profiles, indicating that clusters of subclinical vascular insults may accelerate cerebrovascular damage [2]. If these patients are not identified and managed at an early stage, progressive deterioration may lead to overt dementia, imposing a substantial socioeconomic and caregiving burden. Therefore, a better understanding of the mechanisms underlying cognitive dysfunction in CSVD is essential to enable earlier detection, institute preventive strategies, and improve clinical outcomes.
Normal brain function relies on the dynamic interplay among multiple large-scale networks, each specialized for different cognitive roles [3]. The default mode network (DMN) is primarily active during rest and inward-focused processing [4], while the dorsal attention network (DAN) facilitates attention to external stimuli and task-related demands [5]. The frontoparietal control network (FPCN) is believed to interact with either the DMN or DAN, depending on the context, providing top-down regulation across diverse cognitive processes [6, 7]. Although DMN alterations have been reported in CSVD, much less is known about how CSVD affects the DAN and FPCN, or the interactions among these networks. Examining both within- and between-network interactions among the DMN, DAN, and FPCN could provide valuable information on the neural mechanisms underlying cognitive deficits in CSVD.
In the brain’s network organization, highly linked hub regions establish a densely interconnected “rich-club”. These nodes constitute a high-capacity backbone that facilitates efficient long-range communication and integration across distributed systems [8]. Rich-club organization is now recognized as a fundamental property of the connectome, and accumulating evidence indicates that disturbances in this core network are a common feature of diverse neurologic and psychiatric diseases [9]. However, it is still debated whether CSVD predominantly produces diffuse network disruption or whether damage is relatively concentrated in the rich-club and its associated pathways.
Advanced magnetic resonance imaging (MRI) methods enable the measurement of both structural and functional brain networks. In graph-theoretical models, structural connectivity (SC) captures anatomical fiber pathways, whereas functional connectivity (FC) reflects the temporal synchrony of activity between regions [10]. With advances in multimodal MRI, SC-FC coupling—an index integrating structural and functional information—has become a useful tool for evaluating the integrity of brain networks [11, 12, 13, 14]. Prior work on SC-FC coupling has mainly focused on gray-matter nodes. However, demyelination and small-vessel-related white-matter damage are hallmark MRI features of CSVD and are closely tied to clinical outcomes. Evaluating SC-FC coupling with an emphasis on white-matter networks may therefore reveal additional mechanisms linking CSVD to impaired cognition.
In this study, we used graph-theoretical analysis to systematically examine alterations in structural and functional brain networks in older adults with CSVD. We further examined intra- and inter-network FC within the DMN, DAN, and FPCN, and examined rich-club organization in all participants. In addition, we investigated SC-FC coupling to explore the relationship between anatomical connectivity and functional synchrony. In addition, we analyzed the associations between network metrics and cognitive performance to provide insights into the neuroanatomical mechanisms underlying cognitive impairment in CSVD.
Participants were enrolled from the Neurology Department and the Physical Examination Center at the Second Hospital of Tianjin Medical University. Between January 2021 and December 2023, 398 individuals were initially screened.
All enrolled patients were diagnosed with sporadic CSVD. Inclusion criteria for CSVD participants were as follows: (1) age between 50 and 80 years; (2) at least 6 years of formal education; (3) MRI evidence of CSVD according to standards for reporting vascular changes on neuroimaging-2 (STRIVE-2) criteria [15], including: (i) white matter hyperintensities (WMH) graded using the Fazekas scale (0–3) on T2-weighted Fluid Attenuated Inversion Recovery (T2-FLAIR) [16]; (ii) lacunes (3–15 mm) in subcortical regions with cerebrospinal fluid—like signals on T1-Weighted Imaging (T1WI) and T2-FLAIR; (iii) cerebral microbleeds (CMBs) assessed using the Microbleed Anatomical Rating Scale (MARS) [17]; and (iv) enlarged perivascular spaces (EPVS) evaluated by Maclullich’s method [18]; (4) a total CSVD burden score (0–4) based on the presence of lacunes, CMBs, severe WMH (Fazekas 3 periventricular or 2–3 deep WMH), and moderate-to-severe EPVS in the basal ganglia [19]; (5) informed consent form signed by participants.
MCI was defined according to the Vascular Behavioral and Cognitive Disorders (VASCOG) criteria for vascular cognitive impairment [20]: (1) evidence of acquired decline in one or more cognitive domains compared with previous functioning, based on informant or clinician report and/or standardized testing (approximately 1–2 SD below normative means); and (2) preservation of independence in basic and instrumental activities of daily living, although tasks may require more time, effort or compensatory measures. The specific cognitive domains assessed are provided in Supplementary Data 1.
Exclusion criteria included: (1) individuals with known or suspected monogenic
CSVD (e.g., Cerebral Autosomal Dominant Arteriopathy with Subcortical Infarcts
and Leukoencephalopathy [CADASIL], Cerebral Autosomal Recessive Arteriopathy with
Subcortical Infarcts and Leukoencephalopathy [CARASIL], or other hereditary
small-vessel syndromes) were excluded based on clinical history, family history,
and characteristic MRI findings inconsistent with sporadic CSVD; (2) major
neurological or psychiatric disorders; (3) non-vascular causes of white matter
lesions; (4) large cortical or non-lacunar infarcts; (5) cardioembolic stroke;
(6)
Control participants met the following criteria: (1) at least 6 years of
education; (2) no history of stroke or serious systemic disease; (3) Fazekas
score
After excluding participants due to incomplete clinical data (n = 32), abnormal neurological examinations (n = 23), refusal or inability to undergo MRI (n = 31), inability to cooperate with cognitive assessments (n = 27), or excessive head motion (n = 21), the final sample comprised 60 controls, 93 CSVD without MCI (CSVD-NMCI) and 111 CSVD with MCI (CSVD-MCI) (Fig. 1).
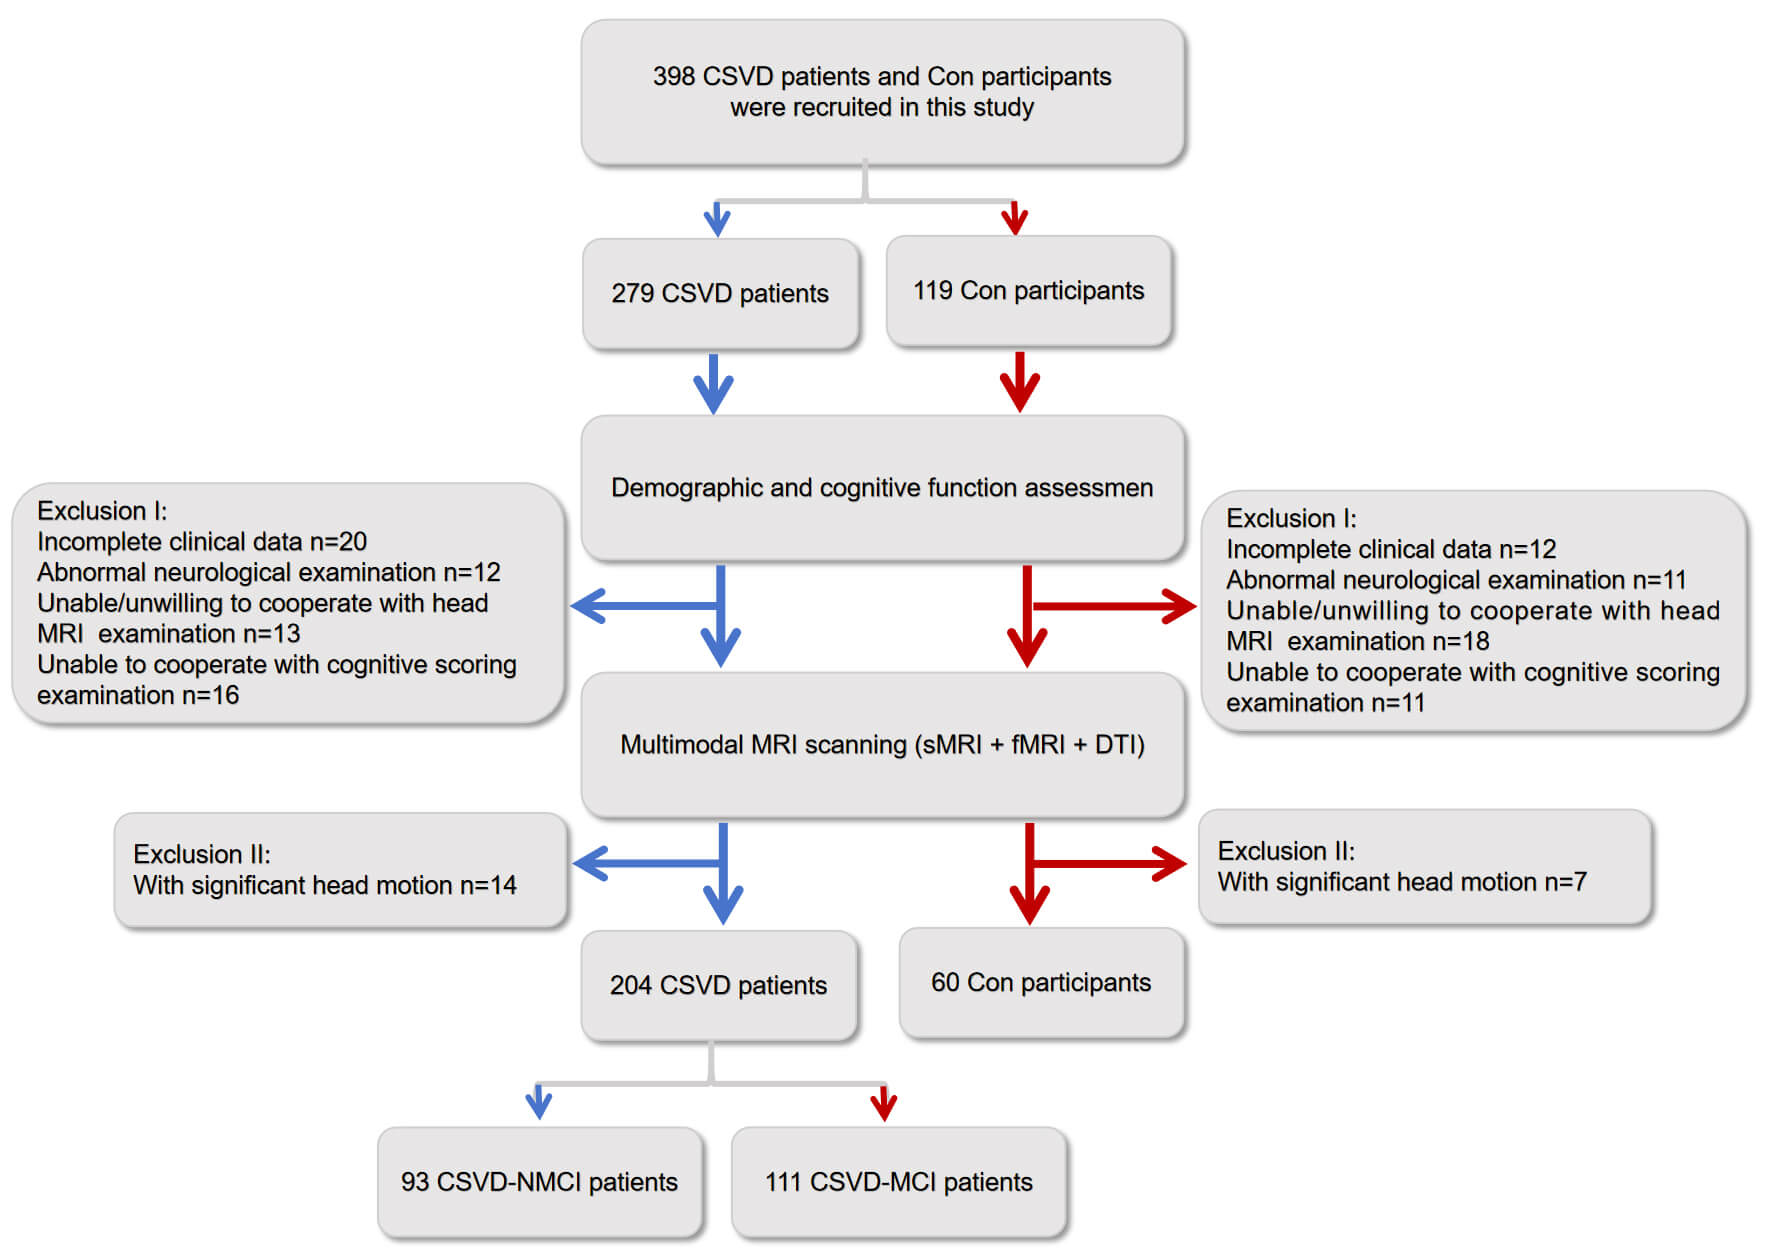 Fig. 1.
Overview of participant recruitment and exclusion for CSVD patients and controls. CSVD, cerebral small vessel disease; DTI, diffusion tensor imaging; CSVD-MCI, CSVD patients with mild cognitive impairment; CSVD-NMCI, CSVD patients without mild cognitive impairment; Con, control group; MRI, magnetic resonance imaging; sMRI, structural magnetic resonance imaging; fMRI, functional magnetic resonance imaging.
Before MRI scanning, all participants completed standardized cognitive testing.
Cognitive function was assessed using the Chinese version of the Montreal
Cognitive Assessment (MoCA), which has been validated for language and cultural
appropriateness [23]. One additional point was added for participants with
All MRI data were collected on a 3.0 T GE scanner (Signa HDxt; GE HealthCare,
Chicago, IL, USA) equipped with a 32-channel head coil. The imaging protocol
included resting-state fMRI (rs-fMRI), diffusion tensor imaging (DTI),
high-resolution T1-weighted scans, and T2-FLAIR sequences. DTI was performed with
32 diffusion directions, b = 1000 s/mm2, reference b = 0, repetition time
(TR) = 8000 ms, echo time (TE) = 88.4 ms, matrix = 128
Rs-fMRI: Preprocessing was performed with the DPARSF toolbox (DPABI_V8.2_240510; http://rfmri.org/dpabi) [32], including removal of the first 10 volumes, slice-timing adjustment, motion correction, spatial normalization, smoothing, and band-pass filtering.
DTI: Diffusion data were processed using the PANDA toolbox (PANDA_1.3.1; https://www.nitrc.org/frs/?group_id=582) [33]. The pipeline included brain extraction (BET), eddy-current and motion correction, tensor fitting, and registration to a standard template. Additional methodological details are provided in the Supplementary Material-Method.
A total of 90 cortical and subcortical regions of interest (ROIs) were
delineated based on the Automated Anatomical Labeling (AAL) atlas, with the
cerebellum excluded [34]. For functional networks, pairwise Pearson correlations
of blood oxygen level dependent (BOLD) time series between ROIs were computed to
generate 90
The network measures encompassed clustering coefficient (Cp), characteristic
path length (Lp), global efficiency (Eglob), local efficiency (Elocal), and
small-worldness (
T1-weighted scans were analyzed with CAT12 and SPM12 within MATLAB R2012b (MathWorks, Natick, MA, USA).
Volumes of gray matter, white matter, and cerebrospinal fluid were extracted.
WMH volume was normalized as a percentage of total
intracranial volume using the formula: WMH volume/total intracranial volume
Rich-club nodes were identified as the highest-degree 15% of regions, determined by averaging node degree across all subjects [37]. This subset comprised PreCG.R, SFGdor.L, ORBsup.R, MFG.L, ORBmid.L, ORBinf.L, ROL.L, OLF.R, SFGmed.R, REC.R, INS.L, ACG.R, HIP.R, PoCG.L, and PUT.L (Fig. 2A; Supplementary Data 2) [38]. Based on the separation of rich-club and non-rich-club regions, the structural network was divided into three types of connections: (i) connections linking rich-club regions (red), (ii) pathways joining rich-club regions with peripheral regions (blue), and (iii) connections confined to peripheral regions (green) (Fig. 2B).
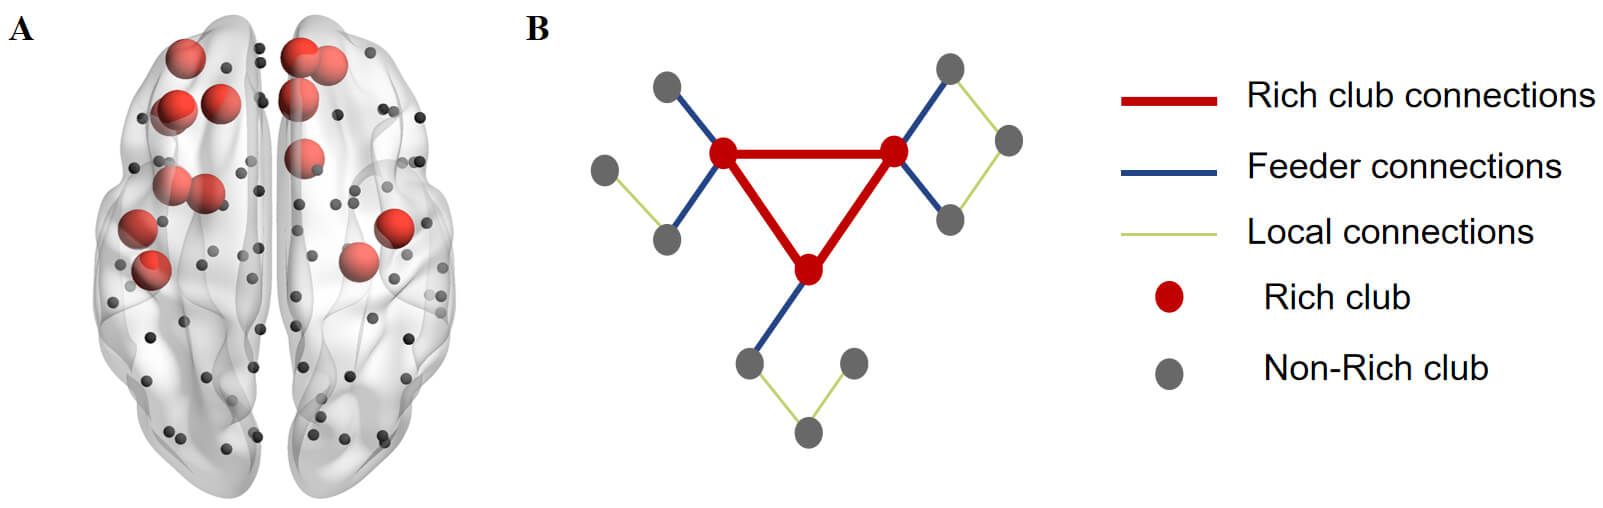 Fig. 2.
Schematic illustration of local, feeder, and rich-club connections. (A) Rich-club nodes (red) and peripheral regions (black) identified across all groups. (B) Classification of structural network connections. For each category—rich-club, feeder, and local—the overall “connection strength” was computed as the sum of the edge weights within that group.
The DMN, FPCN, and DAN were delineated using a seed-based region-of-interest strategy. Following the procedures outlined by Grady et al. [39] and Spreng et al. [40], 5-mm-radius spheres were placed at previously published Montreal Neurological Institute (MNI) coordinates. In line with established descriptions [41], the DMN set encompassed bilateral posterior cingulate cortex (PCC), medial prefrontal areas, the inferior parietal complex, lateral temporal regions, and the hippocampal formation. The FPCN was represented by bilateral dorsolateral prefrontal cortex (DLPFC), dorsomedial prefrontal zones, and lateral parietal cortex, while the DAN consisted of bilateral intraparietal sulcus, frontal eye field regions, and middle temporal loci [42, 43]. For each seed, the average BOLD signal was obtained, and correlation coefficients were calculated for every ROI pair.
For every participant, six connectivity indices were calculated: three reflecting internal coherence within the DMN, FPCN, and DAN, and three capturing interactions among the DMN–FPCN, DMN–DAN, and FPCN–DAN pairs. These measures were compared with cognitive performance scores to evaluate their functional significance. Further methodological details are presented in the Supplementary Material-Method.
SC-FC coupling was quantified by correlating the vectorized structural and functional connectivity matrices, producing an individual-level measure of correspondence between physical pathways and functional interactions. A full description of the computation process is available in the Supplementary Material-Method.
Demographic, clinical, and cognitive data were processed in SPSS version 22.0
(IBM Corp., Armonk, NY, USA). The Shapiro–Wilk test was applied to evaluate
distributional assumptions. For measures meeting normality criteria, group
differences in demographic factors and neuropsychological performance were
examined using ANCOVA, followed by Bonferroni-adjusted post hoc comparisons. For
non-normally distributed data, the Kruskal–Wallis test was applied, followed by
Dunn’s test for post hoc inter-group comparisons, with Bonferroni-adjusted
p-values. Categorical variables were analyzed using chi-square tests.
Pearson correlation analyses were performed to evaluate relationships between
network measures and cognitive scores, controlling for age, sex, education, mood
scales, and vascular risk factors (VRFs). A two-tailed p
The three groups—controls, CSVD-NMCI, and CSVD-MCI—did not differ
significantly in age, sex, educational background, or vascular risk factors
(p
| Variable | Con (N = 60) | CSVD-NMCI (N = 93) | CSVD-MCI (N = 111) | F/x2 | p | ||
| Mean (SD)/Median (IQR) or No. (%) | Mean (SD)/Median (IQR) or No. (%) | Mean (SD)/Median (IQR) or No. (%) | |||||
| Age (year) | 64.86 (6.442) | 65.20 (7.068) | 65.87 (6.411) | 0.516 | 0.598 | ||
| Male | 31 (51.7) | 52 (55.9) | 54 (48.6) | 1.072 | 0.585 | ||
| BMI (kg/m2) | 27.082 (3.150) | 26.986 (3.656) | 27.302 (3.694) | 0.209 | 0.811 | ||
| Education level | 5.541 | 0.236 | |||||
| Below High School | 33 (55.0) | 37 (39.8) | 60 (54.1) | ||||
| High School | 16 (26.7) | 37 (39.8) | 32 (28.8) | ||||
| High school or above | 11 (18.3) | 19 (20.4) | 19 (17.1) | ||||
| Systolic pressure (mm Hg) | 138.211 (16.409) | 137.245 (16.005) | 136.720 (17.568) | 0.154 | 0.857 | ||
| Diastolic pressure (mm Hg) | 80.772 (9.398) | 78.820 (10.333) | 78.538 (10.261) | 1.027 | 0.359 | ||
| Vascular risk factors | |||||||
| Hypercholesterolemia (%) | 13 (21.7) | 22 (23.7) | 25 (22.5) | 0.087 | 0.958 | ||
| Diabetes Mellitus (%) | 14 (23.3) | 27 (29.0) | 40 (36.0) | 3.139 | 0.208 | ||
| Hypertension (%) | 29 (48.3) | 46 (49.5) | 62 (55.9) | 1.223 | 0.542 | ||
| History of Drinking | 1.761 | 0.780 | |||||
| Never drank alcohol | 46 (76.7) | 67 (72.0) | 77 (69.4) | ||||
| Previous Drinking | 2 (3.3) | 7 (7.5) | 8 (7.2) | ||||
| Drinking now | 12 (20.0) | 19 (20.4) | 26 (23.4) | ||||
| Smoking history | 1.564 | 0.815 | |||||
| Never smoked | 40 (66.7) | 56 (60.2) | 64 (57.7) | ||||
| Previous smoking | 5 (8.3) | 11 (11.8) | 12 (10.8) | ||||
| Smoking now | 15 (25.0) | 26 (28.0) | 35 (31.5) | ||||
| Neuropsychological assessment | |||||||
| MoCA | 27.30 (0.763) | 26.91 (2.492) | 22.98 (4.427) | 82.170 | 0.000b,c | ||
| AVLT delayed recall | 6 (5, 9) | 6 (4, 8) | 5 (3, 8) | 10.199 | 0.006b | ||
| ROCF delay | 27.851 (3.934) | 27.604 (3.595) | 27.217 (4.125) | 0.568 | 0.568 | ||
| DS positive sequence | 7.86 (1.928) | 7.45 (1.635) | 7.18 (1.831) | 2.827 | 0.061 | ||
| DS reverse order | 4 (3, 5) | 4 (3, 5) | 4 (3, 4) | 1.300 | 0.522 | ||
| ROCF copy | 34.82 (2.110) | 34.76 (2.236) | 34.38 (3.062) | 0.789 | 0.455 | ||
| CDT | 2.50 (0.875) | 2.26 (0.973) | 2.43 (0.916) | 1.436 | 0.240 | ||
| SCWT-C-B | 12 (5, 23) | 13 (5, 20) | 12 (6, 19) | 0.011 | 0.994 | ||
| CTT-B | 146.2 (115, 211.3) | 150 (113.4, 205.3) | 150 (116.9, 199.3) | 0.249 | 0.883 | ||
| BNT | 14.25 (1.044) | 14.14 (1.217) | 14.20 (1.063) | 0.185 | 0.832 | ||
| VFT | 15.33 (4.388) | 14.28 (4.906) | 14.95 (4.785) | 0.990 | 0.373 | ||
| SDMT | 29.5 (22, 36) | 29 (20, 34) | 26 (15, 33) | 8.765 | 0.012b | ||
| CTT-A | 93.2 (66.0, 131.6) | 92.1 (68.3, 136.6) | 94.2 (70.3, 125.1) | 0.343 | 0.842 | ||
b: Con vs. CSVD-MCI; c: CSVD-NMCI vs. CSVD-MCI; Covariance: Age, gender, education level, and vascular risk factors. IQR, interquartile range; BMI, body mass index; MoCA, Montreal Cognitive Assessment; AVLT, Auditory Verbal Learning Test; ROCF, Rey-Osterrieth Complex Figure Test; DS, Digit Span; CDT, Clock Drawing Test; SCWT-C-B, Stroop Color-Word Test; CTT-B, Color Trails Test Part B; BNT, Boston Naming Test; VFT, Verbal Fluency Test; SDMT, Symbol Digit Modalities Test; CTT-A, Color Trails Test Part A.
No significant differences were detected between CSVD-NMCI and CSVD-MCI groups in total CSVD burden, imaging features, or brain volume normalized to intracranial volume (Table 2).
| CSVD-NMCI (N = 93) | CSVD-MCI (N = 111) | p-value | |||
| Total CSVD Burden | 0.221 | ||||
| Grade 1, n (%) | 61 (65.6) | 84 (75.7) | |||
| Grade 2, n (%) | 22 (23.7) | 14 (12.6) | |||
| Grade 3, n (%) | 9 (9.7) | 11 (9.9) | |||
| Grade 4, n (%) | 1 (1.1) | 2 (1.8) | |||
| Cerebrovascular lesions | |||||
| Fazekas classification | 0.187 | ||||
| WMH Fazekas 0–1, n (%) | 12 (12.9) | 22 (19.8) | |||
| WMH Fazekas 2–3, n (%) | 81 (87.1) | 89 (80.2) | |||
| Lacunes occurrence, n (%) | 28 (30.1) | 33 (29.7) | 0.953 | ||
| CMBs occurrence, n (%) | 16 (17.2) | 21 (18.9) | 0.752 | ||
| EPVS occurrence, n (%) | 11 (11.8) | 10 (9.0) | 0.509 | ||
| Neuroimaging measures | |||||
| Total GMV, mean (SD) | 32.66 (2.21) | 32.25 (1.63) | 0.130 | ||
| Total WMV, mean (SD) | 26.33 (2.95) | 26.55 (2.30) | 0.550 | ||
| Total WMHV, mean (SD) | 3.75 (1.20) | 3.45 (1.18) | 0.074 | ||
Covariance: Age, gender, education level, and vascular risk factors. WMH, white matter hyperintensities; CMBs, cerebral microbleeds; EPVS, enlarged perivascular spaces; GMV, gray matter volume; WMV, white matter volume; WMHV, white matter hyperintensity volume.
All three groups demonstrated small-world organization in both structural and
functional networks (
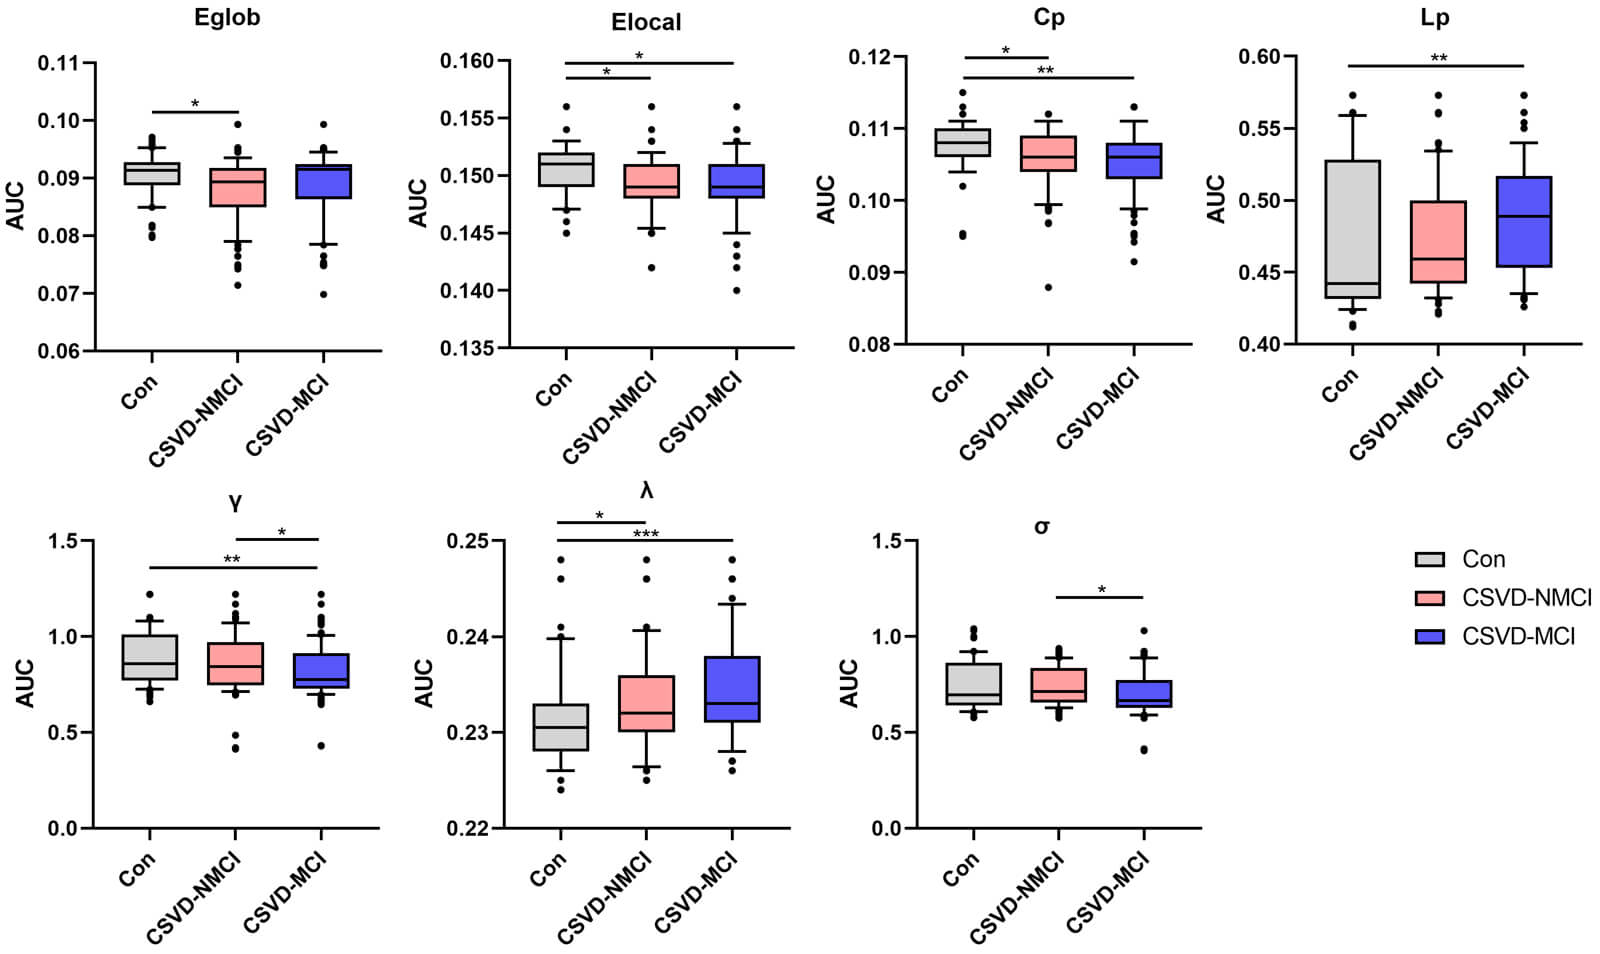 Fig. 3.
Group differences in global white-matter network
metrics, evaluated using AUC values. Statistical comparisons were conducted with
the Dunn test, with significance set at p
Within the functional network, individuals in the CSVD-MCI group showed higher
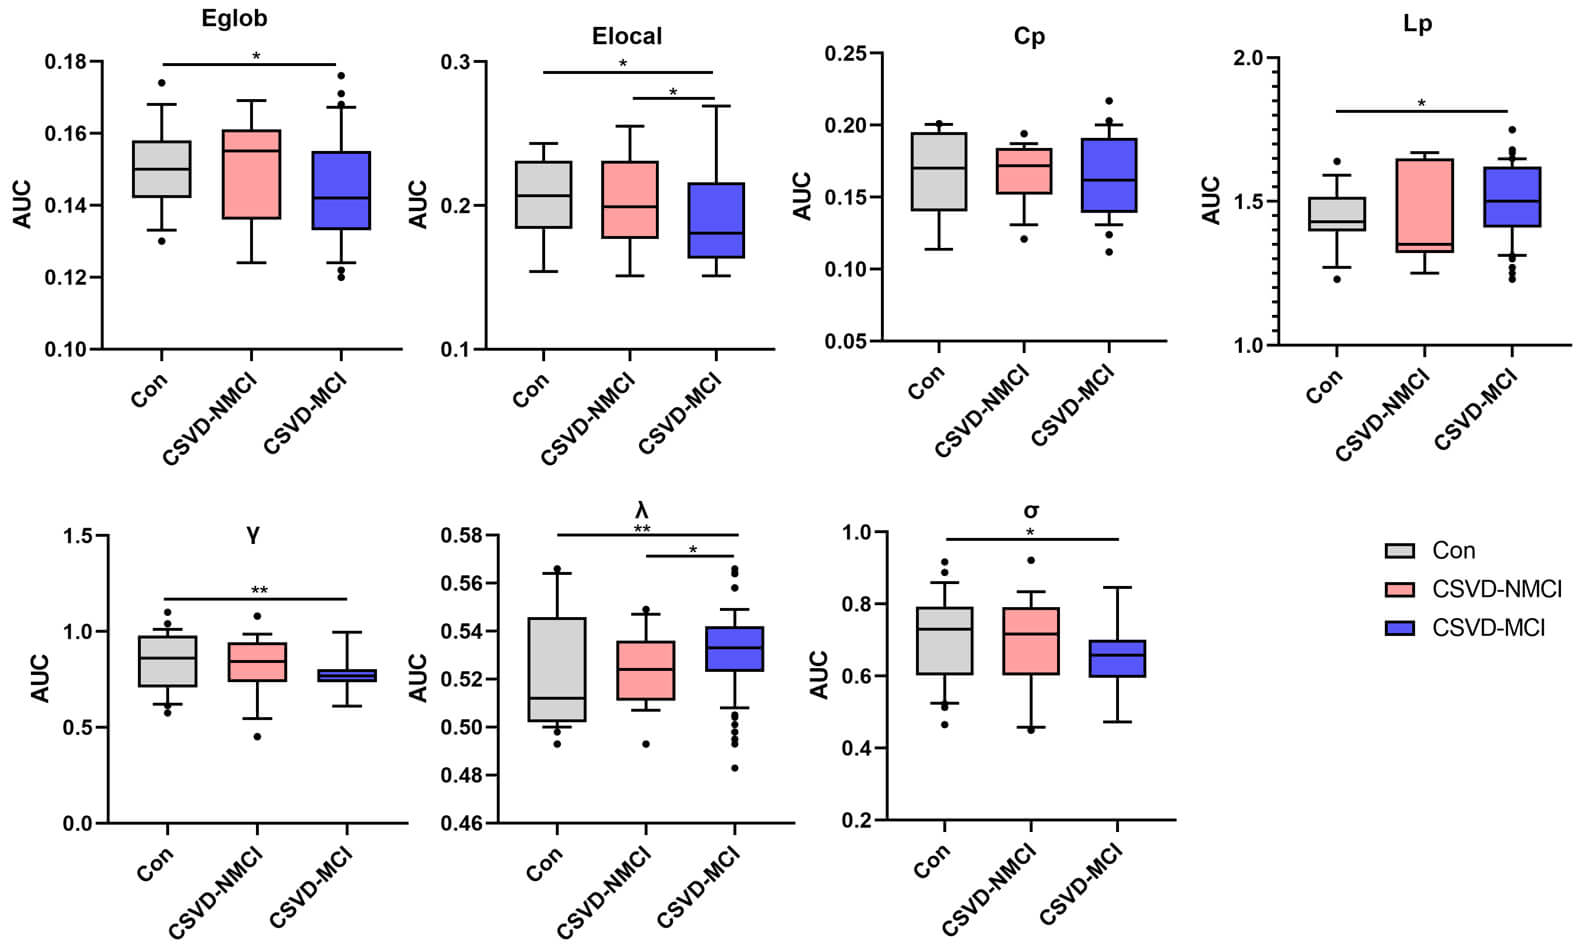 Fig. 4.
Comparison of global parameters of functional networks among
groups was performed using AUC values. Group differences were assessed using
Dunn test, with p
In the structural network analysis, patients with CSVD-MCI showed markedly reduced centrality in the left superior temporal gyrus (STG.L), a lower node degree in the left middle frontal gyrus (MFG.L), right postcentral gyrus (PoCG.R), and left precentral gyrus (PCG.L), as well as diminished node efficiency in the MFG.L and both hippocampi (HIP.L, HIP.R), compared with controls. Compared with the CSVD-NMCI group, individuals in the CSVD-MCI group showed a lower node degree in the left anterior cingulate gyrus (ACG.L) and decreased nodal efficiency in the MFG.L (Fig. 5A; Supplementary Table 3).
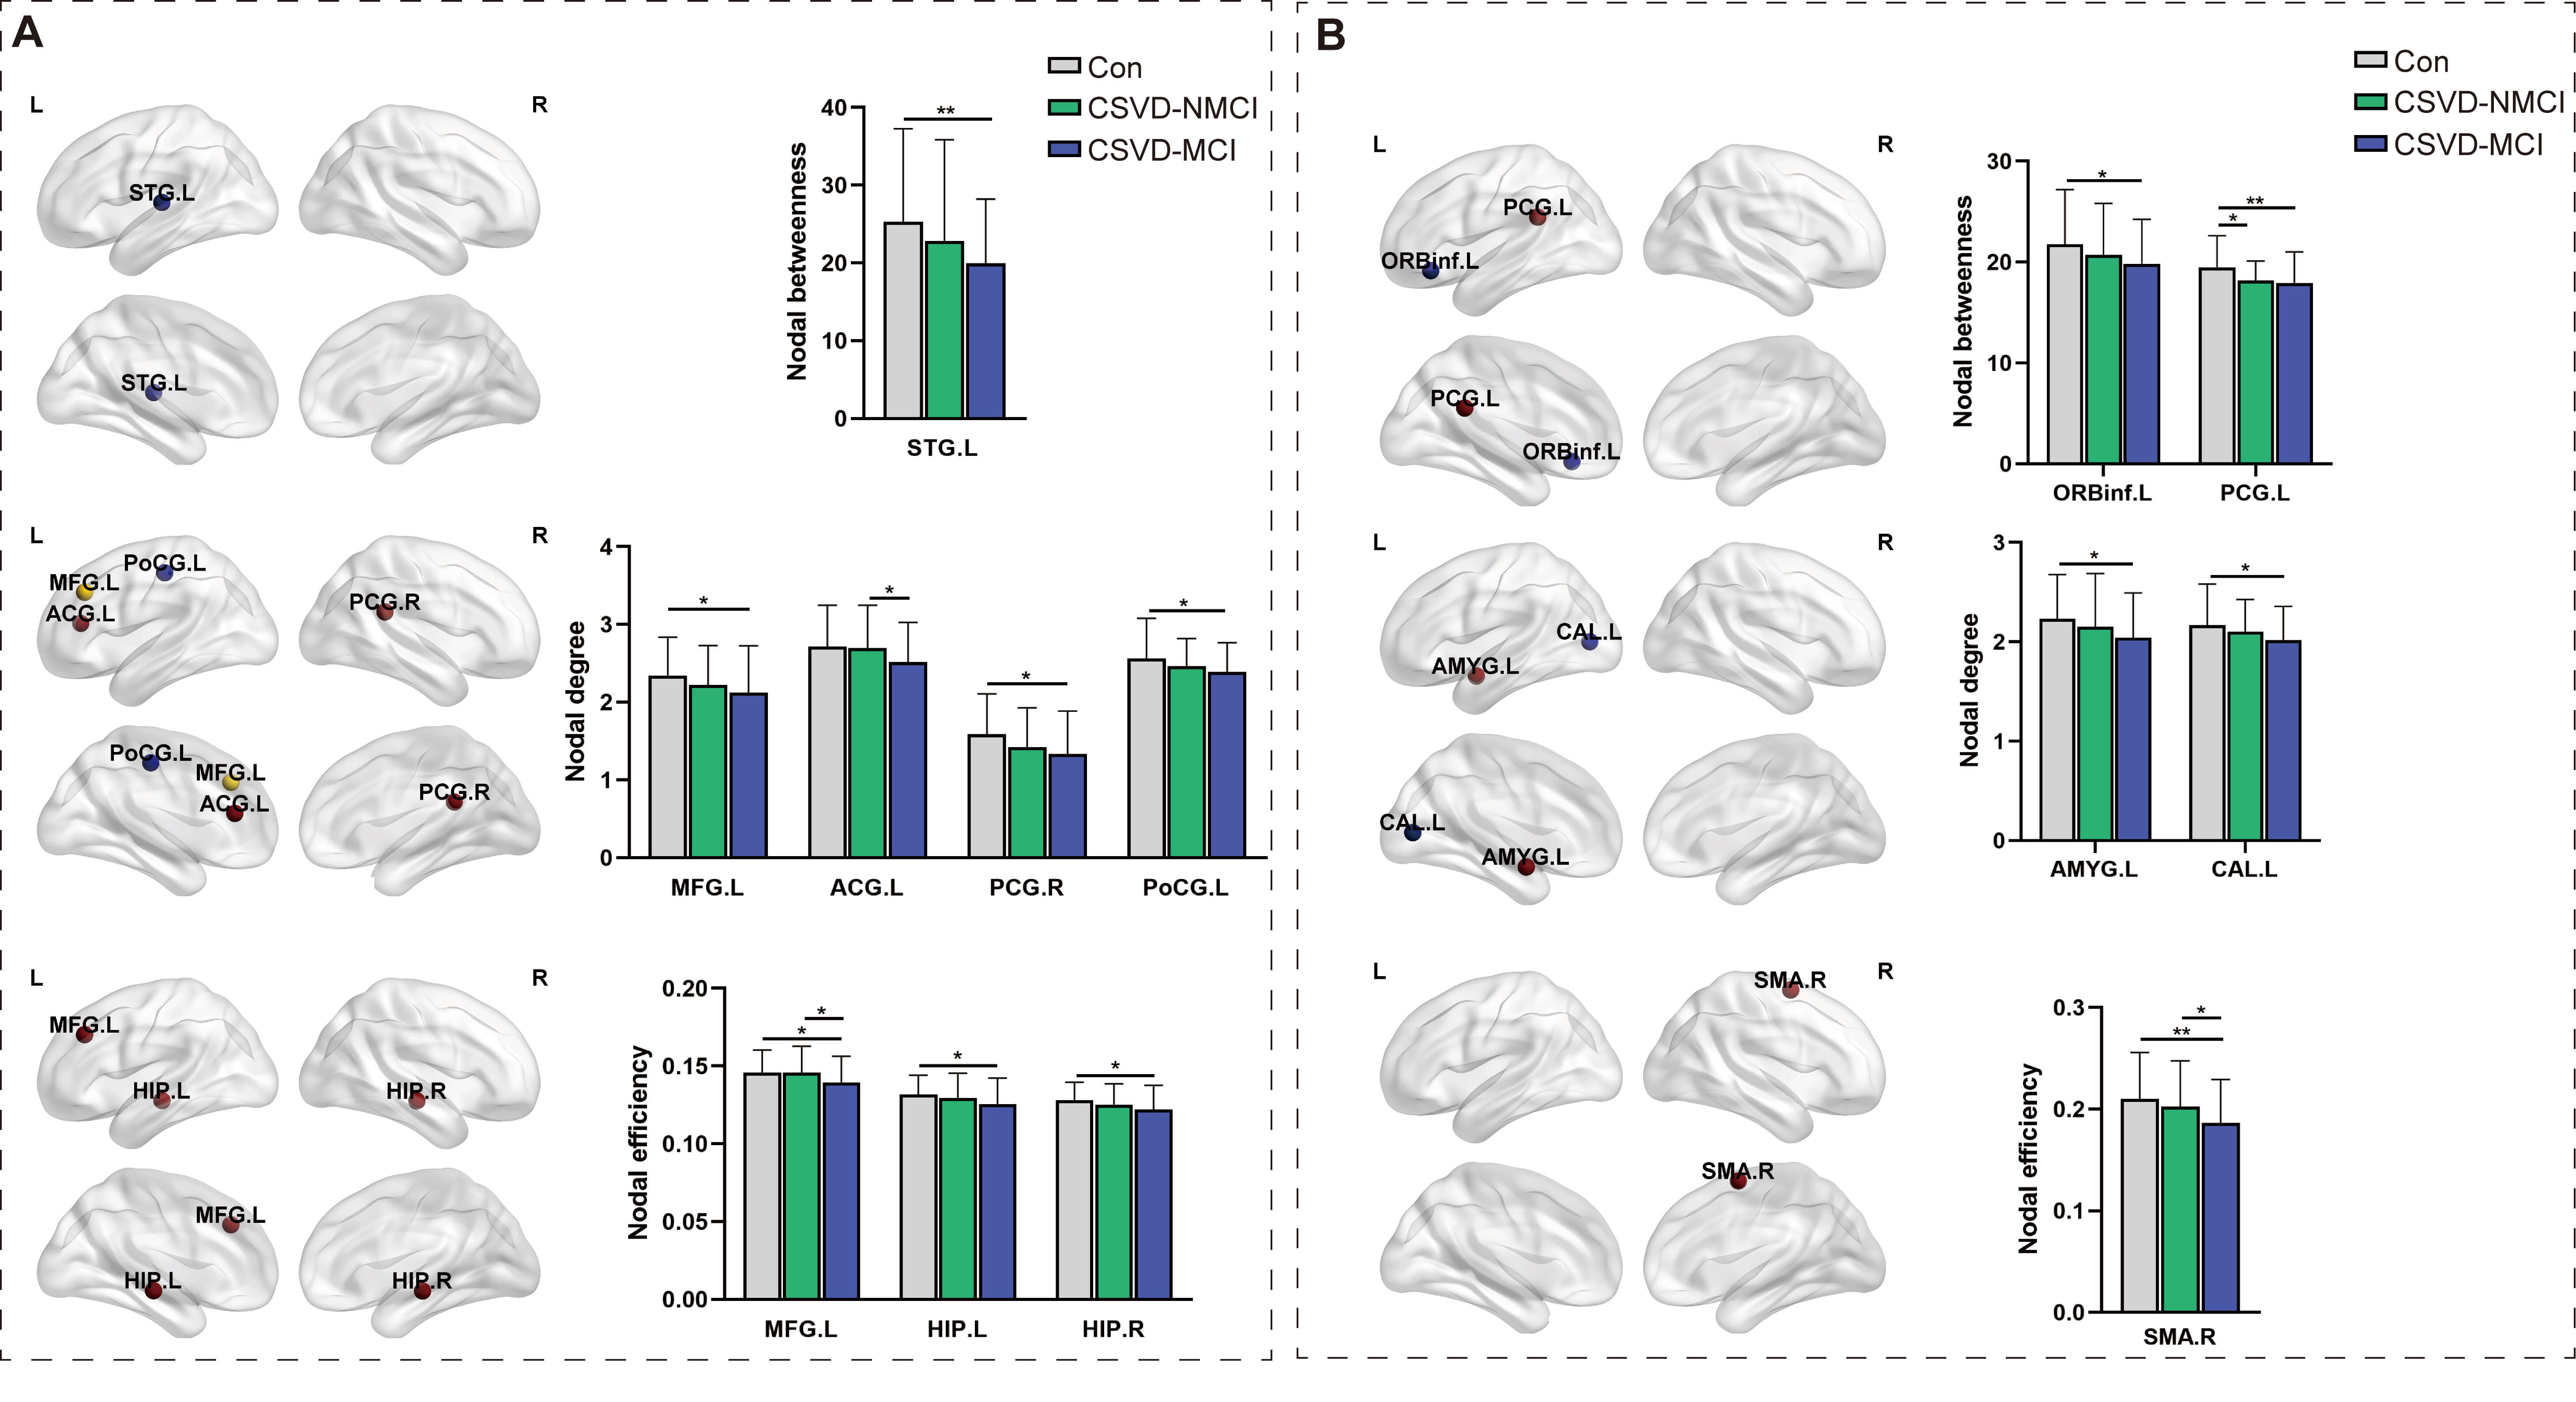 Fig. 5.
Comparison of node-level network metrics across groups. (A)
Structural network. (B) Functional network. STG.L, left superior temporal gyrus;
MFG.L, left middle frontal gyrus; ACG.L, left anterior cingulate gyrus; AMYG.L,
left amygdala; CAL.L, left calcarine gyrus; SMA.R, right supplementary motor
area; PCG.L, left precentral gyrus; PCG.R, right precentral gyrus; PoCG.L, left
postcentral gyrus; HIP.L, left hippocampus; HIP.R, right hippocampus; ORBinf.L,
left inferior orbitofrontal gyrus. *p
Within the functional network, the CSVD-NMCI group exhibited lower centrality in the PCG.L compared with controls. The CSVD-MCI group, relative to controls, showed reduced centrality in the left inferior orbitofrontal gyrus (ORBinf.L) and PCG.L, decreased node degree in the left amygdala (AMYG.L) and left calcarine gyrus (CAL.L), and diminished nodal efficiency in the right supplementary motor area (SMA.R). Compared with the CSVD-NMCI group, the CSVD-MCI group demonstrated further reduction in nodal efficiency of the SMA.R (Fig. 5B; Supplementary Table 3).
Intra-network FC of the DMN and DAN was significantly lower in the CSVD-MCI
group compared with controls. Controls also exhibited stronger FC in these
networks than the CSVD-NMCI group (p
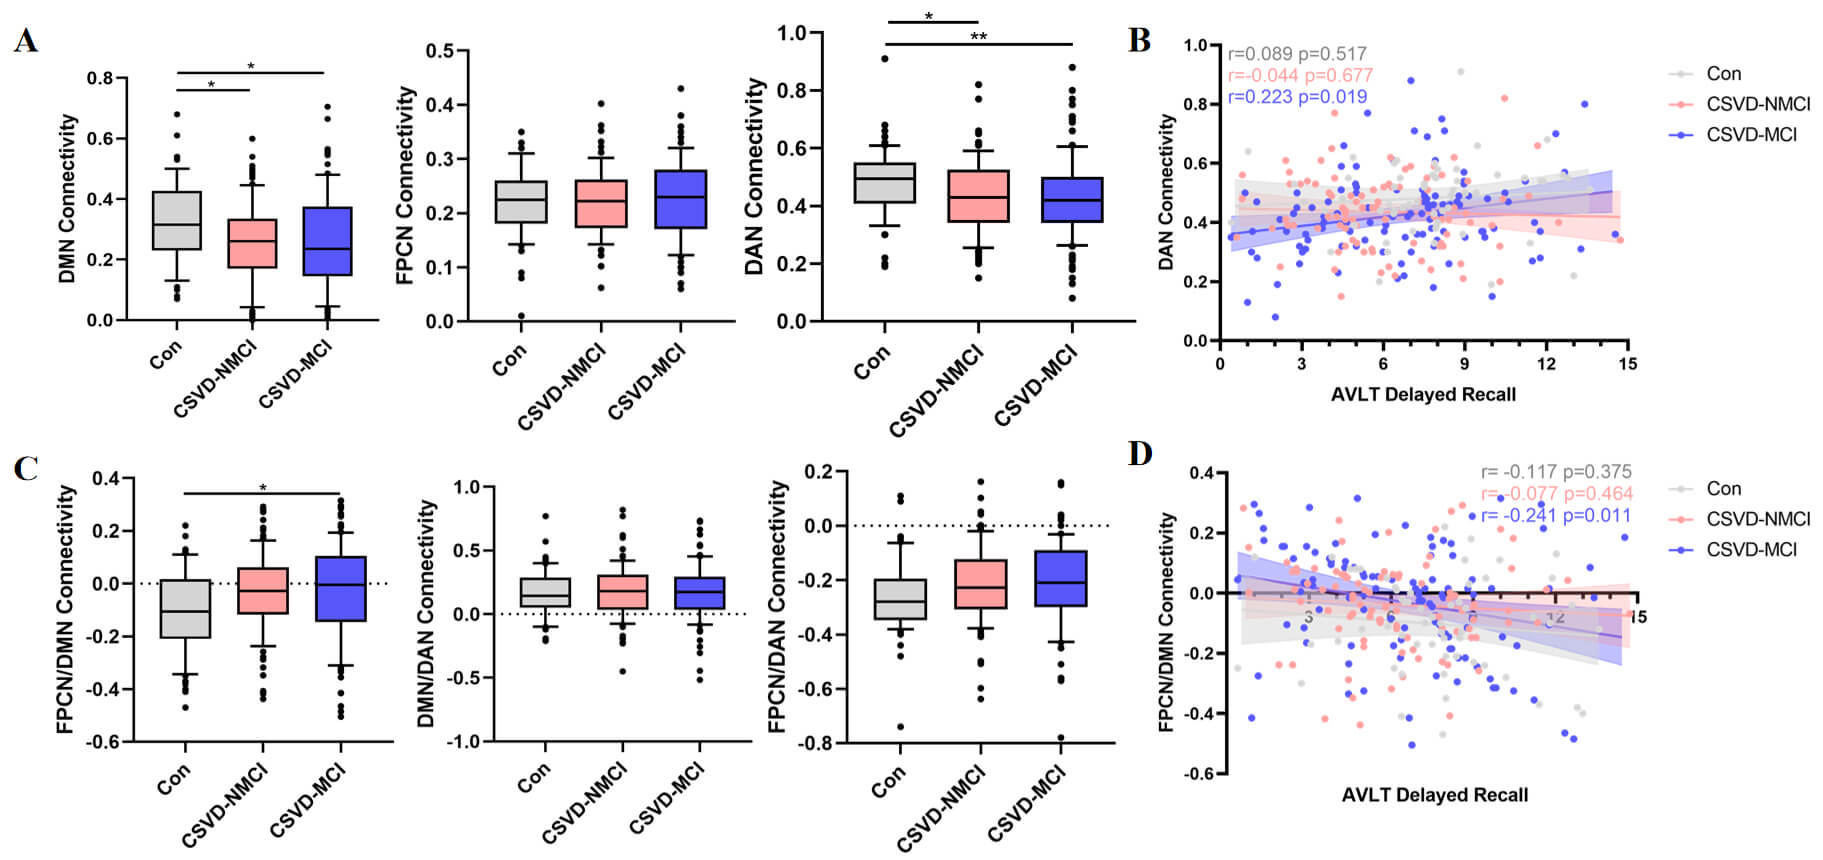 Fig. 6.
Comparison of functional networks between intra network and
inter network. (A) Differences in FC intra-network among groups. (B) Correlation
between AVLT scores and intra-network connectivity measures. (C) Differences in
FC inter-network among groups. (D) Correlation between AVLT scores and
inter-network connectivity measures. FC, functional connectivity; DMN, default
mode network; FPCN, frontoparietal control network; DAN, dorsal attention
network. *p
Regarding inter-network connectivity, functional coupling between the FPCN and
DMN was significantly elevated in the CSVD-MCI group compared with controls
(p
Rich-club connectivity showed significant intergroup differences (ANCOVA,
p
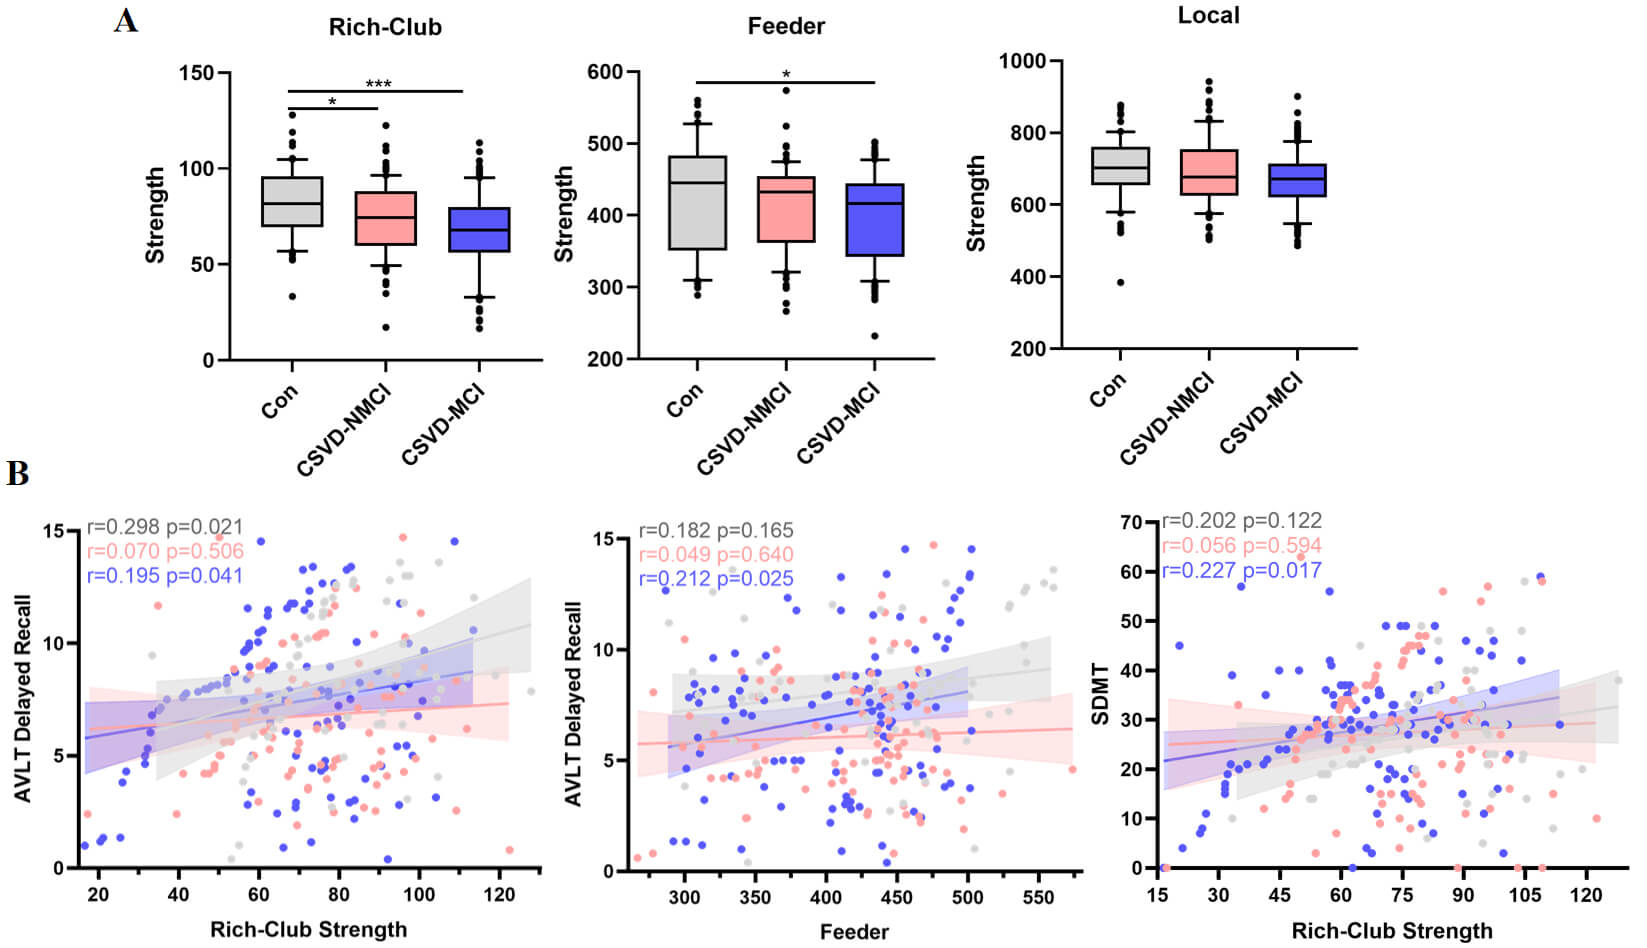 Fig. 7.
Comparison of rich-hub organization in the structural network.
(A) Group differences in the strength of rich-club, feeder, and local pathways.
(B) Associations between these connectivity metrics and cognitive performance.
Each dot reflects one participant. The solid line represents the regression fit,
and the shaded band denotes the 95% confidence interval. Partial correlation
coefficients (r) and corresponding p-values are provided
(FDR-corrected). FDR, false discovery rate. *p
We evaluated the associations between connectivity strength and cognitive
performance separately within the control, CSVD-NMCI, and CSVD-MCI groups. For
the AVLT, rich-club connection strength correlated with performance in both the
control and CSVD-MCI groups, while feeder connection strength was significantly
related to AVLT in CSVD-MCI. In the SDMT, only rich-club strength in CSVD-MCI
showed a significant association (Fig. 7B; false discovery rate [FDR]-corrected
p
Significant group differences were observed in SC-FC coupling across all connections (F = 6.165, p = 0.002), rich-club connections (F = 3.496, p = 0.032) (ANCOVA, controlling for age, sex, education and vascular risk factors; Bonferroni correction applied), and feeder connections (z = 7.975, p = 0.019) (Dunn test, Bonferroni correction applied).
SC-FC coupling was elevated in the CSVD-MCI group relative to controls (ANCOVA,
p = 0.002). In addition, SC-FC coupling was significantly increased for
rich-club connections (ANCOVA, control vs. CSVD-MCI: p
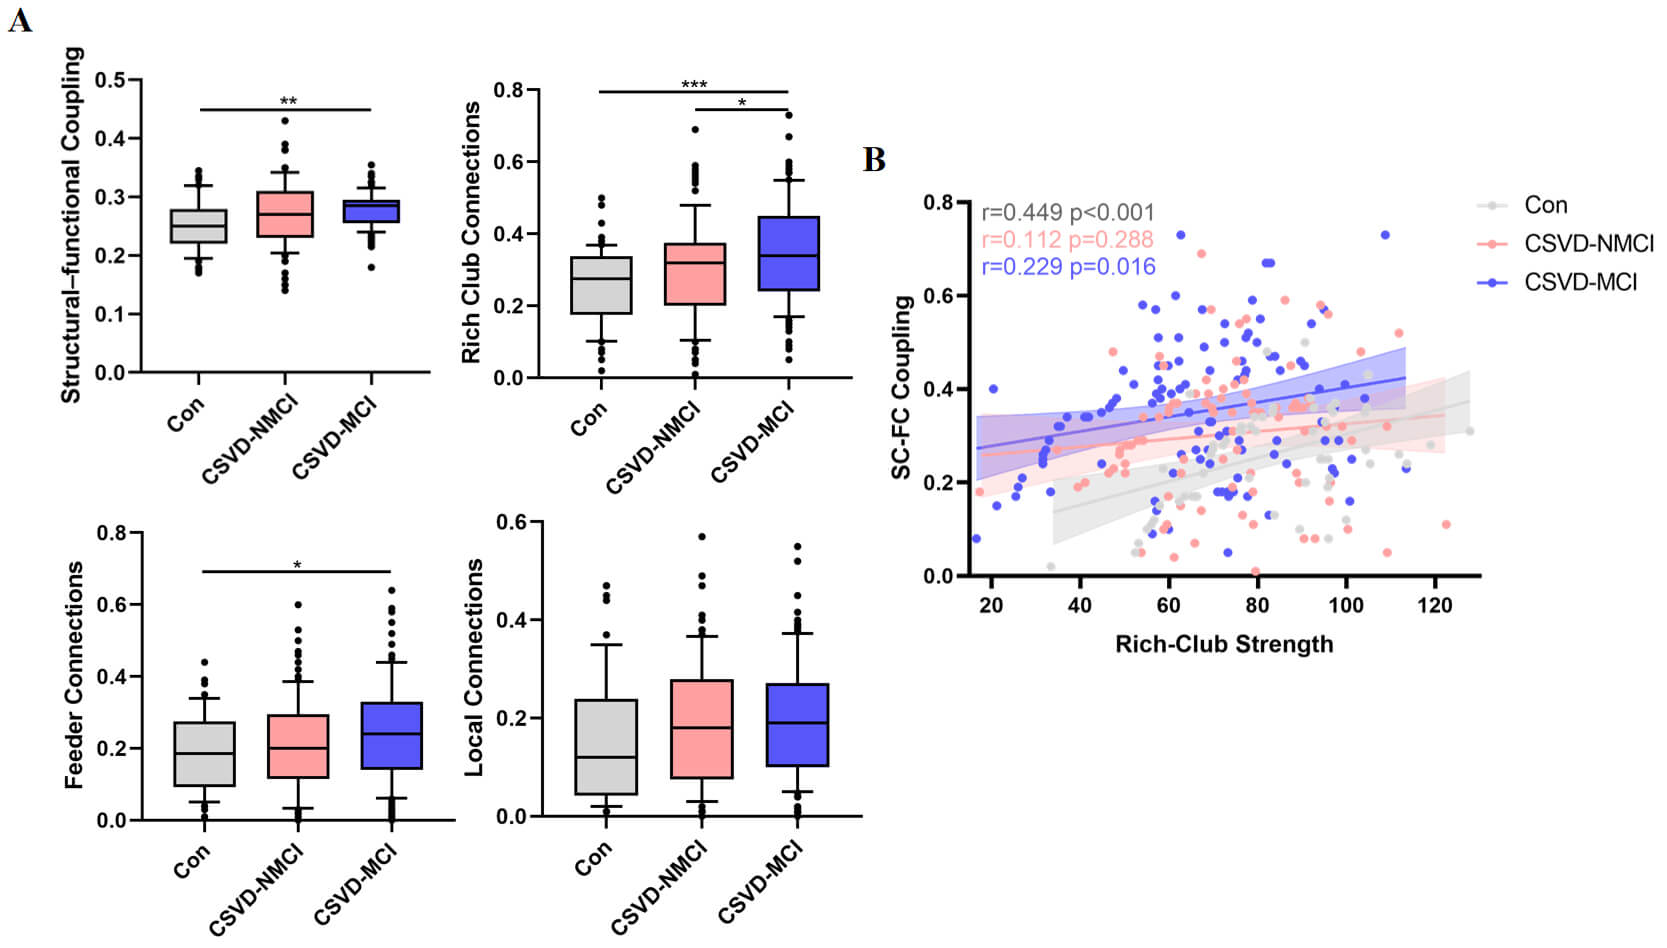 Fig. 8.
Comparison of SC-FC coupling. (A) SC-FC coupling levels across
the control, CSVD-NMCI, and CSVD-MCI groups. (B) Associations between SC-FC
coupling and rich-club connectivity indices (*p
After adjusting for age, sex, and education, partial correlation analysis showed
that SC-FC coupling was positively related to rich-club connection strength in
both the control group (r = 0.449, p
Our results suggest that, although structural and functional networks retain
small-world properties, CSVD—particularly when accompanied by MCI—is
associated with a shift toward less optimal network organization. Reduced
Patients with CSVD-NMCI showed relatively preserved small-world indices and efficiency, suggesting that large-scale network architecture may remain intact during the early CSVD stages. In contrast, CSVD-MCI patients displayed more pronounced declines in both structural and functional integration, in line with more advanced white-matter injury and altered synchrony of neural activity. Tract-based analyses further showed a stepwise decrease in white-matter fiber density from controls to CSVD-NMCI to CSVD-MCI (Supplementary Fig. 1). These results are in agreement with longitudinal data indicating that alterations in structural network organization in CSVD may precede and predict subsequent cognitive deterioration or transition to dementia [47]. These findings highlight the importance of detecting brain network disruption early in the course of the disease.
Our study found that FC within the DMN and DAN was significantly reduced in CSVD-MCI patients. Reduced connectivity between the FPCN and DMN was also observed, which was significantly correlated with AVLT performance. The DAN supports attention to external stimuli [48], whereas the DMN plays a key role in episodic memory [49]. The FPCN appears to function as a bridge, coordinating with both the DMN and DAN to facilitate goal-directed cognitive processes [50]. In this context, reduced intra-network connectivity in DMN and DAN, combined with increased FPCN-DMN coupling that was negatively associated with memory performance, may reflect a maladaptive reorganization in which additional control resources are recruited but fail to fully compensate for underlying damage. Even though overall CSVD burden scores were comparable between the CSVD-NMCI and CSVD-MCI groups, selective damage to periventricular and deep frontal white-matter pathways linked to the FPCN and DMN may underlie the reduced network efficiency and associated impairments in memory.
Rich-club brain regions consist of highly interconnected nodes that support efficient communication within the network [51]. The superior frontal gyrus, middle frontal gyrus, hippocampus, thalamus, and putamen have been consistently identified as rich-club nodes [52]. Due to their central role in network topology, connections among these rich-club nodes are essential for integrating information across distant brain regions [53]. Damage to rich-club connections has a greater impact on global network efficiency than random network disruptions [3]. In our CSVD-MCI cohort, rich-club connections showed the greatest reduction in strength, whereas feeder and local connections were relatively less affected. Simultaneously, SC-FC coupling involving rich-club and feeder connections was increased, suggesting a heightened dependence on residual structural pathways to maintain functional coherence. These findings align with previous research [3, 10, 54, 55, 56] indicating that disruption of rich-club hubs and their feeder pathways contributes disproportionately to network inefficiency and cognitive decline in CSVD.
SC-FC coupling is increasingly regarded as a sensitive indicator of the interplay between brain structure and function. Reduced SC-FC coupling has been described in several conditions—including stroke, epilepsy, and Alzheimer’s disease—indicating disconnection between anatomy and function [13, 14, 55, 57]. In contrast, in the present study, CSVD-MCI patients exhibited significantly increased SC-FC coupling compared with controls. One possible explanation is that this increase represents a maladaptive or over-compensatory response to underlying network disruption. Elevated SC-FC coupling may reflect excessive reliance on structurally preserved pathways to maintain function, potentially reducing network flexibility and adaptability [55]. These findings suggest that higher SC-FC coupling does not necessarily indicate optimal network function, particularly in pathological conditions.
Binswanger’s disease (subcortical ischemic vascular disease of the Binswanger type) provides an example of CSVD in which extensive white-matter rarefaction and subcortical infarcts are tightly linked to progressive cognitive impairment [58, 59]. Although white matter hyperintensities remain the hallmark imaging finding in CSVD, cognitive dysfunction frequently coexists with other MRI markers—including silent lacunar infarcts, cerebral microbleeds, enlarged perivascular spaces, and global or regional brain atrophy—all contributing to the heterogeneous clinical presentation [60]. Therefore, future research should focus on delineating specific neuroimaging subgroups in CSVD, and on exploring how the combination of these imaging markers and lesion topography affects network connectivity, cognitive outcomes, and disease trajectories. This work will help clarify the multifactorial mechanisms of CSVD and support the development of more precise diagnostic and therapeutic strategies.
This study has several limitations. First, its cross-sectional design precludes causal inference and limits the ability to observe how network organization evolves as CSVD progresses from early asymptomatic stages to mild cognitive impairment and later phases. Longitudinal studies are therefore warranted to delineate the temporal trajectory of structural and functional network alterations. Second, more advanced methods, such as partial correlation or machine learning—based coupling analyses, may provide a more comprehensive characterization of network interactions. Third, although neuroimaging provides valuable insights into macroscopic brain organization, it does not capture the underlying molecular or cellular mechanisms of CSVD. Integrating neuroimaging with multi-omics approaches (e.g., genomics, proteomics, metabolomics) may help elucidate the biological basis of network alterations and cognitive decline. Future work should systematically characterize these subtypes to better understand their distribution and clinical relevance.
In conclusion, elderly patients with CSVD, particularly those with MCI, show impaired efficiency and integrity of both structural and functional networks related to cognition. These alterations manifest as slower and less efficient information transfer, reduced robustness, and diminished neural processing resources. Changes in FC within and between the FPCN, DMN, and DAN likely represent a mixture of compensatory and maladaptive reorganization in response to small-vessel-related damage. Disproportionate vulnerability of rich-club regions and their connecting pathways appears to play a central role in the development of cognitive impairment. Abnormal increases in SC-FC coupling, especially in rich-club-related connections, further highlight the complex restructuring of the brain’s communication in CSVD. Together, these findings provide network-based insights into how CSVD contributes to cognitive dysfunction and underscore the need for early detection and targeted interventions.
The data that support the findings of this study are available from the corresponding author upon reasonable request.
YG—Software, Validation, Writing-Original Draft. JZ—Investigation, Data Curation. WF—Data Curation, Project administration, Resources, Funding acquisition. CW—Formal analysis. YY—Data Curation, Project administration. XW—Methodology, Writing-Review & Editing. XL—Conceptualization, Resources, Writing-Review & Editing, Supervision, Funding acquisition. All authors contributed to editorial changes in the manuscript. All authors read and approved the final manuscript. All authors have participated sufficiently in the work and agreed to be accountable for all aspects of the work.
Ethical approval was granted by the ethics committee of The Second Hospital of Tianjin Medical University, KY2020K183. All legal guardians or appropriate representatives of the participants have provided informed consent form on their behalf. All methods involving human participants were performed in accordance with the ethical standards of the institutional research committee and the 1964 Helsinki declaration and its later amendments or comparable ethical standards.
We acknowledge the hard work and dedication of all non-author staff involved in implementing the study’s intervention and evaluation components.
This work was sponsored by the Tianjin scientific and technological project (25JCQNJC00780), the National Natural Science Foundation of China (42275197) and the Key Discipline of Geriatric Medicine in Tianjin (TJYXZDXK-3-017C).
The authors declare no conflict of interest.
Supplementary material associated with this article can be found, in the online version, at https://doi.org/10.31083/JIN47508.
References
Publisher’s Note: IMR Press stays neutral with regard to jurisdictional claims in published maps and institutional affiliations.