


1 School of Medicine, Henan Polytechnic University, 454000 Jiaozuo, Henan, China
2 Jiaozuo Key Laboratory for Huaiyao Comprehensive Development, Henan Polytechnic University, 454000 Jiaozuo, Henan, China
Abstract
Epilepsy is a complex neurological disorder marked by recurrent, unprovoked seizures. Ferroptosis is characterized by the accumulation of oxidative stress and is associated with the occurrence and development of epilepsy. Tauroursodeoxycholic acid (TUDCA), a hydrophilic bile acid, has demonstrated neuroprotective properties in various neurodegenerative conditions. In this study, we examined the antiepileptic efficacy of TUDCA and sought to elucidate its underlying mechanisms of action.
The antiepileptic effects of TUDCA were evaluated using electroencephalogram recordings, behavioral testing, and immunohistochemistry in a Lithium chloride (LiCl)- Pilocarpine (Pilo)-induced epilepsy rat model, alongside a glutamate-induced neuronal cell model. Neuronal ferroptosis was assessed through western blotting and immunofluorescence.
In vivo, TUDCA significantly alleviated both seizure severity and neuronal damage by inhibiting oxidative stress and ferroptosis. In vitro, TUDCA similarly exerted neuroprotective effects and effectively suppressed neuronal ferroptosis.
TUDCA mitigates epilepsy through the suppression of ferroptosis, suggesting its potential as a therapeutic agent for epilepsy treatment.
Graphical Abstract
Keywords
- epilepsy
- TUDCA
- neuroprotection
- ferroptosis
Epilepsy (EPY) is a chronic neurological condition characterized by recurrent spontaneous seizures, neuronal injury, and alterations in behavior and electroencephalographic activity [1]. It is estimated that approximately 70 million individuals worldwide suffer from epilepsy, with around 10 million cases in China [2, 3]. Current treatments, including surgery and antiepileptic drugs, prevent seizures in up to 70% of patients [4]. However, approximately 30% of epilepsy patients develop drug resistance [5]. Therefore, there is an urgent requirement to create new antiepileptic medications and carry out a more thorough investigation into the molecular mechanisms involved.
The pathogenesis of epilepsy is multifactorial, with an established link to an imbalance between excitation and inhibition within the central nervous system, potentially involving ion channels, neuronal loss, and glial cell changes (e.g., astrocyte activation, microglial proliferation, morphological changes) [6, 7, 8, 9]. Moreover, neuronal death has been implicated in seizure activity [10]. As such, targeting neuronal death through neuroprotective strategies presents promising prospects for the treatment of neurological disorders [11].
Recent studies suggest that ferroptosis plays a role in the onset and progression of epilepsy [12, 13]. Ferroptosis is a novel form of iron-dependent, programmed cell death first proposed in 2012, characterized by the abnormal accumulation of lipid reactive oxygen species. It is distinct from other forms of regulated cell death, such as apoptosis, necrosis, and autophagy [14]. Emerging evidence has linked ferroptosis to the pathology of various conditions, including cancer, ischemia/reperfusion injuries, and neurological diseases, positioning it as a potential therapeutic target for neurological disorders [15, 16]. The brain is particularly susceptible to oxidative stress, and excessive oxidative stress can lead to lipid peroxidation, epileptic activity, and neuronal death [17]. Furthermore, studies have demonstrated that oxidative stress, aberrant glutamate levels, and metabolic imbalances contribute to the ferroptosis mechanism in epilepsy, underscoring its close association with the disorder [18, 19]. Glutathione peroxidase 4 (GPX4) is a protein that protects cells from lipid peroxidation and is a key protein involved in regulating ferroptosis [20]. Notably, a study has indicated that deleting GPX4 (a key regulator of ferroptosis) increases an organism’s susceptibility to epilepsy [21]. This research corroborates the downregulation of GPX4 in epileptic rats. These findings suggest that inhibiting ferroptosis could offer novel therapeutic avenues for epilepsy treatment.
Tauroursodeoxycholic acid (TUDCA), a bile acid found in bear bile, is naturally synthesized in the liver from taurine and ursodeoxycholic acid (UDCA). Clinically, TUDCA has been proven effective in treating cholestatic liver diseases [22, 23]. Additionally, TUDCA exhibits neuroprotective properties in several disease models, including Alzheimer’s, Parkinson’s, and Huntington’s disease [24, 25]. Previous study has shown that TUDCA can improve epileptic seizures [26], but the specific mechanism of action remains unclear. Furthermore, TUDCA is an inhibitor of endoplasmic reticulum stress. Therefore, we hypothesize that TUDCA may improve epileptic seizures by regulating oxidative stress and ferroptosis.
The neuroprotective effect of TUDCA on epileptic rats was investigated through electroencephalogram (EEG) recording, behavioral scoring, pathological section staining, and immunohistochemical analysis. In addition, immunofluorescence, immunohistochemistry, and Western blot assays were used to detect indicators related to oxidative stress and ferroptosis (e.g., heme oxygenase-1 (HO-1), superoxide dismutase 1 (SOD1), nuclear factor erythroid 2-related factor 2 (NRF2), GPX4), so as to further explore the potential mechanism underlying the neuroprotective effect of TUDCA. In vitro experiments further verified the neuroprotective effect of TUDCA on neuronal cells and its potential mechanism through detecting the expressions of reactive oxygen species (ROS), NRF2, and GPX4 through immunofluorescence and Western blot, providing a new approach for the development of anti-epileptic therapies.
TUDCA (35807-85-3, Macklin, Shanghai, China), Atropine sulfate (55-48-1, Macklin), Glutamate (Glu) (28829-38-1, Macklin), Lithium chloride (LiCl) (7447-41-8, Macklin), and Pilocarpine (Pilo) (92-13-7, Macklin) were used in this study.
Male SD rats (200–250 g) were obtained from Beijing Vital River Laboratory Animal Technology Co., Ltd. (Beijing, China). All rats were raised in a standard environment with a temperature of 22 °C and a relative humidity of 50%. The experimental animals were allowed to freely access food and water. LiCl-Pilo-induced epilepsy rat models were employed as the in vivo model. Rats were randomly assigned to three groups: (1) the control group (n = 6), receiving an intraperitoneal (i.p.) injection of PBS; (2) the Pilo group (n = 6), receiving an i.p. injection of 35 mg/kg Pilo; (3) the TUDCA + Pilo group (n = 6), in which rats were pretreated with TUDCA (50 mg/kg) for 3 days, and then were intraperitoneally injected with LiCl and Pilo. The seizure model was induced by an i.p. injection of 125 mg/kg LiCl, followed by an i.p. injection of 35 mg/kg Pilo 19 hours later. To mitigate peripheral cholinomimetic effects, rats were pretreated with 1 mg/kg atropine sulfate i.p. 30 minutes before Pilo injection. Seizure activity was monitored, and the onset of status epilepticus (SE) was recorded when seizures reached stage 4. One hour post-SE onset, diazepam (10 mg/kg, H23021885, HAPHARM, Harbin, Heilongjiang, China) was administered to terminate seizures. Control animals received saline injections in place of LiCl and Pilo.
Two groups of SD rats (n = 6 per group) were deeply anesthetized with pentobarbital (30 mg/kg, P3761, Sigma-Aldrich, St. Louis, MO, USA), then fixed in a prone position on a stereotaxic instrument to secure their heads. A surgical scissor was used to incise the skin and expose the skull. The electrode implantation site was determined based on the following coordinates: –3.8 mm posterior to bregma, 3.5 mm lateral to the midline, and 3.8 mm below the dura. A skull drill was used to make holes around the electrodes, and screws were implanted to fix the electrodes. After a one-week postoperative recovery period, EEG recording was performed. The software was opened, and EEG recording parameters were set: a sampling rate of 10 kHz, a high-pass filter of 1.0 Hz, and a low-pass filter of 1 kHz. Data analysis was conducted using NeuroExplorer software (Version 5, Blackrock Microsystems, Salt Lake City, UT, USA). After EEG recording, SD rats were euthanized by gradual exposure to compressed carbon dioxide (CO2) in a sealed chamber. Death was confirmed by absence of spontaneous breathing, cardiac arrest (verified by thoracic palpation), and fixed dilated pupils.
For 60 minutes after administration of the LiCl-Pilo injection, behavioral alterations were monitored in epileptic rats. Seizure manifestations were evaluated based on the classification criteria established by Racine [27], with seizure stages defined as follows: stage 0, absence of any visible reaction; stage 1, diminished or fixed head movement, accompanied by rhythmic twitching of the face and whiskers; stage 2, myoclonic jerks (MJs), head bobbing; stage 3, myoclonic movements and spasms involving multiple limbs; stage 4, uncontrolled rearing and followed by falling; stage 5, generalized tonic‒clonic seizures; stage 6, death.
Primary hippocampal neurons were isolated from newborn SD rats using a modified method as described by Pei et al. [28]. Briefly, newborn SD rats were rendered unconscious via hypothermic anesthesia (4 °C for 5 min), followed by immediate decapitation, 0.125% trypsin (BL512B, Biosharp, Hefei, Anhui, China) was used to incubate hippocampal tissue at 37 °C for 15 minutes, with gentle shaking performed every 5 minutes. Neurons were then plated on poly-L-lysine (BS198, Biosharp) coated 24-well or 6-well plates and cultured in Neurobasal medium (T720KJ, BasalMedia, Shanghai, China) supplemented with 2% B27 (S440J7, BasalMedia), 0.5 mM glutamine, and 1% penicillin-streptomycin solution (BL505A, Biosharp). The culture medium was half-replaced twice a week. All primary cells were validated for their identity by surface marker analysis and tested negative for mycoplasma. This protocol adheres to the AVMA Guidelines for the Euthanasia of Animals (2020).
HT22 hippocampal neuronal cells (CL-0697, Procell System, Wuhan, China) were cultured in DMEM medium (L110KJ, BasalMedia) supplemented with 10% fetal bovine serum (FBS, A5256701, Gibco, São Paulo, Brazil), 1% penicillin-streptomycin (BL505A, Biosharp). Cells were cultured in a humidified atmosphere containing 5% CO2 at 37 °C. All cell lines were authenticated via autosomal short tandem repeat (STR) profiling and confirmed negative for mycoplasma contamination.
Induction of an in vitro neuronal excitotoxic injury model by stimulating neuronal cells with glutamate. HT22 cells were divided into three groups: (1) the control group, cultured under normal conditions without treatment; (2) the Glu group, treated with 5 mM glutamate for 24 hours to induce neuronal excitotoxic injury; (3) the TUDCA + Glu group, pretreated with 50 µM TUDCA for 2 hours and then stimulated with 5 mM glutamate for 24 hours.
Cells were plated into 96-well plates at a volume of 100 µL per well. Post-treatment, 10 µL of CCK8 solution (MC0301-500, Kermey, Zhengzhou, Henan, China) was dispensed into each well, followed by incubation of the plate for 30–60 minutes. Cell viability was subsequently assessed with a microplate reader (SpectraMax Mini, Molecular Devices, Shanghai, China) at a wavelength of 450 nm.
Brain tissues were sectioned following standard procedures and stained with hematoxylin and eosin (H&E, Servicebio, Hubei, Wuhan, China) and toluidine blue (Nissl; Servicebio), according to the manufacturer’s instructions. Observe the tissue sections using an Olympus AH-2 optical microscope (Olympus, Tokyo, Japan). Neuronal damage was assessed at the histopathological level. For immunohistochemistry, after dewaxing and hydration, the sections were heated in sodium citrate antigen retrieval solution (BL619A, Biosharp) using the microwave heating method, heating the slides in the buffer at a high power setting (e.g., 800–1000 W) until the buffer reaches a vigorous boil. Once boiling, the power is often reduced to a medium or low setting (e.g., 20–30% power) to maintain a gentle, steady boil without causing excessive evaporation or buffer loss. Continue heating under controlled boiling conditions for 10 minutes. After natural cooling, the samples were blocked with 10% goat serum (C0265, Beyotime Biotechnology, Shanghai, China) for 1 hour at RT, and then incubated with the primary antibody at 4 °C overnight, followed by incubation with horseradish peroxidase (HRP)-conjugated secondary antibodies (1:500, E030110, E030120, EarthOx, Beijing, China) for 1 hour at RT and treated with DAB chromogenic reagent (ZLI-9019, ZSGB-BIO, Beijing, China). The primary antibodies used was anti-SOD1 (1:500, WL01846, Wanleibio, Beijing, China). Images were captured with an Olympus AH-2 light microscope and analyzed using ImageJ (v1.51, National Institutes of Health, Bethesda, MD, USA) for quantification. Regions with strong staining were selected, and the mean integrated optical density (IOD) of these areas was determined.
After dewaxing, hydration, permeabilization and antigen retrieval of brain tissue sections, they were blocked with 10% goat serum at room temperature for 1 hour. The primary antibody was incubated at 4 °C overnight, followed by incubation with the corresponding secondary antibody at room temperature for 1 hour. Finally, the nuclei were stained with 4′,6-diamidino2-phenylindole (DAPI, D9542, Sigma-Aldrich). Images were collected using a fluorescence microscope (Leica DMi8, Leica, Wetzlar, Germany). Following treatment, the cells in different groups were fixed with 4% paraformaldehyde (BL539A, Biosharp), and then permeabilized with 0.3% Triton X-100 (T8200, Solarbio, Beijing, China). After blocking with 10% goat serum, the primary antibody was incubated at 4 °C overnight. After cells were washed three times with PBS, then incubated with CY3 or DyLight 488 secondary antibodies (1:500, E031620, E032210, EarthOx) for 1 hour, and images were acquired using a Leica fluorescence microscope. The primary antibodies used included anti-NeuN (neuron-specific nuclear protein, 1:500, 26975-1-AP, Proteintech, Wuhan, Hubei, China), anti-GPX4 (1:500, 67763-1-Ig, Proteintech), anti-NRF2 (nuclear factor erythroid 2-related factor 2, 1:500, 16396-1-AP, Proteintech), and anti-HO-1/HMOX1 (heme oxygenase-1, 1:500, 10701-1-AP, Proteintech). Images were analyzed using ImageJ, and the relative fluorescence intensities of the three groups were determined.
The method of colocalization analysis is as follows: Open the merged image to be analyzed using ImageJ. Click Image - Color - Channels Tool, select “Color” in the pop-up box, and click OK. Add a scale bar to the image, then define the length and unit of the scale bar. Use the Line Tool to select the region where co-localization analysis is needed, then click Analyze - Plot Profile and check “Live”. Move the slider at the bottom of the image to the far left—at this point, the red channel will be displayed at the top of the image; save the data as a table. Next, move the slider at the bottom of the image to the middle—now the green channel will be displayed; save this data as another table. Merge the red fluorescence data and green fluorescence data into a single table. Open GraphPad (version 7, GraphPad Software, Inc., San Diego, CA, USA), create a new XY worksheet, input the merged data, select “Line Graph” as the chart type, and adjust the colors of the two lines. You will then obtain the image for co-localization analysis.
Cells and tissues were lysed using RIPA buffer (BL504A, Biosharp) that had been
supplemented with protease (BL612A, Biosharp) and phosphatase inhibitors
(BL615A, Biosharp). Protein concentrations were determined using the BCA reagent
(P0006, Beyotime Biotechnology). Equal amounts of protein were
separated by Sodium Dodecyl Sulfate Polyacrylamide Gel Electrophoresis (SDS-PAGE)
and transferred onto PVDF (IPVH00010, Millipore, Darmstadt, Germany). The
membranes were blocked with fast blocking buffer for 10 minutes at room
temperature, as described by Liu et al. [29], then incubated overnight
at 4 °C with primary antibodies followed by HRP-conjugated secondary
antibodies (1:50,000, E030110, E030120, EarthOx) for 2 hours at RT. Protein bands
were visualized using enhanced chemiluminescence (ECL, BL520B, Biosharp) and
quantified by densitometric analysis using ImageJ software. The primary
antibodies used were as follows: anti-
Cells were treated with Glu with or without TUDCA for 24 hours. After treatment, the cells were incubated with 5 µM CM-H2DCFDA (S0035S, Beyotime Biotechnology) for 30 minutes at 37 °C. ROS fluorescence images were captured under a fluorescence microscope.
All experimental data were analyzed in GraphPad Prism (version 7, GraphPad
Software, Inc., San Diego, CA, USA) and expressed as mean
To evaluate the antiepileptic effect of TUDCA, electroencephalogram signal detection and behavioral scoring experiments were conducted. The structure and dosing schedule of TUDCA, along with the Pilo-induced epilepsy rat model, are shown in Fig. 1A. Clinical scores were initially observed. As illustrated in Fig. 1D,E, TUDCA treatment significantly reduced seizure severity and prolonged seizure latency compared to the Pilo group. EEG recordings were also performed in rats after Pilo injection (Fig. 1B,C). The results revealed that the TUDCA treatment group exhibited a significant reduction in the frequency of epileptic brain electrical discharges compared to the model group. As shown in Fig. 1F, we can confirm that TUDCA can significantly prevent epileptic seizures. These results confirm the successful induction of epilepsy in the rats and demonstrate that TUDCA can alleviate the severity of epilepsy.
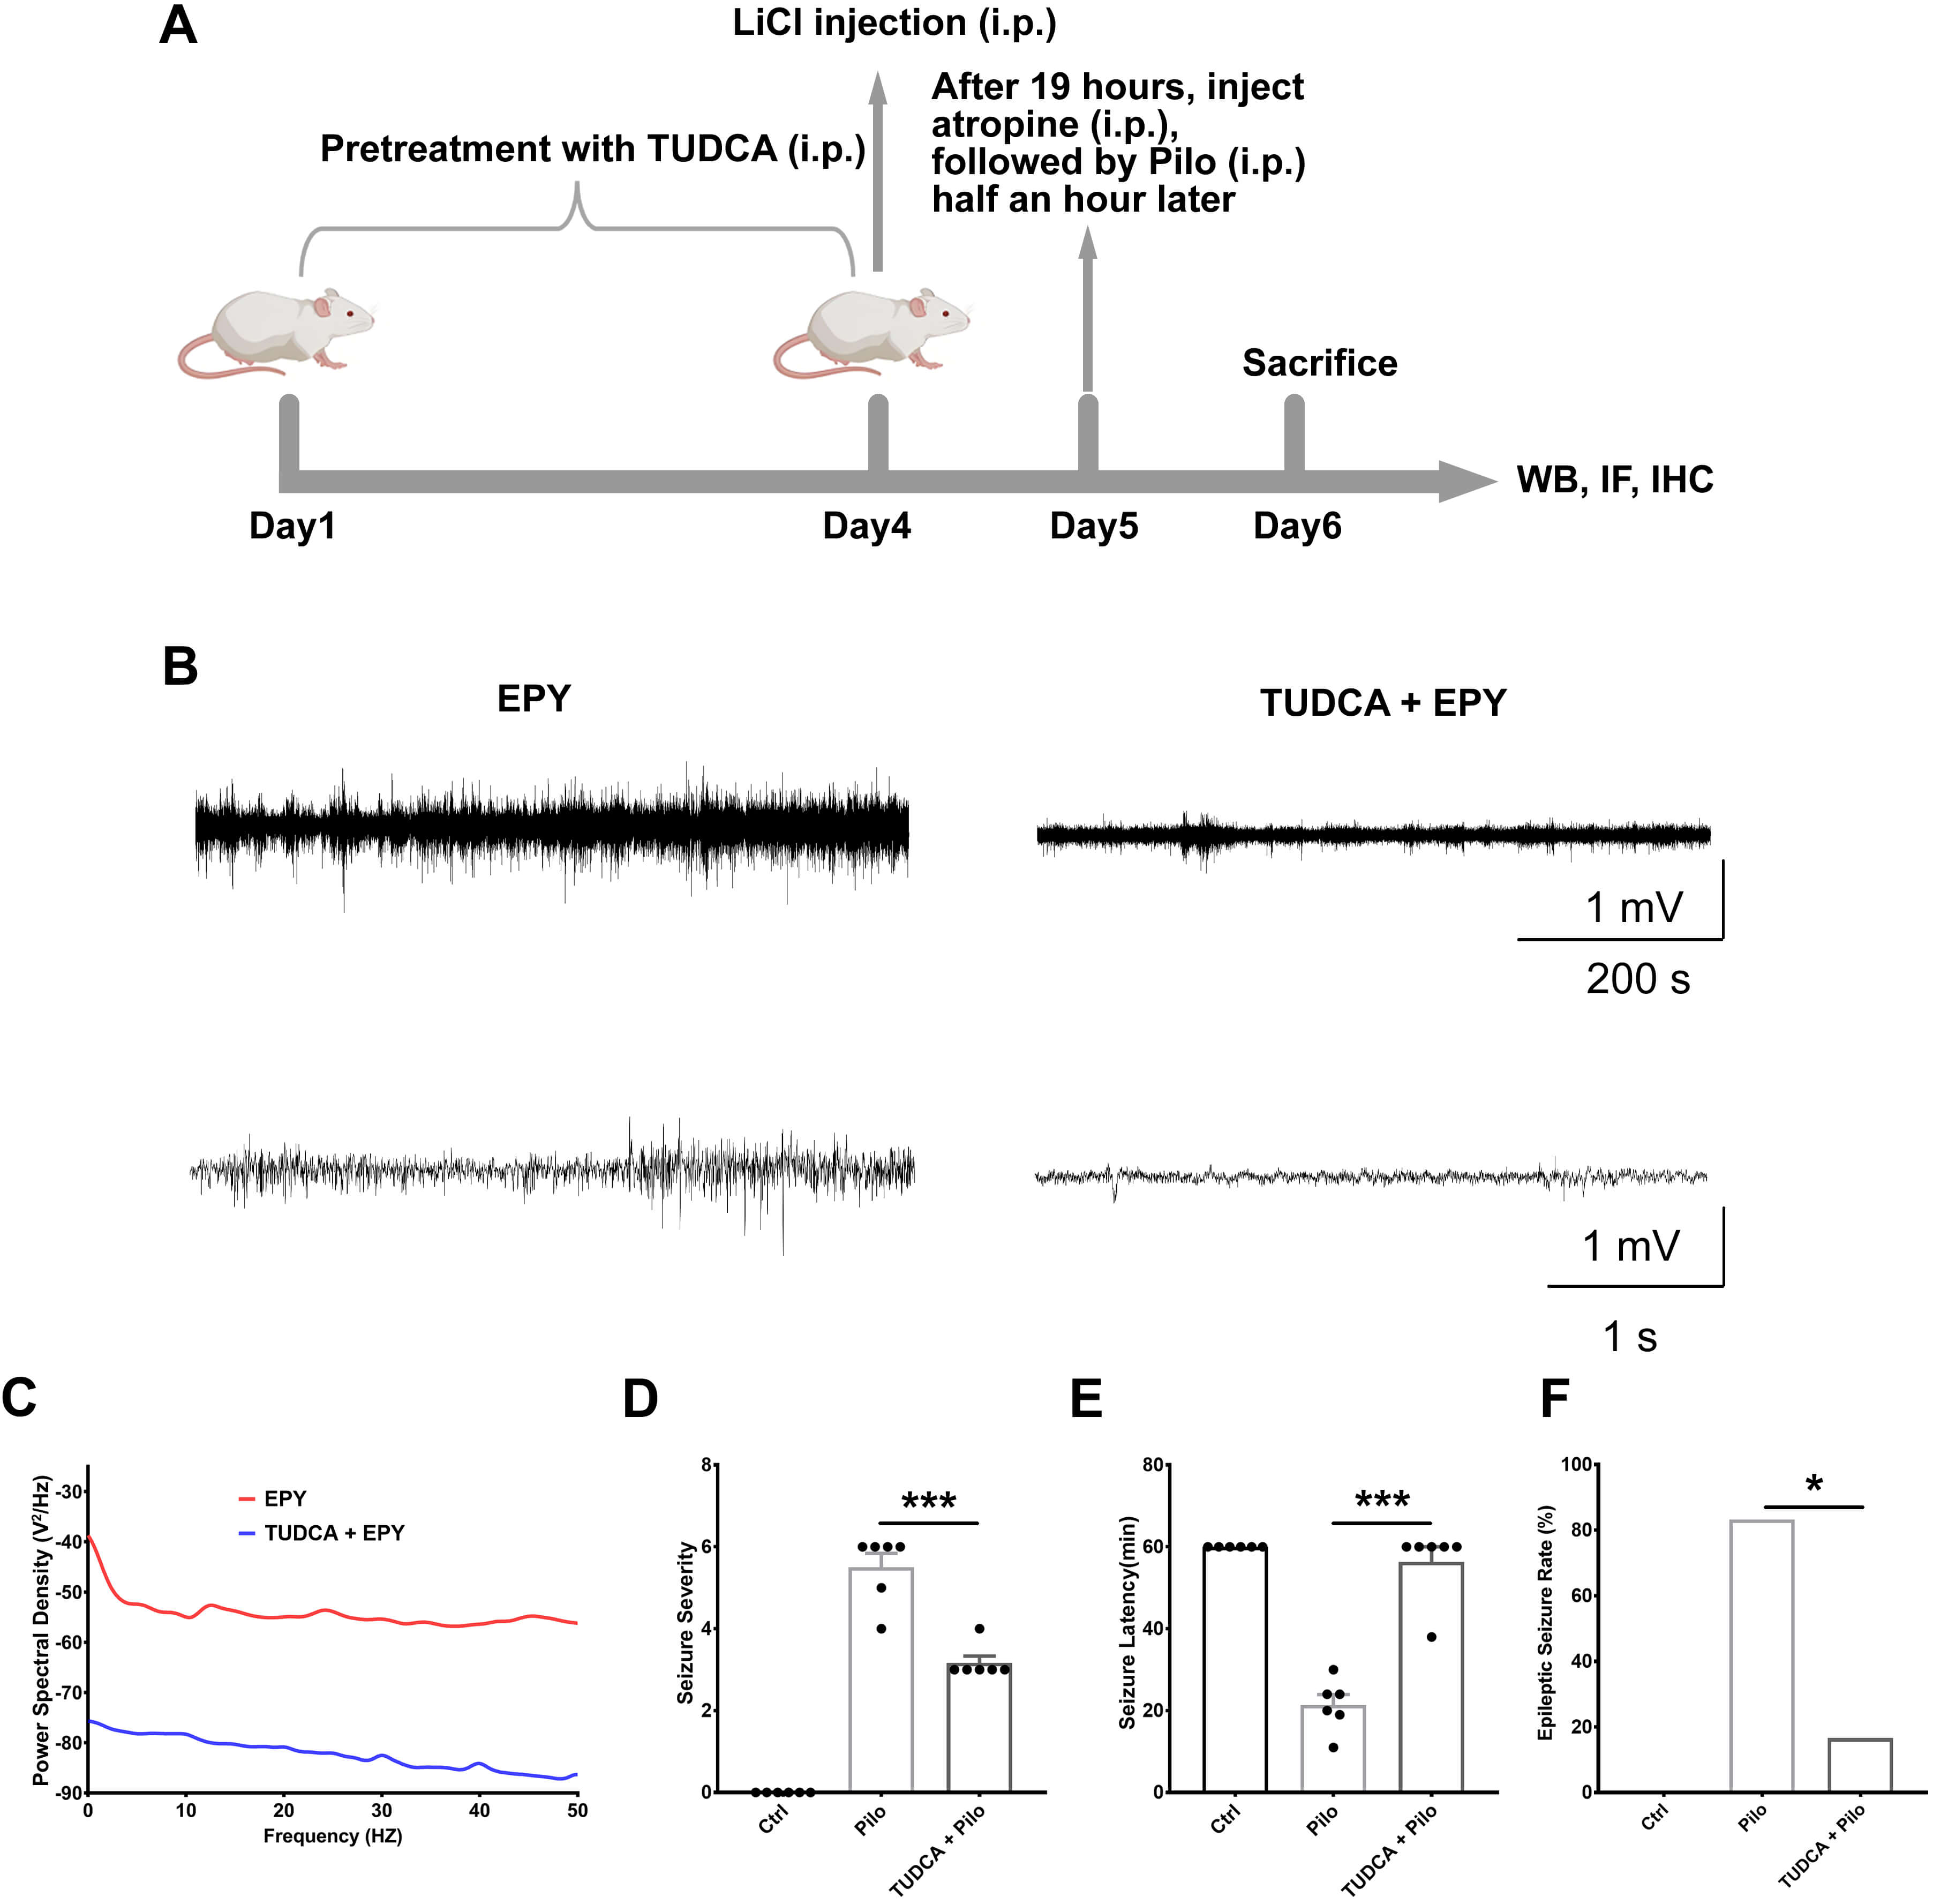 Fig. 1.
TUDCA pretreatment alleviates seizure activity. TUDCA
significantly reduced seizure severity. (A) Flowchart of the in vivo
experimental design. (B) Representative EEG traces showing electrographic
activity in the EPY and TUDCA + EPY groups. The EEG power spectra were analyzed
for both groups. (C) Power spectral analysis of EEG between the two groups.
Statistically significant differences were observed between the EPY (red line)
and TUDCA + EPY (blue line) groups. The vertical axis represents the average EEG
power spectral (V2/Hz), and the horizontal axis represents frequency (Hz).
(D,E) Effects of TUDCA on seizure severity and seizure latency. (F) Statistical
analysis of seizure occurrence rate. Data are presented as mean
H&E staining results (Fig. 2A) revealed brain cell damage and morphological shrinkage in epileptic rats, while TUDCA pretreatment could alleviate the degree of cell damage. Subsequently, to further investigate neuronal alterations, we additionally performed Nissl staining and the neuronal marker NeuN immunostaining. Nissl staining results (Fig. 2B) showed that the Pilo group exhibited significant neuronal loss, while TUDCA pretreatment reduced neuronal loss and resulted in more intact neuronal morphology. Similarly, as shown in the neuronal marker NeuN immunostaining results in Fig. 2C–E, TUDCA pretreatment increased the number of surviving neurons. Furthermore, by comparing the control group with the TUDCA + Pilo group, we can determine that TUDCA can prevent or alleviate neuronal damage.
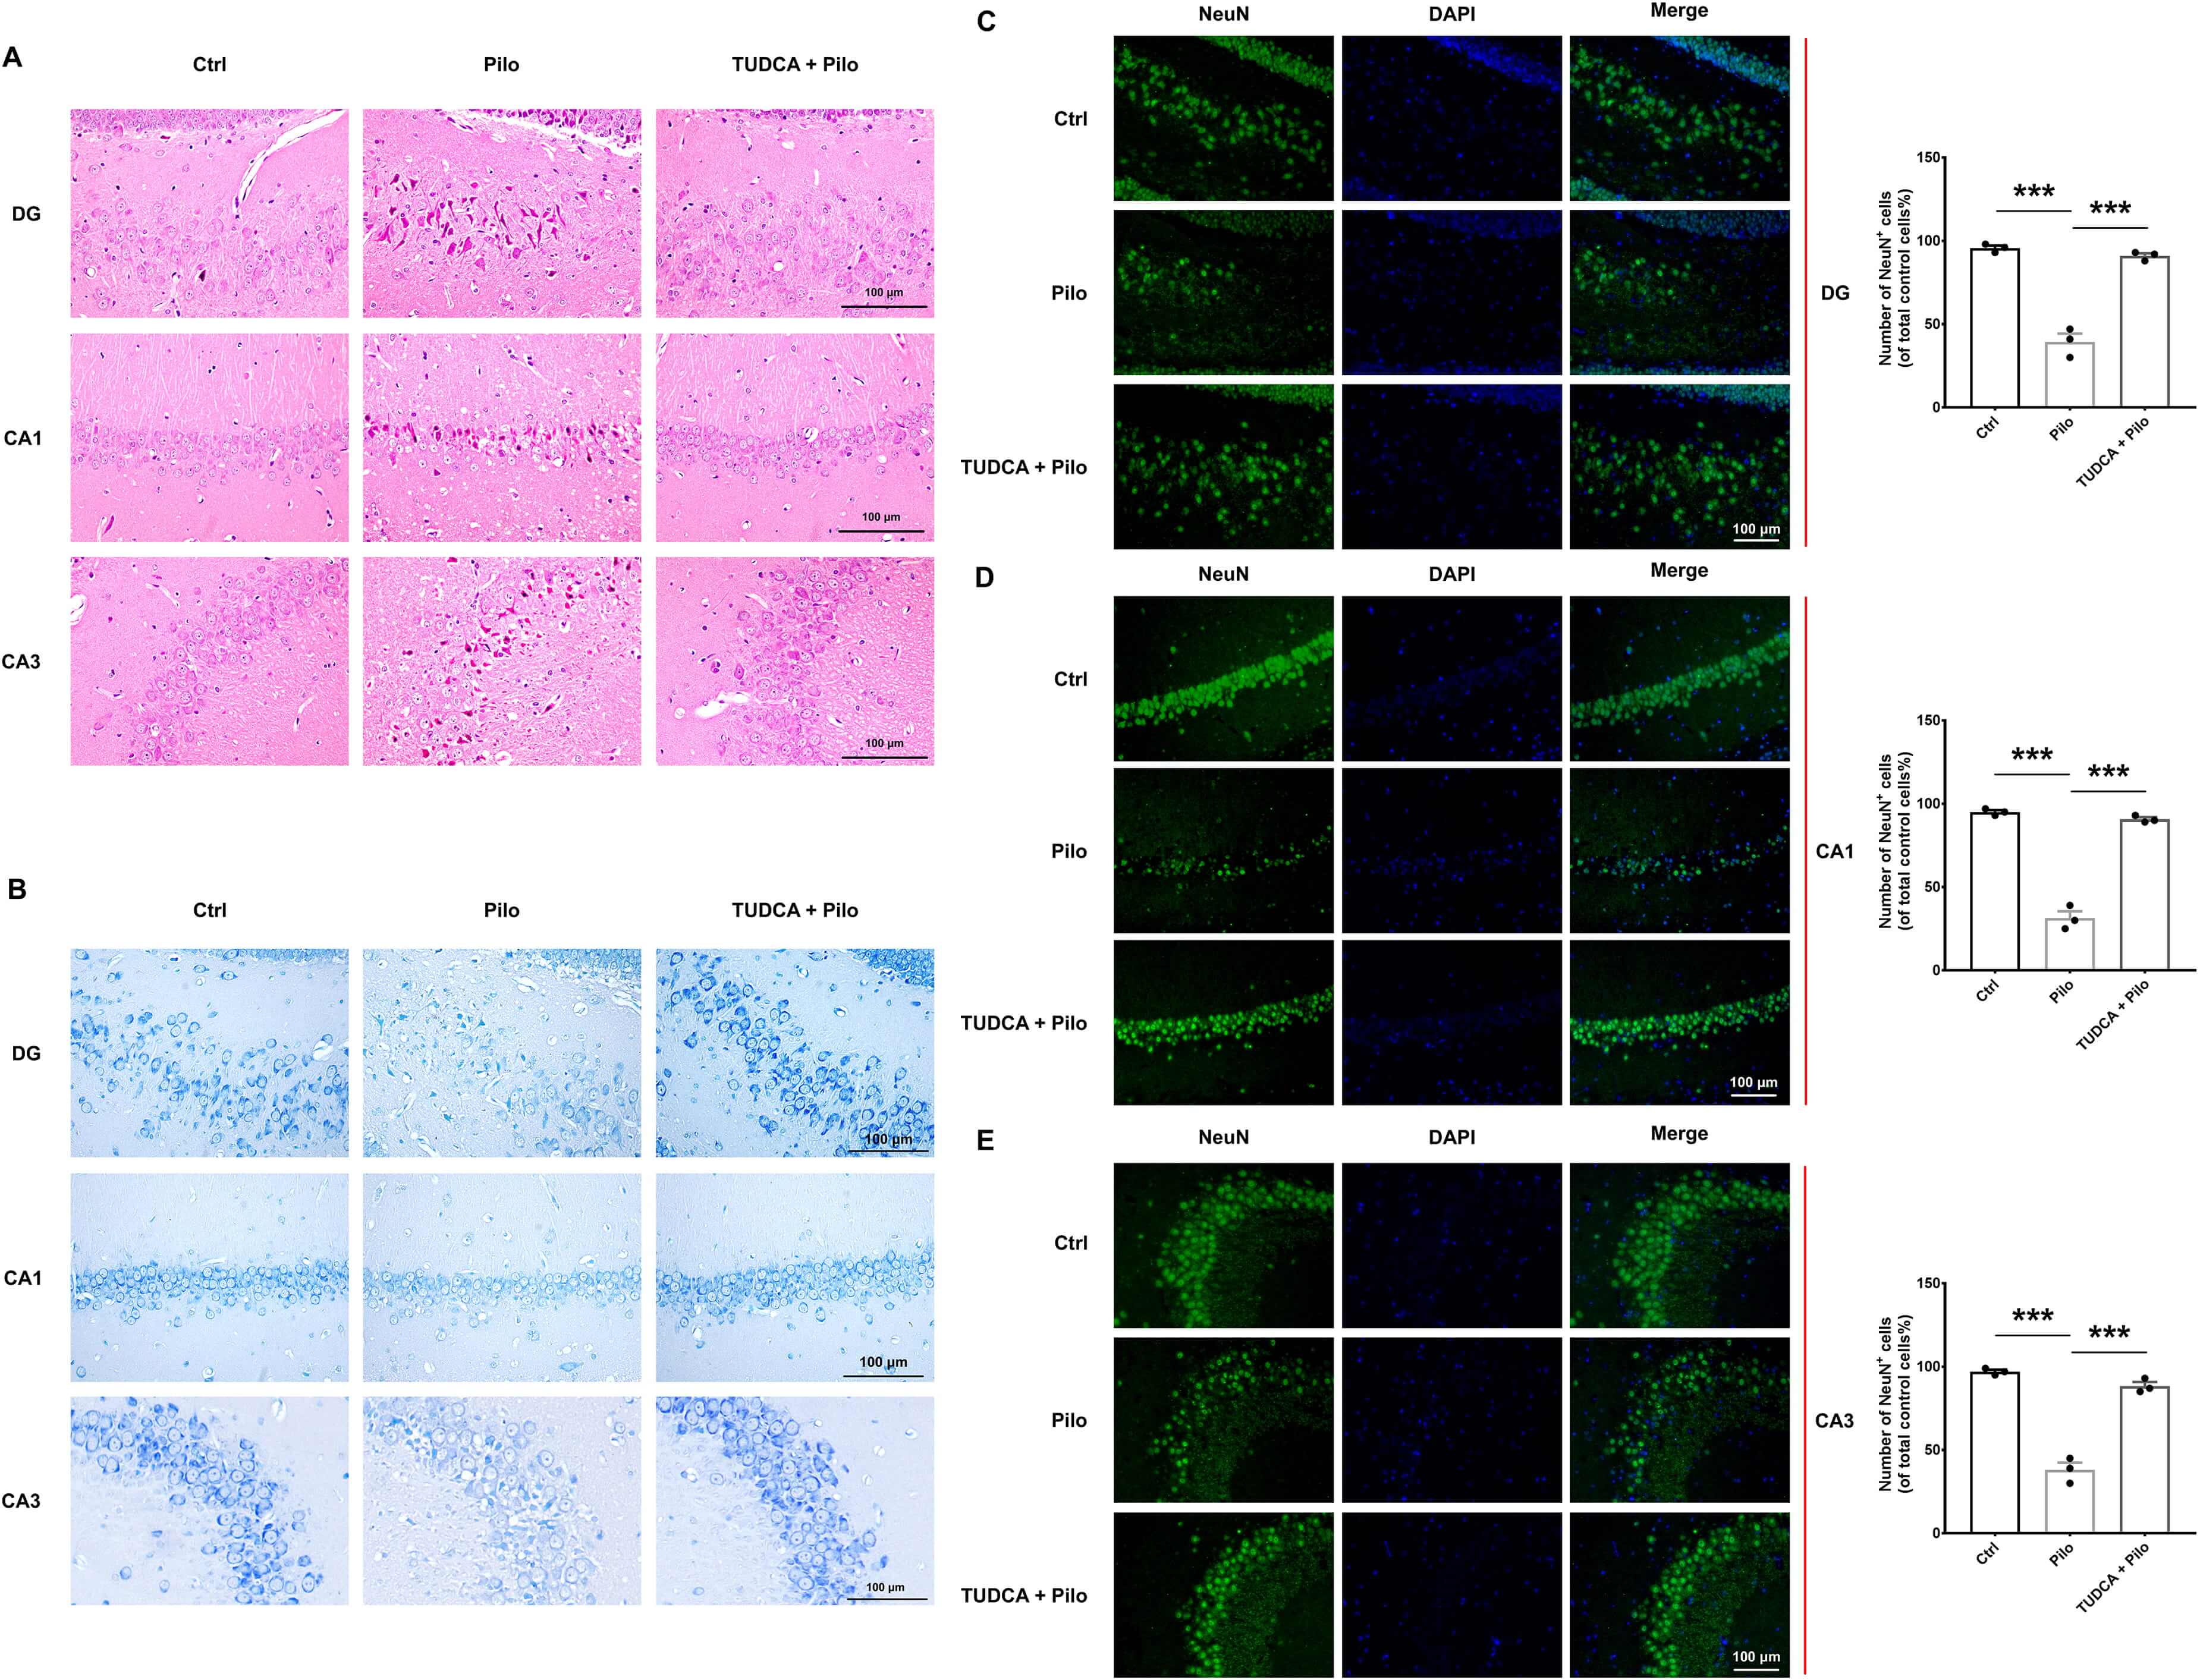 Fig. 2.
TUDCA pretreatment alleviates hippocampal neuronal damage in
pilocarpine-induced epilepsy rats. (A) Representative H&E staining of the
hippocampal areas DG, CA1 and CA3. (B) Representative Nissl staining of the
hippocampal areas DG, CA1 and CA3. (C–E) Representative immunofluorescence
images of NeuN expression and statistical analysis in the hippocampus areas DG,
CA1 and CA3 of the different groups. Scale bar = 100 µm. Data are presented
as mean
In addition to neuronal damage, immunofluorescence and Western blot were performed to examine oxidative stress-related markers, including NRF2, HO-1, and SOD1. As shown in Fig. 3A–C and Supplementary Fig. 1A,B, compared to the control group, NRF2 expression was markedly reduced in the brains of epileptic rats, TUDCA pretreatment inhibited the pilocarpine-induced reduction in NRF2 protein levels (The original Western blot images can be found in the Supplementary Material – Original Western Blot Images). Similarly, as shown in Fig. 4A–C and Supplementary Fig. 2A,B, the expression of HO-1 was significantly elevated in the model group relative to the control rats, and TUDCA pretreatment mitigated this increase (The original Western blot images can be found in the Supplementary Material – Original Western Blot Images). Consistent with these results, the expression levels of SOD1 also showed similar trends (Fig. 4D,E; Supplementary Fig. 3A,B). These data suggest that TUDCA effectively alleviates oxidative stress in Pilo-induced epilepsy rats.
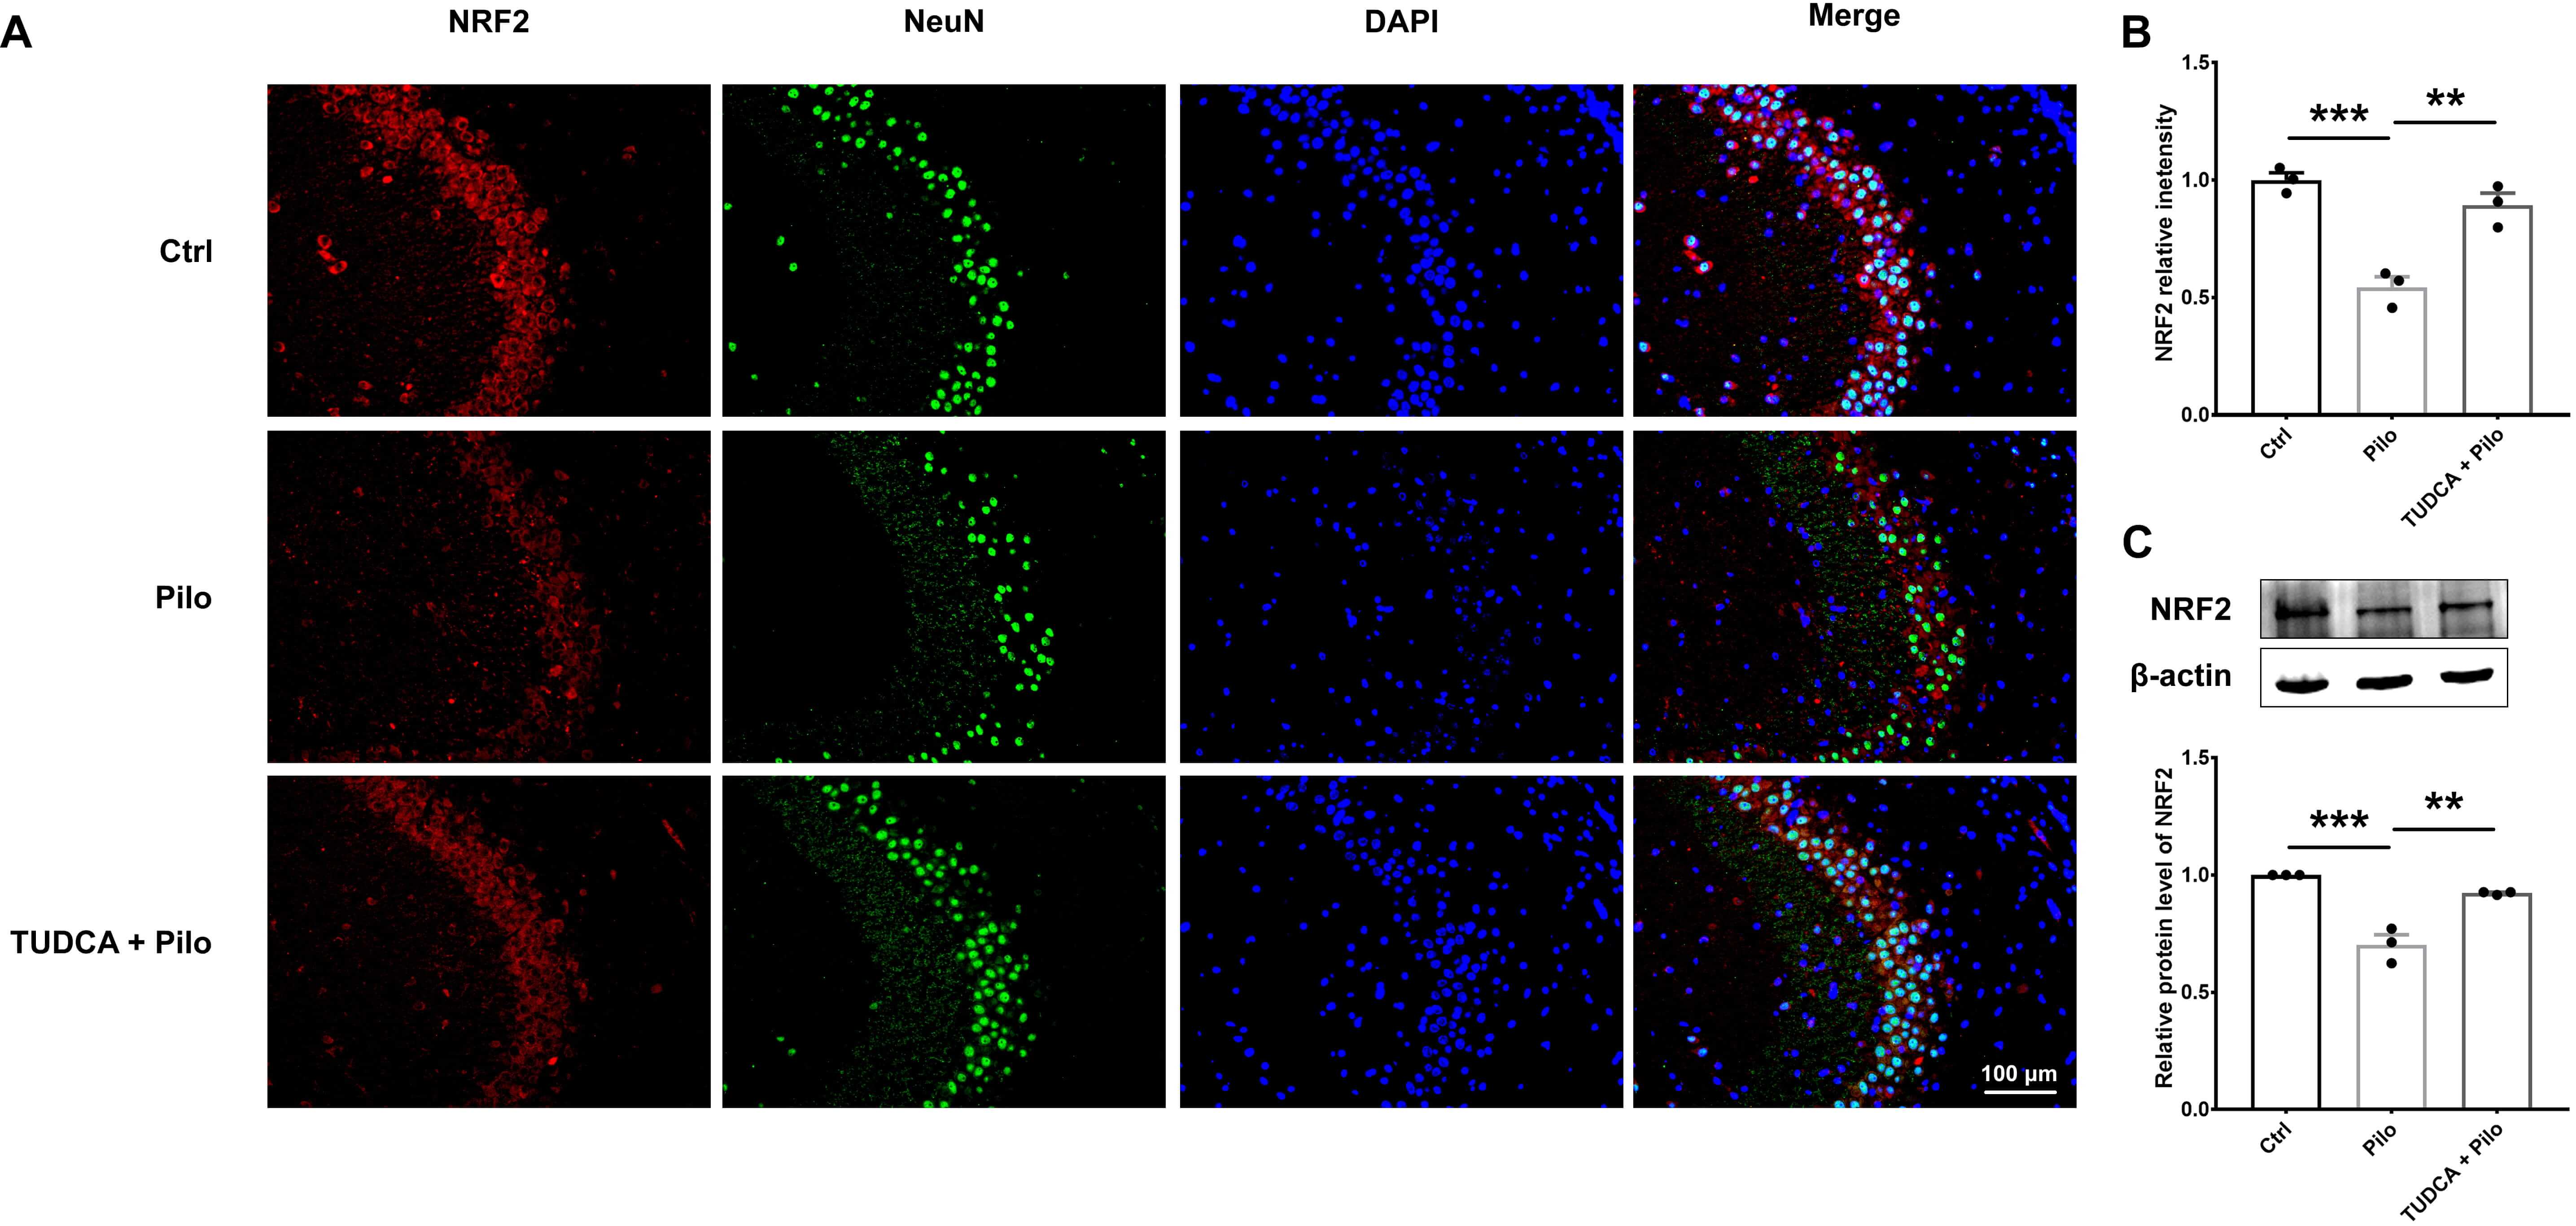 Fig. 3.
TUDCA reduces oxidative stress in pilocarpine-induced epilepsy
rats. (A,B) Representative immunofluorescence images and statistical analysis
showing NRF2 levels in the hippocampus CA3 area of the three groups. (C)
Representative Western blot images and the corresponding statistical analysis of
NRF2 protein expression in hippocampal tissues from each of the three groups.
Scale bar = 100 µm. Data are presented as mean
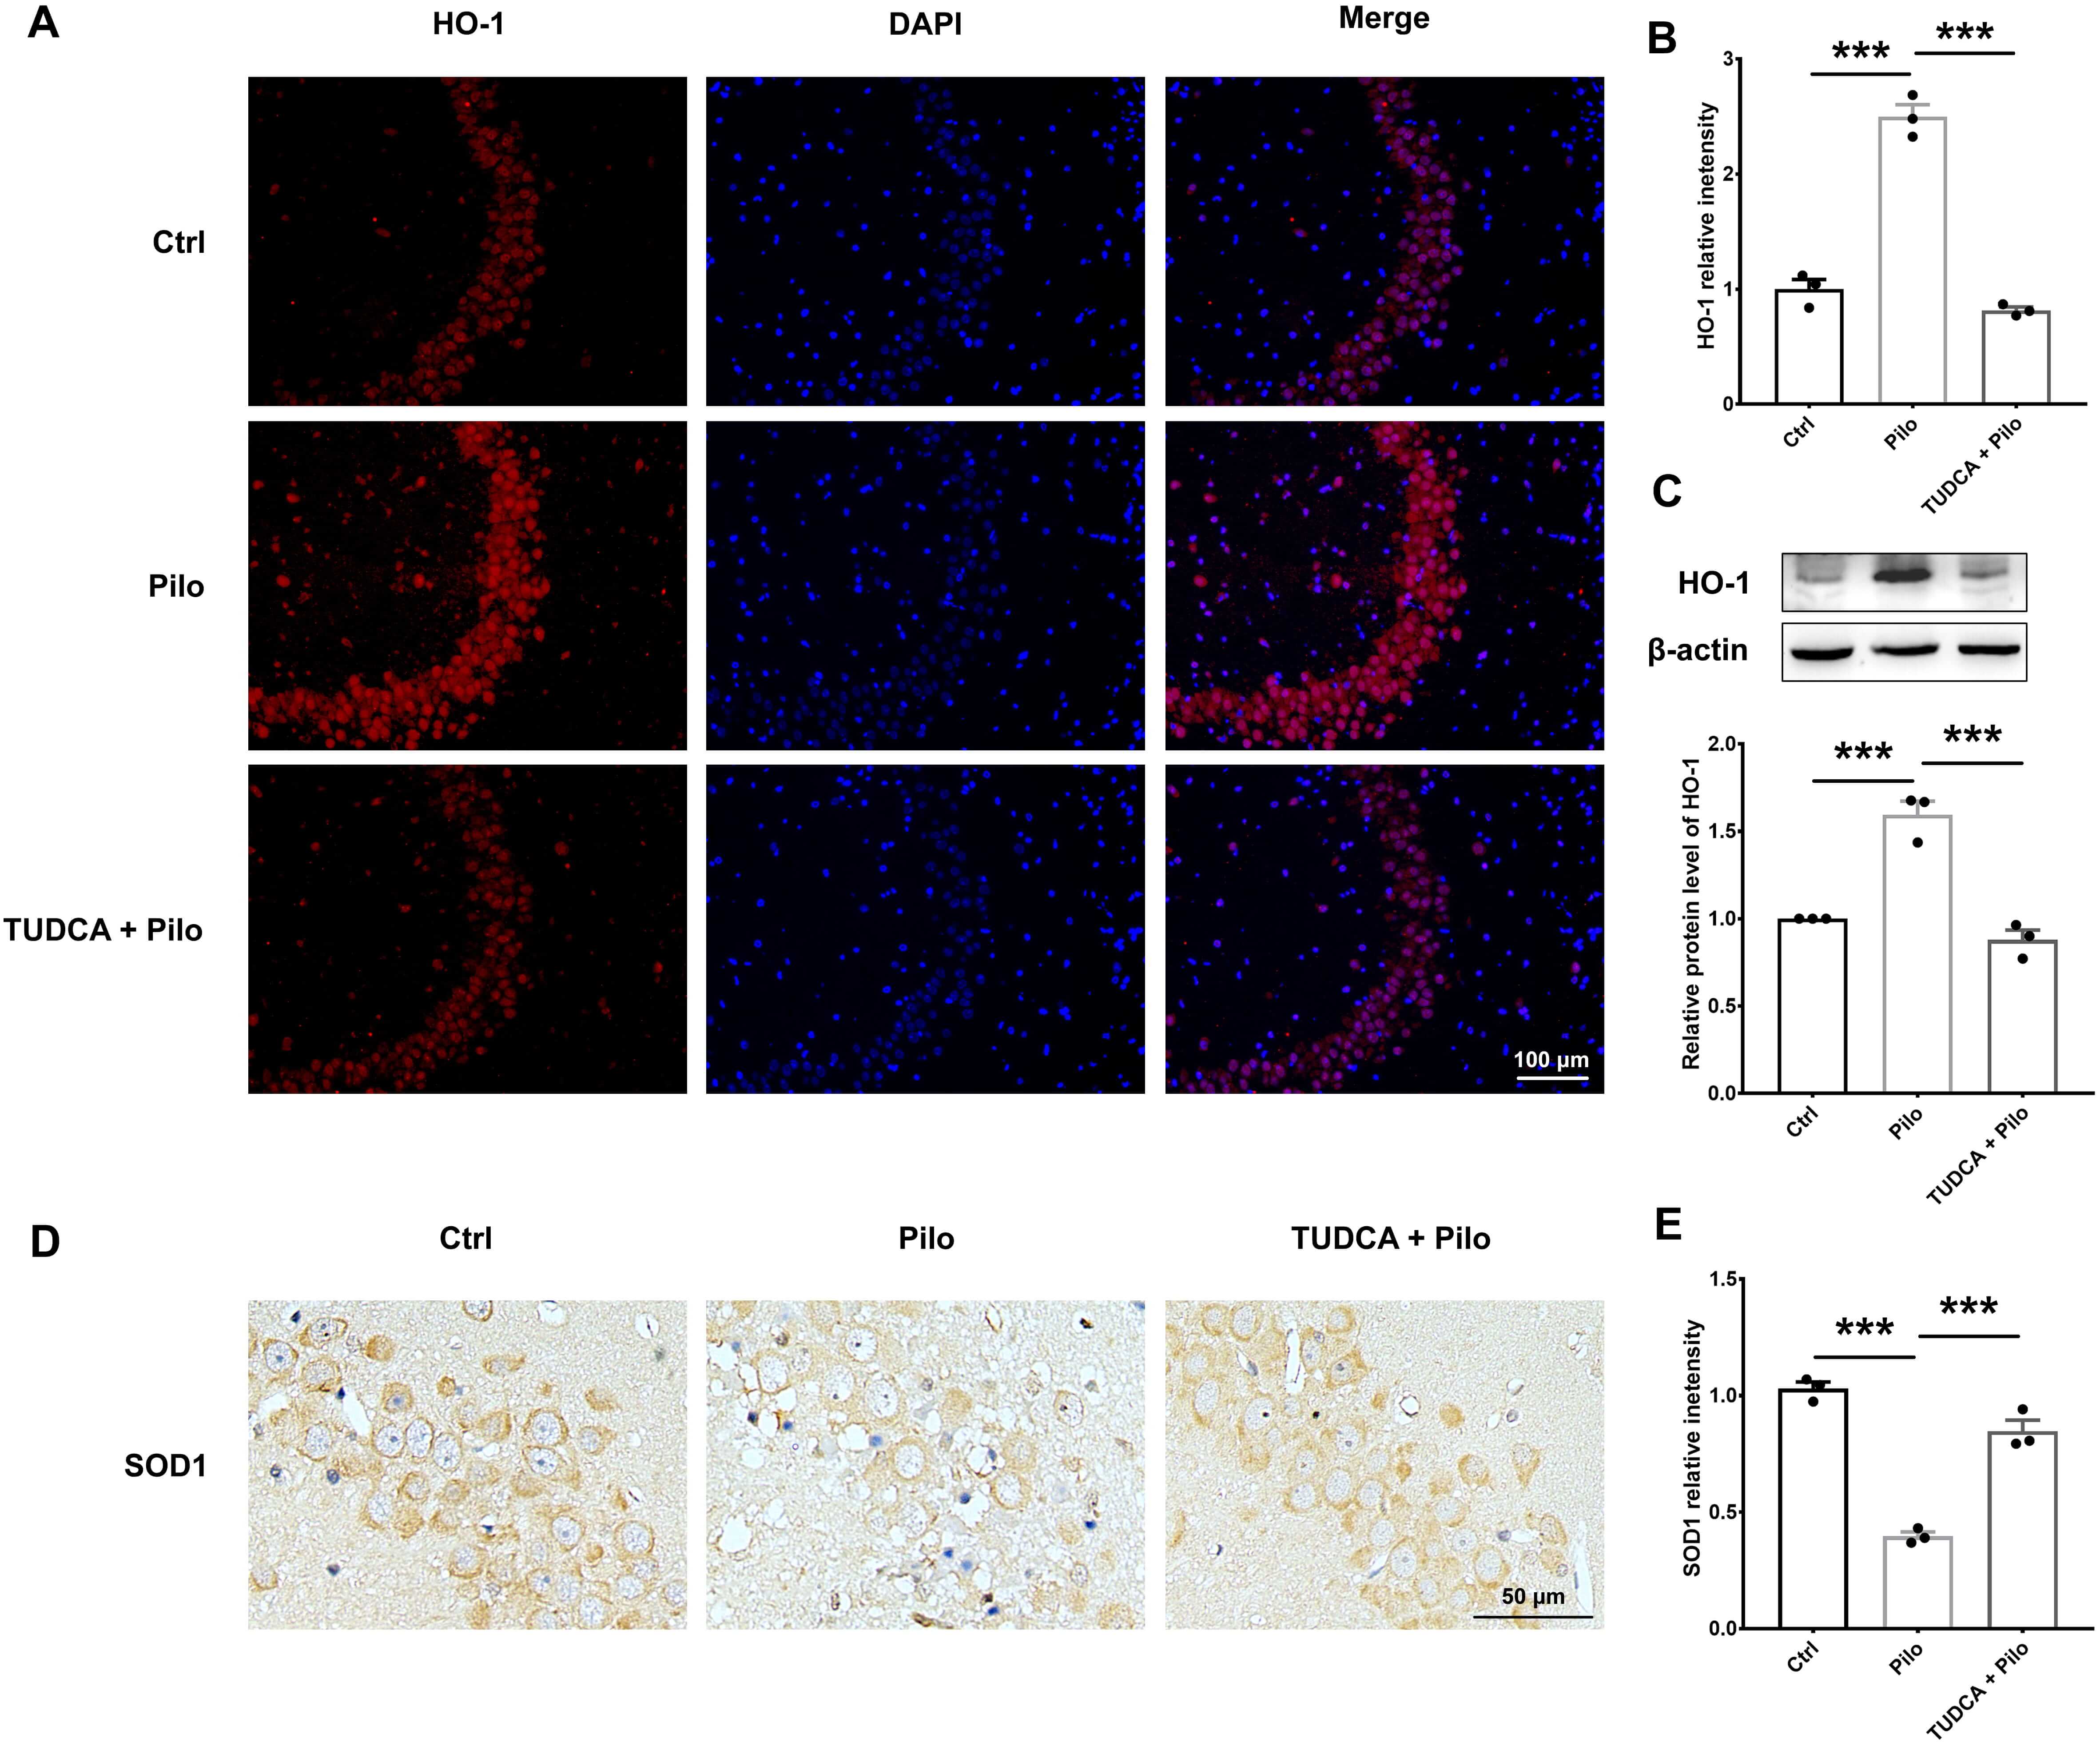 Fig. 4.
TUDCA reduces oxidative stress in pilocarpine-induced epilepsy
rats. (A,B) Representative immunofluorescence images and statistical analysis
showing HO-1 levels in the hippocampus CA3 area of the three groups. Scale bar =
100 µm. (C) Representative Western blot images and corresponding statistical
analysis regarding HO-1 protein expression in hippocampal tissues from the three
groups. (D,E) Representative immunohistochemistry images showing SOD1 expression
and relative intensity of SOD1 in the hippocampus CA3 area among different
groups. Scale bar = 50 µm. Data are presented as mean
To further explore the molecular mechanisms underlying TUDCA’s neuroprotective effects, alterations in the ferroptosis-related marker GPX4 were assessed.
GPX4 expression was measured by immunofluorescence and Western blot analysis. As shown in Fig. 5A,B and Supplementary Fig. 4A,B, GPX4 expression was significantly reduced in the Pilo-induced epilepsy model group compared to the control group, while expression levels were notably increased in the TUDCA pretreatment group. Western blot analysis corroborated these findings (Fig. 5C, the original Western blot images can be found in the Supplementary Material – Original Western Blot Images), indicating that TUDCA effectively inhibits ferroptosis in Pilo-induced epilepsy rats.
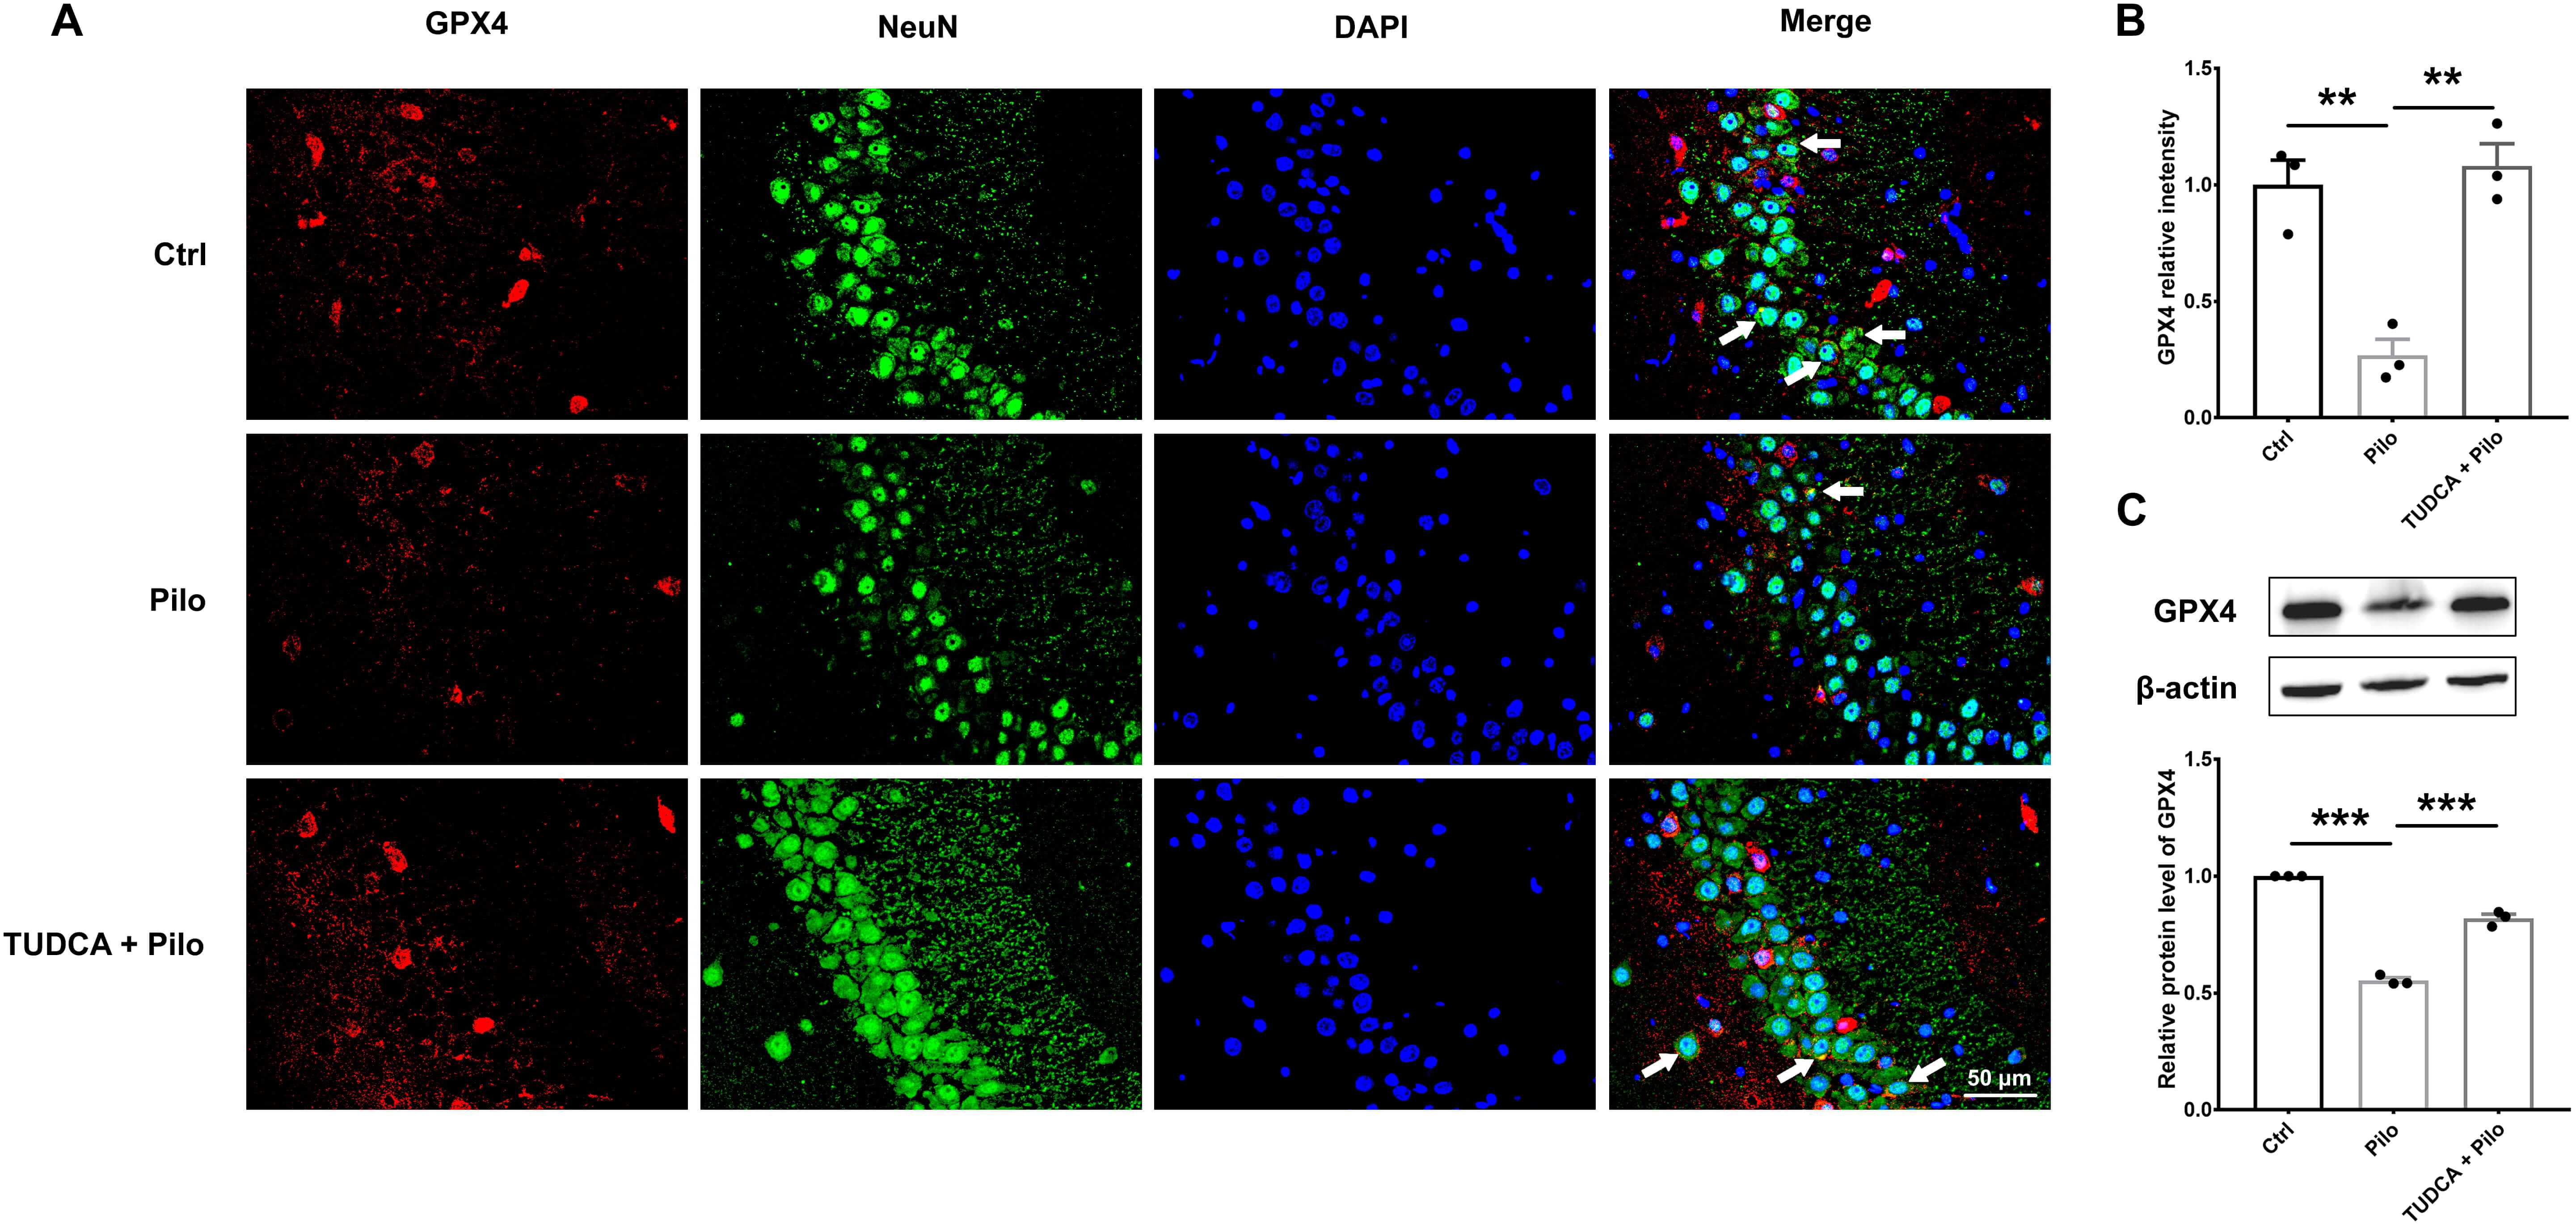 Fig. 5.
TUDCA pretreatment inhibits neuronal ferroptosis in
pilocarpine-induced epilepsy rats. (A,B) Representative immunofluorescence
images and statistical analysis of GPX4 levels in the hippocampus CA3 area of the
three groups of rats. Scale bar = 50 µm. The white arrows indicate co-localization of NeuN and GPX4.
(C) GPX4 protein expression and
statistical data in hippocampal tissues of three groups. Data are presented as
mean
To investigate the inhibitory effect of TUDCA on ferroptosis, ROS, a hallmark of ferroptosis, were measured in a Glu-induced cell death model. The flowchart of the cell experiment design is shown in Fig. 6A. As shown in Fig. 6B, CCK8 cell viability assays demonstrated the neuroprotective effect of TUDCA. Compared to the control group, cell viability in the Glu group was significantly diminished, whereas treatment with 25 µM or 50 µM TUDCA effectively enhanced cell viability. Additionally, TUDCA treatment significantly reduced ROS accumulation induced by glutamate. As shown in Fig. 6C,D, relative to the control group, ROS levels were significantly increased in the Glu group, but TUDCA pretreatment led to a significant reduction in ROS accumulation, suggesting that TUDCA mitigates ferroptosis-associated oxidative stress.
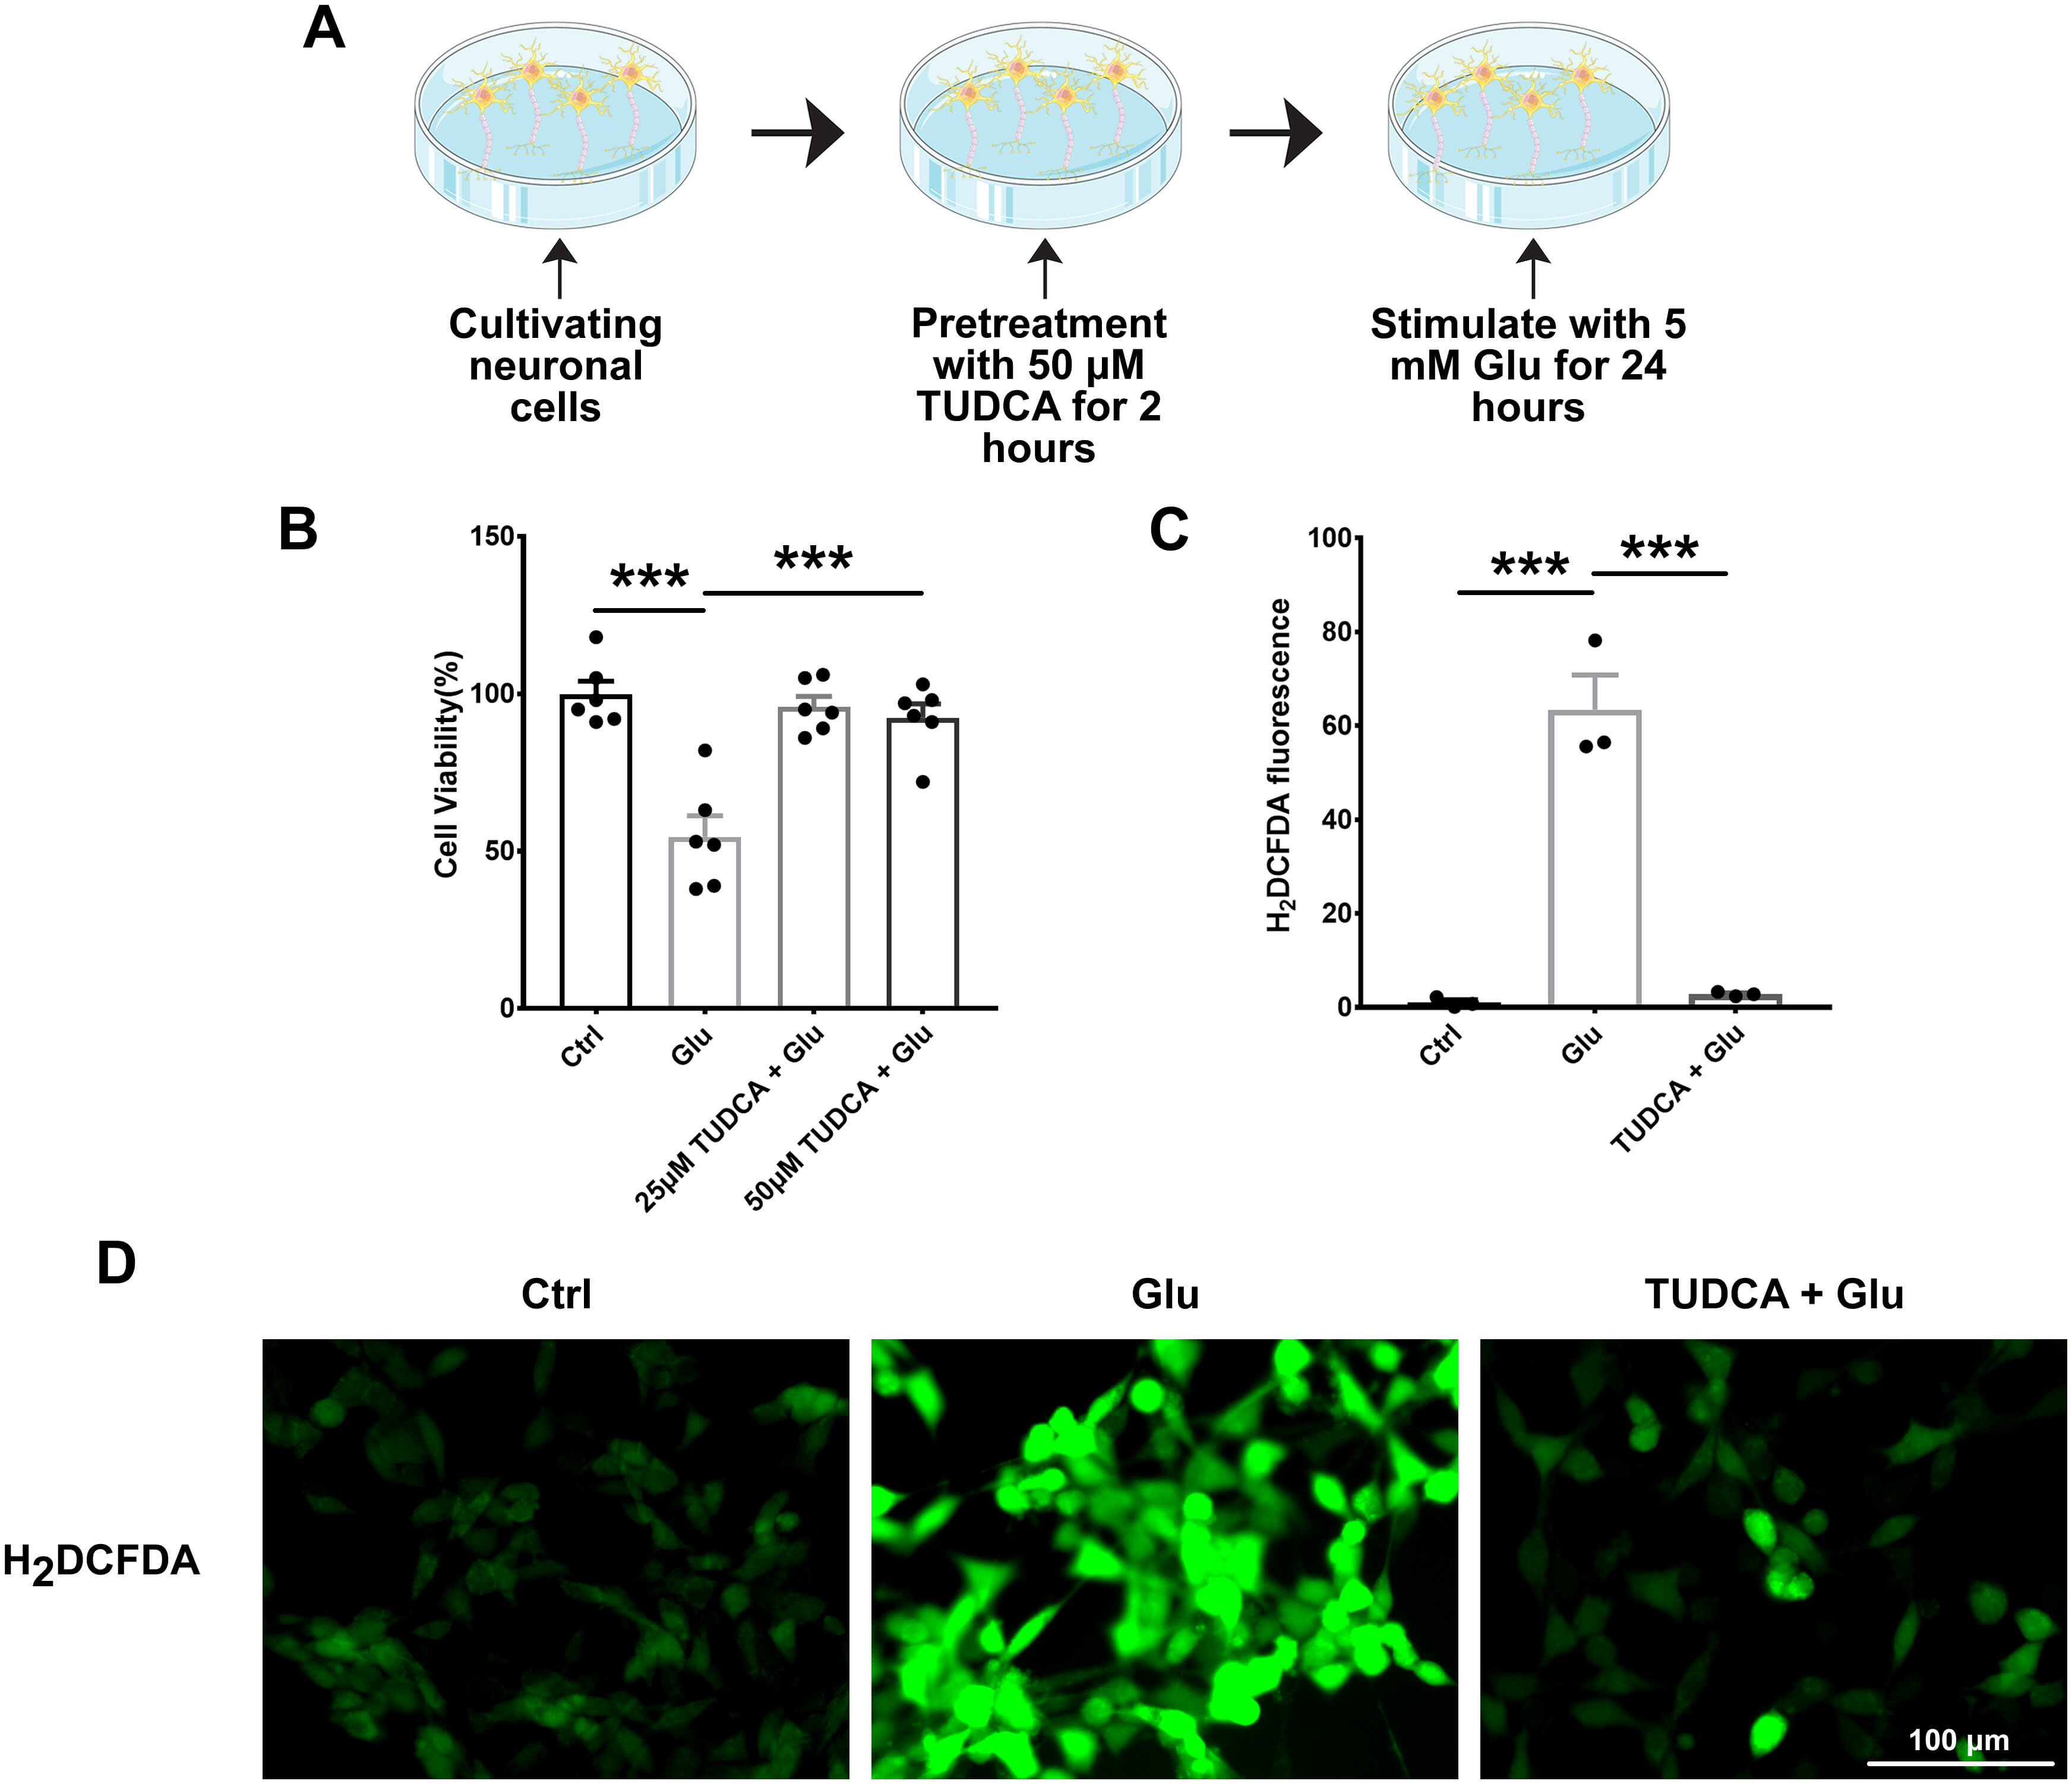 Fig. 6.
TUDCA reduces oxidative stress in glutamate-induced neuronal
cell model. (A) Flowchart of the in vitro experimental design. (B)
Effects of TUDCA on cell viability in glutamate-induced neuronal cell death (n =
6). (C,D) Representative immunofluorescence images and statistical analysis of
ROS levels in vitro cell model (n = 3). Scale bar = 100 µm. Data
are presented as mean
Immunofluorescence and Western blot analyses were also performed to assess the expression of the oxidative stress-related marker NRF2. Representative immunofluorescence images of NRF2 and NeuN are shown for Ctrl, Glu, and TUDCA + Glu conditions (Fig. 7A). Kymographs (Fig. 7B–D) were generated, and the signal intensity profiles of NeuN (green) and NRF2 (red) were quantified and analyzed. Fig. 7E,F (The original Western blot images can be found in the Supplementary Material – Original Western Blot Images.) presents a histogram showing the relative NRF2 protein levels across Ctrl, Glu, and TUDCA + Glu conditions. Overall, these data indicate that TUDCA promotes the nuclear translocation of NRF2 in glutamate-treated neurons.
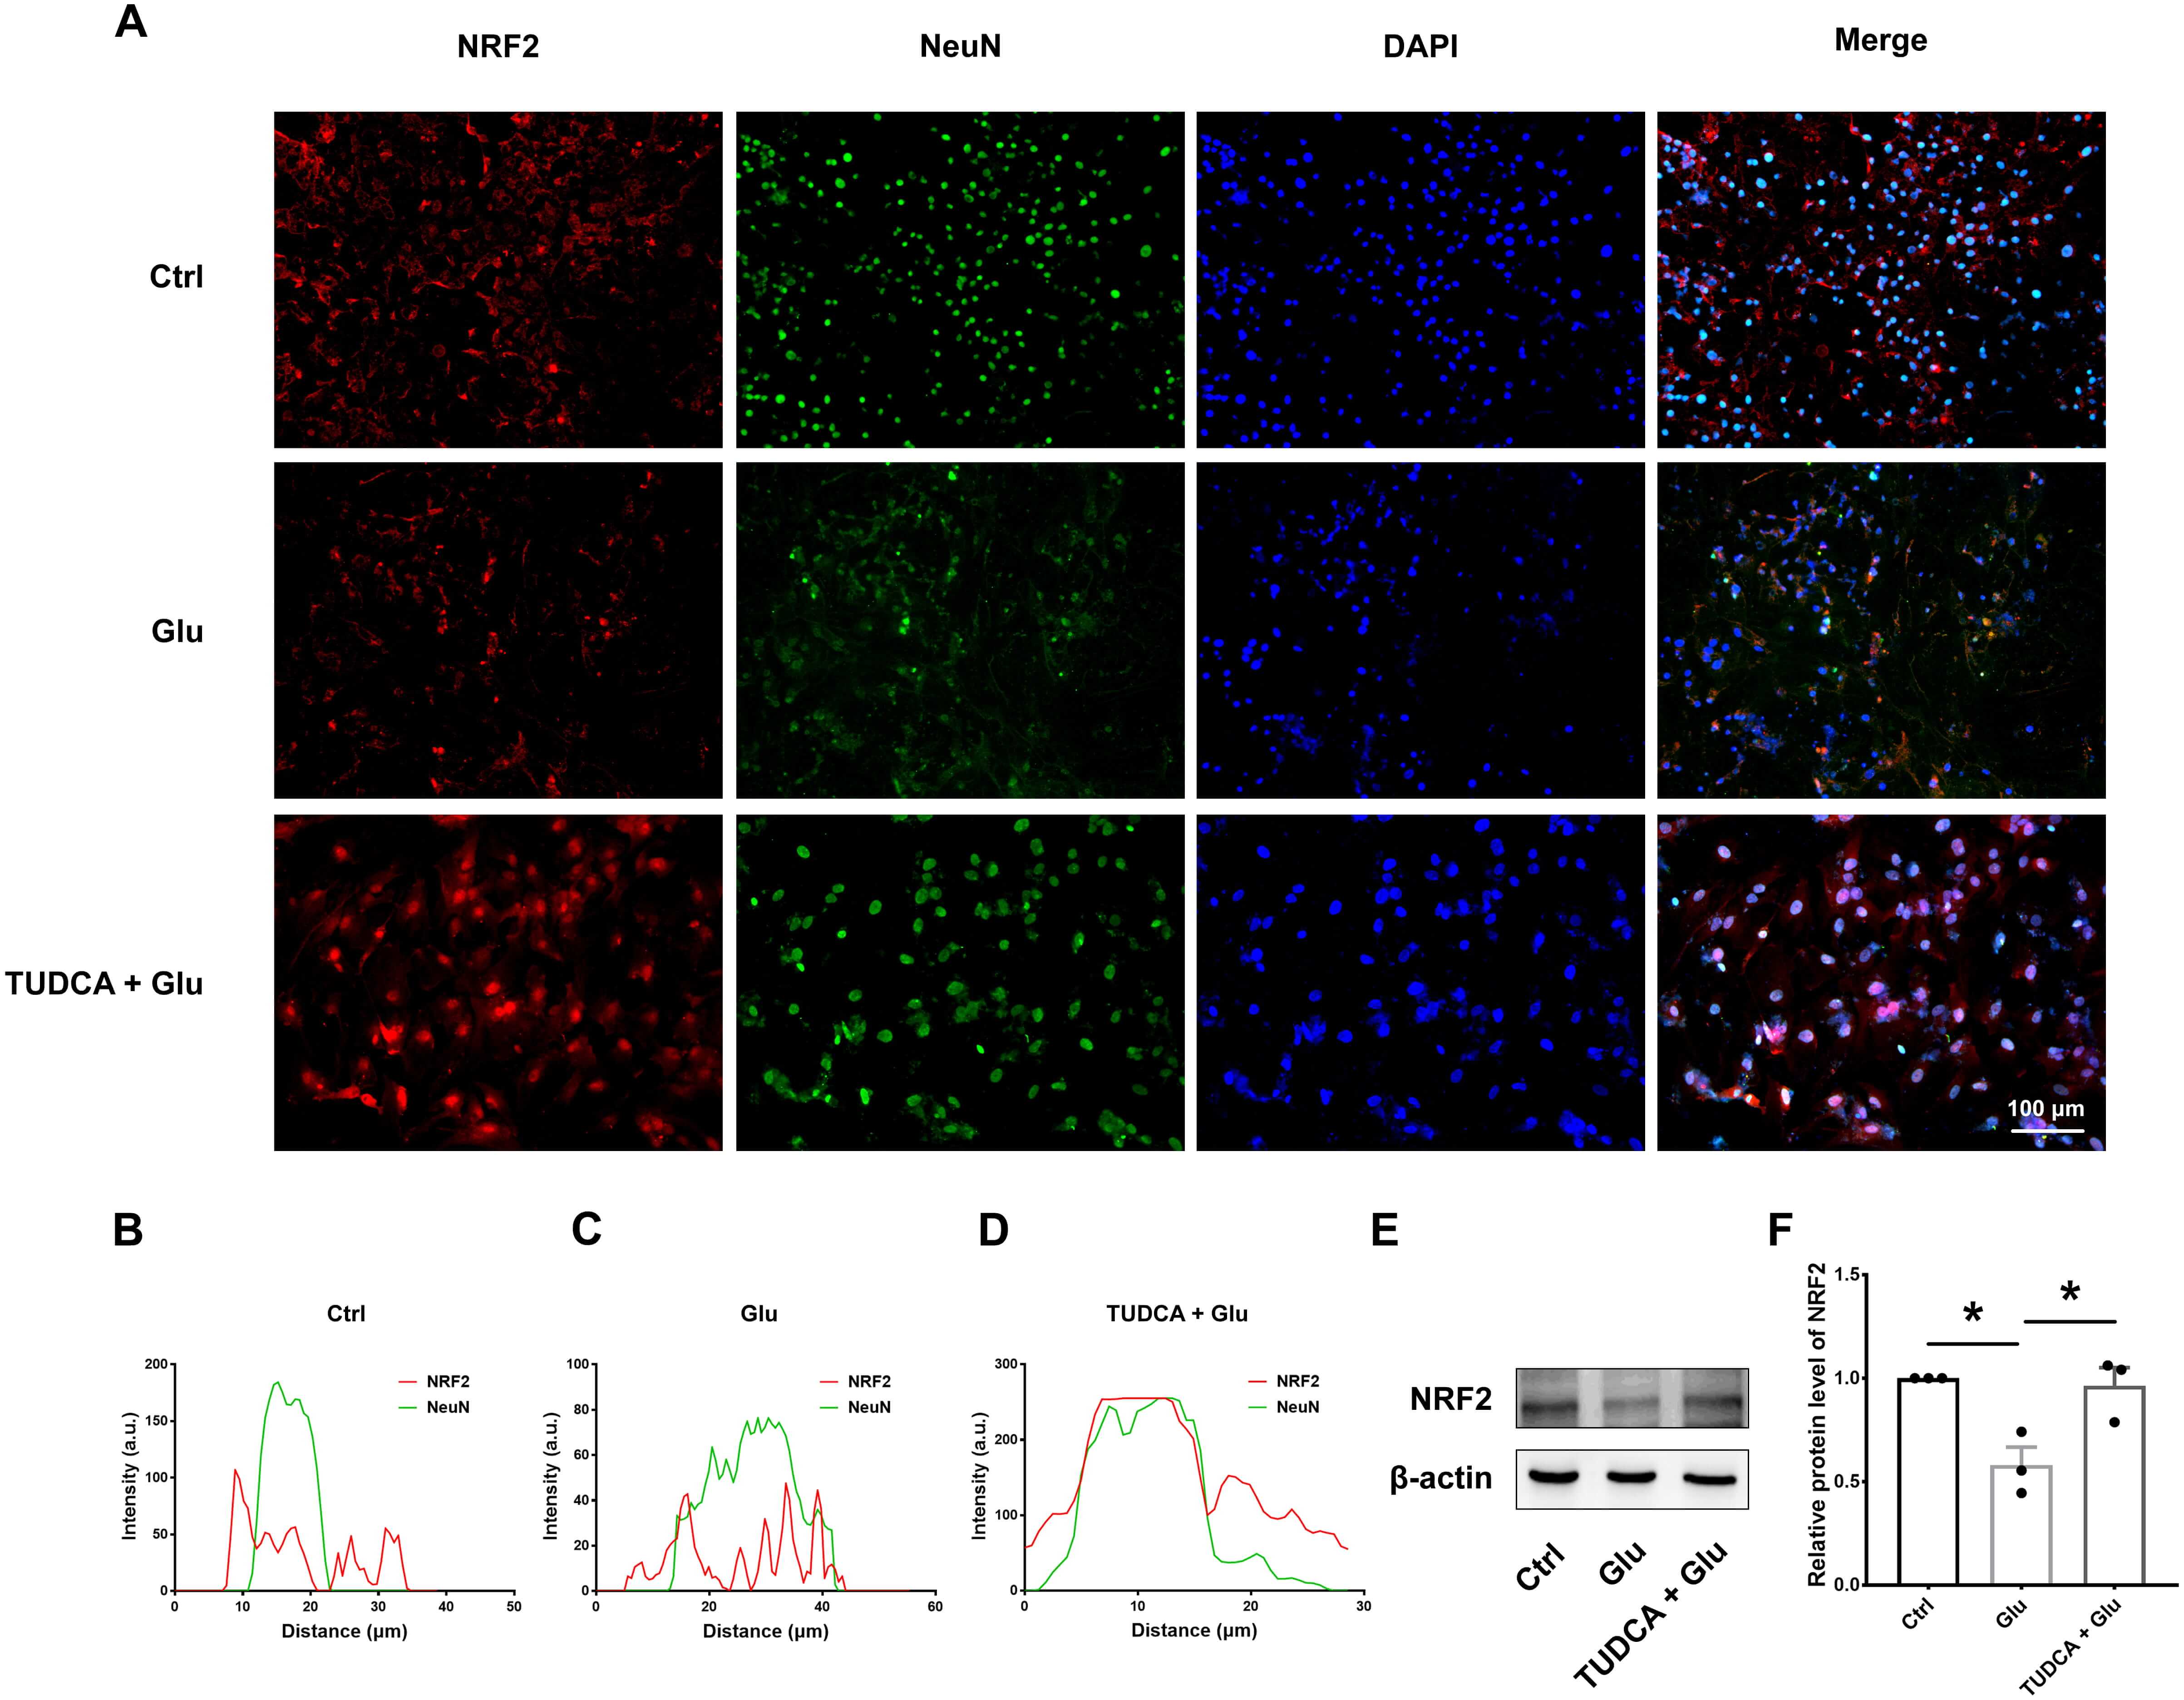 Fig. 7.
TUDCA reduces ferroptosis in a glutamate-induced neuronal cell
model. (A–D) Representative immunofluorescence images and statistical analysis
showing TUDCA-induced nuclear translocation of NRF2 in glutamate-induced neurons.
Scale bar = 100 µm. (E) Representative Western blot images of NRF2 protein
levels in glutamate-induced neuronal cell death. (F) The quantification analysis
of NRF2 protein levels. Data are presented as mean
To explore the mechanism by which TUDCA protects against neuronal ferroptosis, GPX4 expression was detected via immunofluorescence and Western blot in the Glu-induced neuronal death model. As shown in Fig. 8A,B, the Glu group exhibited reduced GPX4 expression relative to the control group. However, TUDCA pretreatment significantly reversed the reduction in GPX4 levels. Western blot results (Fig. 8C, the original Western blot images can be found in the Supplementary Material – Original Western Blot Images) confirmed that the expression of GPX4 in the Glu group was significantly decreased, while TUDCA inhibited the decrease in GPX4 expression. These findings, consistent with the in vivo data, strongly suggest that TUDCA mitigates neuronal cell death by regulating ferroptosis and oxidative stress.
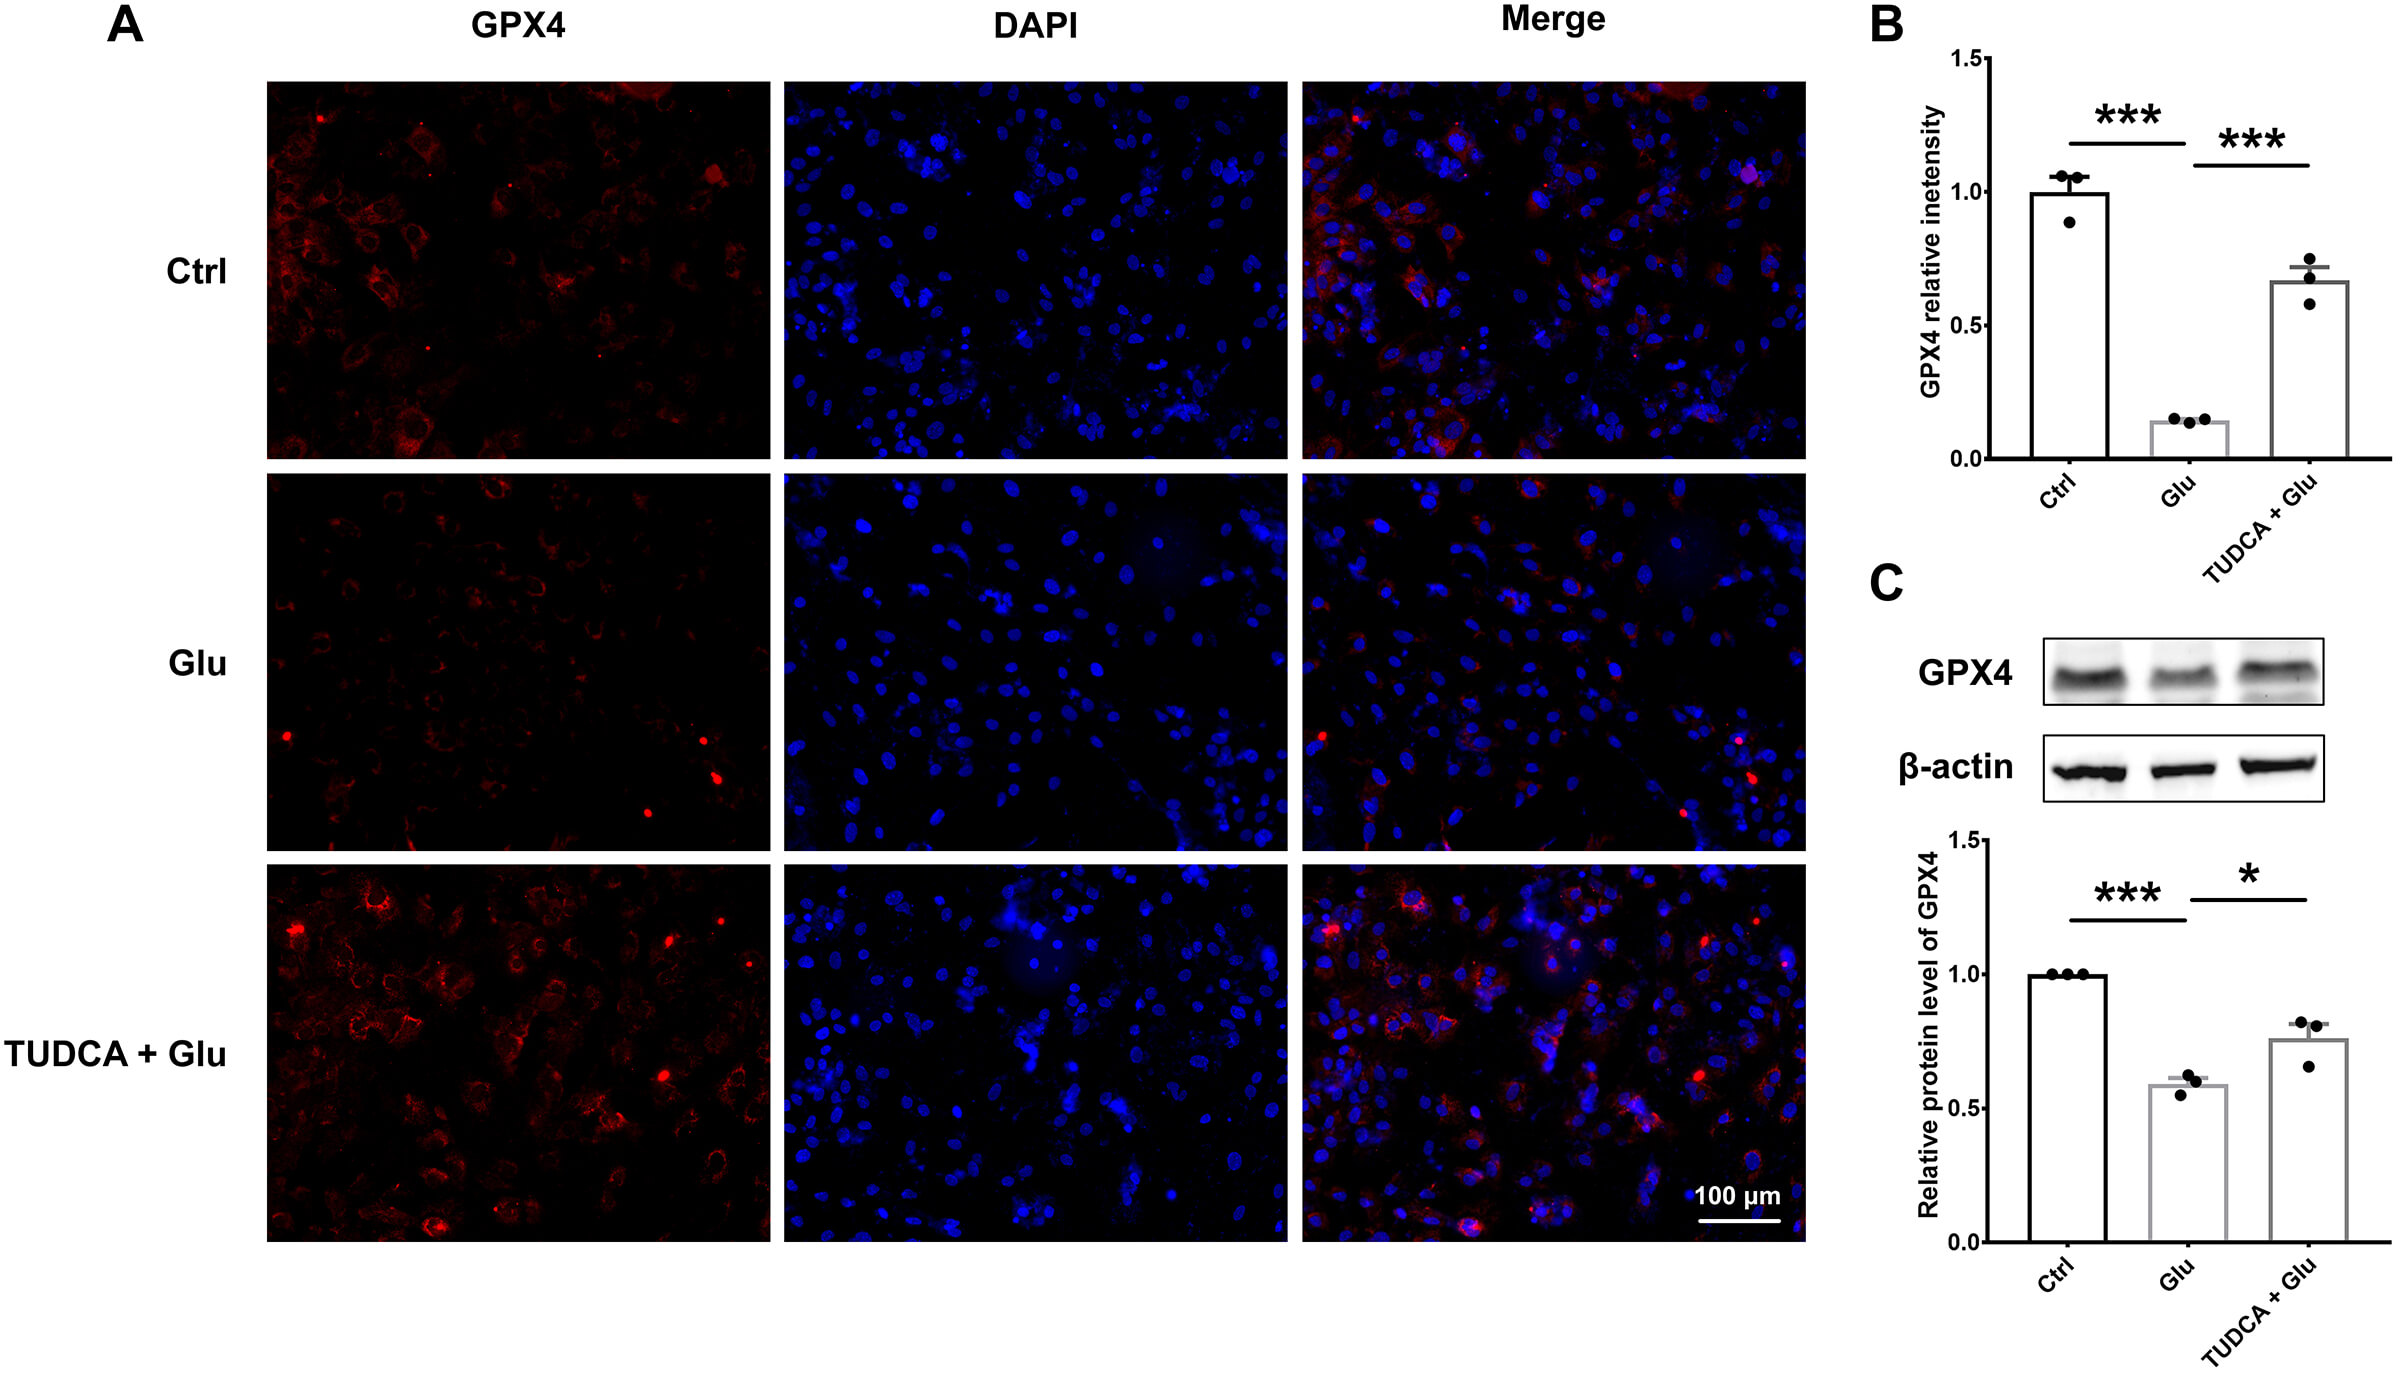 Fig. 8.
TUDCA reduces ferroptosis in a glutamate-induced neuronal cell
model. (A,B) Representative immunofluorescence images and statistical analysis
of GPX4 levels in glutamate-induced neurons. Scale bar = 100 µm. (C) The
protein expression of GPX4 by Western blot in neuronal cells after treatment with
Glu and TUDCA, and statistical analysis results of GPX4. Data are presented as
mean
TUDCA, an endogenous bile acid and taurine conjugate of UDCA, exhibits strong neuroprotective properties. When combined with coenzyme Q10 and creatine, it produces additive neuroprotective effects in in vitro models of Parkinson’s disease [30]. Study conducted recently also indicate that TUDCA mitigates depression-like manifestations and reduces hippocampal neuronal damage in female mice subjected to a corticosterone-induced model [31]. Previous research has highlighted TUDCA’s neuroprotective effects across various neurological disease models [24]. In this study, behavioral scoring, EEG detection, and pathological section staining collectively demonstrated that TUDCA mitigates seizure-like behaviors in Pilo-induced epileptic rats, which is presumably attributed to its neuroprotective properties. Consistent with these in vivo findings, TUDCA also exerted protective effects in an in vitro model of Glu-induced neuronal cell death. Thus, the present research indicates that TUDCA holds potential as a therapeutic candidate for epilepsy.
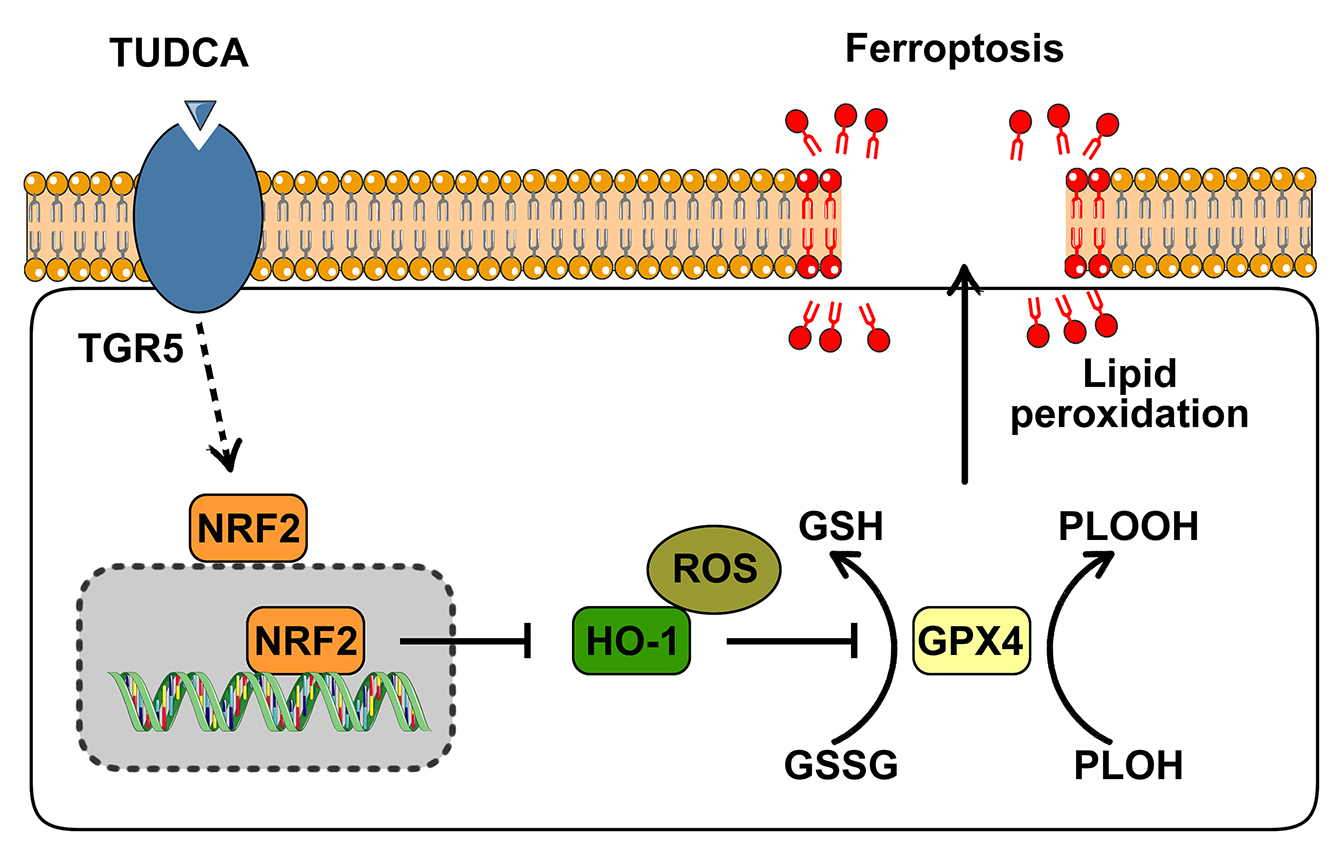
The etiology and pathogenesis of epilepsy remain complex and incompletely understood. NRF2 is a master transcriptional regulator that enhances neuronal resistance to oxidative stress and glutamate-induced excitotoxicity, mitigating lipid peroxidation and maintaining cellular redox balance [32]. It is also closely linked to the inhibition of ferroptosis [33]. Under normal conditions, NRF2 is sequestered in the cytosol by its repressor Keap1 and degraded via proteasomal pathways [34]. Under conditions of oxidative stress or other perturbations to cellular homeostasis, NRF2 translocates into the nucleus, binds to the antioxidant response element, promoting antioxidant activity through the upregulation of target genes such as GPX4, thereby initiating a protective response [35, 36]. Additionally, HO-1, a gene dependent on NRF2, is markedly upregulated when exposed to lethal stimuli like oxidative stress [37]. Studies have shown that HO-1 expression is considerably elevated in the epilepsy model [38, 39]. This is consistent with the results we have obtained. Upregulation of HO-1 induces Fe2+ overload and ROS accumulation, thereby contributing to the initiation of ferroptosis [40]. Thus, activating NRF2 may enhance the expression of antioxidant enzymes, reducing oxidative stress and potentially alleviating seizures. In the present study, NRF2 expression was significantly reduced and HO-1 expression was markedly increased following Pilo-induced epilepsy. However, TUDCA treatment significantly elevated NRF2 expression and inhibited the upregulation of HO-1. At the cellular level, TUDCA treatment promoted NRF2 expression and facilitated its nuclear translocation. These findings suggest that activating NRF2 enhances cellular antioxidant capacity, contributing to the neuroprotective effects of TUDCA.
Ferroptosis, an iron-dependent form of cell death, is characterized by iron-catalyzed polyunsaturated fatty acid (PUFA) peroxidation, which leads to oxidative stress and subsequent cell death [14]. It is distinct from other cell death mechanisms such as autophagy, apoptosis, necroptosis, and pyroptosis [10, 41]. Numerous studies have implicated ferroptosis in the pathogenesis of various neurological disorders [42]. The key regulator of ferroptosis is GPX4, which plays a pivotal role in mitigating ROS accumulation and preventing lipid peroxidation under oxidative stress [43]. In an animal model, ferroptosis was found to occur in epilepsy, with a significant reduction in GPX4 expression in epileptic mice [44]. In line with these findings, our study demonstrated altered GPX4 expression in hippocampal tissue from pilocarpine-induced epileptic rats, as assessed by immunofluorescence and Western blot. This suggests that ferroptosis contributes to epilepsy pathogenesis, with TUDCA treatment notably reversing these changes. In glutamate-induced neuronal death models, CCK8 assays, immunofluorescence, and Western blot analyses provided further evidence that ferroptosis mediates neuronal death, and TUDCA administration mitigates this effect. These results imply that TUDCA attenuates seizures by inhibiting ferroptosis.
In conclusion, our study illustrates that TUDCA mitigates pilocarpine-induced epilepsy and neuronal damage. Additionally, our findings confirm that TUDCA exerts neuroprotective effects in epilepsy through the inhibition of ferroptosis, both in vivo and in vitro. This work supports the potential therapeutic application of TUDCA for epilepsy and provides a pharmacological foundation for the development of novel antiepileptic treatments. However, our research has some limitations and unresolved issues. Firstly, we only focused on the changes in neurons, in recent years, glial cells have been recognized to exert a crucial role in the pathogenic mechanisms of epilepsy [45]. Beyond their traditional role as passive structural and trophic providers for neurons, glial cells actively engage in neuronal physiological processes [46]. Secondly, clinical investigations are required to validate the therapeutic efficacy of TUDCA in patients diagnosed with epilepsy. Finally, our subsequent research will focus on the interaction between glial cell activation and neurons.
Overall, our in vivo and in vitro results indicate that TUDCA exerts neuroprotective effects on Pilo-induced epileptic rats and Glu-induced neuronal cells, which may be achieved by inhibiting ferroptosis. Our research discovered a new potential therapeutic target for antiepileptic treatment.
The datasets used and analyzed during the current study are available upon reasonable request from the corresponding author.
LW, FW and LL designed the work and wrote the manuscript. LW, JG and YL performed the experiments. LW, YL and BH analyzed the data. All authors contributed to editorial changes in the manuscript. All authors read and approved the final manuscript. All authors have participated sufficiently in the work and agreed to be accountable for all aspects of the work.
All animal procedures were performed in accordance with the NIH Guide for the Care and Use of Laboratory Animals and approved by the Medical Research Ethics Committee of Henan Polytechnic University (Permit Number: HPU2024-103).
We acknowledge the technicians who helped in animal housing.
This work was financially supported by the National Natural Science Foundation of China (grant no. 32300803), the 2023 Key Scientific and Technological Project of Henan Science and Technology Department (232102310148, 232102310259), the 2024 Key Scientific and Technological Project of Henan Science and Technology Department (242102310275), the Doctoral Fund Project of Henan Polytechnic University (B2021-68).
The authors declare no conflict of interest.
Supplementary material associated with this article can be found, in the online version, at https://doi.org/10.31083/JIN47186.
References
Publisher’s Note: IMR Press stays neutral with regard to jurisdictional claims in published maps and institutional affiliations.