


 , Itzamara Soto-Villanueva 1, Dafne A. Díaz-Piña 1, Vivian A. Chávez Pérez 1, Evelin V. Idiaquez-Hernández 1,2, Daniela Ávila-González 1, Néstor Fabián Díaz 1, Anayansi Molina-Hernández 1,*
1 Departamento de Fisiología y Desarrollo Celular, Instituto Nacional de Perinatología Isidro espinosa de los Reyes, Miguel Hidalgo, CP 11000 Ciudad de México, Mexico
2 Escuela de Medicina y Ciencias de la Salud, Instituto Tecnológico de Monterrey Campus Ciudad de México, CP 14380 Ciudad de México, Mexico
Abstract
Maternal diabetes increases the risk of neurodevelopmental alterations in the offspring, yet the molecular links to early corticogenesis remain unclear. During corticogenesis, radial migration is a coordinated process regulated by Reelin signaling and its disruption has been associated with abnormal cortical patterning. We reanalyze dorsal telencephalon transcriptomes from embryonic day 12 (E12) non-neural tube-defect rat embryos to identify canonical pathways perturbed by maternal hyperglycemia.
Gene expression profiles from the dorsal prosencephalon at E12 from control and streptozotocin-treated dams (50 mg/kg at E5.5) were interrogated with Ingenuity Pathway Analysis (IPA). We then assessed Reelin pathway components using quantitative reverse transcription polymerase chain reaction (RT-qPCR), immunohistochemistry, and immunoblotting at E12 and E16, and examined postnatal cytoarchitecture/morphology in the primary motor cortex (M1) at postnatal day zero (P0) and P21 using hematoxylin-eosin and Golgi-Cox staining. All analyses excluded embryos with neural tube defects (NTD) to avoid cofounding by gross malformations.
IPA revealed Reelin signaling in neurons as the only canonical pathway with a non-zero activation z-score, predicting inhibition in E12 embryos from diabetic rats. Concordantly, protein levels of Reelin (RELN), apolipoprotein E receptor 2/low-density lipoprotein receptor-related protein 8 (ApoER2/LRP8), very low-density lipoprotein receptor (VLDLR), and Disabled Homolog 1 (DAB1) were reduced at E12/E16 (all p < 0.05). N-cadherin (N-CAD) showed disrupted radial localization along the ventricular-pial axis despite unchanged total abundance, consistent with impaired neuron-radial glia adhesion/polarity. Postnatally, the M1 showed increased layer I cellularity, ectopic pyramidal neurons, and aberrant laminar organization.
Maternal hyperglycemia is associated with attenuation of the Reelin signaling pathway and N-CAD mislocalization, providing a mechanistic framework for defective neuronal migration and abnormal lamination that persist into early postnatal life. Focusing on NTD-negative embryos isolates the pathway-specific effects of maternal hyperglycemia and nominates Reelin-pathway hypofunction as a candidate driver of altered fetal cortical patterning.
Keywords
- experimental maternal diabetes mellitus
- fetal development
- mammalian cerebral cortex development
- Reelin signaling
- fetal programming
The neocortex acquires its characteristic six-layered architecture during embryogenesis through a highly orchestrated birth of successive cohorts of glutamatergic neurons in the ventricular germinal zones and their radial migration in an inside-out sequence. Early-born neurons settle in the deep layers (V-VI), whereas later-born neurons integrate in the superficial layers (II-IV), enabling precise synaptic connectivity [1].
Before cortical plate (CP) formation, Cajal-Retzius cells (CRs) arise from the cortical hem, septum, and ventral pallidum (pallial-subpallial boundary) and migrate tangentially to the marginal zone (MZ) of the cortical neuroepithelium by approximately embryonic day 10 (E10) in the rat [2, 3, 4], where they secrete Reelin (RELN), an extracellular matrix glycoprotein essential for neuroblast radial migration. RELN engages to very low-density lipoprotein receptor (VLDLR) and apolipoprotein E receptor 2 (ApoER2) on migrating neuroblasts and radial glia (RG) cells [5, 6, 7, 8], triggering DAB1 (Disabled Homolog 1) phosphorylation through Src-family kinases at least in three tyrosine residues, Y198, Y220, and Y232 [9, 10] to regulate cytoskeletal remodeling, adhesion and the migratory “stop” signal near layer I [11], likely through modulating the expression, localization, and activity of N-cadherin (N-CAD). This protein maintains RG polarity and mediates cell-cell adhesion between RG and migrating neuroblasts [7, 12].
The VLDLR is expressed in the soma and in the distal region of the neuroblast’s leading process (basal process), which will become the apical dendrite of pyramidal neurons [5, 8]. This receptor has been implicated in the migration of neuroblasts through the intermediate zone (IZ) to their final position near the marginal zone (MZ), thereby preventing the invasion of pyramidal neurons into layer I. VLDLR knockout (KO) mice showed ectopic neurons in the MZ and layer I [5, 6].
On the other hand, ApoER2 exhibits its highest expression in the subventricular zone (SVZ), where multipolar neuroblasts accumulate before migration. It has been suggested that its expression decreases as bipolar neuroblasts move through the RG. Hence, it has been postulated that ApoER2 expression might regulate neuroblast morphology before and during migration [8, 13].
Interestingly, RELN transgenic mice exhibit macro- and microstructural anomalies in the cerebral cortex, hippocampus, and cerebellum, as well as impaired dendritic development and cognitive deficits [14, 15, 16].
Maternal diabetes perturbs embryonic brain development. In a rat streptozotocin (STZ) model, we previously reported in non-neural tube defective embryos and offspring altered intermediate filament integrity of RG cells, disrupted neurogenesis, reduced RELN at the pial surface, and laminar disorganization in the primary motor cortex (M1), alongside polarity defects and decreased excitability in deep-layer pyramidal neurons [17, 18]. In humans, gestational diabetes is associated with motor and language development, increased risk for neurodevelopmental disorders [19, 20, 21], as well as autism and schizophrenia [22, 23, 24, 25].
Here, we hypothesized that maternal hyperglycemia impairs radial migration by attenuating RELN/DAB1 signaling and disrupting neuron-glia interactions. To specifically isolate pathway disruption from gross developmental delay, we focused our analysis exclusively on embryos without neural tube defects. We therefore: (1) reanalyzed the rat dorsal prosencephalon transcriptome at embryonic day 12 (E12; https://www.ebi.ac.uk/fg/annotare/, accession number E-MTAB-15111) using Ingenuity Pathway Analysis (IPA) to prioritize canonical pathways; (2) quantified RELN, ApoER2, VLDLR, and phospho- DAB1 (p-DAB1) at E12 and E16; (3) assessed N-CAD distribution and abundance, and (4) examined postnatal M1 cytoarchitecture and upper-layer neuron markers.
All experiments were carried out following the “Guide for the Care and Use of Laboratory Animals” (NIH 80-23, revised 1978), the Official Mexican Standard for the Production, Care, and Use of Laboratory Animals (NOM-062-ZOO-1999), ARRIVE guidelines, and were approved by the Institutional Committee for the Care and Use of Laboratory Animals (CICUAL) and the Research, Ethics, and Biosafety Committees of the Instituto Nacional de Perinatología (protocol 2018-1-146).
Adult Wistar rats (230–300 g) were obtained from the Animal Facility of the Instituto Nacional de Perinatología Isidro Espinosa de los Reyes (INPer), Mexico. Animals were housed (22
At E5.5, dams assigned to the diabetic group (Db) received a single
intraperitoneal dose of streptozotocin (STZ; 50 mg/kg; S0130-5G, Sigma-Aldrich, St. Louis,
MO, USA) dissolved in 100 mM citrate buffer (pH 6.4) prepared using citric acid (Cat. 40513, HYCEL, Zapopan, Jalisco, Mexico) and sodium citrate (Cat. 5584UB, Sigma-Aldrich). The pH was adjusted to 6.4 with NaOH. The control group (Ctrl) received the
vehicle. Glycemia was determined in both groups 48 h after induction and before
euthanasia, using a drop of blood obtained by puncture of the caudal vein and an
electronic glucometer (Accu-Chek Performa, Roche, Basel, Switzerland). Rats with
glycemia
For embryonic tissue collection (E12 and E16), pregnant rats were deeply anesthetized with sevoflurane at 4.5% (S2912J17, Savannlab®, Piramal Critical Care, Inc., Bethlehem, PA, USA) until loss of reflexes and then euthanized by decapitation. The embryos were immediately removed and rapidly processed to prevent contamination, and then fixed or dissected for the collection of prosencephalon/dorsal telencephalon tissue at 4 °C using sterile solutions. For postnatal stages (P0 and P21), pups were euthanized by decapitation using a rodent guillotine. Decapitation was selected to prevent chemical contamination of brain tissue, which is critical for downstream molecular and histological analyses of neurodevelopment. All procedures, including euthanasia, were performed by trained personnel using sharp, calibrated instruments.
Pregnant dams were deeply anesthetized with sevoflurane (4.5%, S2912J17, Savannlab®, Piramal Critical Care, Inc.) until complete loss of reflexes, confirmed by the absence of corneal reflexes and response to tail pinch, and were subsequently euthanized by decapitation using a sharp, calibrated guillotine at E12 and E16. All procedures were performed by trained personnel. Embryos were recovered by cesarean section, washed with sterile PBS (4 °C), and fixed by immersion in sterile Bouin’s solution (15:15:1 saturated picric acid solution (SPC-P1145-500G, Spectrum Chemicals, New Brunswick, NJ, USA): 40% formalin (P6148, Sigma-Aldrich): glacial acetic acid (1005706, Sigma-Aldrich). For paraffin histology and immunofluorescence at embryonic stages, tissue was dehydrated by sequentially placed in alcohol gradients of 70%, 80%, 90%, 96%, and 100% for 1 h each, passed to xylol-alcohol 1 h, xylol for 5 min, and embedded in paraffin (Paraplast®, Leica Biosystem, Richmond, IL, USA) for 4 h. Coronal sections (10 µm) containing the prosencephalon/telencephalon were obtained using a microtome (MICROM320, Heidelberg Instruments, Heidelberg, Germany) and recovered in glass slides coated with Poly-L-lysine (P8920, Sigma-Aldrich).
Neonates (postnatal day zero; P0) and P21 offspring were euthanized by decapitation; brains were fixed by immersion in Bouin’s solution, cryoprotected in 30% sucrose, embedded in TissueTek, frozen, and 10 µm coronal sections were obtained using a cryostat (Leica CM1850 UV, Wetzlar, Germany) to sample the primary motor cortex (M1).
Sections were washed three times for 10 min in PBS, permeabilized, and blocked (PBS, 10% normal goat or horse serum, and 0.3% Triton X-100; 1 h), and then treated with TrueBlack (23007, Biotium, Hayward, CA, USA) to quench autofluorescence. Primary antibodies (Table 1) were incubated overnight at 4 °C in PBS containing 10% serum, followed by washes and incubation with species-appropriate secondary antibodies (Table 2) for 1 hour at room temperature. Nuclei were counterstained with 4′,6-diamidino-2-phenylindole (DAPI; 1 µg/mL, 8 min, D9542, Sigma-Aldrich), washed, and mounted in Aqua Poly/mount (Polyscience, 18606-100, Warrington, PA, USA).
| Antibody | Functional description | Dilution (IF) | Dilution (WB) | Host | Supplier and catalog no. |
| Reelin | Stop signal for migrating neuroblast | 1:100 | - | Mouse | Millipore |
| MAB5364 | |||||
| VLDLR | Reelin receptor | 1:200 | 1:30 | Mouse | Santa Cruz |
| 18824 | |||||
| ApoER2 | Reelin receptor | 1:500 | 1:250 | Rabbit | Abcam |
| Ab108208 | |||||
| P-DAB1 (Tyr 232) | Reelin effector protein | 1:30 | 1:125 | Rabbit | My BioSource |
| MBS9600801 | |||||
| N-Cadherin | Adhesion Molecule | 1:200 | 1:250 | Rabbit | GeneTex |
| GTX127345 | |||||
| cytoskeletal protein used as an internal control | - | 1:1000 | Rabbit | GeneTex | |
| GTX109639 | |||||
| cytoskeletal protein used as an internal control | - | 1:1000 | Mouse | GeneTex | |
| GTX82559 |
IF, immunohistofluorescence; WB, western blot; VLDLR, very low-density lipoprotein receptor; ApoER2, apolipoprotein E receptor 2; DAB1, disabled homolog 1.
| Antibody | Dilution (IF) | Dilution (WB) | Host | Species Reactivity | Supplier and catalog no. |
| AlexaFluor 488 | 1:1000 | - | Goat | Rabbit | ThermoFisher |
| A11034 | |||||
| AlexaFluor 568 | 1:1000 | - | Goat | Mouse | ThermoFisher |
| A11031 | |||||
| AlexaFluor 568 | 1:1000 | - | Goat | Rabbit | ThermoFisher |
| A11036 | |||||
| IRDye 800CW | - | 1:10,000 | Goat | Rabbit | LICORbio |
| IRDye 926-32211 | |||||
| IRDye 800RD | - | 1:10,000 | Goat | Mouse | LICORbio |
| 926-32210 | |||||
| IRDye 680RD | - | 1:10,000 | Goat | Mouse | LICORbio |
| 926-68070 | |||||
| IRDye 680RD | - | 1:10,000 | Goat | Rabbit | LICORbio |
| 926-68071 | |||||
| IRDye 800CW | 1:200 | - | Donkey | Rabbit | LICORbio |
| 926-32213 | |||||
| IRDye 800CW | 1:200 | - | Donkey | Mouse | LICORbio |
| 926-32212 | |||||
| IRDye 680RD | 1:200 | - | Donkey | Mouse | LICORbio |
| 926-68072 | |||||
| IRDye 680RD | 1:200 | - | Donkey | Rabbit | LICORbio |
| 926-68073 |
Quantitative immunofluorescence for VLDLR and ApoER2 was performed using an infrared scanner system (Odyssey CLx; LICORbio, Lincoln, NE, USA) and the Image Studio version 4.0 software (LICORbio). Six consecutive coronal sections per litter (experimental unit; n) were analyzed, for a total of n = 4 per group. The fluorescent signal obtained for each receptor was normalized using DRAQ5 (1, 5-bis{[2-(di-methylamino)ethyl]amino}-4, 8-dihydroxyanthracene-9, 10-dione. 5 µM; 1:1000, ab108410, Abcam, Cambridge, UK), and the results were expressed as a percentage of the Ctrl group. Representative images were processed using Adobe Photoshop CS6 (Adobe Inc., San Jose, CA, USA).
The dorsal telencephalon at E16 was micro-dissected and pooled from four embryos
per litter to yield a sample size of n = 1, for a total n = 3 per group. Tissue
was homogenized using a Polytron PT 2100 homogenizer (Kinematica, Malters,
Switzerland) in a lysis buffer (HEPES 20 mM, MgCl 2 1.5 mM, KCl 10 mM, DTT 1 mM)
containing a protease and phosphatase inhibitor cocktail (A32961, Thermo
Scientific, Waltham, MA, USA). After centrifugation (13,000
Proteins were transferred to nitrocellulose membranes (AmershamTM Hybond TM-ECL,
Buckinghamshire, UK), using the Trans-Blot R semi-dry transfer cell system
(Bio-Rad) as previously described (Villanueva, 2008), unspecific antibodies
binding was blocked with a commercial TBS blocking buffer (927-60001, LICORbio),
incubated overnight at 4 °C with the primary antibodies (Table 1),
membranes were washed and incubated with the following LICORbio infrared
antibodies (Table 2). The corresponding bands were quantified using ImageStudio
software version 4.0 (LICORbio). Signals were normalized to
To assess potential invasion of layer I (molecular layer) by neurons, coronal sections from male offspring (P0 and P21; n = 3) brains were stained with hematoxylin-eosin following standard protocols. Neuronal identity and morphology were evaluated using FD Rapid GolgiStain™ (PK401, FD Neurotechnologies, Columbia, MD, USA) on coronal sections (P0: 60 µm; P21: 20 µm) following the manufacturer’s instructions.
Micrographs from both preparations were obtained at a 10
Because the Golgi-Cox impregnation labels only a random subset of neurons, we used these sections strictly to identify the neuronal phenotype (pyramidal morphology) and to estimate relative increase in ectopic pyramidal neurons in layer I, while absolute cellularity was quantified separately from H&E sections. The method provides high-resolution visualization of the soma, dendritic arbors, and spines in a sparsely labeled population, yielding semi-quantitative information on neuronal morphology and distribution. To minimize selection bias, sampling was uniform across groups, using matched rostro-caudal levels and cortical regions, identical ROI (region of interest) dimensions, and fixed acquisition parameters.
Analyses were performed blinded to the group, with predefined inclusion/exclusion criteria (complete impregnation and intact soma), and results are reported as per-ROI estimates.
Differential expression results from the dorsal prosencephalon (E12, Ctrl vs Db)
previously analyzed with ShinyGO v0.741
(https://bioinformatics.sdstate.edu/go74/) [21] were reanalyzed in IPA (Qiagen;
Redwood City, CA, USA) to identify canonical pathways, upstream regulators, and
disease/function annotations. Significance was assessed by Fisher’s exact test
(–log p
Data are presented as mean
The IPA analysis of E12 dorsal prosencephalon transcriptome from Ctrl and Db pregnant rats [27] revealed 235 genes differentially expressed (129 downregulated and 106 upregulated; Supplementary Table 1). Proteins encoded by these genes are predominantly localized to the cytoplasm, nucleus, and plasma membrane (Fig. 1A), and are enriched for enzymes and transcription regulators, among others (Fig. 1B and Supplementary Table 1). Of the 13 Ingenuity canonical pathways detected, Reelin Signaling in Neurons was the only pathway with a non-zero z score and a significant but modest enrichment (–log p value = 1.45), with a negative z score predicting inhibition in the Db group (Fig. 1B, Table 3). This pathway falls within the categories of “Neurotransmitters and Other Nervous System Signaling; Organismal Growth and Development” IPA disease/functions annotations highlighted “Cell Morphology; Cellular Assembly and Organization; and Cellular Development” (Supplementary Table 2), supporting a model of impaired neuronal migration during corticogenesis in embryos from Db rats.
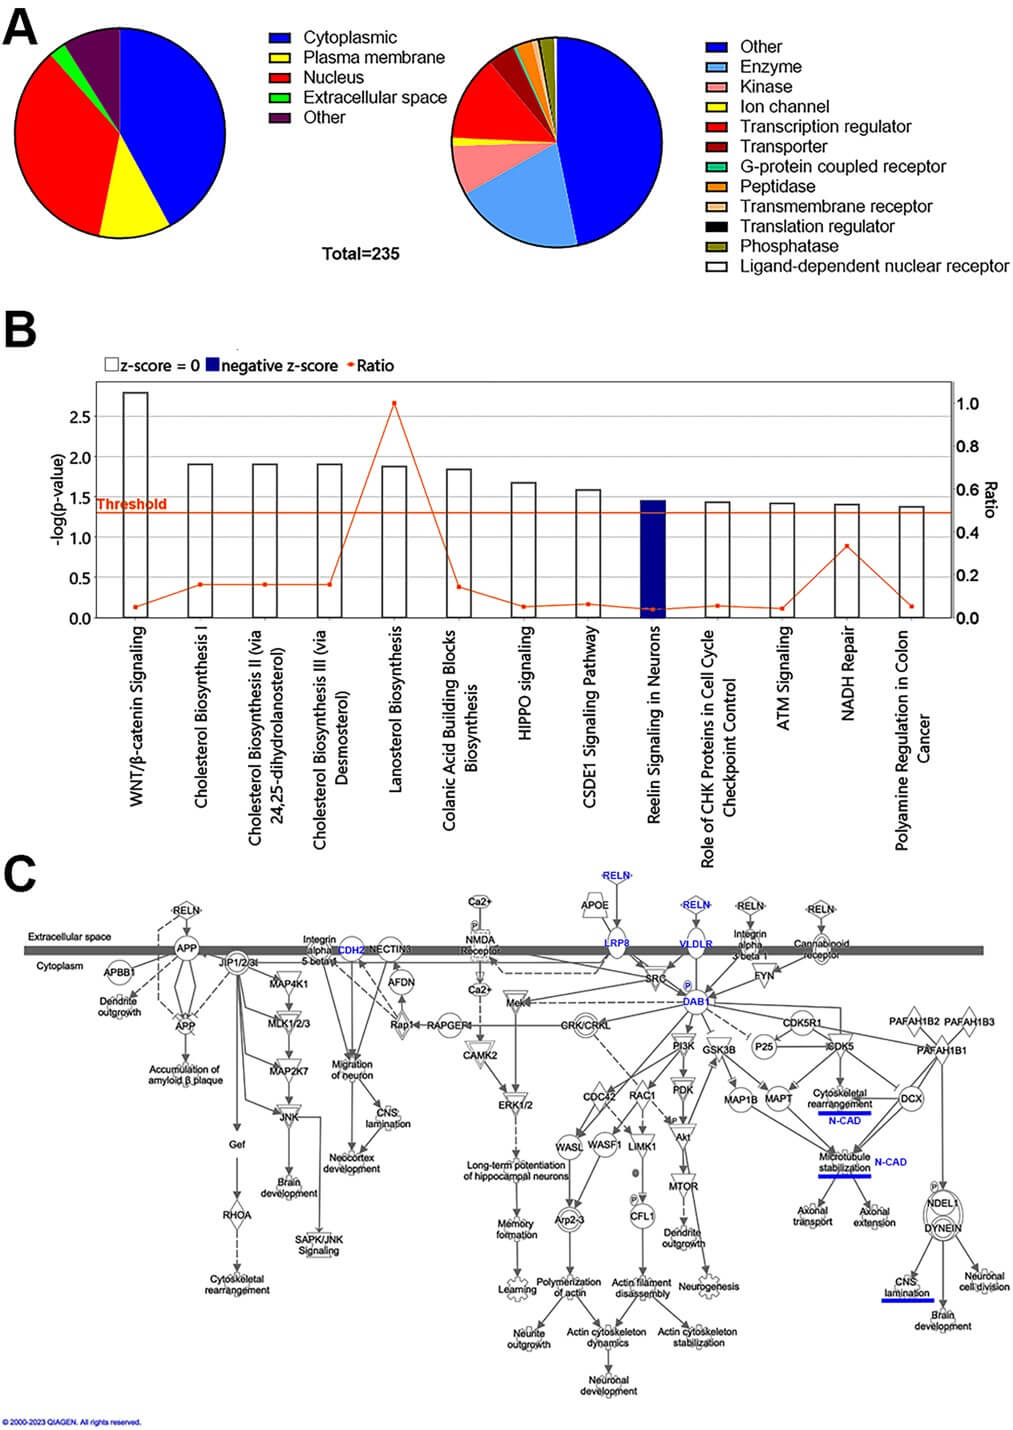 Fig. 1.
Canonical pathway enrichment highlights predicted inhibition of Reelin signaling at E12 in embryos from diabetic dams. (A) Pie charts showing subcellular localization (left) and protein classes (right) for the 235 differentially expressed genes in dorsal prosencephalon at E12 (diabetic vs control). (B) Ingenuity Pathway Analysis (IPA) of canonical pathways. Bars show –log p (left y-axis); the horizontal orange line marks the significance threshold (–log p = 1.3; i.e., p = 0.05). Bar color indicates predicted activation state from IPA z-scores: orange, positive z (predicted activation); blue, negative z (predicted inhibition); white, z = 0 (no prediction). The right y-axis shows the ratio of differentially expressed genes in our dataset to all genes in each pathway. (C) Schematic of the IPA Reelin signaling pathway derived from the transcriptomic analysis. Nodes are color-coded by fold-change (red, up; green, down). Key regulators of migration and polarity that were experimentally validated are highlighted in blue: Reelin (RELN), phosphorylated (PDAB1), ApoER2/LRP8, VLDLR, and N-Cadherin/Cadherin-2 (N-CAD/CDH2). Solid lines depict curated direct interactions; dashed lines represent indirect or predicted associations in the IPA knowledge base.
| Ingenuity Canonical Pathways | –log p | Ratio |
| Wnt/ |
2.79 | 0.0488 |
| Cholesterol Biosynthesis I | 1.90 | 0.1540 |
| Cholesterol Biosynthesis II (via 24,25-dihydrolanosterol) | 1.90 | 0.1540 |
| Cholesterol Biosynthesis III (via Desmosterol) | 1.90 | 0.1540 |
| Lanosterol Biosynthesis | 1.87 | 1.0000 |
| Colanic Acid Building Blocks Biosynthesis | 1.84 | 0.1430 |
| Hippo signaling | 1.67 | 0.0506 |
| CSDE1 Signaling Pathway | 1.58 | 0.0625 |
| Reelin Signaling in Neurons | 1.45 | 0.0368 |
| Role of CHK Proteins in Cell Cycle Checkpoint Control | 1.43 | 0.0545 |
| ATM Signaling | 1.42 | 0.0421 |
| NADH Repair | 1.40 | 0.3330 |
| Polyamine Regulation in Colon Cancer | 1.37 | 0.0517 |
CSDE1, cold shock domain containing E1; CHK, checkpoint kinase 1; ATM, ataxia-telangiectasia mutated; NADH, nicotinamide adenine dinucleotide (reduced form).
The Reelin signaling in Neurons pathway diagram in IPA (Fig. 1C) centers on RELN binding to its canonical receptors ApoER2 (LRP8; low-density lipoprotein receptor-related protein 8) and very low-density lipoprotein receptor (VLDRL), which engage intracellular cascades controlling neuronal migration, cortical lamination, cytoskeleton dynamics, differentiation, and dendritic growth. IPA also depicts functional interaction with additional membrane proteins/pathways (e.g., APP; amyloid precursor protein, integrins, selected GPCRs; G protein-coupled receptors), which modulate but are not primary RELN receptors. Although few pathway nodes were transcriptionally altered in our dataset (e.g., downregulation of CAMK2; calcium/calmodulin-dependent protein kinase type II, and AKT; protein Kinase B), these results prioritized post-transcriptional or post-translational defects in RELN signaling for experimental validation. We therefore evaluated RELN, ApoER2, VLDLR, activated Dab1 (p-DAB1), and the distribution of N-CAD in the cortical neuroepithelium at E12 (the onset of pyramidal neurogenesis/migration) and E16 (mid-corticogenesis) [28].
At E12, immunofluorescence showed RELN mark and p-DAB1 in Ctrl cortical
neuroepithelium, consistent with active RELN signaling (Fig. 2A–D). In embryos
from the Db group, both marks were reduced, indicating a substantial decrease in
the activation of this pathway (Fig. 2B). Quantification demonstrated decreases
from 100
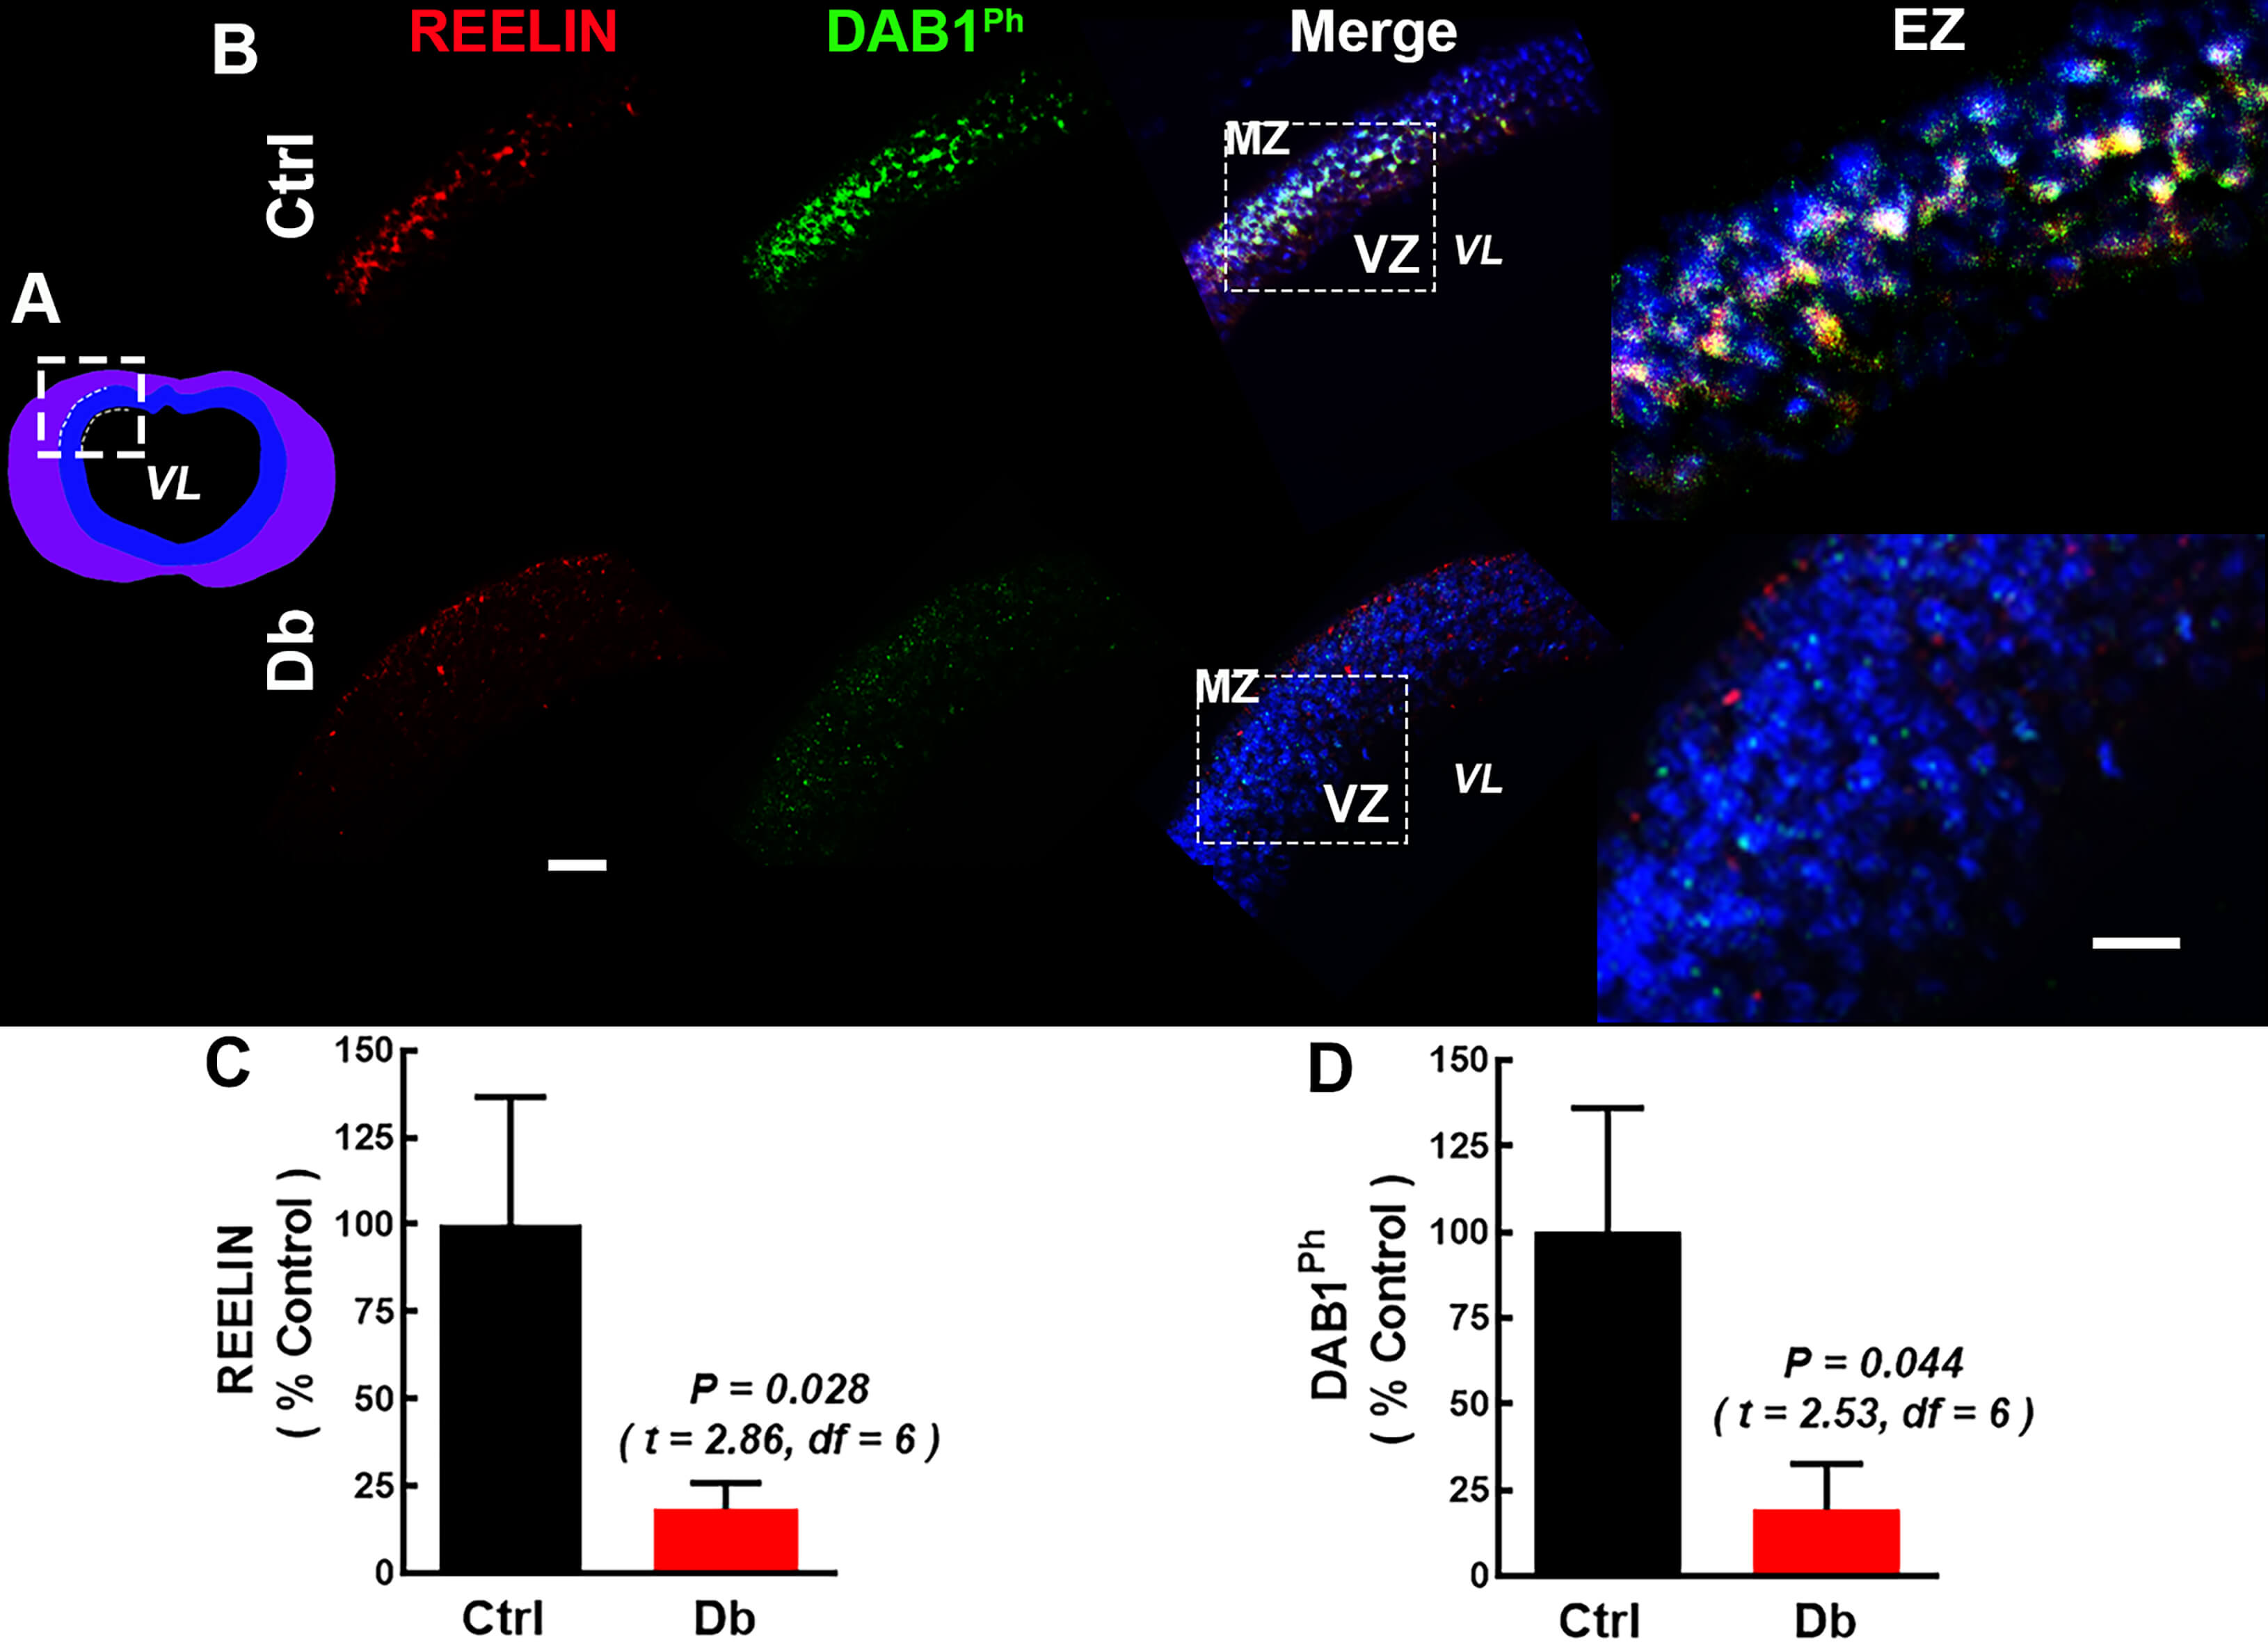 Fig. 2.
Reelin and p-DAB1 are reduced in the dorsal prosencephalon at
E12 in embryos from diabetic dams. (A) Schematic coronal view of the rat
forebrain at E12; the white dashed box marks the dorsal region analyzed. (B)
Representative 20
To determine if this deficit persisted, we examined E16 telencephalon (Fig. 3A–D). In the Ctrl, RELN labeling extended from the basal to apical regions
without reaching the VZ. In the Db group, RELN labeling was scarce along the
cortical neuroepithelium, reduced to 26.2
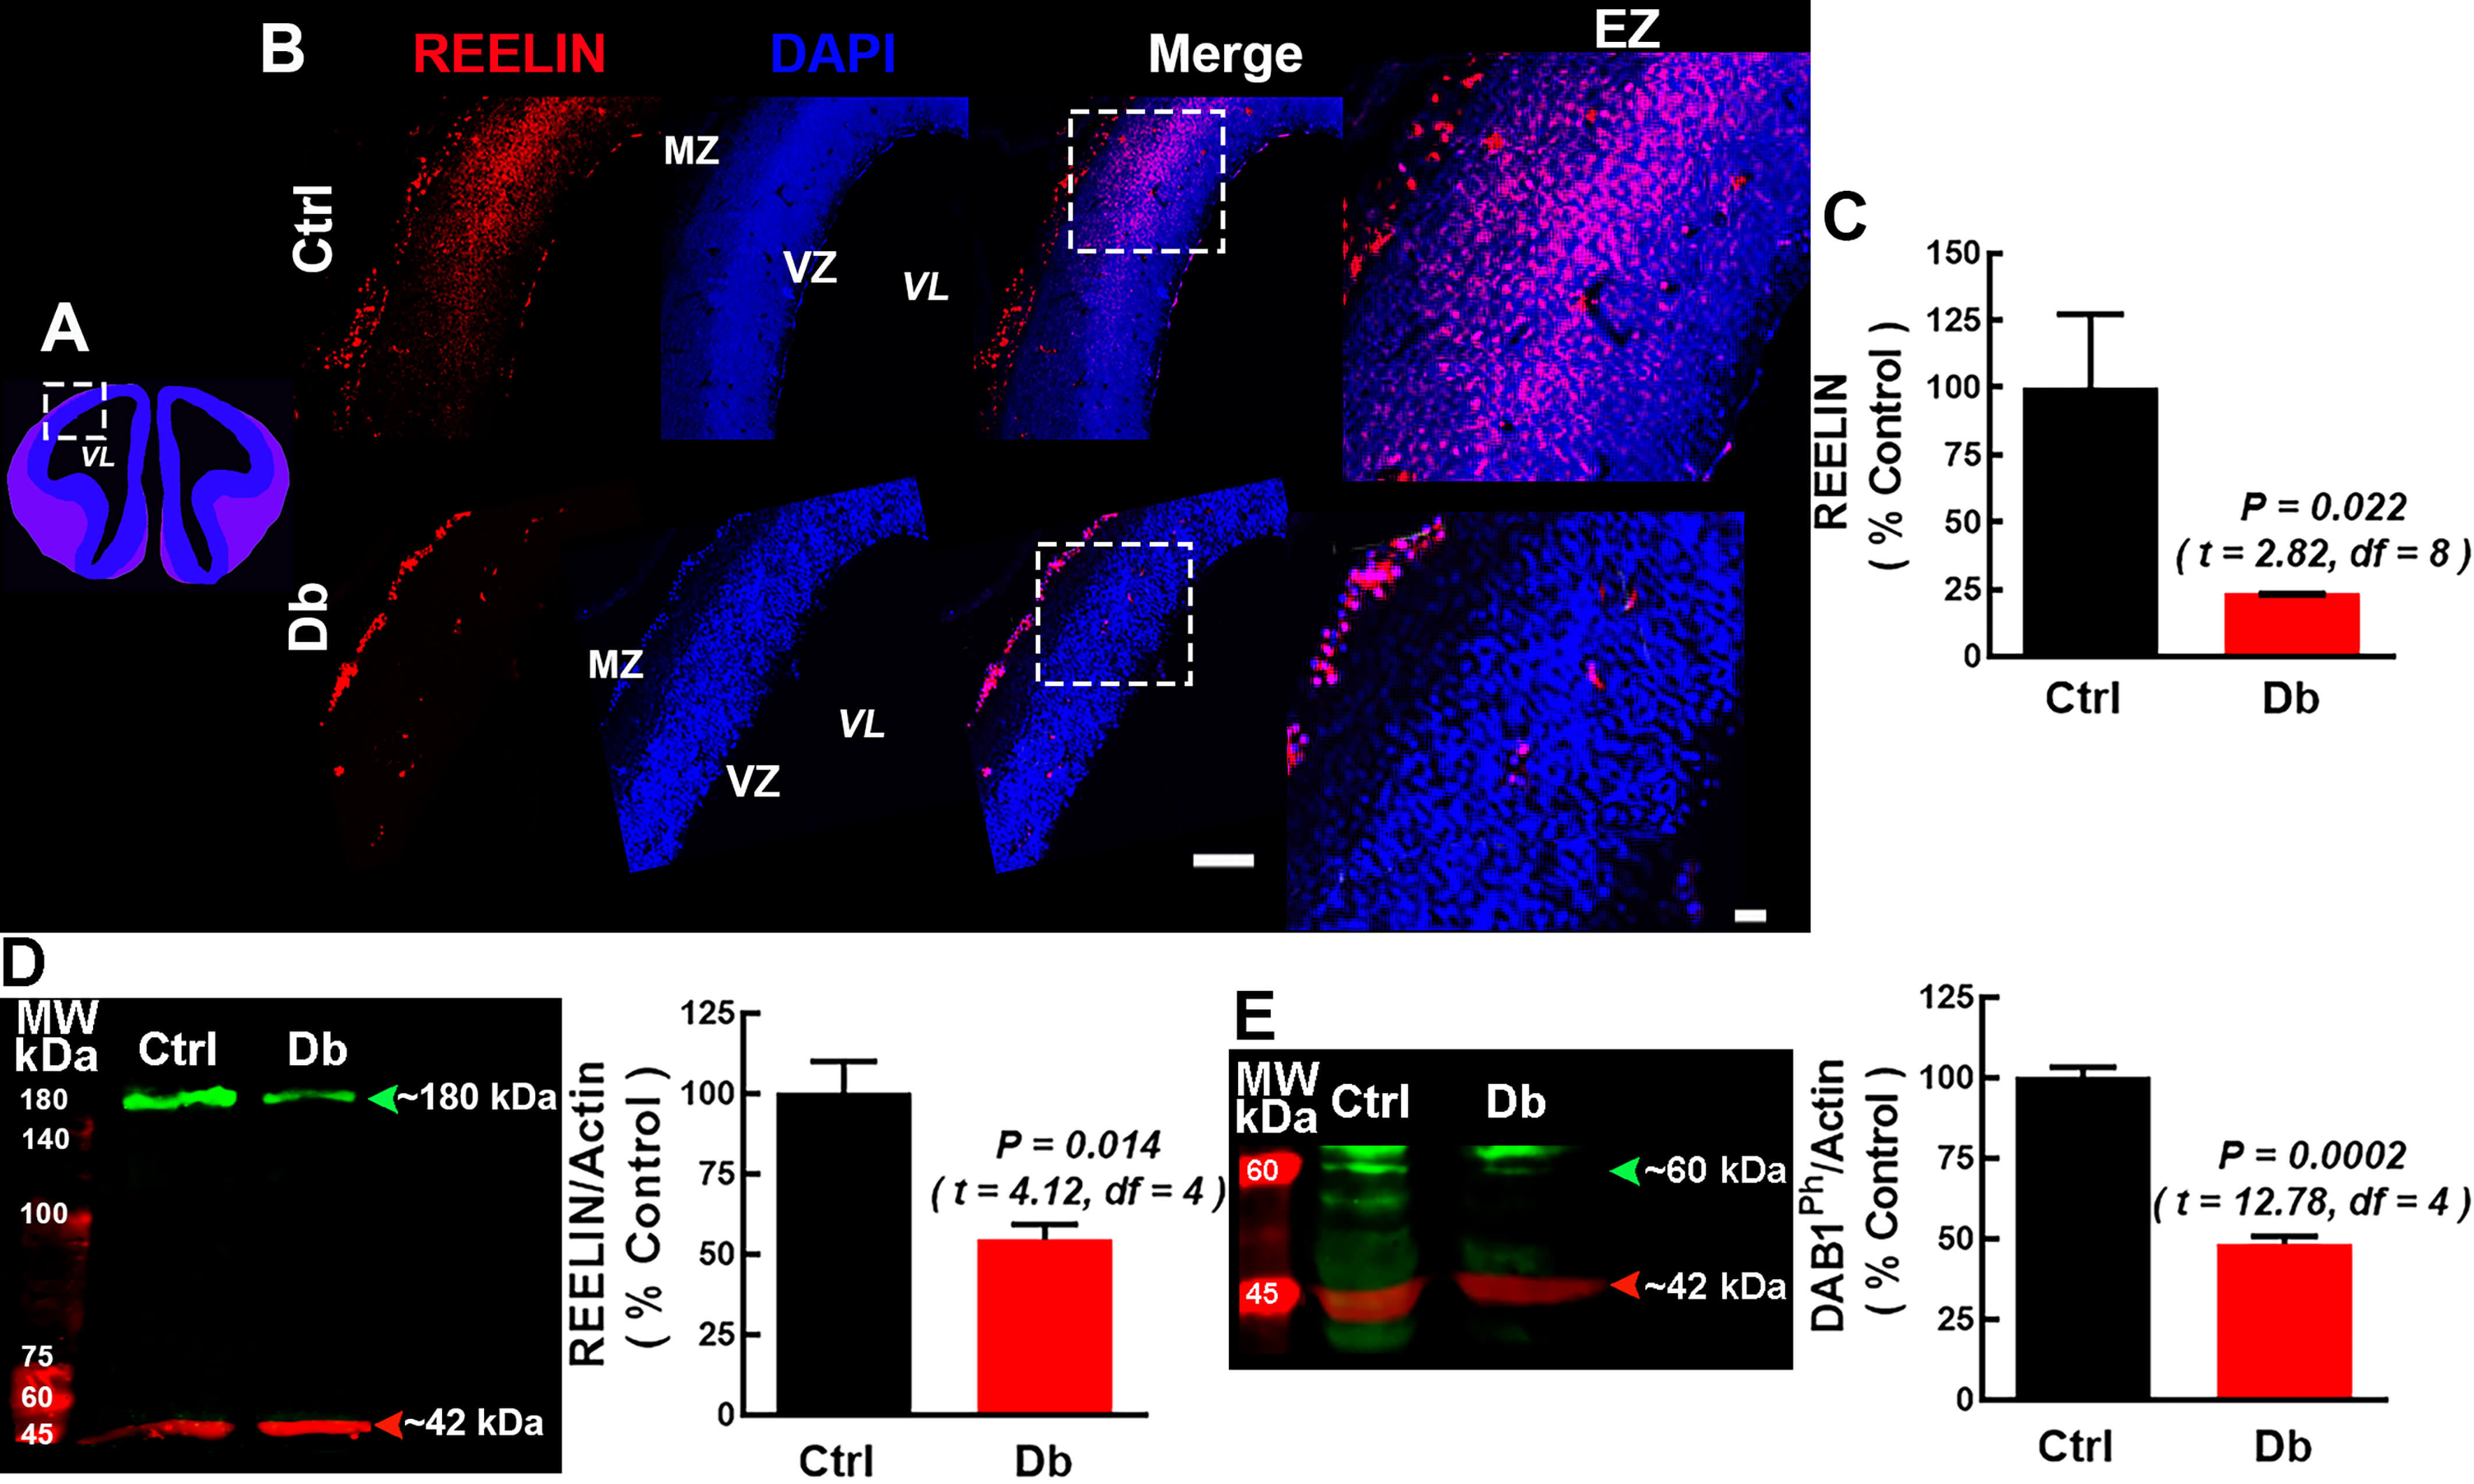 Fig. 3.
Reelin/p-DAB1 is attenuated at E16 in embryos from diabetic
dams. (A) Schematic coronal view of the rat telencephalon at E16; dashed box
indicates the analyzed region. (B) Representative 10
Because RELN regulates neuron-RG adhesion and polarity [29, 30], we evaluated
N-CAD at E16 (Fig. 4). In the Ctrl, N-CAD exhibited a radial pattern, enriched at
apical (VZ) and basal (MZ) neuroepithelium, consistent with expression in RG and
migrating neuroblasts (Fig. 4A). In the Db group, N-CAD radial pattern was
disrupted with a pronounced reduction of its immunofluorescence signal within the
cortical neuroepithelium (8.2
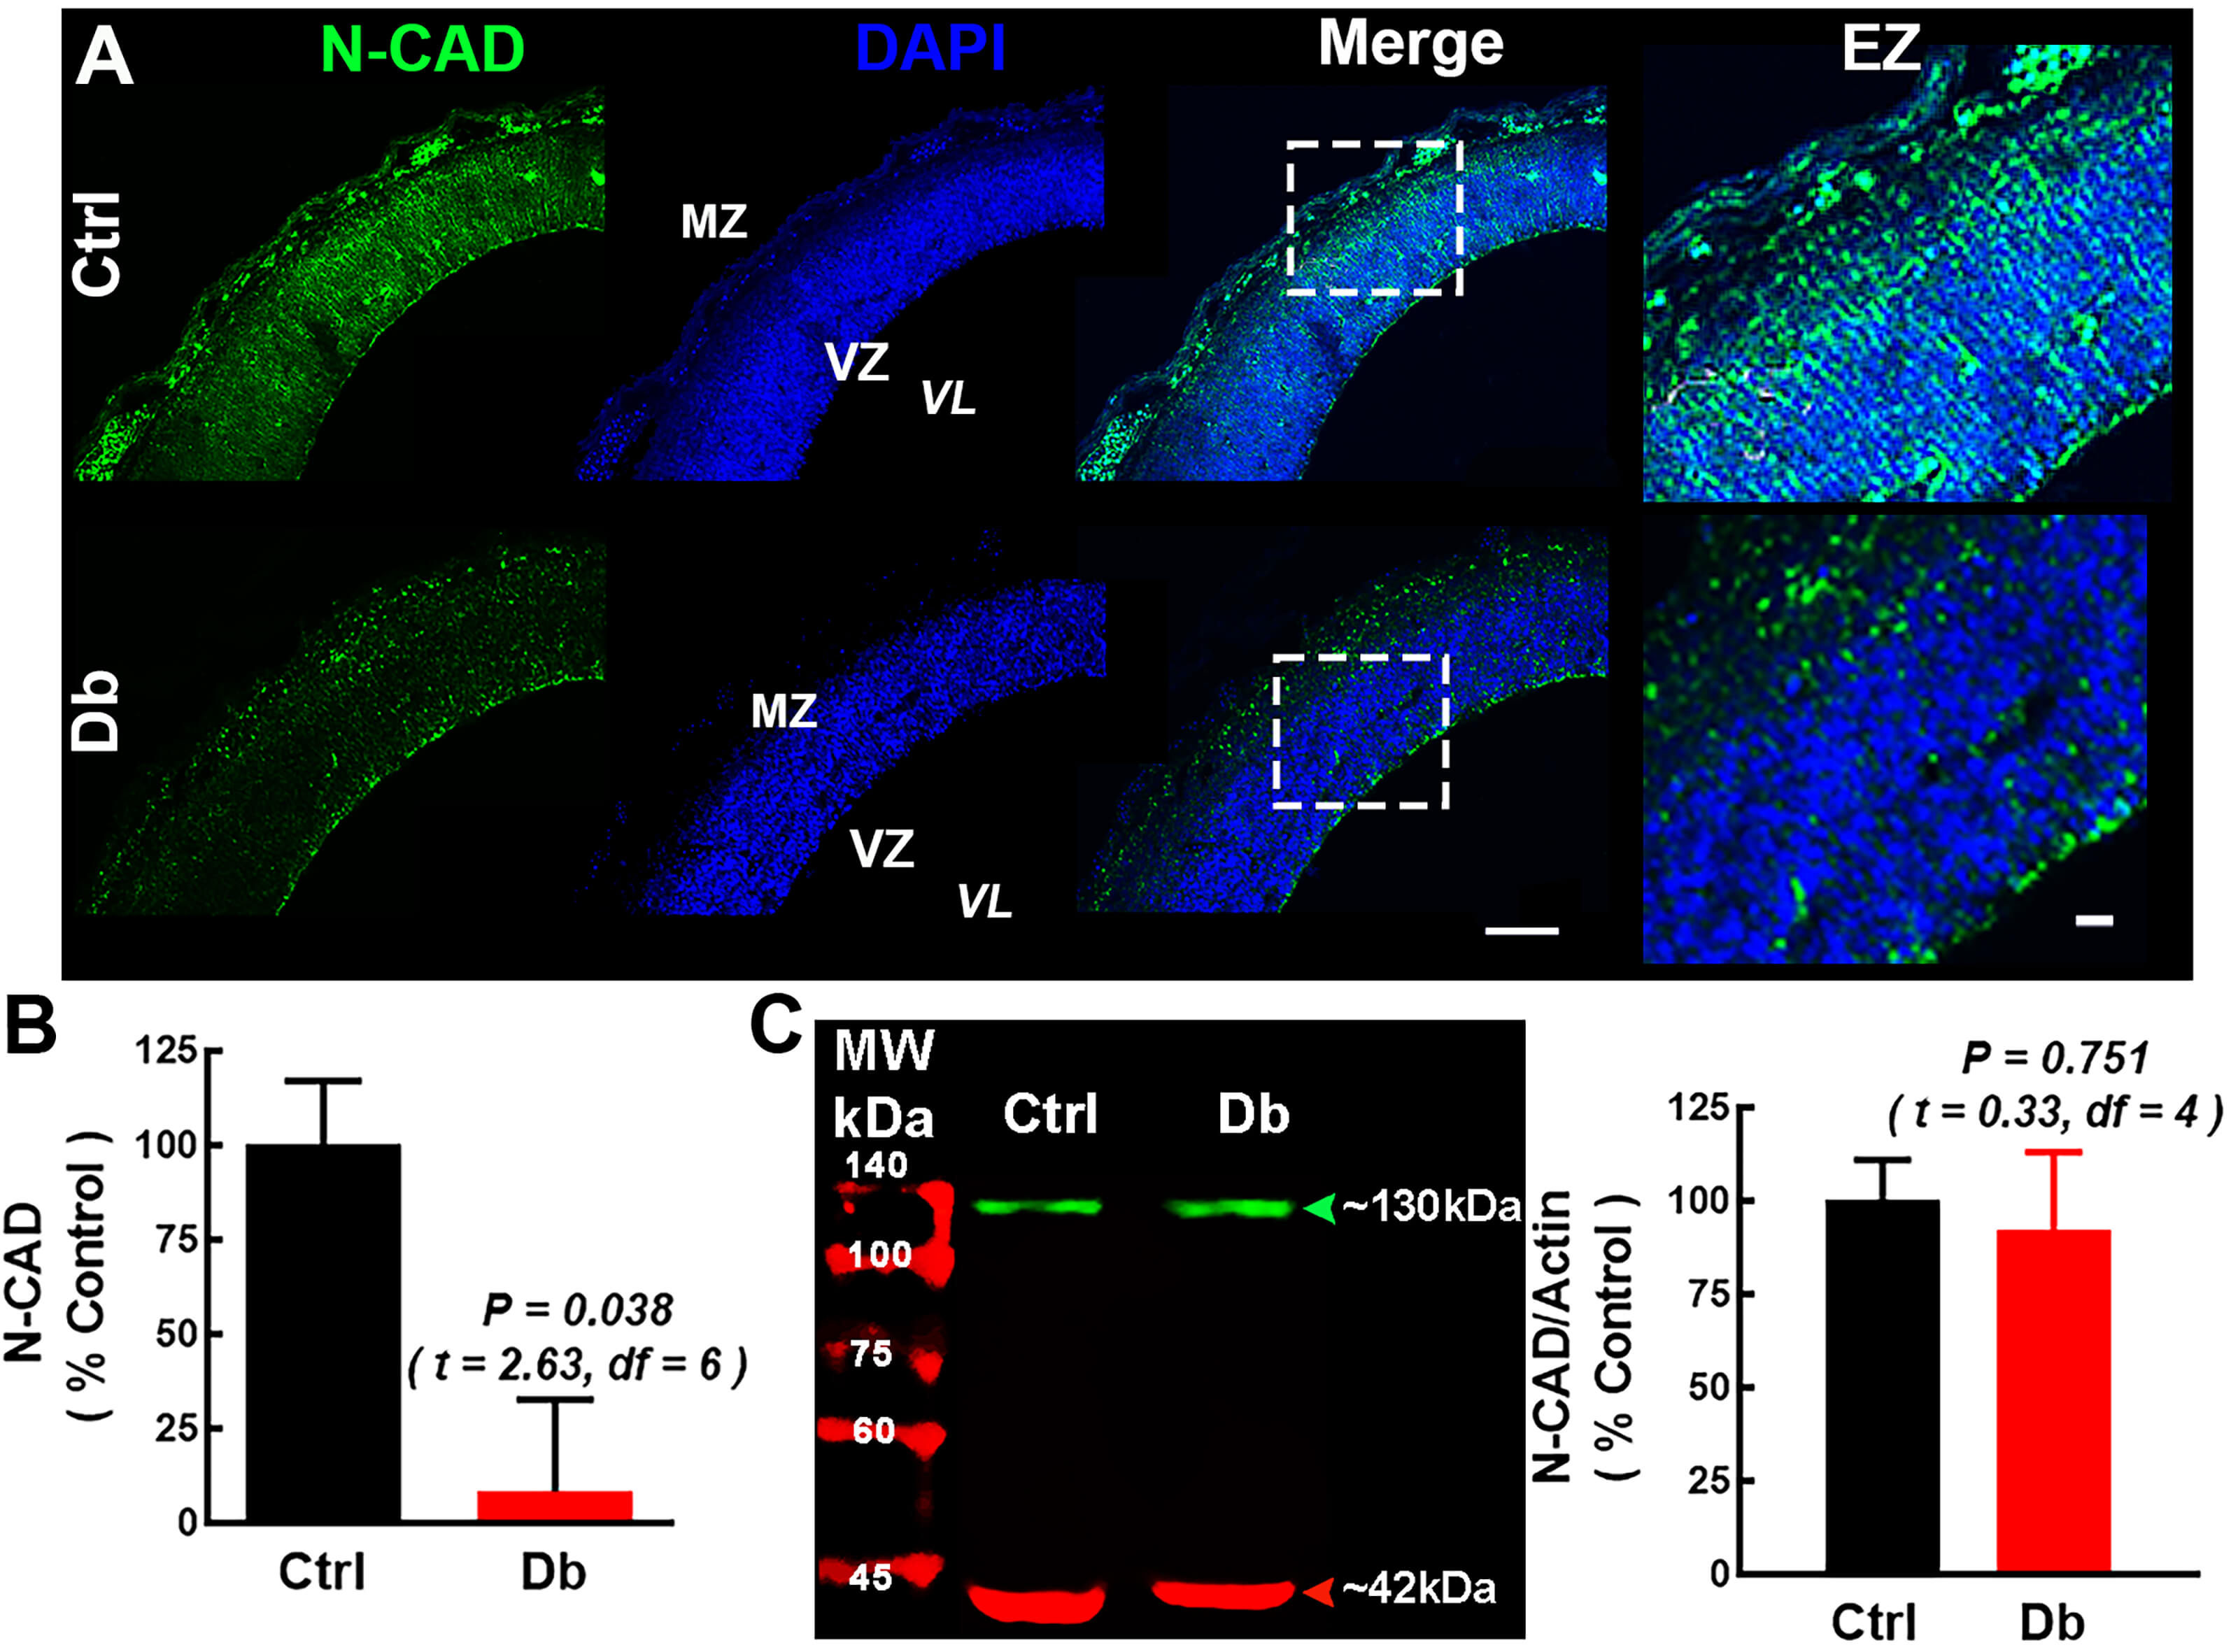 Fig. 4.
N-Cadherin mislocalization at E16 in embryos from diabetic
dams. (A) Representative 10
We next quantify RELN receptors at E16 by immunofluorescence and Western blot
(Fig. 5A–F and Fig. 6A–F). ApoER2 was decreased in the Db group relative to the
Ctrl by both immunofluorescence (17.1
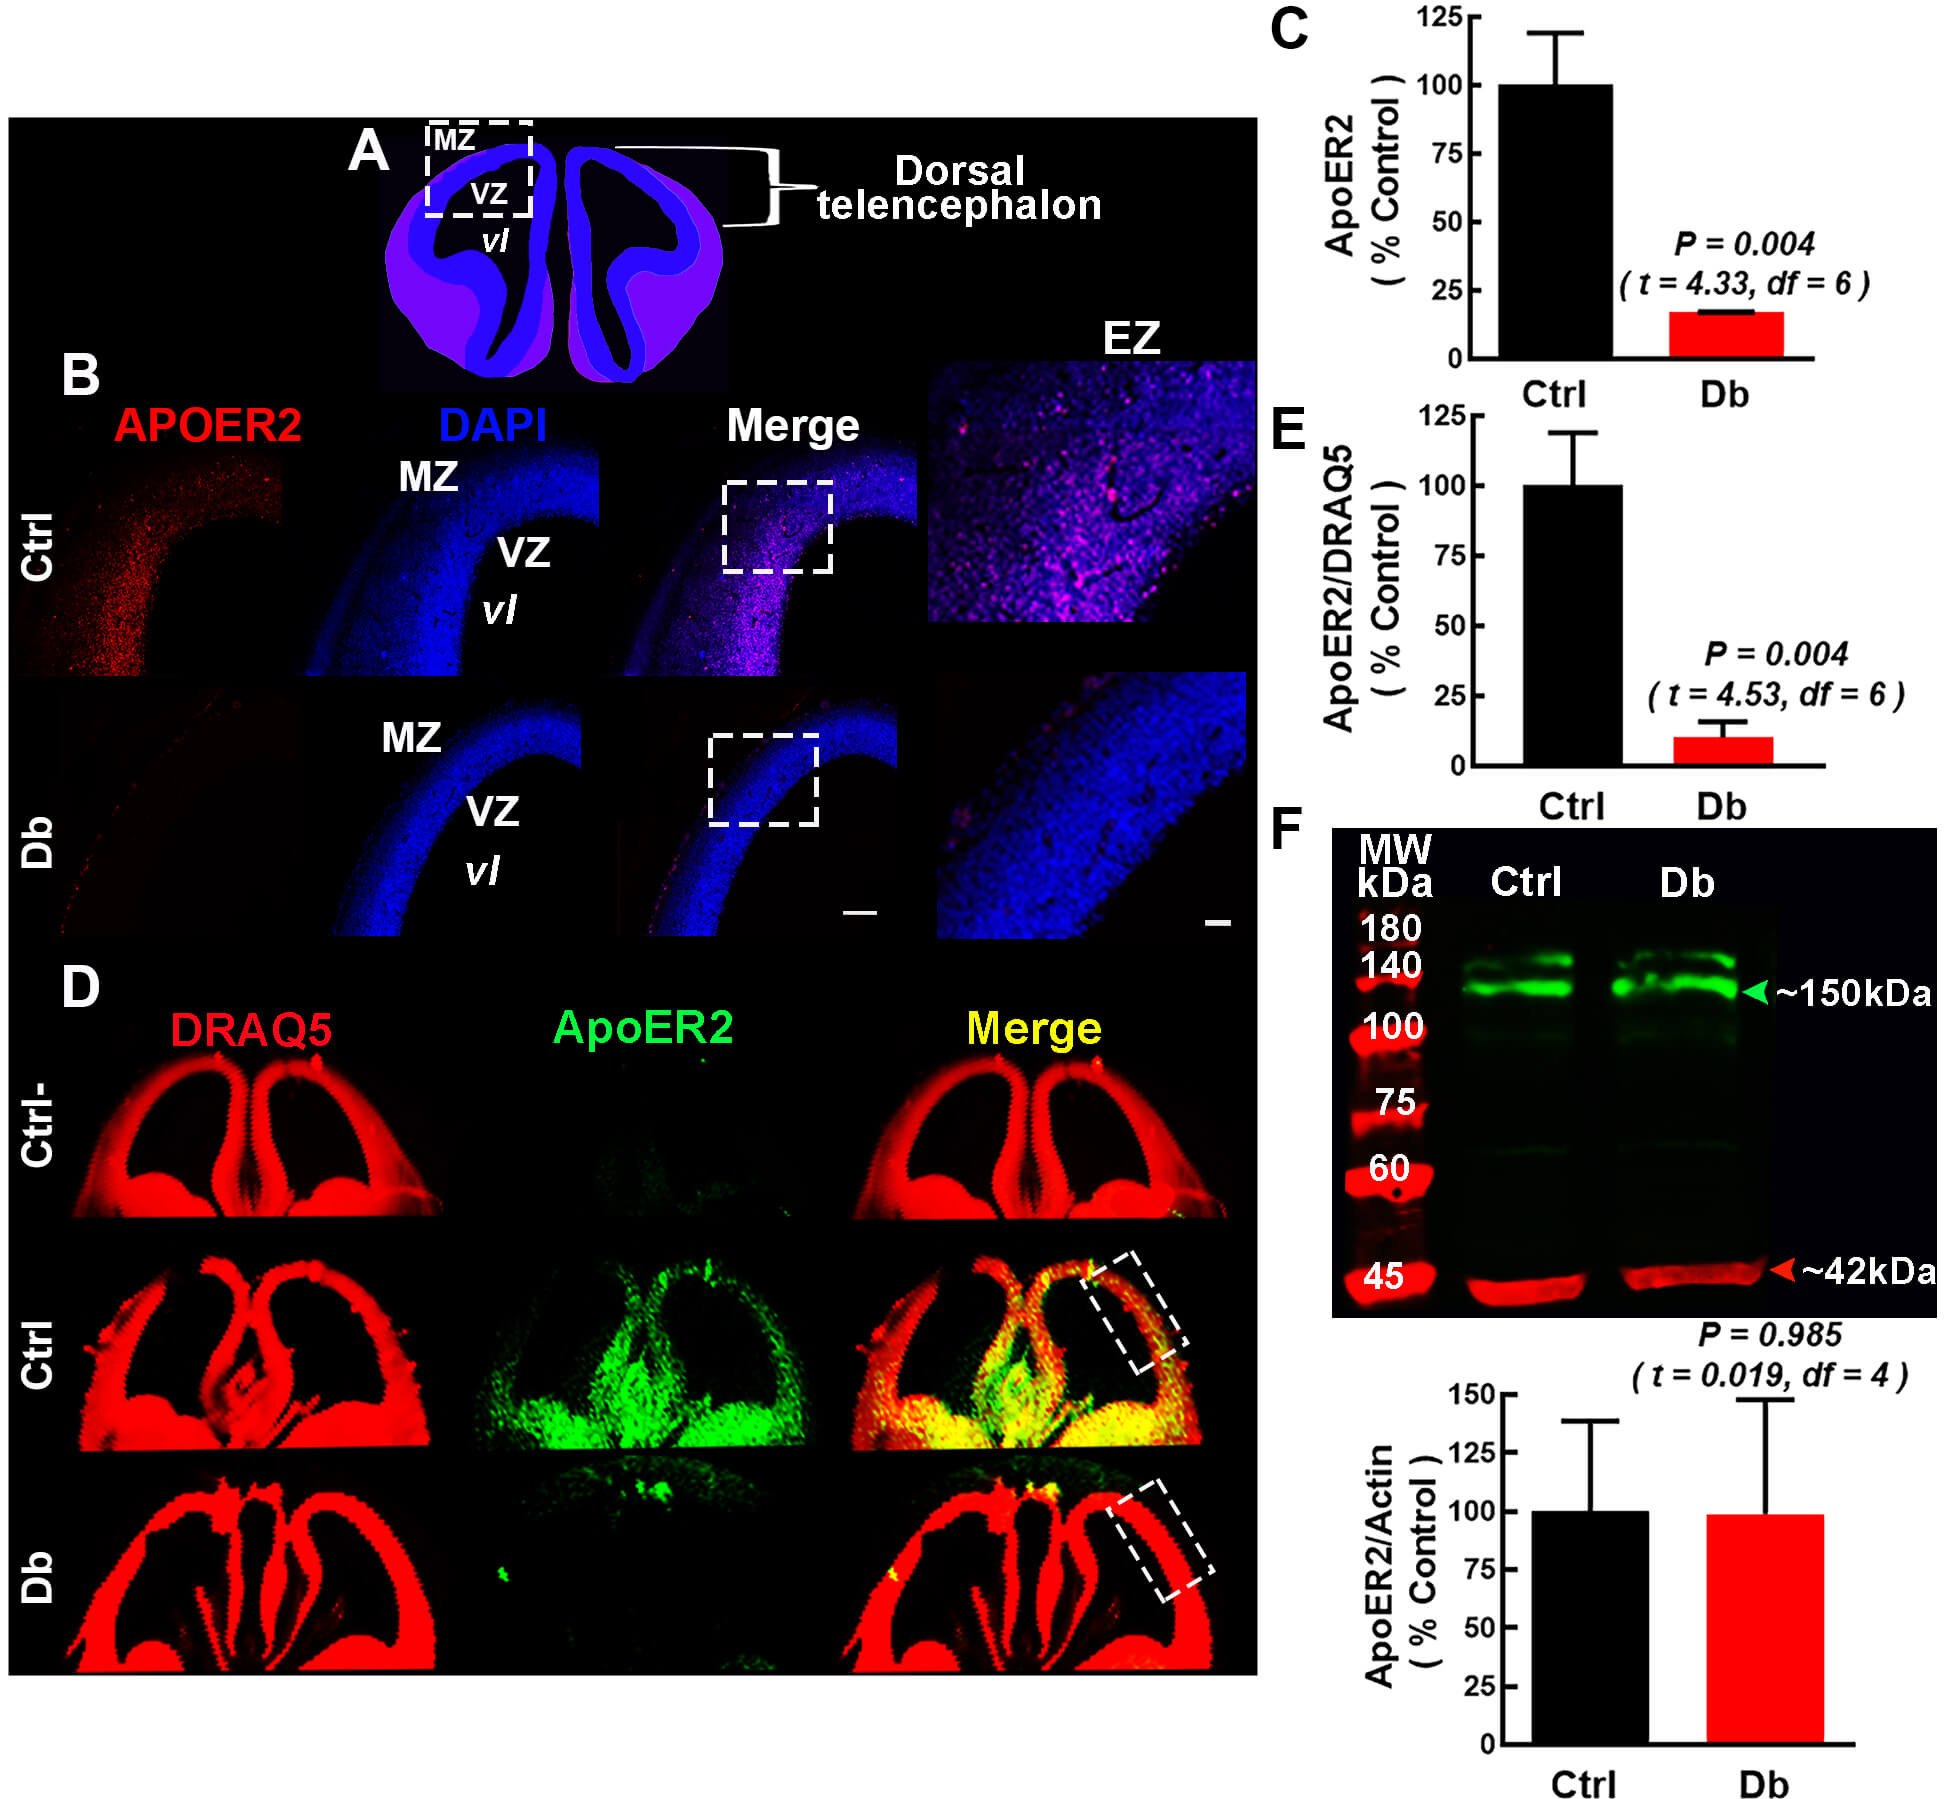 Fig. 5.
ApoER2/LRP8 is decreased at E16 in embryos from diabetic dams.
(A) Schematic coronal view of E16 telencephalon; dashed box marks the region of
intrest. (B) Representative 10
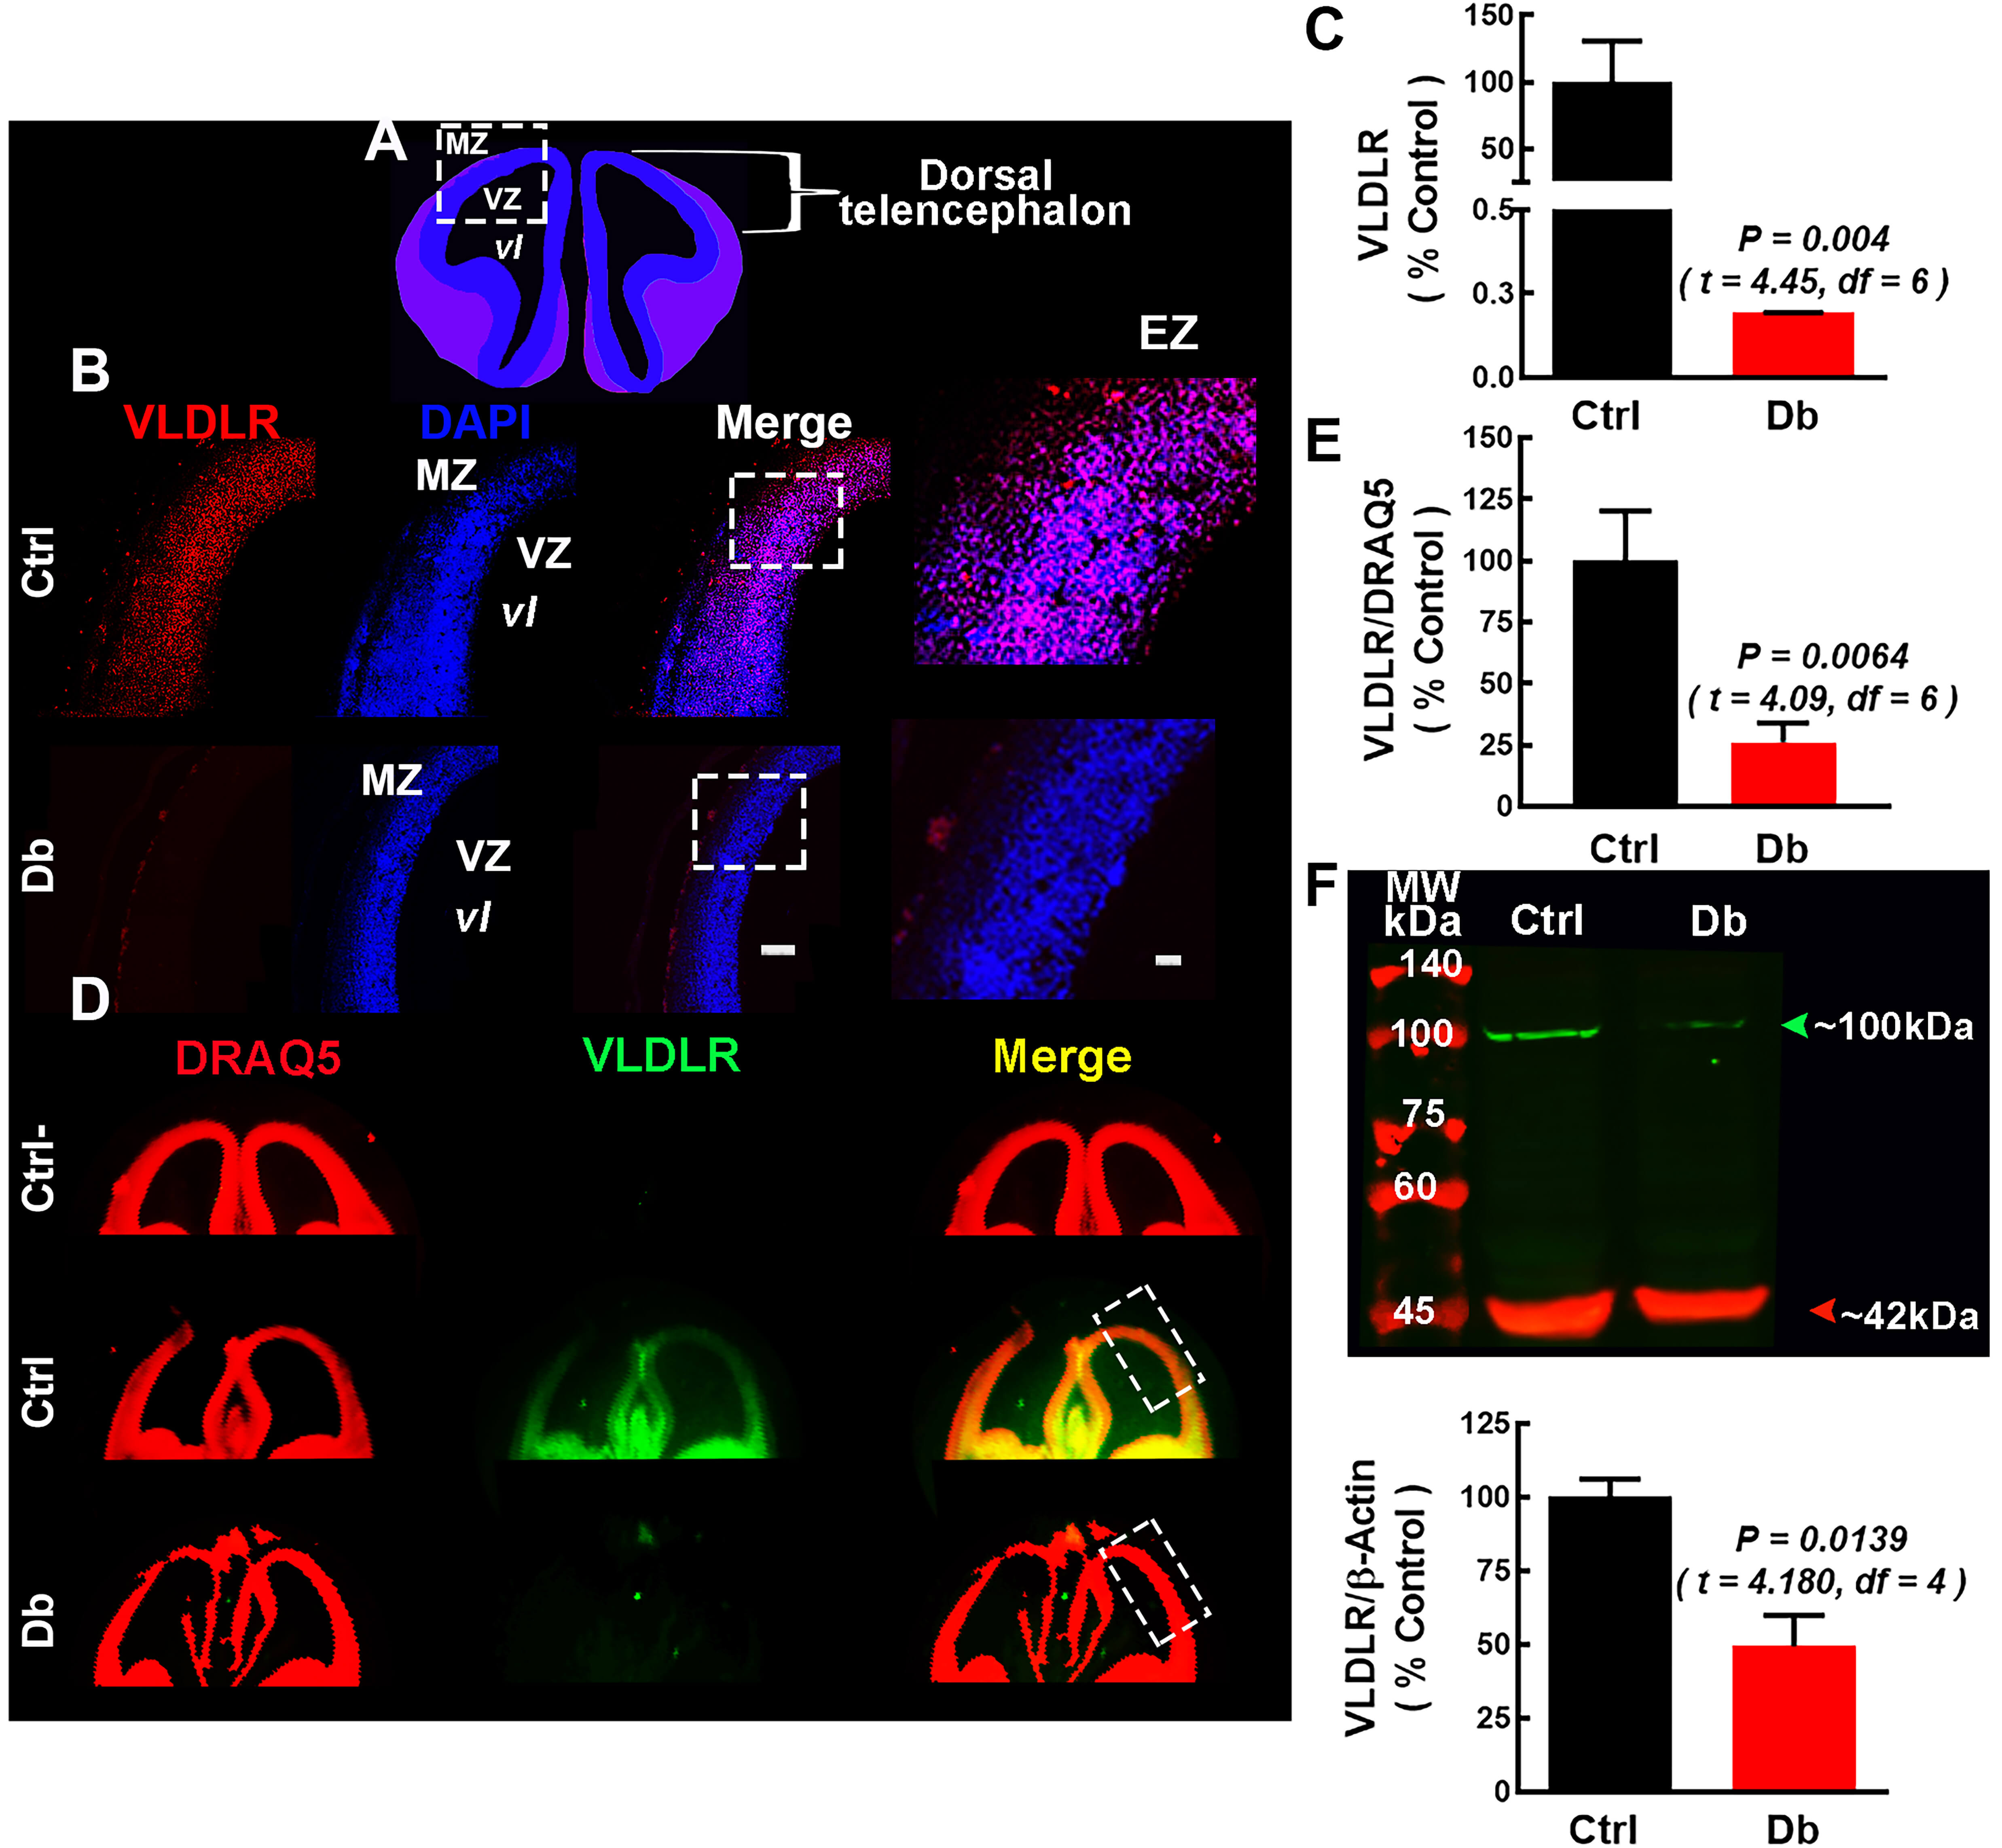 Fig. 6.
VLDLR is decreased at E16 in embryos from diabetic dams. (A)
Schematic coronal view of E16 telencephalon; dashed rectangle marks the dorsal
ROI. (B) Representative images (10
To assess postnatal consequences, we examined M1 cytoarchitecture at P0 and P21
using hematoxylin-eosin, Golgi-Cox, and upper-layer markers (Figs. 7,8).
Hematoxylin-eosin revealed increased cellularity in layer I (molecular layer) of
Db offspring at P0 and P21 (1.8
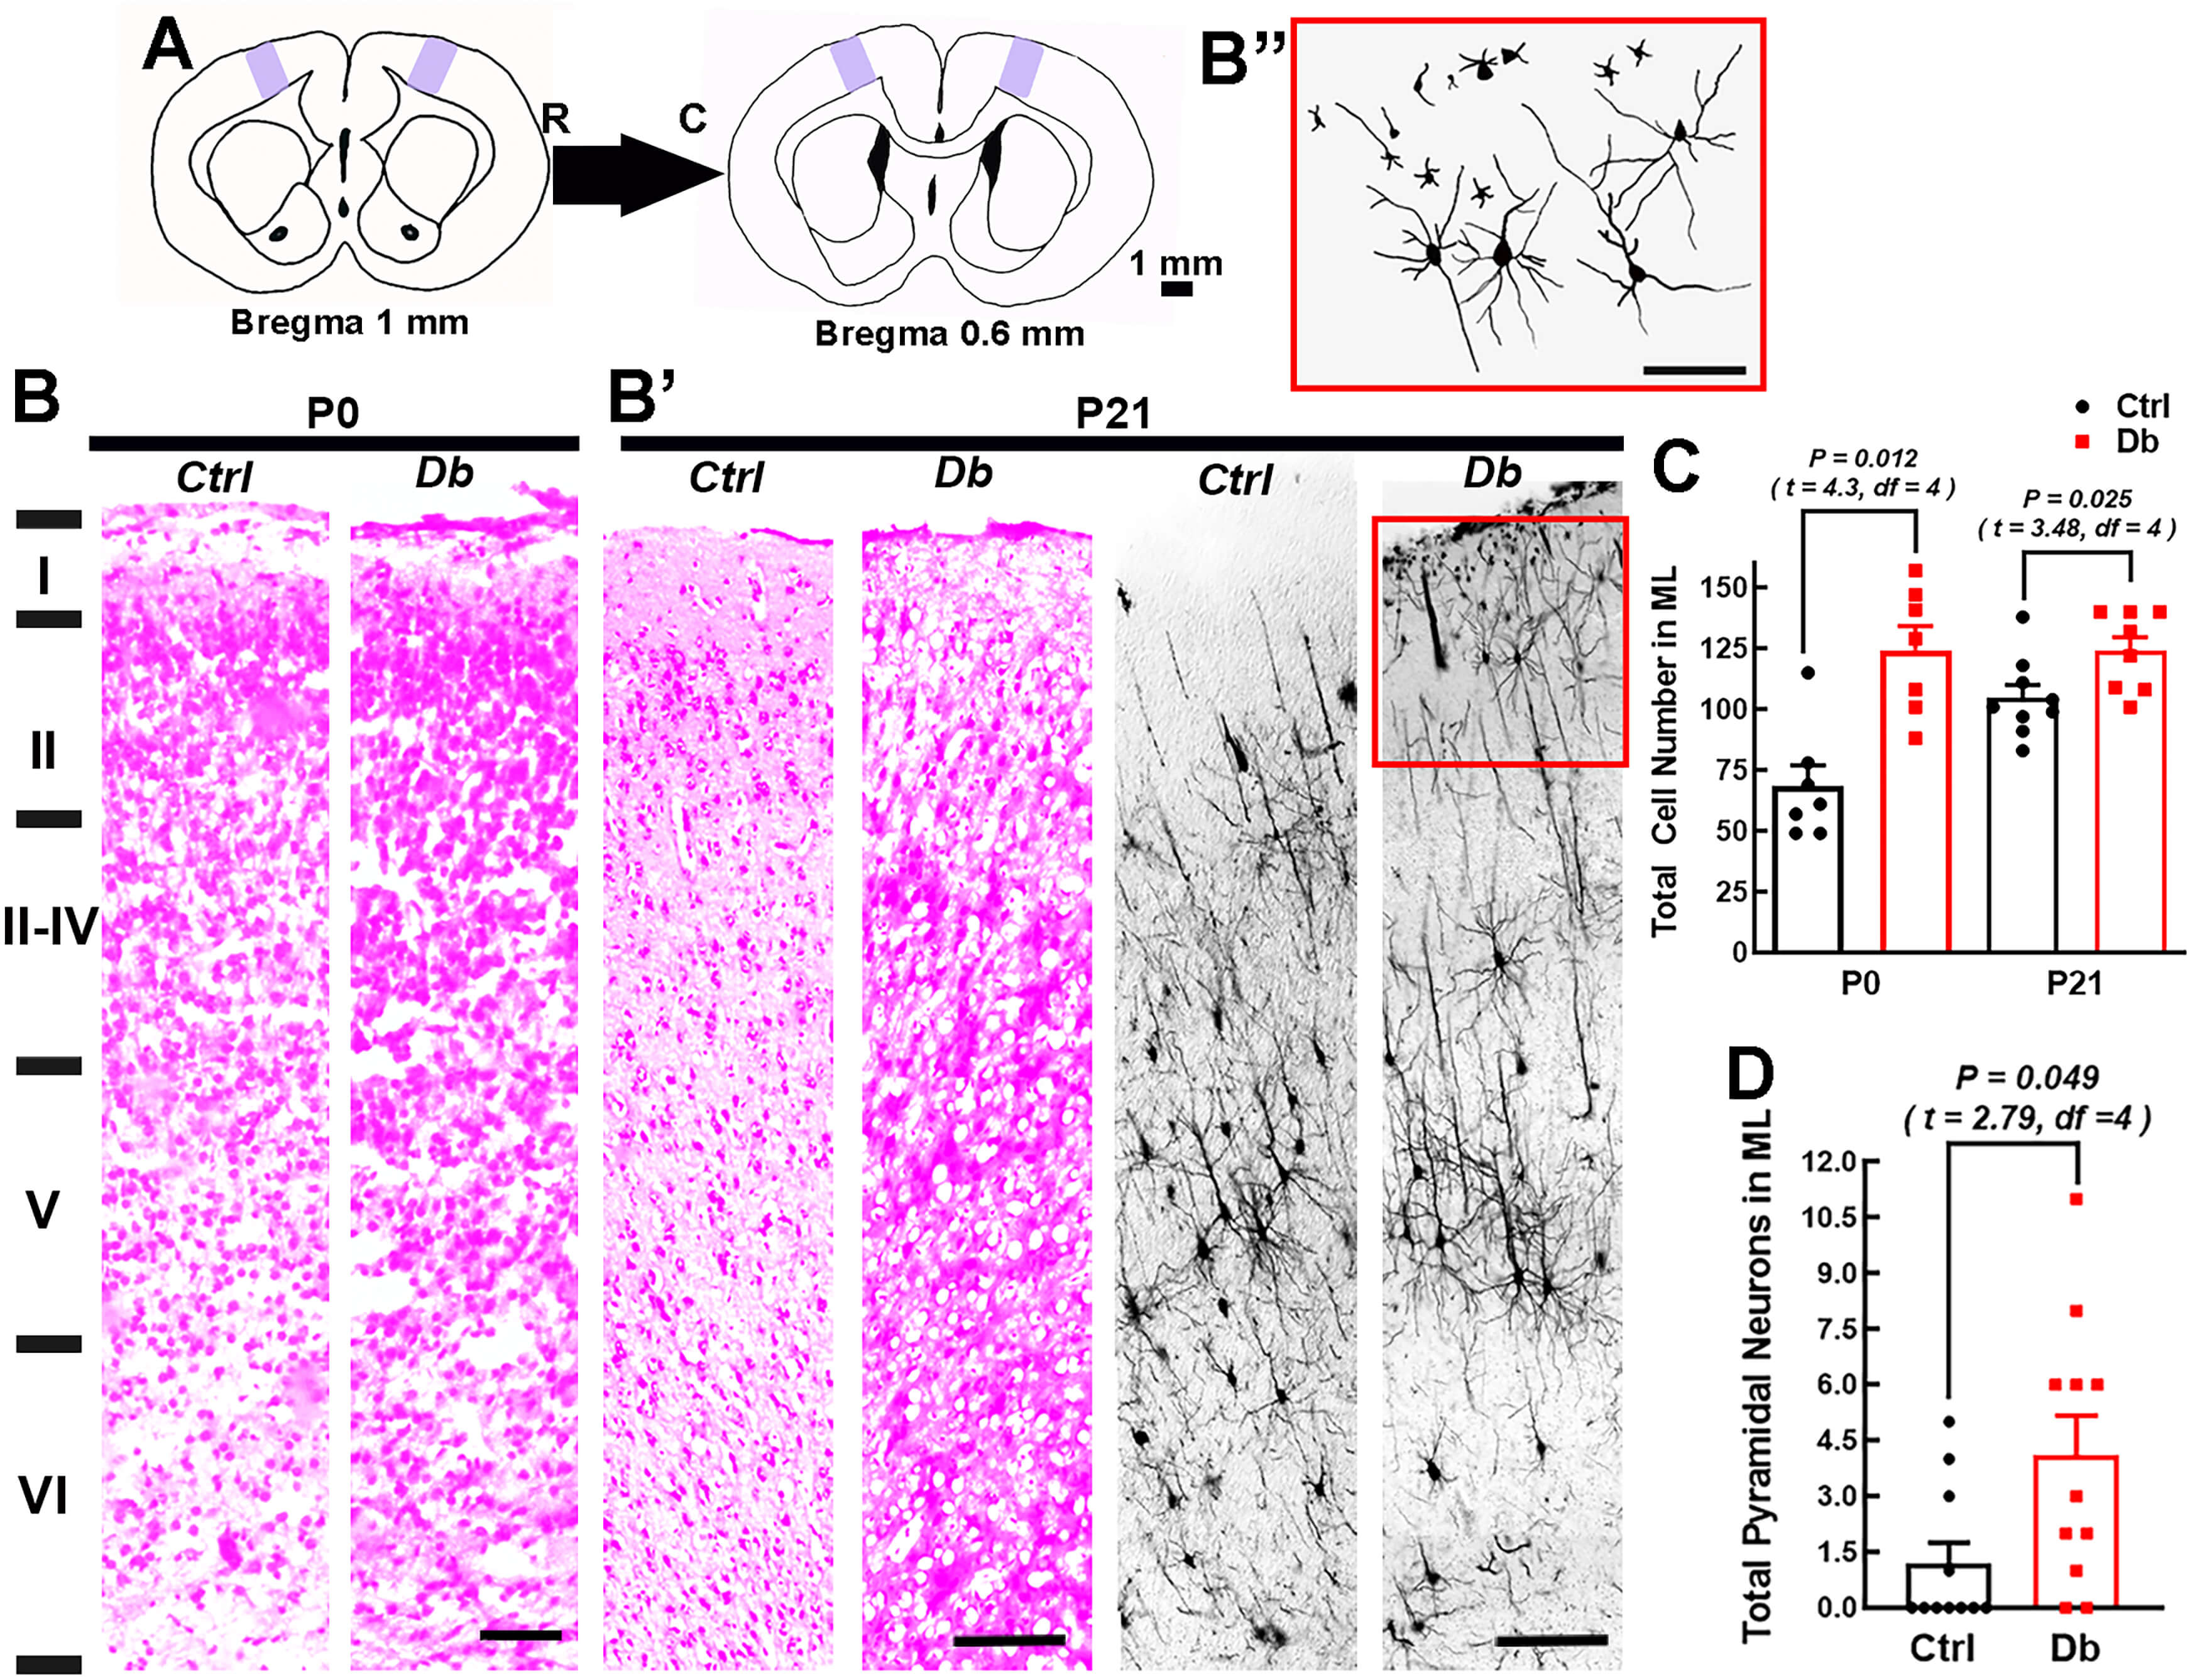 Fig. 7.
Maternal hyperglycemia increases layer I cellularity and ectopic
pyramidal neurons in M1. (A) Schematic of the rostro-caudal levels sampled
(Bregma +1.0 to 0.6 mm; arrows indicate rostral (R) and caudal (C) directions. M1
is shaded purple. (B and B’) Representative hematoxylin-eosin-stained coronal
reconstructions of the M1 in P0 (B; two 10
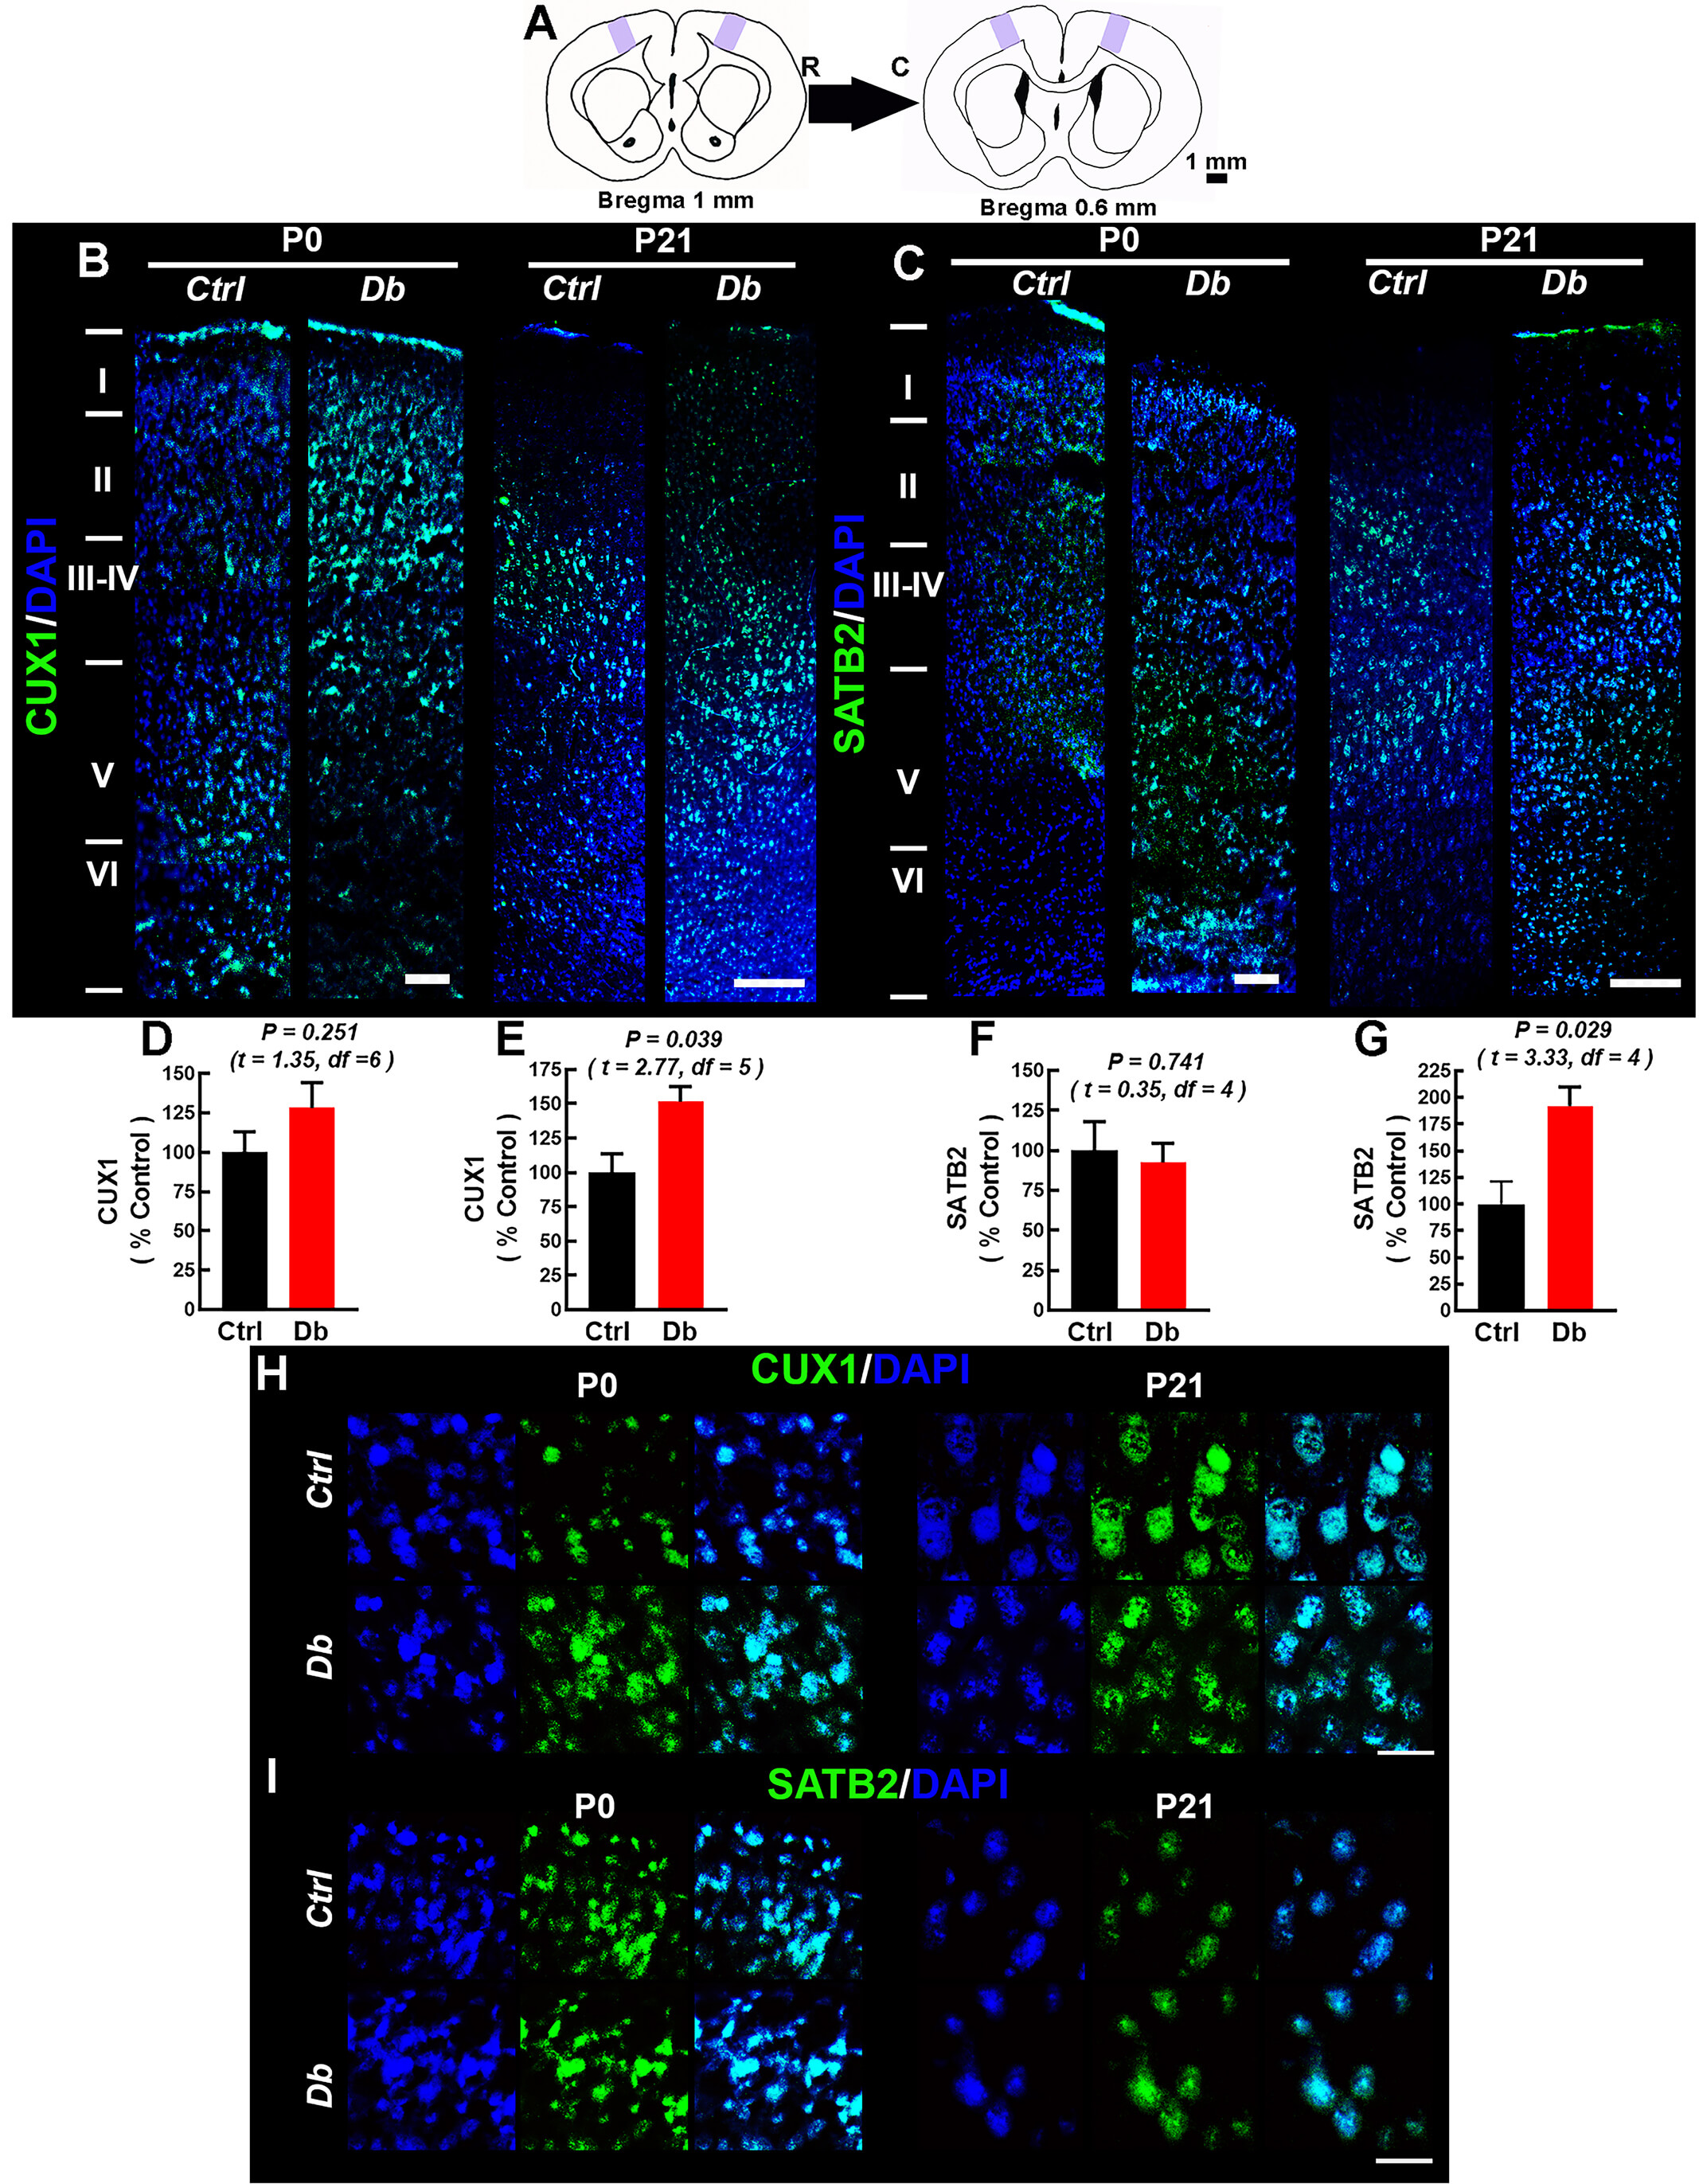 Fig. 8.
Maternal hyperglycemia disrupts the distribution of CUX1 and
SATB2 in M1 during early postnatal life. (A) Schematic showing the analyzed M1
region (purple) and Bregma +1.0 to +0.6 mm used for cytoarchitectonic sampling
(R, rostral; C, caudal). (B,C) Representative 10
Finally, we mapped upper-layer neurons by Cut Like Homeobox 1 (CUX1) and Special AT-Rich Sequence-Binding Protein 2 (SATB2) immunofluorescence at P0 and P21 (Fig. 8A–I). As expected, Ctrl neonates (P0) exhibited deeper CUX1+ neurons (indicating ongoing migration), with predominantly II-IV expression at P21 (Fig. 8B,H). In Db, CUX1+ neurons at P0 were abnormally superficial; at P21, CUX1 signaling encroached upon layer I, and overall CUX1 intensity was higher than Ctrl (Fig. 8D,E). For SATB2, Ctrl showed labeling above layer V at P0 with minimal layer I signal by P21 (Fig. 8C,I). In Db, SATB2+ neurons were more broadly distributed across cortical depth at P0; by P21, SATB2 labeling no longer extended into layer I, yet overall SATB2 intensity remained elevated relative to Ctrl (Fig. 8F,G). Together with hematoxylin-eosin and Golgi-Cox, these data indicate scrambled-like lamination and ectopic layer I neurons consistent with attenuated RELN signaling.
In this study, we combined pathway-level transcriptomics with anatomical and biochemical readouts to interrogate how maternal hyperglycemia perturbs early corticogenesis. IPA of E12 dorsal cortex revealed Reelin Signaling in Neurons as the sole canonical pathway with a non-zero activation z-score, predicting inhibition in embryos from diabetic dams. The implicated functional categories—cell morphology, cellular assembly/organization, and cellular development—are concordant with our previous ShinyGO analysis and with experimental evidence for mitotic spindle and cytoskeletal alterations under hyperglycemic conditions in vivo and in vitro [27].
We validated this prediction at the protein level: RELN, its receptors VLDLR and
ApoER2/LRP8, and p-DAB1 were all reduced at E12 and E16 in embryos from Db dams.
The attenuation of these components was maintained from E12 to E16, suggesting
that this is not due to a simple developmental delay but a chronic deficit in
Reelin signaling. These convergent changes support a model in which attenuated
RELN
Importantly, neither RELN, VLDLR, ApoER2 and N-CAD mRNA showed significant downregulation in our differential expression dataset [28], despite robust protein-level decreases. This dissociation strongly suggests post-transcriptional regulation. A plausible mechanism involves microRNAs (miRNAs) targeting 3′ untranslated region (3′UTR); e.g., miR-200c has been reported to repress RELN in ischemic paradigms [31] and TargetScan (v7.2) predicts conserved miR-200c-3p/miR-200b-3p sites in the RELN 3′UTR. Consistent with this, we previously identified miR-200b-3p in maternal serum during gestational diabetes [32]. Future studies should directly test this axis using RELN-3′UTR luciferase reporters, miRNA mimic/inhibitor manipulations, and qPCR/immunoblot validation of RELN and receptor expression.
At the tissue level, N-CAD exhibited marked mislocalization along the cortical wall in diabetic embryos and loss of the normal radial pattern at the VZ/MZ. The mislocalization occurred despite total N-CAD protein abundance remaining unchanged by Western blot, indicating a defect in localization, rather than a change in protein expression. Given N-CAD’s essential role in neuron-RGC adhesion and radial translocation, its mislocalization likely exacerbates migratory failure and contributes to aberrant lamination. These observations dovetail with our and others’ prior findings of cytoskeletal defects, altered neurogenesis, and impaired dendritic maturation/excitability in offspring of diabetic dams [17, 18, 27, 33].
Postnatally, we observed ectopic pyramidal neurons in layer I and disorganization of upper-layer markers in M1. Reduced VLDLR provides a parsimonious explanation for faulty “stop” signaling at the marginal zone, consistent with layer I over-migration in VLDLR-null models [5]. Decreased ApoER2 may impair the multipolar-to-bipolar transition in the IZ/SVZ, aligning with aberrant CUX1 positioning and broadening SATB2 distributions [6, 10, 13]. Notably, by P21, SATB2 labeling no longer extended into layer I, even though Golgi-Cox revealed ectopic layer I pyramidal neurons; this suggests a subset of ectopic neurons are Reelin-negative (deep-layer identity) or that marker expression is misregulated. This is supported by the fact that no periventricular heterotopia was observed (Supplementary Fig. 1).
Together, these results support a scrambled-like lamination phenotype driven, at least in part, by weakened RELN signaling. However, the causal nature of this relationship warrants further investigation into its mechanisms. Although our transcriptomic and protein analyses indicate coherent attenuation of RELN and downstream effectors (ApoER2, VLDLR, and p-DAB1), the current evidence is correlative. Future studies using targeted manipulation of this pathway, such as in utero electroporation or viral-mediated RELN overexpression in diabetic embryos, will be informative to test whether restoring RELN signaling rescues neuronal migration and laminar organization. Complementary loss-of-function approaches (e.g., DAB1 or LRP8 knockdown in control embryos) could clarify whether the phenotypes observed here are specifically mediated by RELN pathway impairment versus broader metabolic consequences of maternal hyperglycemia. In addition, live imaging of neuronal migration in organotypic slice cultures from E12 to E16 cortices would allow direct visualization of radial and tangential migratory dynamics under diabetic conditions.
Importantly, our analysis was conducted exclusively in embryos without NTD, ensuring that the observed transcriptional and morphological alterations reflect consequences of hyperglycemia rather than a secondary effect of gross malformations. This distinction strengthens the interpretation of our data and underscores the value of this model for dissecting specific mechanisms of diabetic embryopathy. Integrating these mechanistic approaches will be essential to determine whether RELN hypofunction represents a primary pathogenic driver or a downstream outcome of altered progenitor proliferation and metabolic stress. Single-cell RNA-seq (scRNA-seq) in the cortical neuroepithelium from NTD-negative embryos will be particularly useful for resolving cell-type-specific changes in RELN-responsive neuroblasts and radial glial cells. As no such dataset is currently available. This approach will be necessary to test the precise hypothesis of whether RELN-expressing CRs and RELN-responsive neuroblasts/RGCs show selective transcriptional changes.
Regarding neurogenesis, our previous data suggest precocious/altered neurogenesis is associated with changes in the neural stem cell division patterns and increased expression of the high-molecular-weight isoform of microtubule-associated protein 2 (MAP2a/b). It is therefore plausible that both reduced RELN signaling and altered neurogenesis contribute to impaired migration and stratification. Systematic evaluation of layer-specific birthdating/markers across development (e.g., every 24 hours from E12 to E20) will help to determine whether inside-out layering is delayed or advanced.
The onset of maternal hyperglycemia at E5.5 may also influence earlier events, including initial neuroepithelial proliferation, which rapidly expands before E12. Disrupted dynamics at these stages could have durable effects on cortical size and architecture. Future studies examining E8–E10 (proliferation indices and mitotic regulators) together with DNA-damage and cell-death pathways will be important to determine whether maternal hyperglycemia perturbs neuroepithelium prior to the onset of robust corticogenesis, thereby predisposing to subsequent lamination defects. From a developmental-origin perspective, early RELN pathway inhibition provides a mechanistic bridge between diabetic pregnancy and long-term neurodevelopmental risk. Epidemiological data associate gestational diabetes with cognitive/motor impairment, language delays, attention-deficit/hyperactivity disorder, and autism spectrum disorder in offspring [19, 21, 23, 25, 34, 35]; and human VLDLR variants have been linked to speech deficits and cerebellar hypoplasia [36, 37]. While our structural and molecular data are compelling, future work should incorporate behavioral phenotyping (motor learning, skilled reach, cognitive assays) to connect circuit maldevelopment with function.
Recent transcriptomic and behavioral studies reinforce the long-term impact of maternal diabetes on offspring. For example, Aviel-Shekler and collaborators (2020) [35] reported that STZ-induced gestational diabetes at conception increases repetitive behaviors in adult male mice and alters gene expression in the frontal cortex and striatum. Frontal cortex differentially expressed genes were enriched for the function of forebrain development, and include genes implicated in the regulation of mammalian cortex size and organization, as well as the establishment of neuronal circuits (e.g., Nde1 and Bhlhe22) [35]. Interestingly, the authors state that glucose reached diabetic levels between E7 and E14, suggesting that maternal hyperglycemia, even when induced after implantation, can interfere with transcriptional programs governing neuronal differentiation and connectivity, consistent with our evidence of disrupted RELN signaling and abnormal radial migration in embryonic cortex. Future studies combining in utero manipulation of RELN signaling with longitudinal transcriptomic and postnatal behavioral assays will help establish the causal chain linking early cortical mispatterning to later cognitive and motor impairments.
Our study has several limitations. First, we used a streptozotocin-induced maternal hyperglycemia model that approximates, but does not replicate, the heterogeneity of human gestational diabetes; we did not measure maternal/fetal insulin or HbA1c, precluding dose-response inferences. Second, molecular readouts were primarily protein level and immunohistochemical; although transcriptomics guided pathway selection, we did not perform mechanistic rescue (e.g., recombinant RELN, receptor trafficking manipulation) nor direct test of the proposed miR-200-RELN axis. Third, the inference that reduced “stop” signaling causes layer I ectopias is correlative, as we did not quantify CRs number/activity, nor apoptosis of ectopic neurons, therefore, in future studies it will be crucial to perform p73 staining to confirm that the observed reduction in the RELN protein is due to reduced function/secretion rather than a loss or reduction of CRs. Fourth, some histological quantifications rely on 2D ROIs and immunofluorescence intensities, which can index both cell number and expression level; stereological estimates and per-layer cell densities would strengthen these conclusions. Fifth, we focused on E12/E16 and early postnatal M1 without behavioral endpoints; species/temporal differences may limit generalization to the human cortex. Finally, sex was not powered as a factor in all analyses. These constraints motivate future rescue and causal experiments.
Beyond radial migration, maternal hyperglycemia may also perturb tangential migration, which is required for the proper positioning of GABAergic interneurons from the medial and caudal ganglionic eminences. These neurons migrate through the intermediate and subventricular zones and integrate into the cortical plate circuit via guidance cues that include RELN, CXCL12/CXCR4, neuregulin/ErbB4, and semaphorins/plexin-Neuropilin pathways [38, 39]. Disruption of these signals leads to abnormal interneuron distribution and an altered excitatory-inhibitory balance, potentially contributing to functional impairments in diabetic offspring. Because our analysis primarily addressed radial migration and laminar architecture, future work should map tangential routes to determine whether maternal hyperglycemia exerts broader effects on cortical circuit assembly.
In summary, maternal hyperglycemia is associated with attenuated RELN/DAB1 signaling, N-CAD mislocalization, impaired radial migration, and abnormal laminar architecture in postnatal life. These findings nominate the RELN pathway as a mechanistic node and a testable therapeutic target for mitigating neurodevelopmental sequelae in the offspring of diabetic pregnancies.
Our findings demonstrate that maternal hyperglycemia disrupts one of the most fundamental regulatory axes of corticogenesis: the RELN–DAB1 signaling pathway. By showing reduced levels of RELN, its receptors ApoER2 and VLDLR, and p-DAB1, together with N-CAD mislocalization, we provide evidence that from early to late intrauterine development, the rat embryo may have compromised radial migration and cortical lamination. These alterations result in structural modifications during early postnatal life, characterized by ectopic pyramidal neurons and disorganized upper cortical layers in the M1.
From a developmental origins perspective, these results highlight how maternal diabetes can affect key molecular processes that guide neuronal positioning, potentially predisposing offspring to later cognitive and behavioral impairments. While our work was performed in a rat model, the parallels with human epidemiological data linking maternal diabetes to neurodevelopmental disorders strengthen the translational relevance.
Furthermore, our study identifies the RELN pathway as a mechanistic bridge between maternal hyperglycemia and abnormal cortical development. By pointing to this pathway as a potential experimental and therapeutic target, our findings encourage future investigations aimed at restoring RELN signaling or its downstream effectors to mitigate neurodevelopmental risks.
All data generated or analyzed during this study are included in this published article and its supplementary materials. Original, western blot images and additional raw data supporting the conclusions of this study are available from the corresponding author upon request. Transcriptomic data is in https://www.ebi.ac.uk/fg/annotare/. (Accession number E-MTAB-15111)
RVB and DAG wrote the original draft. DAG contributed to the conceptualization and discussion of the analyzed data. RVB and ISV performed the postnatal experiments, investigation, and analysis. RVB, DADP, VACP, and EVIH performed the prenatal experiments, investigation, and analysis. NFD and AMH contributed to the investigation, draft correction, and conceptualization. AMH contributed to the review and editing conception, design of the study, resources, and funding acquisition. All authors contributed to editorial changes in the manuscript. All authors read and approved the final manuscript. All authors have participated sufficiently in the work and agreed to be accountable for all aspects of the work.
This study was approved by the Institutional Committee for the Care and Use of Laboratory Animals (CICUAL) and the Research, Ethics, and Biosafety Committees of the Instituto Nacional de Perinatología (protocol number 2018-1-146). All experiments were carried out following the ‘Guide for the Care and Use of Laboratory Animals’ (NIH 80-23, revised 1978), the Official Mexican Standard for the Production, Care, and Use of Laboratory Animals (NOM-062-ZOO-1999), and the ARRIVE guidelines.
The authors thank Yuriria Paredes-Vivas and Hećtor Herrera-Fernańdez for laboratory technical support and Talia Estrada-Rojas for animal care.
This research was funded by the Instituto Nacional de Perinatología (2018-1-146).
The authors declare no conflict of interest.
Supplementary material associated with this article can be found, in the online version, at https://doi.org/10.31083/JIN46827.
References
Publisher’s Note: IMR Press stays neutral with regard to jurisdictional claims in published maps and institutional affiliations.