


 , Lingling Guo 1, Hongting Xu 2, Yu Zhou 1, Fan Zou 1, Jinmin Wu 1, Yuping Wang 1, Xiangming Qi 2,*
 , Haibao Wang 1,*
1 Department of Radiology, The First Affiliated Hospital of Anhui Medical University, 230022 Hefei, Anhui, China
2 Department of Nephrology, The First Affiliated Hospital of Anhui Medical University, 230022 Hefei, Anhui, China
Abstract
Executive dysfunction is the most prominent feature of cognitive impairment in patients with end-stage renal disease (ESRD). The dorsolateral prefrontal cortex (DLPFC) is a central region for the regulation of executive functions. The aim of our study was to examine alterations in neural activity and functional connectivity (FC) of the DLPFC in relation to cognitive assessments and clinical indicators in patients with ESRD using the resting-state functional magnetic resonance imaging (rs-fMRI) technique, and to further predict cognitive-related brain damage in this population.
A total of 37 ESRD patients and 35 normal controls received MRI scans and neuropsychological assessments. Inter-group differences in fractional amplitude of low-frequency fluctuations (fALFF) and FC of the DLPFC were compared. Additionally, the relationships between DLPFC abnormalities and cognitive function were analyzed in ESRD patients, along with the clinical characteristics. Finally, we ascertained the potential of DLPFC abnormalities to predict cognitive-related brain damage using receiver operating characteristic (ROC) curve analysis.
ESRD patients exhibited decreased fALFF in the bilateral DLPFC (p < 0.05, false discovery rate [FDR] corrected). These also showed abnormal FC with the frontoparietal cortex, cingulate cortex, cerebellar posterior lobe, inferior temporal gyrus, and rolandic operculum (p < 0.05, FDR corrected). Several alterations in the DLPFC were associated with cognitive assessments (p < 0.05) in ESRD patients, and were also correlated with the levels of uric acid and hemoglobin (p < 0.05). Importantly, ROC curve analysis showed the fALFF value of left DLPFC, and FC between right DLPFC and right middle frontal gyrus effectively predicted cognitive-related brain damage in patients with ESRD.
This study demonstrated that the DLPFC is an important pathological brain region associated with the cognitive impairment of ESRD patients. Our results provide neuroimaging insights to further understand neural mechanisms of cognitive decline in this population.
Keywords
- end-stage renal disease
- dorsolateral prefrontal cortex
- cognitive impairment
- functional magnetic resonance imaging
- functional brain imaging
End-stage renal disease (ESRD) has become a growing public health concern [1]. Cognitive impairment is strongly associated with a decline in renal function and is pervasive among ESRD patients [2, 3]. Severe cognitive impairment can reduce patient quality of life, daily functions, and adherence to treatment, as well as increase mortality [1, 2, 4]. Thus, a better understanding of the neuropathological mechanisms leading to cognitive decline in ESRD patients is important in terms of early detection and intervention, as well as for the improvement of clinical outcomes. However, the exact neural substrates causing cognitive impairment in ESRD are still not well known.
Resting-state functional magnetic resonance imaging (rs-fMRI) can identify spontaneous brain activity during a resting state by measuring the blood oxygen level-dependent (BOLD) signal. Furthermore, it can reveal functional connectivity (FC) through the correlation of BOLD signals across different brain regions [5]. There is increasing consensus in the neuroscience field that realization of brain function is not achieved by individual brain regions, but rather through the collaboration of multiple brain regions [6]. Multiple analytical approaches, including regional homogeneity (ReHo), amplitude of low-frequency fluctuation (ALFF), and fractional amplitude of low-frequency fluctuation (fALFF) have been employed to detect abnormal neural activity in the frontoparietal regions, cingulate gyrus, precuneus, insula, and hippocampus of ESRD patients. Such changes have been associated with cognitive decline [7, 8, 9, 10]. Research has also shown that multiple brain regions exhibit FC alterations in ESRD patients, such as the posterior cingulate gyrus, medial prefrontal cortex and precuneus within the default mode network (DMN) [11, 12], the insula and anterior cingulate gyrus within the salience network (SN) [13, 14], and lateral prefrontal and posterior parietal regions in the region of the executive control network (ECN) [15, 16, 17]. Our previous study employed cerebellar subregions as seeds and found abnormalities in cerebellar-cerebral FC, mainly involving the DMN and ECN [18]. These results suggest that the aberrant spontaneous activity and FC of key brain regions in ESRD patients may participate in neural substrates of cognitive decline.
Cognitive impairment in patients with ESRD encompasses multiple domains, including executive ability, working memory, visuospatial ability, processing speed, and attention, with executive dysfunction being the most prominent feature [4, 19]. The dorsolateral prefrontal cortex (DLPFC) is a core cortical area involved with the regulation of executive function and closely associated with attention, processing speed, and working memory [20, 21, 22]. Previous studies have identified local brain abnormalities within the DLPFC in ESRD patients. Structurally, these abnormalities manifest as a decrease in gray matter volume [15, 23], cortical thinning [24], and microstructural abnormalities [25]. Functionally, they are characterized by abnormalities in neural activity (ALFF/fALFF and ReHo) [7, 26] and FC [15, 17]. Despite these findings, the association between DLPFC alterations and cognitive dysfunction in ESRD patients is still not fully understood. Consequently, focusing on the relation between functional changes in the DLPFC and cognitive impairment in ESRD patients could result in a better understanding of the neural mechanisms underlying cognitive dysfunction in these patients.
In the present study, fALFF and FC methods were employed to analyze functional changes in DLPFC. Additionally, we explored the correlations between DLPFC abnormalities and cognitive performance, as well as clinical indicators. We also applied receiver operating characteristic (ROC) curve analysis to evaluate the DLPFC as a possible neuroimaging biomarker of cognitive impairment in ESRD patients.
Thirty-seven patients with ESRD were recruited from The First Affiliated
Hospital of Anhui Medical University. All enrolled patients were regularly
undergoing peritoneal dialysis. The etiology of ESRD was chronic
glomerulonephritis in 24 cases, polycystic kidney disease in 4 cases, IgA
nephropathy in 4 cases, anaphylactoid purpura in 2 cases, lupus nephritis in 2
cases, and nephrotic syndrome in 1 case. Inclusion criteria were: glomerular
filtration rate
Each participant completed a set of neuropsychological assessments within 24 hours prior to the MRI scan. These were the Digit Symbol Substitution Test (DSST), Mini-Mental State Examination (MMSE), Trail-Making Test Part A (TMT-A), and Montreal Cognitive Assessment Scale (MoCA). The tests evaluate working memory, attention, visuospatial and executive functions, general cognitive abilities, and processing speed.
Within 24 hours prior to the MRI examinations, each patient underwent blood biochemical evaluations for creatinine, uric acid, urea nitrogen, sodium, phosphorus, calcium, potassium, and hemoglobin. These laboratory tests were not carried out in the HC participants.
A 3.0T MRI system Philips Ingenia (Philips Healthcare, Best, the Netherlands)
was used to obtain MRI data. During scanning, participants were requested not to
move, close their eyes, and stay awake. Traditional T2 weighted images were
acquired to exclude participants with notable structural brain abnormalities. To
acquire the rs-fMRI data, a gradient-echo echo-planar imaging sequence with the
following parameters was employed: repetition time/echo time (TR/TE) = 3000/30
ms; 48 slices, 3.3 mm slice thickness with no gap; 64
Dcm2nii software (http://nitrc.org/projects/dcm2nii) was used to transform MRI
digital imaging and communications in medicine (DICOM) data into neuroimaging informatics technology initiative (NIFTI) format. To ensure signal stability and help subjects
acclimate to the imaging conditions, the first five volumes of functional images
were excluded. Subsequently, the MRI data were further preprocessed using the
default Montreal Neurological Institute (MNI) pipeline with CONN 18.b toolbox
(https://www.nitrc.org/projects/conn). This is based on software from MATLAB
(R2018a, Math Works, Natick, MA, USA, https://uk.mathworks.com/products/matlab)
and includes correction for slice timing, assessment and correction of head
movement (ARTifact Detection Tools [http://www.nitrc.org/projects/artifact_detect], functional outlier detection settings:
global-signal z-value threshold of 5, subject-motion threshold of 0.9 mm), and
segmentation and normalization of MR images with a resolution of 2
Preprocessed time-domain data underwent Fourier transformation to convert it into the frequency domain, with the square root then utilized to obtain the ALFF value [27]. The fALFF value was calculated by dividing the ALFF value (0.01–0.1 Hz) by the full-band ALFF value [28]. To facilitate statistical analysis, the fALFF value of each voxel was divided by the global average fALFF value to obtain the normalized fALFF value.
Brain regions with a fALFF value difference located in the brodmann area (BA) 9/46 region were extracted as seeds for the DLPFC [20, 22, 29]. Temporal filtering was applied to the preprocessed data in the 0.01–0.1 Hz frequency band. Next, a seed-based connectivity analysis module in the CONN 18b toolbox was applied to compute the Pearson correlation coefficient (r) for the BOLD time series of all DLPFC seeds and every brain voxel. The normal distribution was then approximated by applying the Fisher R-to-Z transformation. Finally, FC maps were obtained for the DLPFC of all subjects.
The neuropsychological and demographic data were assessed with SPSS version 27.0
(IBM Corp, Armonk, NY, USA). The Chi-squared test or two-sample independent
t-test was used to compare the ESRD and HC groups in terms of gender,
age, education, and neuropsychological test scores, with p
Based on the CONN toolbox, multivariate ANCOVA covariate control was used to
detect differences in fALFF and FC values of DLPFC between patient and HC groups,
with the covariates of education level, gender, and age. Between-group
differences in fALFF were analyzed using the default CONN toolbox thresholds,
with the voxel-level threshold set specifically at p
Altered fALFF and FC values of DLPFC were extracted from the ESRD group. Pearson
correlation analysis in SPSS 22.0 was used to determine correlations between: (1)
the fALFF value of DLPFC and cognitive function scores and clinical indices
(p
To ascertain the potential of the DLPFC for predicting cognitive-related brain
damage in patients with ESRD, indicators showing significant correlations with
cognitive scores were used as predictors in the construction of single-predictor
models. Furthermore, to investigate the combined predictive utility of multiple
indicators, we employed SPSS 22.0 to build a binary logistic regression model,
obtaining the predicted probability values for each indicator. The combined
multi-indicator predictor was subsequently calculated using the binary logistic
regression function. Leave-one-out cross-validation (LOOCV) along with ROC curve
analysis was employed in Python version 3.10 (Python Software Foundation,
Wilmington, DE, USA, https://www.python.org) to assess the predictive performance
of our model and determine 95% confidence intervals (CI). Area under curve (AUC)
results were classified as: outstanding prediction (AUC
Table 1 shows demographic data, cognitive scores, and clinical characteristics
for the participants. There were no significant differences between ESRD and HC
groups for gender, age, or educational level (all p
| Variable | ESRD group (n = 37) | HC group (n = 35) | p |
| Age (yrs) | 46.62 |
48.34 |
0.433 |
| Gender (M/F) | 13/24 | 17/18 | 0.248 |
| Education (yrs) | 6.91 |
8.31 |
0.057 |
| Disease duration (months) | 77.08 |
− | − |
| Dialysis duration (months) | 25.14 |
− | − |
| Creatinine (µM) | 956.38 |
− | − |
| Urea nitrogen (mM) | 18.83 |
− | − |
| Uric acid (µM) | 428.78 |
− | − |
| Hemoglobin (g/L) | 94.00 |
− | − |
| Sodium (mM) | 138.35 |
− | − |
| Potassium (mM) | 3.95 |
− | − |
| Calcium (mM) | 2.23 |
− | − |
| Phosphorus (mM) | 1.63 |
− | − |
| MMSE | 26.41 |
28.69 |
|
| MoCA | 23.30 |
25.43 |
0.012 |
| DSST | 35.00 |
42.95 |
0.024 |
| TMT-A | 61.70 |
49.91 |
0.034 |
ESRD, end-stage renal disease; HC, healthy control; M/F, male/female; MMSE, Mini-Mental State Examination; MoCA, Montreal Cognitive Assessment Scale; DSST, Digit Symbol Substitution Test; TMT-A, Trail-Making Test Part A.
Compared with HC subjects, ESRD patients showed fALFF differences in two brain regions located within the BA9/46 areas, defined respectively as the right DLPFC (Fig. 1A, peak MNI coordinates: 34, 34, 40, cluster size: 160 voxels) and the left DLPFC (Fig. 1B, peak MNI coordinates: –28, 56, 18, cluster size: 118 voxels) [20, 22, 29]. Both regions exhibited a decrease in fALFF.
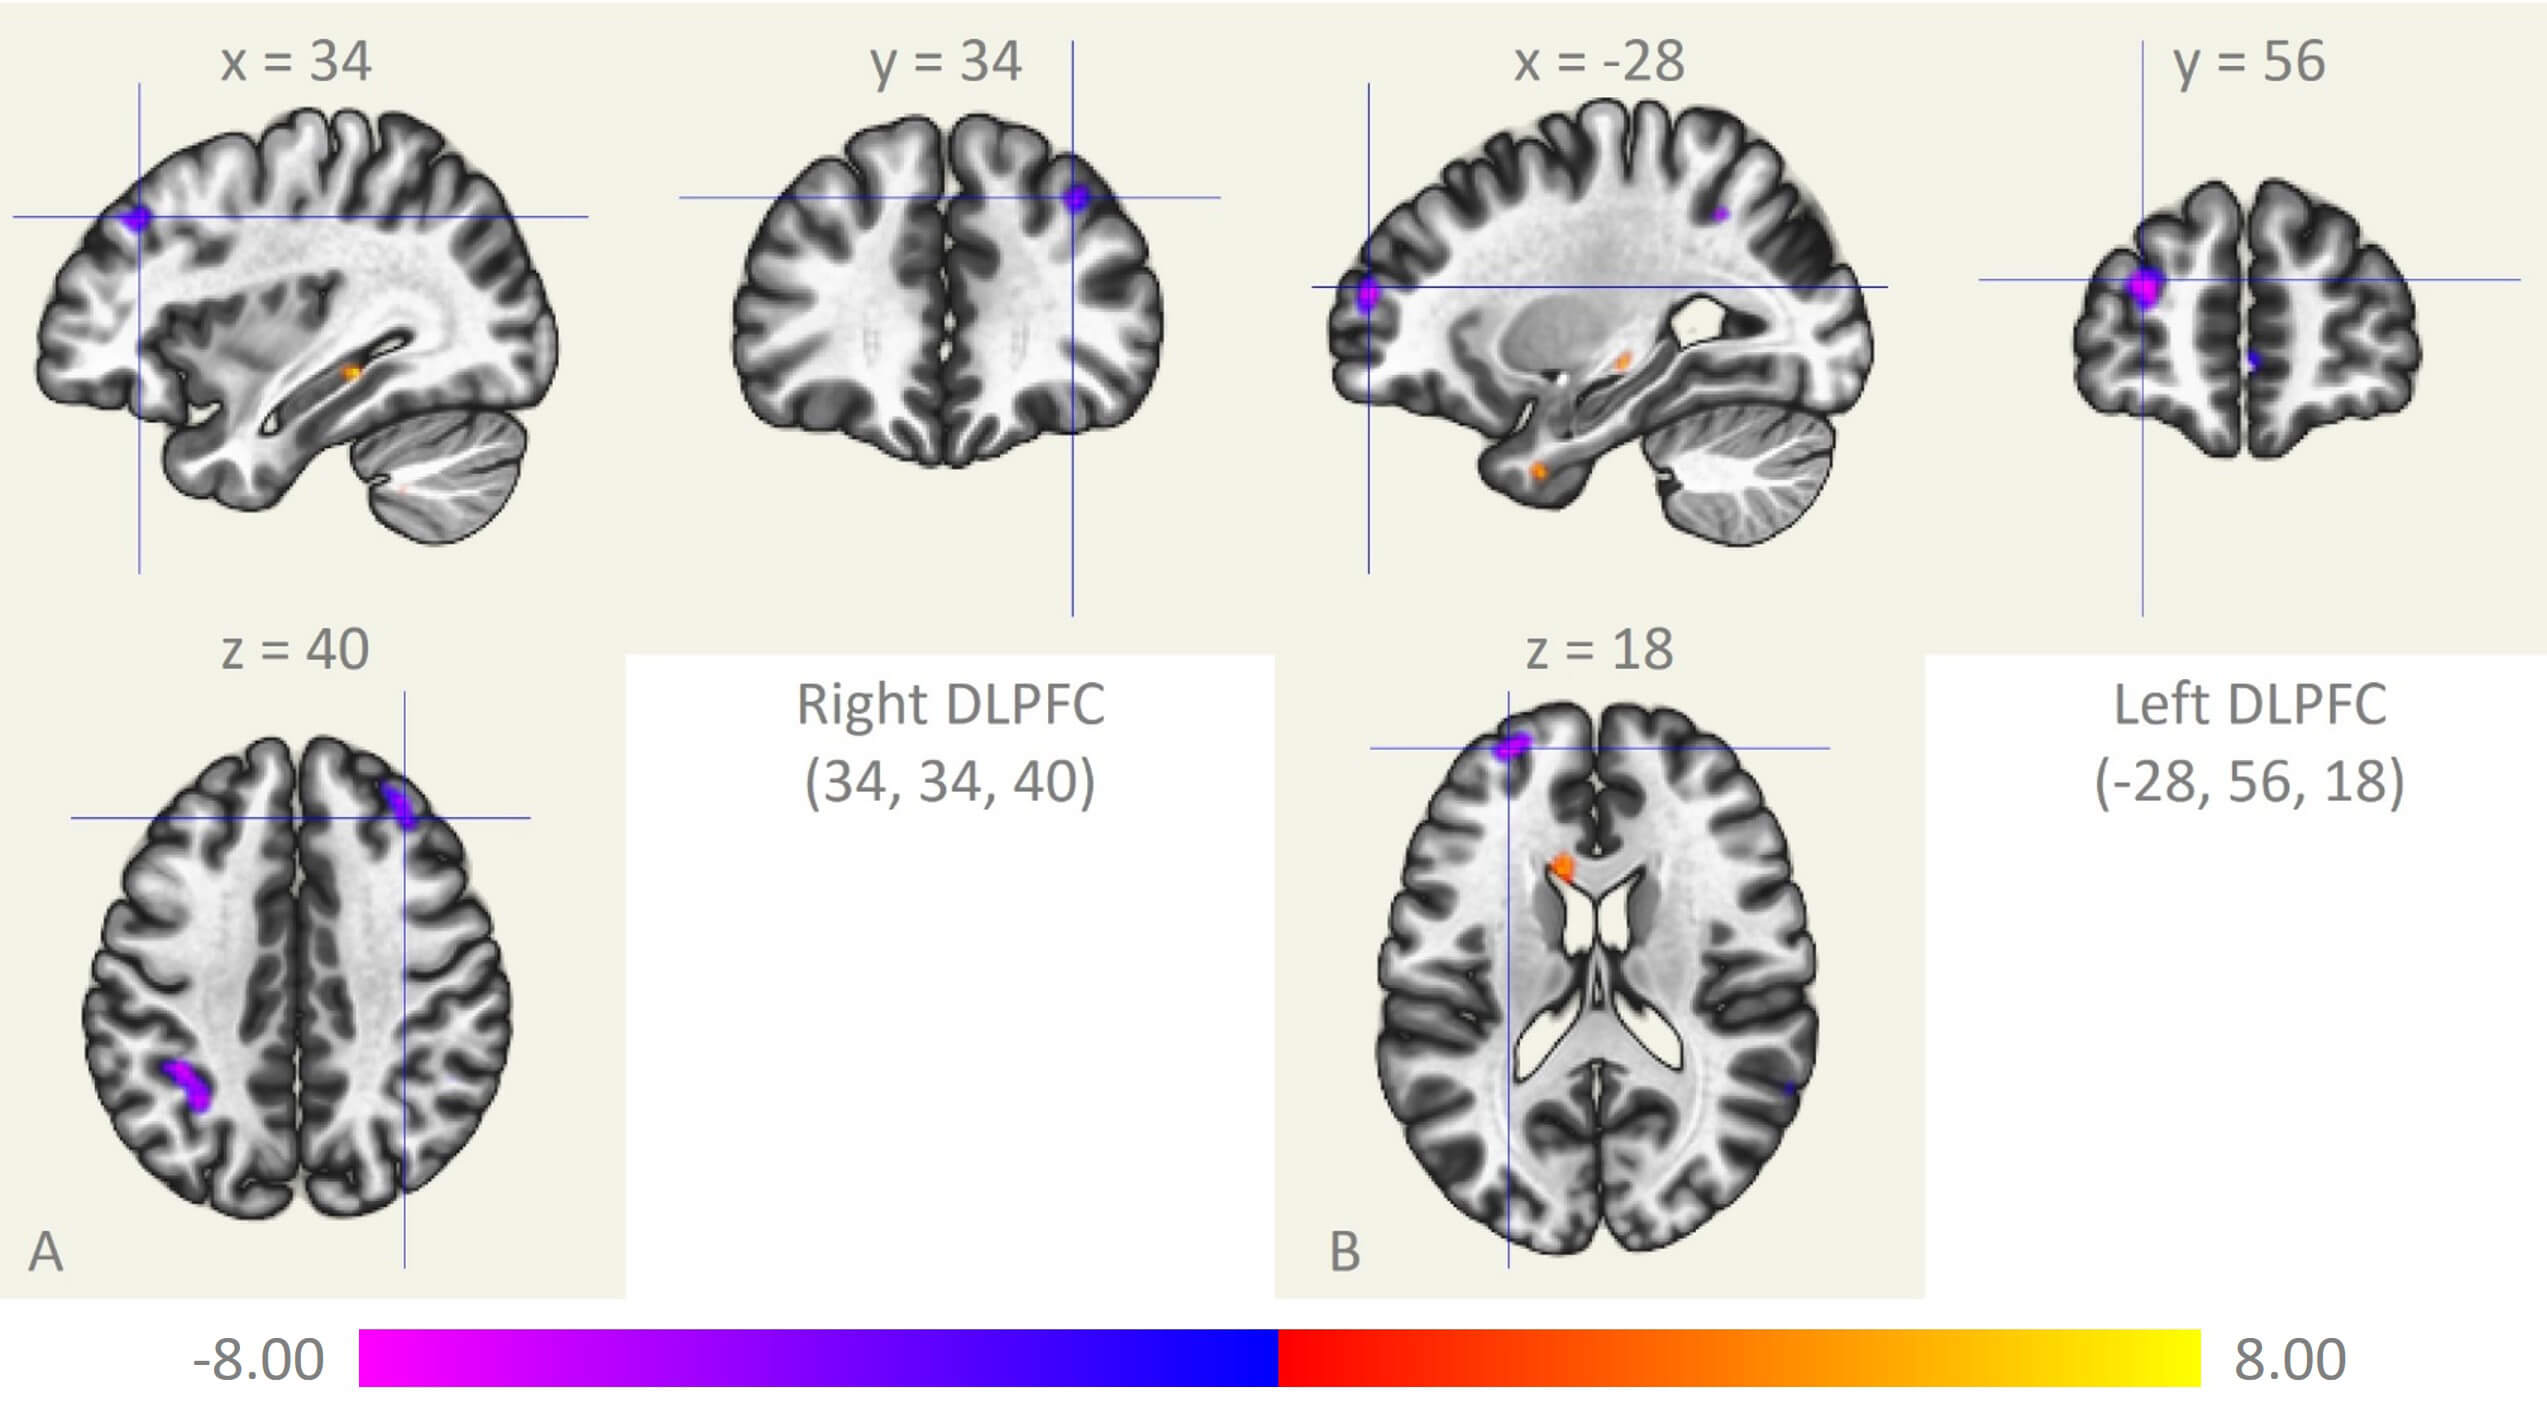 Fig. 1.
Differences in fALFF of the DLPFC. (A) Right DLPFC. (B) Left DLPFC. fALFF, fractional amplitude of low-frequency fluctuation; DLPFC, dorsolateral prefrontal cortex; x, y, and z: peak Montreal Neurological Institute coordinates.
Compared with HC subjects, the right DLPFC in ESRD patients showed decreased FC with the bilateral middle frontal gyrus, right superior frontal gyrus, right superior parietal gyrus, left inferior parietal gyrus, right inferior temporal gyrus, and left posterior cerebellum. In contrast, it showed increased FC with the medial prefrontal cortex, anterior cingulate gyrus, and right rolandic operculum (Table 2, Fig. 2A, k_min = 109 voxels). The left DLPFC showed lower FC with the left middle frontal gyrus and left inferior parietal gyrus, and increased FC with the medial prefrontal and posterior cingulate gyrus (Table 2, Fig. 2B, k_min = 141 voxels).
| Seed | Brain region | Voxels | Peak’s MNI coordinate | T | p | ||
| X | Y | Z | |||||
| DLPFC_R | Parietal_Sup_R | 1459 | 26 | –60 | 51 | –6.68 | |
| Prefrontal_Medial | 950 | –10 | 56 | 18 | 5.67 | ||
| Frontal_Sup_R | 510 | –28 | 4 | 62 | –6.62 | ||
| Parietal_Inf_L | 373 | –42 | –50 | 48 | –5.49 | ||
| Temporal_Inf_R | 354 | 52 | –38 | –22 | –6.52 | ||
| Frontal_Mid_R | 335 | 40 | 54 | –12 | –6.19 | ||
| 243 | 38 | 18 | 60 | –5.79 | 0.003 | ||
| 130 | 42 | 40 | 30 | –6.03 | 0.023 | ||
| Rolandic_Oper_R | 278 | 56 | 2 | 6 | 5.52 | ||
| Cerebelum_Post_L | 190 | –30 | –66 | –50 | –6.21 | 0.008 | |
| Frontal_Mid_L | 145 | –44 | 30 | 44 | –5.84 | 0.018 | |
| Cingulum_Ant_L | 109 | –4 | 32 | 22 | 4.79 | 0.035 | |
| DLPFC_L | Prefrontal_Medial | 2117 | –10 | 62 | 10 | 6.73 | |
| Cingulum_Post | 696 | –8 | –52 | 26 | 5.97 | ||
| Parietal_Inf_L | 263 | –56 | –40 | 56 | –5.78 | ||
| Frontal_Mid_L | 141 | –42 | 42 | 32 | –6.54 | 0.008 | |
MNI, Montreal Neurological Institute; R, right; L, left.
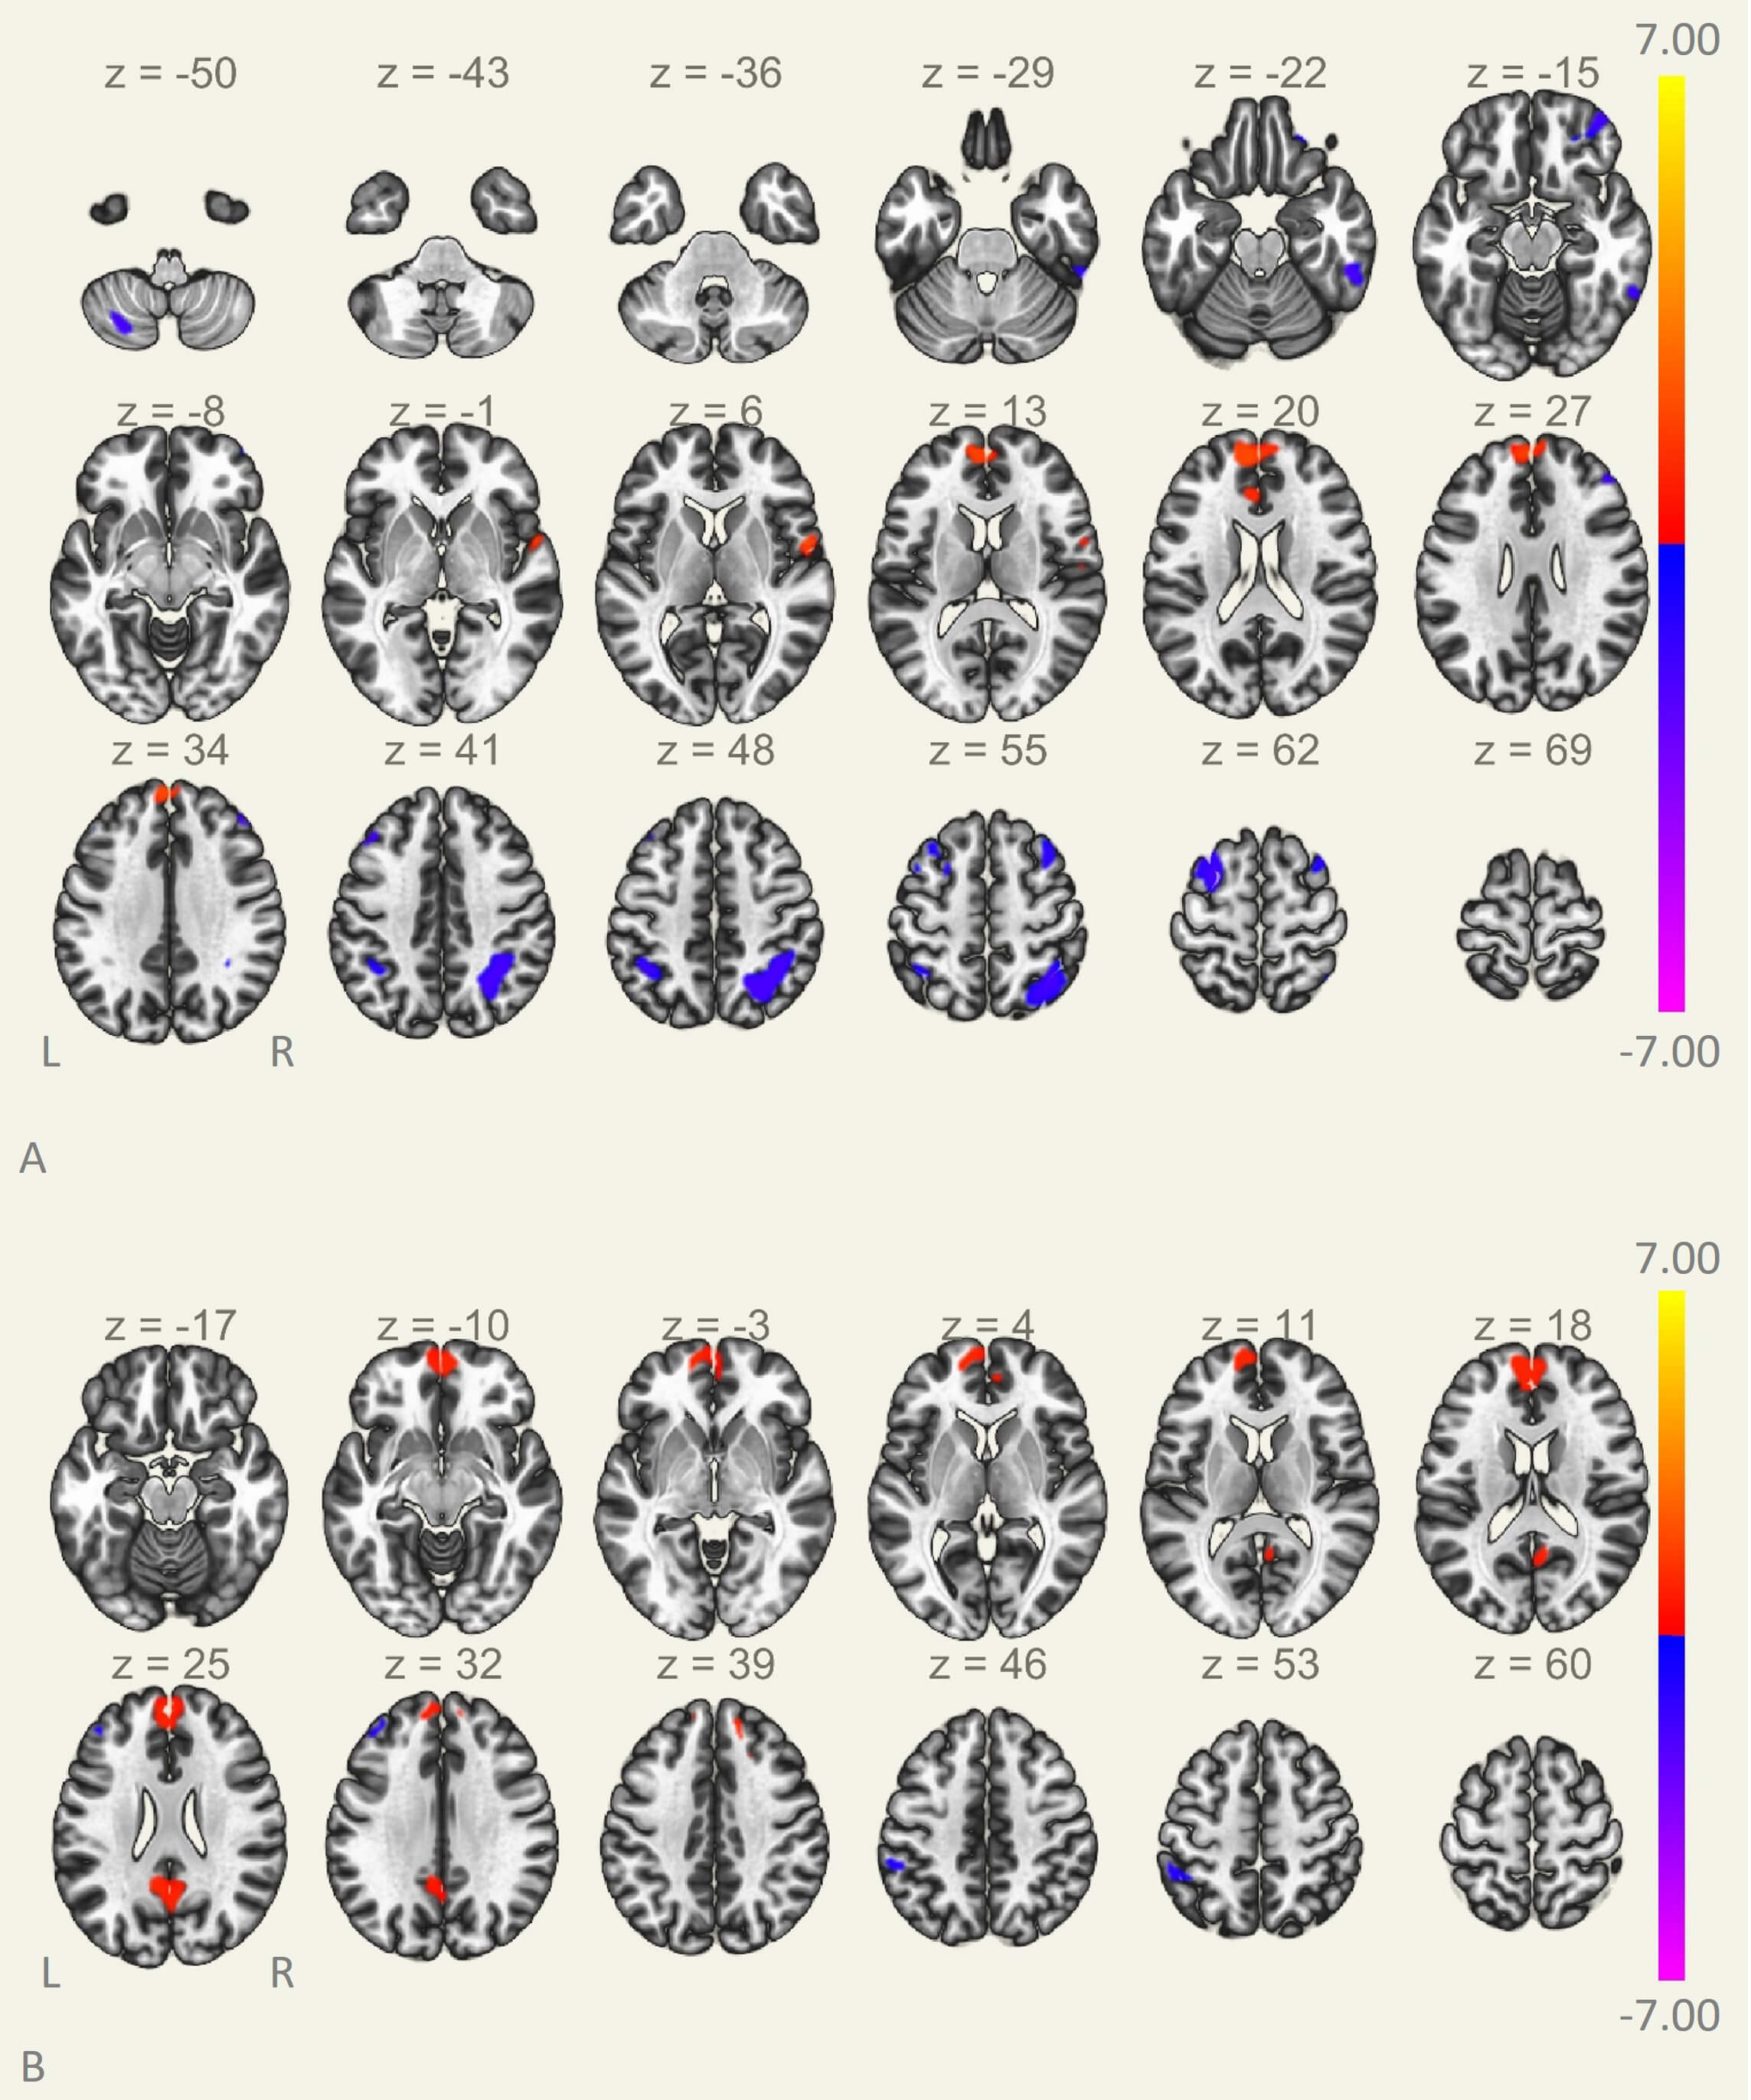 Fig. 2.
Differences in FC of the DLPFC. (A) Right DLPFC. (B) Left DLPFC. x, y, and z: peak Montreal Neurological Institute coordinates; FC, functional connectivity.
The left DLPFC fALFF values were positively correlated with DSST scores (r = 0.349, p = 0.034) (Fig. 3A). However, right DLPFC fALFF values did not correlate with cognitive scores or clinical indicators.
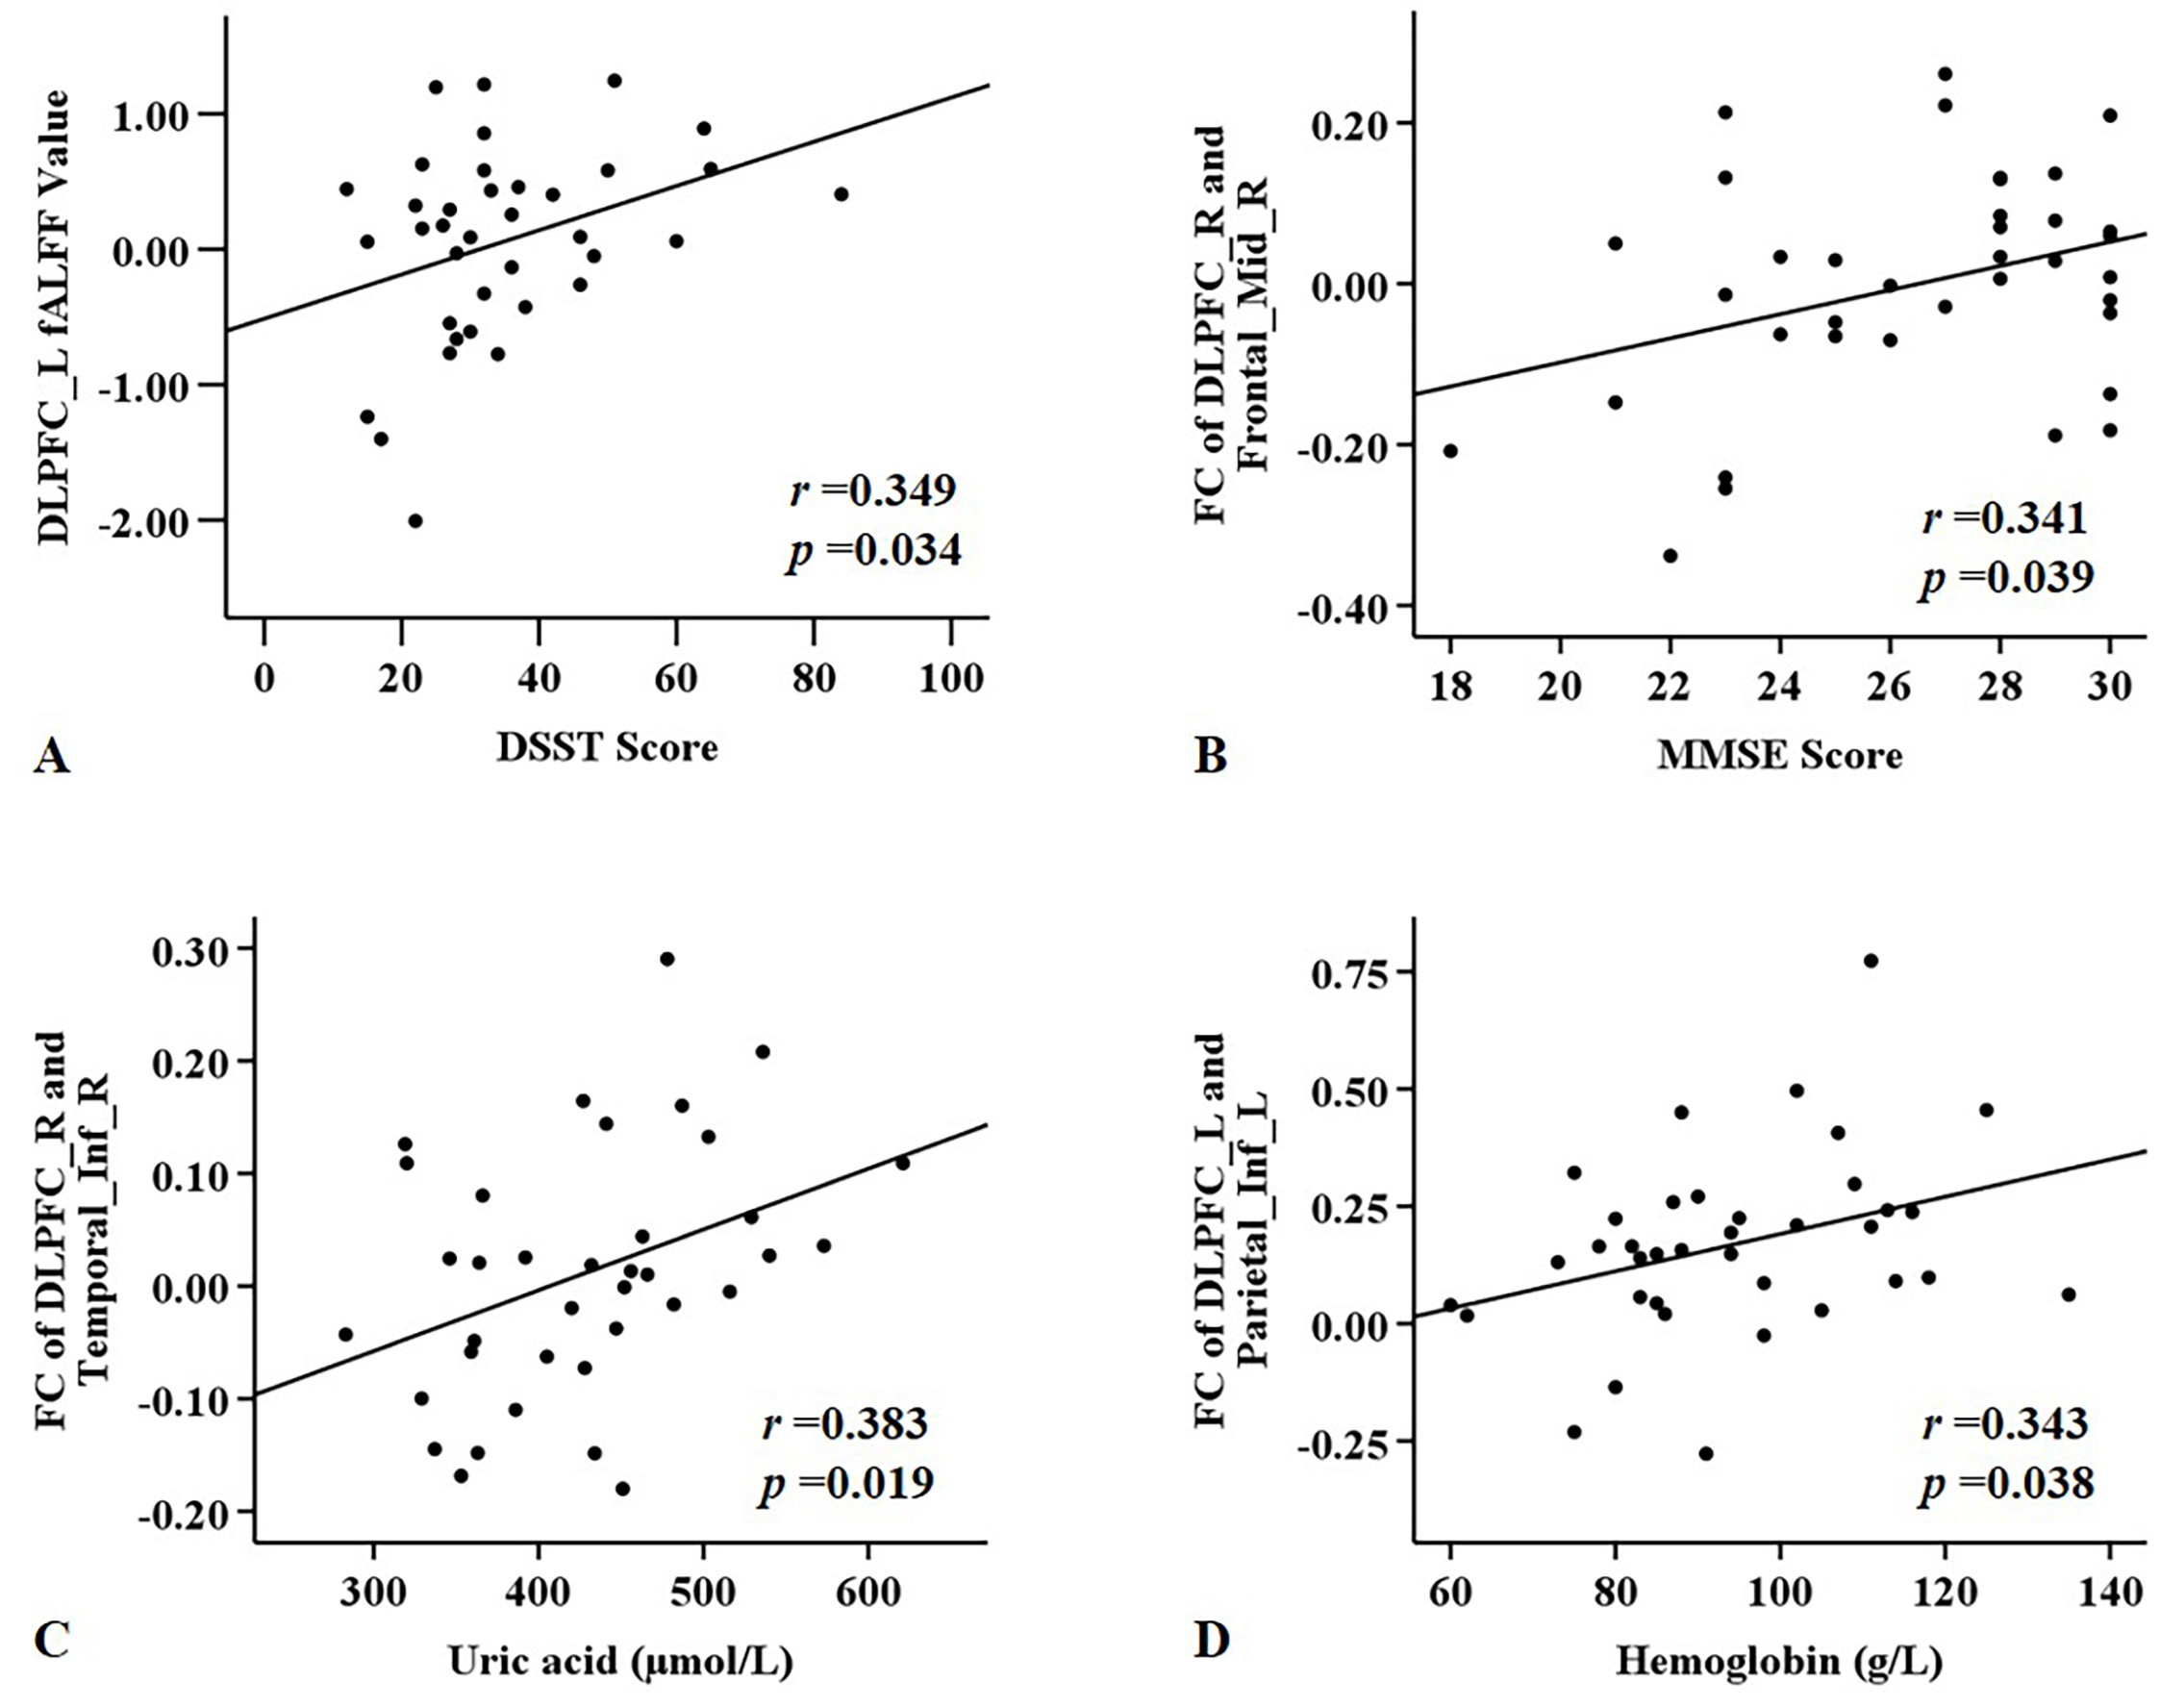 Fig. 3.
Significant correlations between functional ability in the DLPFC and cognitive function scores and clinical indices in ESRD patients. (A) Left DLPFC fALFF values were positively correlated with DSST scores. (B) Altered FC values for the right DLPFC were positively correlated with MMSE scores. (C) Altered FC values for the right DLPFC were positively correlated with the uric acid level. (D) Altered FC values for the left DLPFC were positively correlated with hemoglobin level.
The FC between right DLPFC and right middle frontal gyrus positively correlated with MMSE score (r = 0.341, p = 0.039) (Fig. 3B), while the FC between right DLPFC and right inferior temporal gyrus correlated positively with serum uric acid level (r = 0.383, p = 0.019) (Fig. 3C). The FC between left DLPFC and left inferior parietal gyrus was positively correlated with hemoglobin level (r = 0.343, p = 0.038) (Fig. 3D).
The fALFF values of the right DLPFC showed positive correlations with the FC values between the right DLPFC and right superior parietal gyrus (r = 0.371, p = 0.024) (Fig. 4A), and left inferior parietal gyrus (r = 0.453, p = 0.005) (Fig. 4B). The fALFF and FC values of the left DLPFC showed no significant correlation.
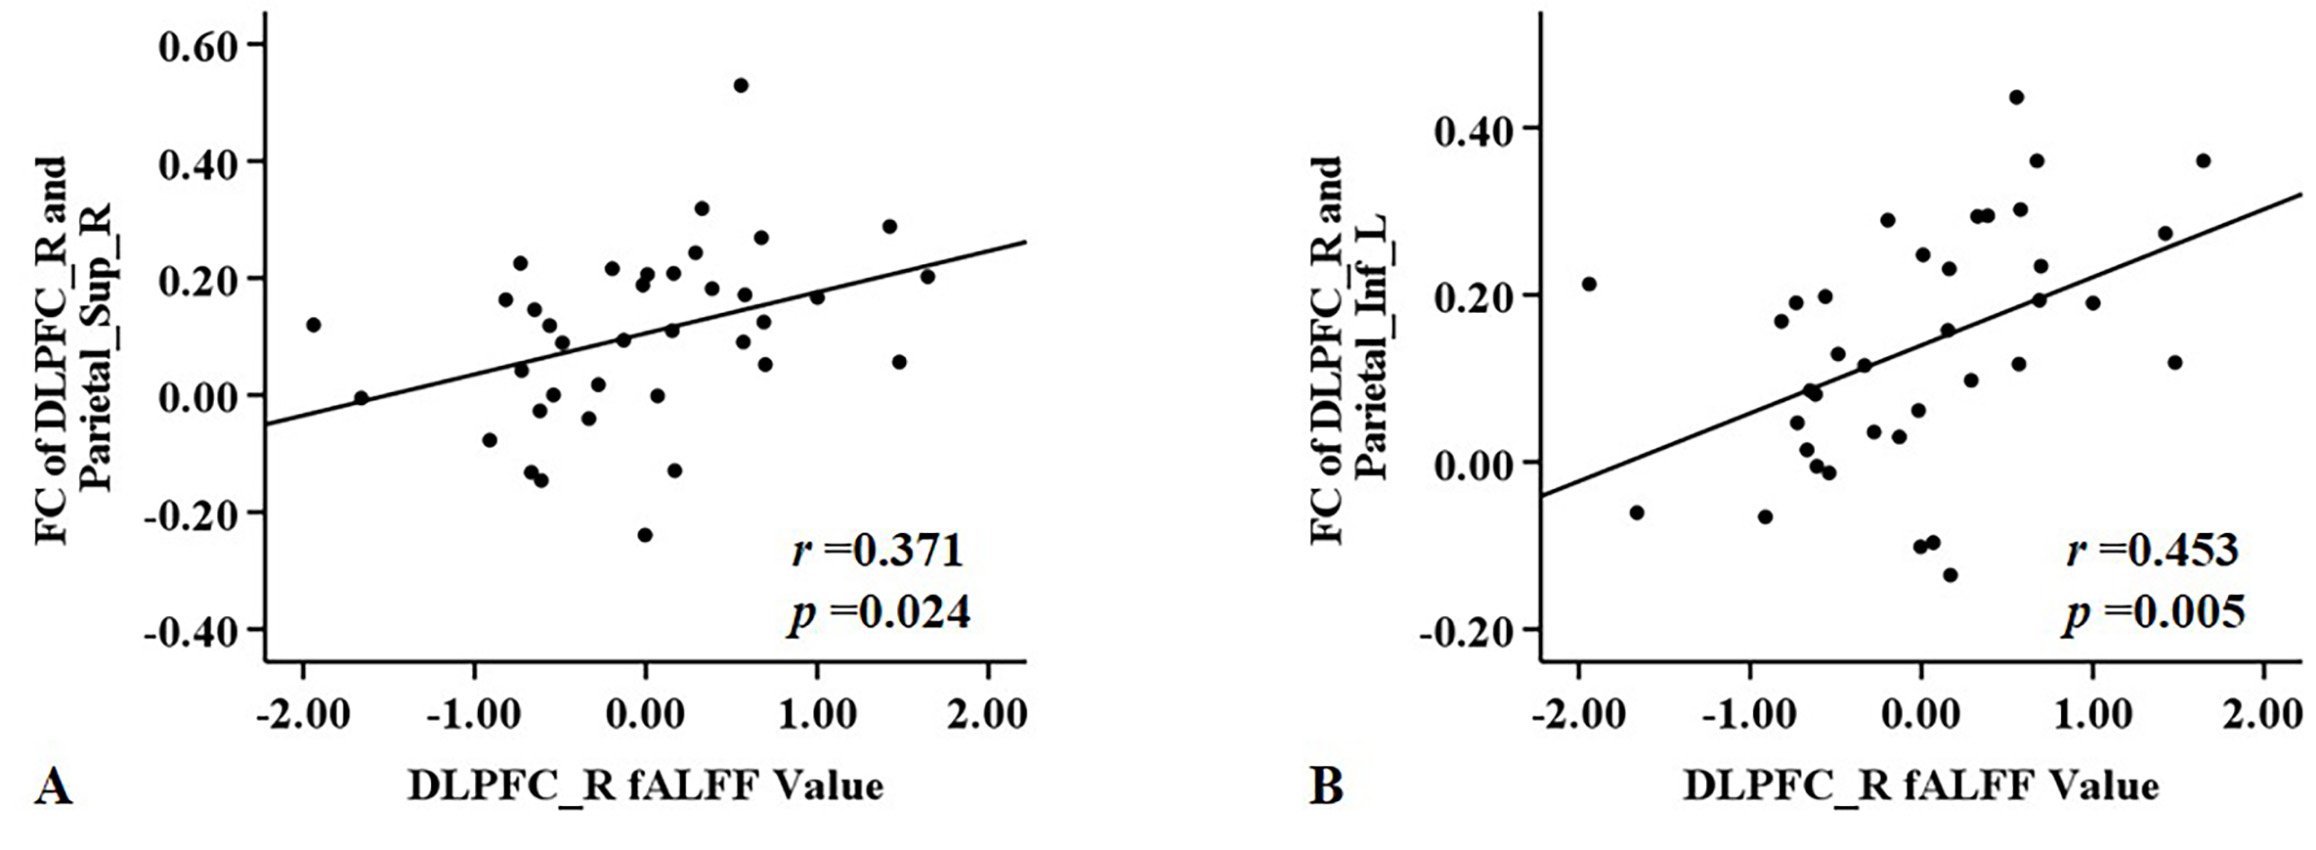 Fig. 4.
Significant correlations between fALFF and FC values for right DLPFC in the ESRD group. (A) Right DLPFC fALFF values were positively correlated with FC values of right DLPFC and right superior parietal gyrus. (B) Right DLPFC fALFF values were positively correlated with FC of right DLPFC and left inferior parietal gyrus.
The fALFF (left DLPFC) and FC (right DLPFC and right middle frontal gyrus) correlated with cognitive function scores. These indicators were used to construct single-factor models and a joint predictive model. LOOCV and ROC curve analysis revealed the AUC for the fALFF value of the left DLPFC was 0.776 (95% CI: 0.230–1.322, accuracy: 69.4%, sensitivity: 70.3%, specificity: 68.6%, Youden index: 0.388, optimal cutoff: 0.481) (Fig. 5). The AUC for the FC between right DLPFC and right middle frontal gyrus was 0.836 (95% CI: 0.176–1.496, accuracy: 80.1%, sensitivity: 78.4%, specificity: 82.9%, Youden index: 0.612, optimal cutoff: 0.509) (Fig. 5). The AUC for the joint prediction probabilities of the fALFF and FC of the DLPFC was 0.893 (95% CI: 0.125–1.660, accuracy: 84.7%, sensitivity: 81.1%, specificity: 88.6%, Youden index: 0.697, optimal cutoff: 0.451) (Fig. 5).
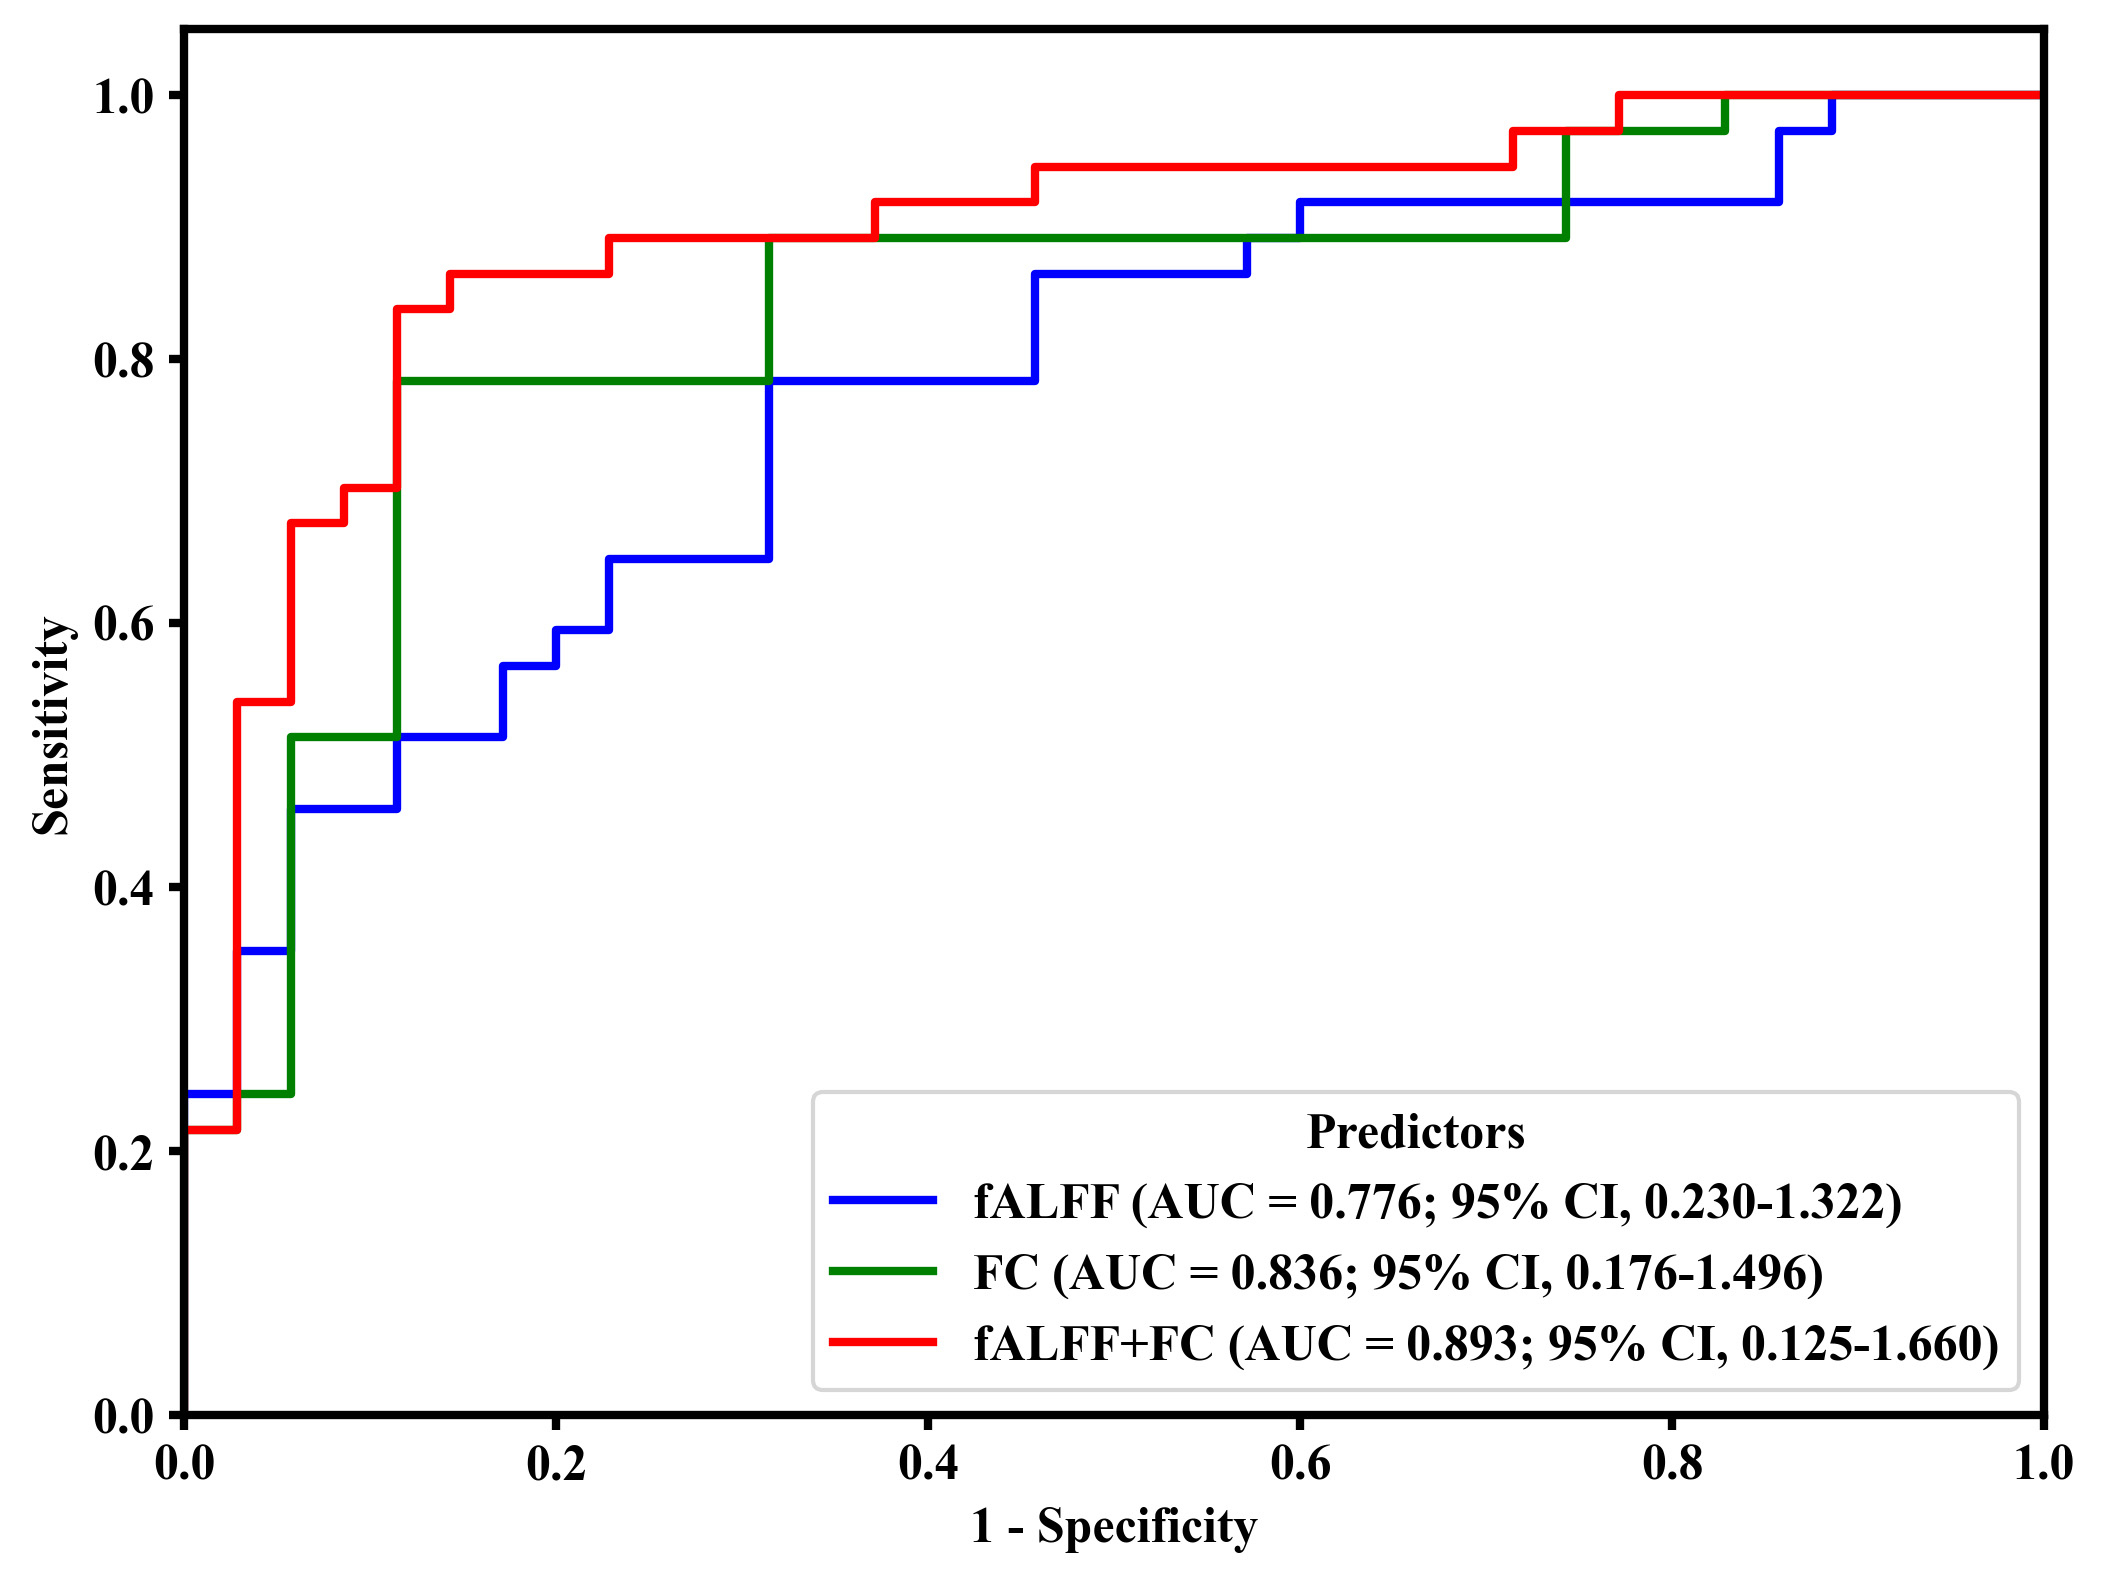 Fig. 5.
Predictive ability of fALFF (left DLPFC), FC (right DLPFC and right middle frontal gyrus), and joint prediction (fALLF + FC) for the detection of cognitive-related brain damage in ESRD. AUC, area under curve; CI: confidence interval.
This study found decreased fALFF values and the reorganization of FC in bilateral DLPFC in ESRD patients at both local and global brain levels. These changes were correlated with cognitive performance, and FC alterations were associated with the levels of serum uric acid and hemoglobin. Importantly, ROC curve analysis showed that functional alterations in the DLPFC were highly predictive of cognitive-related brain damage in ESRD patients. These findings highlight distinct forms of DLPFC functional impairment associated with cognitive decline in ESRD, thereby advancing our understanding of the underlying neural substrates.
Lower fALFF values were found in the DLPFC of ESRD patients. Moreover, they were significantly correlated with lower DSST scores, indicating that decreased executive function may be related to reduced spontaneous neural activity in the DLPFC of these patients. Previous studies have also found that ALFF and ReHo values were reduced in brain areas of the DLPFC [7, 26]. Structural MR also detected abnormalities in the DLPFC, showing that altered gray matter volume was correlated with executive function [23, 24, 25]. Collectively, these findings indicate the DLPFC is an important pathologically-affected brain region for executive dysfunction in ESRD. This highlights the diversity of functional impairments in the DLPFC, which are involved in cognitive impairment in ESRD patients.
The results of FC analysis revealed significantly reduced FC between the bilateral DLPFC and the middle frontal gyrus, superior and inferior parietal lobes in ESRD patients. These brain regions are mainly located in the lateral prefrontal and posterior parietal areas, which form major components of the ECN. Functions of the ECN include cognitive control, attention, executive function, and working memory [31, 32]. Graph theory analysis found that the global efficiency of ECN was reduced in ESRD patients [33]. The node efficiency [13, 33], degree centrality [34], long- and short-range FC [16] of the lateral prefrontal and posterior parietal lobes were also decreased to varying degrees in these patients. A previous study using BA46 region (where the DLPFC is situated) as the seed for FC analysis found that it exhibited enhanced FC with the medial prefrontal cortex, and weakened FC with the inferior temporal gyrus and inferior parietal lobe [17], consistent with findings in the current study. Our results showed that diminished FC between the right DLPFC and the middle frontal gyrus was positively related to decreased cognitive function, suggesting that decreased FC of the DLPFC might play a role in cognitive impairment.
The present study also found that DLPFC exhibited reduced FC with the left posterior cerebellar lobe and the right inferior temporal gyrus, consistent with a previous report [15]. Our previous study also found reduced FC between the cerebellum and the superior and middle frontal gyrus where the DLPFC is located [18]. The cerebellum is not only implicated in the regulation of movement but also in cognitive function. The posterior cerebellar lobe demonstrates extensive FC with the frontal lobe, which is integral to the regulation of cognitive functions including executive function, verbal working memory, and attention [35, 36, 37]. Impairments in these cognitive domains are highly prevalent among patients with ESRD [4, 19]. Abnormalities in the fronto-cerebellar circuit hinder the transmission or communication of information between brain regions, leading to the corresponding executive dysfunction in ESRD patients [18]. The inferior temporal gyrus plays a role in spatial perception as well as cognitive and memory aspects of visual processing [38, 39]. The abnormal visuospatial ability of ESRD patients may be due to a weakened functional connection between the DLPFC and the inferior temporal gyrus.
In addition to finding reduced FC of the DLPFC in ESRD, we also observed enhanced FC between the DLPFC and medial prefrontal cortex, anterior cingulate gyrus, posterior cingulate gyrus, and rolandic operculum. Previous studies also reported increased FC of the DLPFC with the medial prefrontal cortex and posterior cingulate gyrus in ESRD patients [15, 17]. These regions serve as important nodes of the DMN, which is a key network for internal processing and self-cognitive generation. The DMN is associated with multiple cognitive regulations, including self-referential processing, autobiographical memory, envisioning the future, and episodic memory [40, 41]. Previous studies found that ESRD patients with or without cognitive impairment had abnormal FC in DMN [33, 42]. Studies using seed-based FC or graph theory analysis also reported reduced FC or nodal efficiency in the posterior cingulate gyrus and medial prefrontal cortex of ESRD patients [12, 42, 43, 44]. Taken together, these studies suggest DMN has an important role in the occurrence and progression of cognitive impairment in ESRD. The anterior cingulate gyrus (an important node in the SN) and the prefrontal lobe are responsible for cognitive regulation [45]. Previous studies have also found abnormal FC between the anterior cingulate gyrus and several brain regions that are closely associated with cognitive function in ESRD patients [14, 46]. Based on the above findings, we speculate that enhanced FC may serve as a compensatory mechanism to mitigate cognitive decline in patients with ESRD. However, the precise mechanisms underlying this hypothesis require further validation through longitudinal studies. We also found enhanced FC between the DLPFC and the rolandic operculum, which is an important brain region of the sensorimotor network [47]. A previous study found that ESRD patients had microstructural abnormalities in the rolandic operculum [25]. Abnormalities in this region may be associated with sensorimotor abnormalities (restless leg syndrome, pruritus) in ESRD patients, although further study is required to elucidate the specific mechanism.
Brain damage in ESRD patients is linked to multiple risk factors, including retention of uremic toxin, secondary hyperparathyroidism, electrolyte imbalances, and anemia [3, 4, 19]. The present study found positive correlations between FC of the DLPFC and the levels of serum uric acid and hemoglobin. Renal dysfunction can lead to metabolic abnormality of uric acid, which has antioxidant capacity (mostly in plasma), pro-oxidant capacity (mostly in cells), and can exert neurotoxic as well as neuroprotective effects [19, 48]. In the current study, FC between the right DLPFC and right inferior temporal gyrus was observed to correlate positively with the level of uric acid, indicating that uric acid may be neuroprotective in ESRD patients. This finding aligns with existing literature proposing that uric acid exerts its antioxidant effects primarily within the central nervous system, although additional studies are needed to determine the underlying mechanism [48]. Anemia is an important complication of chronic kidney disease and can lead to reduced neural cell function and density due to the lower oxygen supply to the brain [33, 49]. The decrease in brain FC caused by low hemoglobin level may be related to the above mechanism. Overall, these findings suggest that brain function in ESRD patients is significantly influenced by the levels of serum uric acid and hemoglobin. Consequently, effective regulation of serum uric acid and improving anemia could be potential strategies for preventing and mitigating brain damage in ESRD patients.
Cognitive decline in ESRD patients is often neglected by specialist clinicians. Consequently, LOOCV combined with ROC analysis was utilized in this study to determine whether functional changes in DLPFC are predictive of cognitive-related brain damage in ESRD. The current findings showed that fALFF, FC, and their combination in the DLPFC were predictive of cognitive-related brain damage in ESRD, with AUC values of 0.776, 0.836, and 0.893, respectively. The combination of predictors showed higher diagnostic efficacy than single predictors, reflecting the importance of multimodal parameters for comprehending the neural mechanisms of cognitive impairment in ESRD. Our results imply that functional alterations in the DLPFC can effectively predict cognitive-related brain damage in such patients. These findings also suggest potential neuroimaging biomarkers for the early detection, early intervention, and reduced incidence of cognitive impairment in ESRD.
This research has a number of limitations. First, no subgroup analyses (e.g., by cognitive status, dialysis status, or dialysis modality) were performed due to the limited cohort size. Such analyses will require a larger sample size in future studies. Second, vascular and non-vascular factors can interact and contribute to cognitive impairment in ESRD patients. The impact of common vascular risk factors associated with ESRD (e.g., hypertension, hyperlipidemia, and diabetes) on cerebral function and cognitive decline should be further investigated in future large-scale studies. Third, although the correlation and ROC analyses yielded interesting results, the results of the correlation analysis were not statistically significant after FDR correction, with post-hoc analysis revealing insufficient statistical power and indicating a need for further validation in larger study cohorts (Supplementary File). Fourth, physiological parameters such as heart rate and respiration are known confounders of the BOLD signal, but were not recorded in real-time during the fMRI acquisitions. These parameters will be incorporated in future studies and rigorously controlled for during data analysis to improve the specificity of the findings. Finally, this research was cross-sectional in design rather than longitudinal, making it unsuitable to assess the development of cognitive impairment in ESRD patients and to evaluate the effect of clinician interventions.
This study found changes in fALFF and FC in the DLPFC of ESRD patients. The altered brain function of the DLPFC was associated with cognitive function and could effectively predict cognitive-related brain damage. Our results indicate that DLPFC is an important pathognomonic brain region related to cognitive decline in patients with ESRD, thereby providing a more precise neuroimaging biomarker for cognitive impairment.
DLPFC, dorsolateral prefrontal cortex; FC, functional connectivity; ESRD, end-stage renal disease; ALFF, low-frequency fluctuation; BOLD, blood oxygen level-dependent; rs-fMRI, resting-state functional magnetic resonance imaging; fALFF, fractional amplitude of low-frequency fluctuation; ROC, receiver operating characteristic; ReHo, regional homogeneity; DMN, default mode network; SN, salience network; ECN, executive control network; HC, healthy control; MMSE, Mini-Mental State Examination; MoCA, Montreal Cognitive Assessment Scale; DSST, Digit Symbol Substitution Test; TMT-A, Trail-Making Test Part A; MNI, Montreal Neurological Institute; AUC, area under curve; 95% CI, 95% confidence interval.
The data and materials will be available on request.
JF: conception and design of the work, acquisition, analysis, and interpretation of data, drafted the work and substantively revised it. LG: design of the work, acquisition of data; HX, YZ and FZ: acquisition of data. JW and YW: interpretation of data. XQ: design of the work, acquisition of funding. HW: conception and design of the work, have substantively revised the paper. All authors contributed to editorial changes in the manuscript. All authors read and approved the final manuscript. All authors have participated sufficiently in the work and agreed to be accountable for all aspects of the work.
This study involving humans received approval from The Ethics Committee of The First Affiliated Hospital of Anhui Medical University (NO. 2024407) and adhered to the Declaration of Helsinki. Written informed consent was obtained from all the participants.
We appreciate the language editing services provided by the Ejear English editing service and Home for Researchers.
This research received no external funding.
The authors declare no conflict of interest.
Supplementary material associated with this article can be found, in the online version, at https://doi.org/10.31083/JIN46820.
References
Publisher’s Note: IMR Press stays neutral with regard to jurisdictional claims in published maps and institutional affiliations.