


 , Ju Gao 1,†, Yaqun Li 2, Yinggang Xiao 1, Tianfeng Huang 1,*
1 Department of Anesthesiology, Northern Jiangsu People’s Hospital Affiliated to Yangzhou University, 225001 Yangzhou, Jiangsu, China
2 Department of Pain Management, Northern Jiangsu People’s Hospital Affiliated to Yangzhou University, 225001 Yangzhou, Jiangsu, China
†These authors contributed equally.
Abstract
Thalamic hemorrhage pain (THP), a subtype of central post-stroke pain (CPSP), commonly develops following ischemic or hemorrhagic injury to the thalamus. Current therapeutic options remain inadequate due to the absence of well-defined molecular targets. This study aimed to elucidate critical genes implicated in THP pathogenesis through an integrated multi-omics approach.
A mouse model of THP was established and mice were divided into THP and control groups. Comprehensive multi-omics profiling involving transcriptomics, proteomics, metabolomics, ribosome profiling (Ribo-seq), and single-cell RNA sequencing (scRNA-seq) was conducted. Differentially expressed genes (DEGs), differentially expressed proteins (DEPs), ribosome footprint-associated DEGs (RF-DEGs), and differentially expressed metabolites (DEMs) were identified via comparative expression analyses. Hub genes were extracted from the DEGs and subsequently intersected with scRNA-seq DEGs, DEPs, and RF-DEGs to define key gene candidates. These genes underwent gene set enrichment analysis (GSEA), disease association mapping, and drug prediction. Expression levels of key genes were used to delineate critical cell populations, followed by analyses of intercellular communication and pseudotemporal differentiation trajectories. Orthogonal partial least squares discriminant analysis was used to validate the model.
The THP mouse model was successfully validated. Multi-omics analyses yielded distinct profiles of DEGs, single-cell DEGs, DEPs, RF-DEGs, and DEMs, which were functionally annotated through enrichment strategies. Notably, 12 hub genes were prioritized, of which eight key genes (ferritin light chain 1 (Ftl1), tropomyosin 4 (Tpm4), C-C motif chemokine ligand 3 (Ccl3), C-C motif chemokine ligand 4 (Ccl4), C-C motif chemokine receptor 2 (Ccr2), interleukin 33 (Il33), C-X-C motif chemokine ligand 2 (Cxcl2), and Lymphocyte antigen 6 complex, locus C2 (Ly6c2) were identified. These genes were predominantly associated with oxidative phosphorylation and ribosomal pathways. Further analyses revealed strong associations with necrotic and inflammatory processes, and compounds such as alprostadil and anisomycin were identified as potential therapeutic agents. Single-cell analyses highlighted six pivotal cell types, including endothelial cells and macrophages. Intercellular communication networks and lineage progression patterns of these cells were systematically characterized, alongside spatial and temporal expression profiles of key genes.
This study established a validated THP mouse model and employed a multi-omics integration strategy to identify eight key genes and associated molecular pathways. These findings provide novel mechanistic insights into THP pathogenesis and highlight promising targets for therapeutic intervention.
Keywords
- thalamic hemorrhage
- pain
- genomics
- proteomics
- metabolomics
- RNA sequencing
- genes
Stroke represents the primary cause of disability and mortality in the aging population [1], profoundly impairing quality of life and imposing significant financial burden on caregivers. Central post-stroke pain (CPSP), classified as a central neuropathic pain syndrome, arises from lesions in the somatosensory system following stroke. The prevalence of CPSP following hemorrhagic stroke has been reported to range between 8% and 46%. The thalamus, a vital relay center for nociceptive transmission, is frequently implicated in the pathogenesis of CPSP, with thalamic hemorrhage identified as a major etiological factor. When hemorrhagic or ischemic events involve the thalamus, the incidence of CPSP may escalate to 80% [2, 3, 4]. Lesions associated with CPSP frequently localize to the ventral posterolateral (VPL) and ventral posteromedial (VPM) nuclei of the thalamus—regions notably susceptible to CPSP development [5]. Current pharmacological interventions are largely inadequate, often yielding limited therapeutic benefit and frequent adverse effects [6, 7, 8]. Despite the clinical burden, the mechanistic role of CPSP remains insufficiently elucidated, thereby constraining the advancement of effective and targeted therapeutic strategies.
Recent preclinical investigations into the molecular pathophysiology of thalamic hemorrhage (TH) have revealed novel biomarkers with potential prognostic and therapeutic relevance [9, 10, 11]. Cerebral hemorrhage has shown to induce widespread transcriptional alterations, highlighting dysregulated genes as viable targets for pharmacological intervention in CPSP [12, 13]. Technological advancements in high-throughput sequencing have enabled the generation of diverse omics datasets, including transcriptomics, metabolomics, ribosome profiling, and proteomics, facilitating multidimensional understanding of disease processes that surpasses the limitations of single-layer analyses [14, 15]. Integrative multi-omics approaches allow for the identification of biologically meaningful biomarkers by revealing cross-talk among various molecular pathways. In parallel, single-cell RNA sequencing (scRNA-seq) significantly enhances data resolution by enabling gene expression profiling at the individual cell level. This technique captures cellular heterogeneity and delineates dynamic transitions in cellular states and transcriptional programs during disease progression [16, 17, 18]. Despite these advances, current CPSP research has predominantly concentrated on isolated molecules or discrete signaling pathways, lacking a comprehensive systems-level perspective. A biologically integrated understanding of CPSP pathogenesis necessitates holistic analyses that unify data across multiple molecular layers.
To address this gap, the present study established a thalamic hemorrhage pain (THP) mouse model and conducted comprehensive multi-omics analyses, including transcriptomics, proteomics, metabolomics, ribosome profiling, and single-cell transcriptomics, on thalamic tissue. The resulting datasets were systematically processed and subjected to bioinformatics tools to identify critical genes. By integrating transcriptomic, single-cell, and proteomic data, key molecular regulators were identified, providing mechanistic insights into THP pathogenesis and highlighting potential diagnostic and therapeutic targets. This integrative approach enabled the construction of a dynamic regulatory network governing THP, providing a robust framework for future therapeutic discovery.
A total of 120 adult C57BL/6 mice (7–8 weeks old, 25–30 g) were acquired from Beijing Weitong Lihua Experimental Animal Technical Co., Ltd. (Beijing, China). The TH model was established by Wuhan Servicebio Biotechnology Co., Ltd. (Wuhan, Hubei, China) and approved by Beijing Weitong Lihua Experimental Animal Technical Co., Ltd. (Approval No. 2022045). All subsequent procedures, including behavioral assessments, tissue collection, and downstream analyses, were conducted under ethical approval of the Animal Care and Use Committee of the Medical College of Yangzhou University (Approval No. 202303874). All animal experiments were performed in strict accordance with the National Institutes of Health Guide for the Care and Use of Laboratory Animals. Mice were randomly assigned to two experimental groups: a model group (designated as the THP group) and a control group. Validation of the THP mouse model was confirmed by both hematoxylin and eosin staining and behavioral assessments as previously described [19]. Thalamic tissues were collected from both groups for comprehensive multi-omics sequencing. Sample allocation for each sequencing modality was implemented as follows: transcriptomics (n = 3 mice per group), proteomics (n = 3 mice per group), metabolomics (n = 9 mice per group), single-cell transcriptomics (n = 2 mice per group), and ribosome profiling (n = 3 mice per group). Mice were anesthetized with vaporized isoflurane (RWD Life Science, Shenzhen, Guangdong, China; Cat. No. R510-22-10), administered at 2.5% for induction and maintained at 2.0% during the procedure. Animals were then positioned in a stereotaxic apparatus (RWD, 68025, Shenzhen, Guangdong, China). Under stereotactic guidance, Collagenase IV (Coll IV; #C2139-1G, Sigma-Aldrich, St. Louis, MO, USA; 0.01 U/10 nL in sterile saline) was microinjected into the right ventral posteromedial (VPM) and ventral posterolateral (VPL) thalamic nuclei. Stereotaxic coordinates relative to bregma were: anterior-posterior (AP): –0.82 mm to –2.30 mm; medial-lateral (ML): +1.30 mm to –1.95 mm; and dorsal-ventral (DV): –3.01 mm to –4.25 mm from the skull surface, based on the Paxinos and Franklin mouse brain atlas. In the sham-operated group, an equal volume of sterile saline was injected at the same coordinates. Following injection, the glass micropipette was held in place for 10 min to ensure adequate dispersion of the Coll IV solution before being slowly withdrawn. The surgical site was then irrigated with sterile saline and disinfected with iodophor, followed by closure with wound clips.
Following decapitation, the scalp was incised to expose the skull, and all dissection procedures were performed on ice to preserve tissue integrity. The skull was carefully opened with fine scissors (Lige Science, Guangzhou, Guangdong, China; Cat No. LG01-107-5), the brain was excised, and the thalamus was isolated. Tissue samples were promptly transferred into pre-labeled EP tubes (Thermo Fisher Scientific, Waltham, MA, USA; Cat No. 508-GRD-Q), snap-frozen in liquid nitrogen (Huate Gas, Foshan, Guangdong, China; Cat No. 7727-37-9), and subsequently stored at –80 °C for long-term preservation. High-throughput sequencing and omics analyses were outsourced to certified third-party providers. Single-nucleus RNA sequencing (snRNA-seq), quantitative proteomics, and untargeted metabolomics were conducted by Hangzhou Lianchuan Biotechnology Co., Ltd. (Hangzhou, Zhejiang, China), while bulk RNA sequencing (RNA-seq) and ribosome profiling (Ribo-seq) were performed by Guangzhou Epigenetic Biotechnology Co., Ltd. (Guangzhou, Guangdong, China). All raw and processed data have been deposited in publicly accessible repositories. Bulk RNA-seq data are available in the NCBI Gene Expression Omnibus (GEO, https://www.ncbi.nlm.nih.gov/geo/) under accession number of GSE275389; proteomic data have been deposited in the ProteomeXchange Consortium via the PRIDE (https://www.ebi.ac.uk/pride) partner repository under identifier of PXD058910; metabolomic data are available in the MetaboLights database (https://www.ebi.ac.uk/metabolights/) under accession number of MTBLS11941; and snRNA-seq data have been deposited in GEO under accession number of GSE227033.
Single-cell transcriptomic analysis was performed using the Seurat v5.0.1
package (https://satijalab.org/seurat) [20], following stringent quality
control (QC) procedures. Key cellular metrics, including the number of detected
genes per cell (nFeature_RNA), total RNA count per cell (nCount_RNA), and
mitochondrial gene expression percentage (percent.mt), were computed and
visualized. Genes expressed in fewer than three cells and cells with fewer than
200 detected genes were excluded from downstream analysis. Cells meeting the
criteria of nFeature_RNA
Cell clusters identified via t-SNE were annotated into specific cell
types using canonical marker genes obtained from the Tabula Muris Senis database
(https://tabula-muris.ds.czbiohub.org/). The relative abundance of each cell type
in the THP and control groups was quantified and visualized, and cell types
exhibiting statistically significant differences (p
Transcriptomic count data were quantified using FeatureCounts v2.0.3
(https://subread.sourceforge.net/featureCounts.html) [21] and normalized to
fragments per kilobase of transcript per million mapped reads (FPKM), enabling
assessment of gene expression distributions in individual samples and
facilitating cross-sample expression comparisons. PCA was subsequently applied
for dimensionality reduction, and sample distribution across PCs was visualized
via a PCA plot. Differential expression analysis between the THP and
control groups was conducted using DESeq2 v1.36.0
(https://bioconductor.org/packages/release/bioc/html/DESeq2.html) [22], with
significance thresholds set at p
Proteomic data were normalized using Spectronaut 15.0 software
(https://biognosys.com/software/spectronaut/) [26], enabling stringent QC through
spectral matching and scoring of detected peptides against theoretical spectra.
Score-based probability assessments ensured accuracy, and peptides meeting the
criteria of high confidence scores, false discovery rate (FDR)
PCA for metabonomic profiling was performed using the “Gmodels” 2.19.1 package
(https://github.com/r-gregmisc/gmodels). Partial least squares discriminant
analysis (PLS-DA) and orthogonal PLS-DA (OPLS-DA) were implemented via
the “mixOmics” 3.19 (https://mixomics.org/install/) [28] and “ropls” v1.36.0
(https://bioconductor.org/packages/release/bioc/html/ropls.html) [29] packages,
with the latter serving to validate model robustness. Visualization was carried
out using the “ggplot2” 3.4.4 package. To mitigate overfitting, model
reliability was evaluated through seven-fold cross-validation and 200 iterations
of response permutation testing (RPT). Differential metabolites (THP-DEMs)
between the THP and control groups were identified through combined
multidimensional and unidimensional statistical approaches, with significance
defined as p
For Ribo-seq data preprocessing, QC was applied to exclude reads containing
adapter sequences, over 10% ambiguous bases (N), or a quality score below 20
(Q20) for
Key genes were identified by integrating hub gene sets derived from THP-DEPs,
cell-DEGs, and RF-DEGs. Specifically, “protein_hub” and “ribosome_hub”
genes were defined by the intersection of hub genes with THP-DEPs and RF-DEGs,
respectively. Overlaps between these hub gene subsets and cell-DEGs were further
analyzed using the “UpSetR” 1.4.0 package
(https://doi.org/10.1093/bioinformatics/btx364), enabling the final selection of
key genes. To elucidate the biological functions and pathways associated with
these key genes, gene set enrichment analysis (GSEA) was performed utilizing the
mouse KEGG gene sets from the Molecular Signatures Database (MSigDB,
http://software.broadinstitute.org/gsea/msigdb/index.jsp). Spearman correlation
coefficients were computed between each key gene and all transcriptome-wide
genes, followed by ranking based on descending correlation values. GSEA was then
conducted using the “clusterProfiler” 4.10.2 package, applying thresholds of
adj.p
To investigate potential disease associations, key genes were analyzed using the Comparative Toxicogenomics Database (CTD, https://ctdbase.org/search/), identifying the top ten genes with the highest disease relevance. Drug-target associations were predicted using the DSigDB database (https://dsigdb.tanlab.org/DSigDBv1.0/), revealing compounds with potential therapeutic relevance for the identified key genes. The resulting disease-gene and drug-gene interaction networks were visualized using Cytoscape 3.10.2.
To identify key cell populations associated with the expression of pivotal genes
at the single-cell level, the AddModuleScore function from the Seurat
package (v5.0.1) was utilized, using a predefined set of key genes. Differential
expression analysis between THP and control groups was conducted in
immune-related cell subsets using the Wilcoxon test (p
Total RNA was isolated from the thalamic tissue of mice three days post-Coll IV injection using the RNA Easy Fast Tissue Kit (DP451, TIANGEN, Beijing, China), followed by reverse transcription into cDNA with the FastQuant RT Kit containing gDNase (KR116, TIANGEN), in accordance with the manufacturer’s protocol. Primers targeting eight key gene transcripts were designed based on NCBI database sequences (https://www.ncbi.nlm.nih.gov/) using Primer3 (https://primer3.org/) (Table 1). Quantitative real-time PCR was performed using ChamQ SYBR qPCR Master Mix (Q311-02, Vazyme, Nanjing, Jiangsu, China) on the Step One Plus Real-Time PCR System (Applied Biosystems, Foster City, CA, USA). Relative transcript levels were quantified using the 2-ΔΔCT method [35], with ACTB serving as the internal control. Normalized gene expression was expressed as a fold change relative to the mean expression observed in the sham group.
| Gene | NCBI ID | Forward primer 5′-3′ | Reverse primer 5′-3′ |
| Ftl1 | NM_010240.2 | CTTCCTGGAAAGCCACTATCT | GCTCAAAGAGATACTCGCCCA |
| Tpm4 | NM_001001491.2 | CACATCACTGACGAAGCCGA | CCAGGTCACCACACTTTAGTTC |
| Ccl3 | NM_011337.2 | TATGGAGCTGACACCCCGAC | CGGTTTCTCTTAGTCAGGAAAATGA |
| Ccl4 | NM_013652.2 | CTTCTGTGCTCCAGGGTTCTC | AGCAAAGACTGCTGGTCTCAT |
| Ccr2 | NM_009915.2 | CCTCAGTTCATCCACGGCAT | AGGGAGTAGAGTGGAGGCAG |
| Il33 | NM_001164724.2 | ATCCAAGCATTTGCTGCGTC | GTAGCACCTGGTCTTGCTCT |
| Cxcl2 | NM_009140.2 | GAAGACCCTGCCAAGGGTTG | AGGCAAACTTTTTGACCGCC |
| Ly6c2 | NM_001415994.1 | TGTGTGCAGGAAGAGCTCAG | AAAGAAAGGCACTGACGGGT |
| Actb | NM_007393.5 | GGCTGTATTCCCCTCCATCG | CCAGTTGGTAACAATGCCATGT |
Ftl1, ferritin light chain 1; Tpm4, tropomyosin 4; Ccl3, C-C motif chemokine ligand 3; Ccl4, C-C motif chemokine ligand 4; Ccr2, C-C motif chemokine receptor 2; Il33, interleukin 33; Cxcl2, C-X-C motif chemokine ligand 2; Ly6c2, lymphocyte antigen 6 complex locus C2; Actb, actin beta; RT-qPCR, reverse transcription quantitative polymerase chain reaction.
Bioinformatic analyses were performed using R 4.2.2 software
(https://cran.r-project.org/bin/windows/base/old/). Group comparisons were
performed using the Wilcoxon test, and statistical significance was defined as
p
Following QC, 28,750 cells and 32,935 genes were retained for single-cell
analysis (Supplementary Fig. 1A), and the top 2000 most variable genes
were identified (Supplementary Fig. 1B). Based on the PCA scree plot and
fragmentation profile, the first 20 PCs were selected for downstream clustering
(p
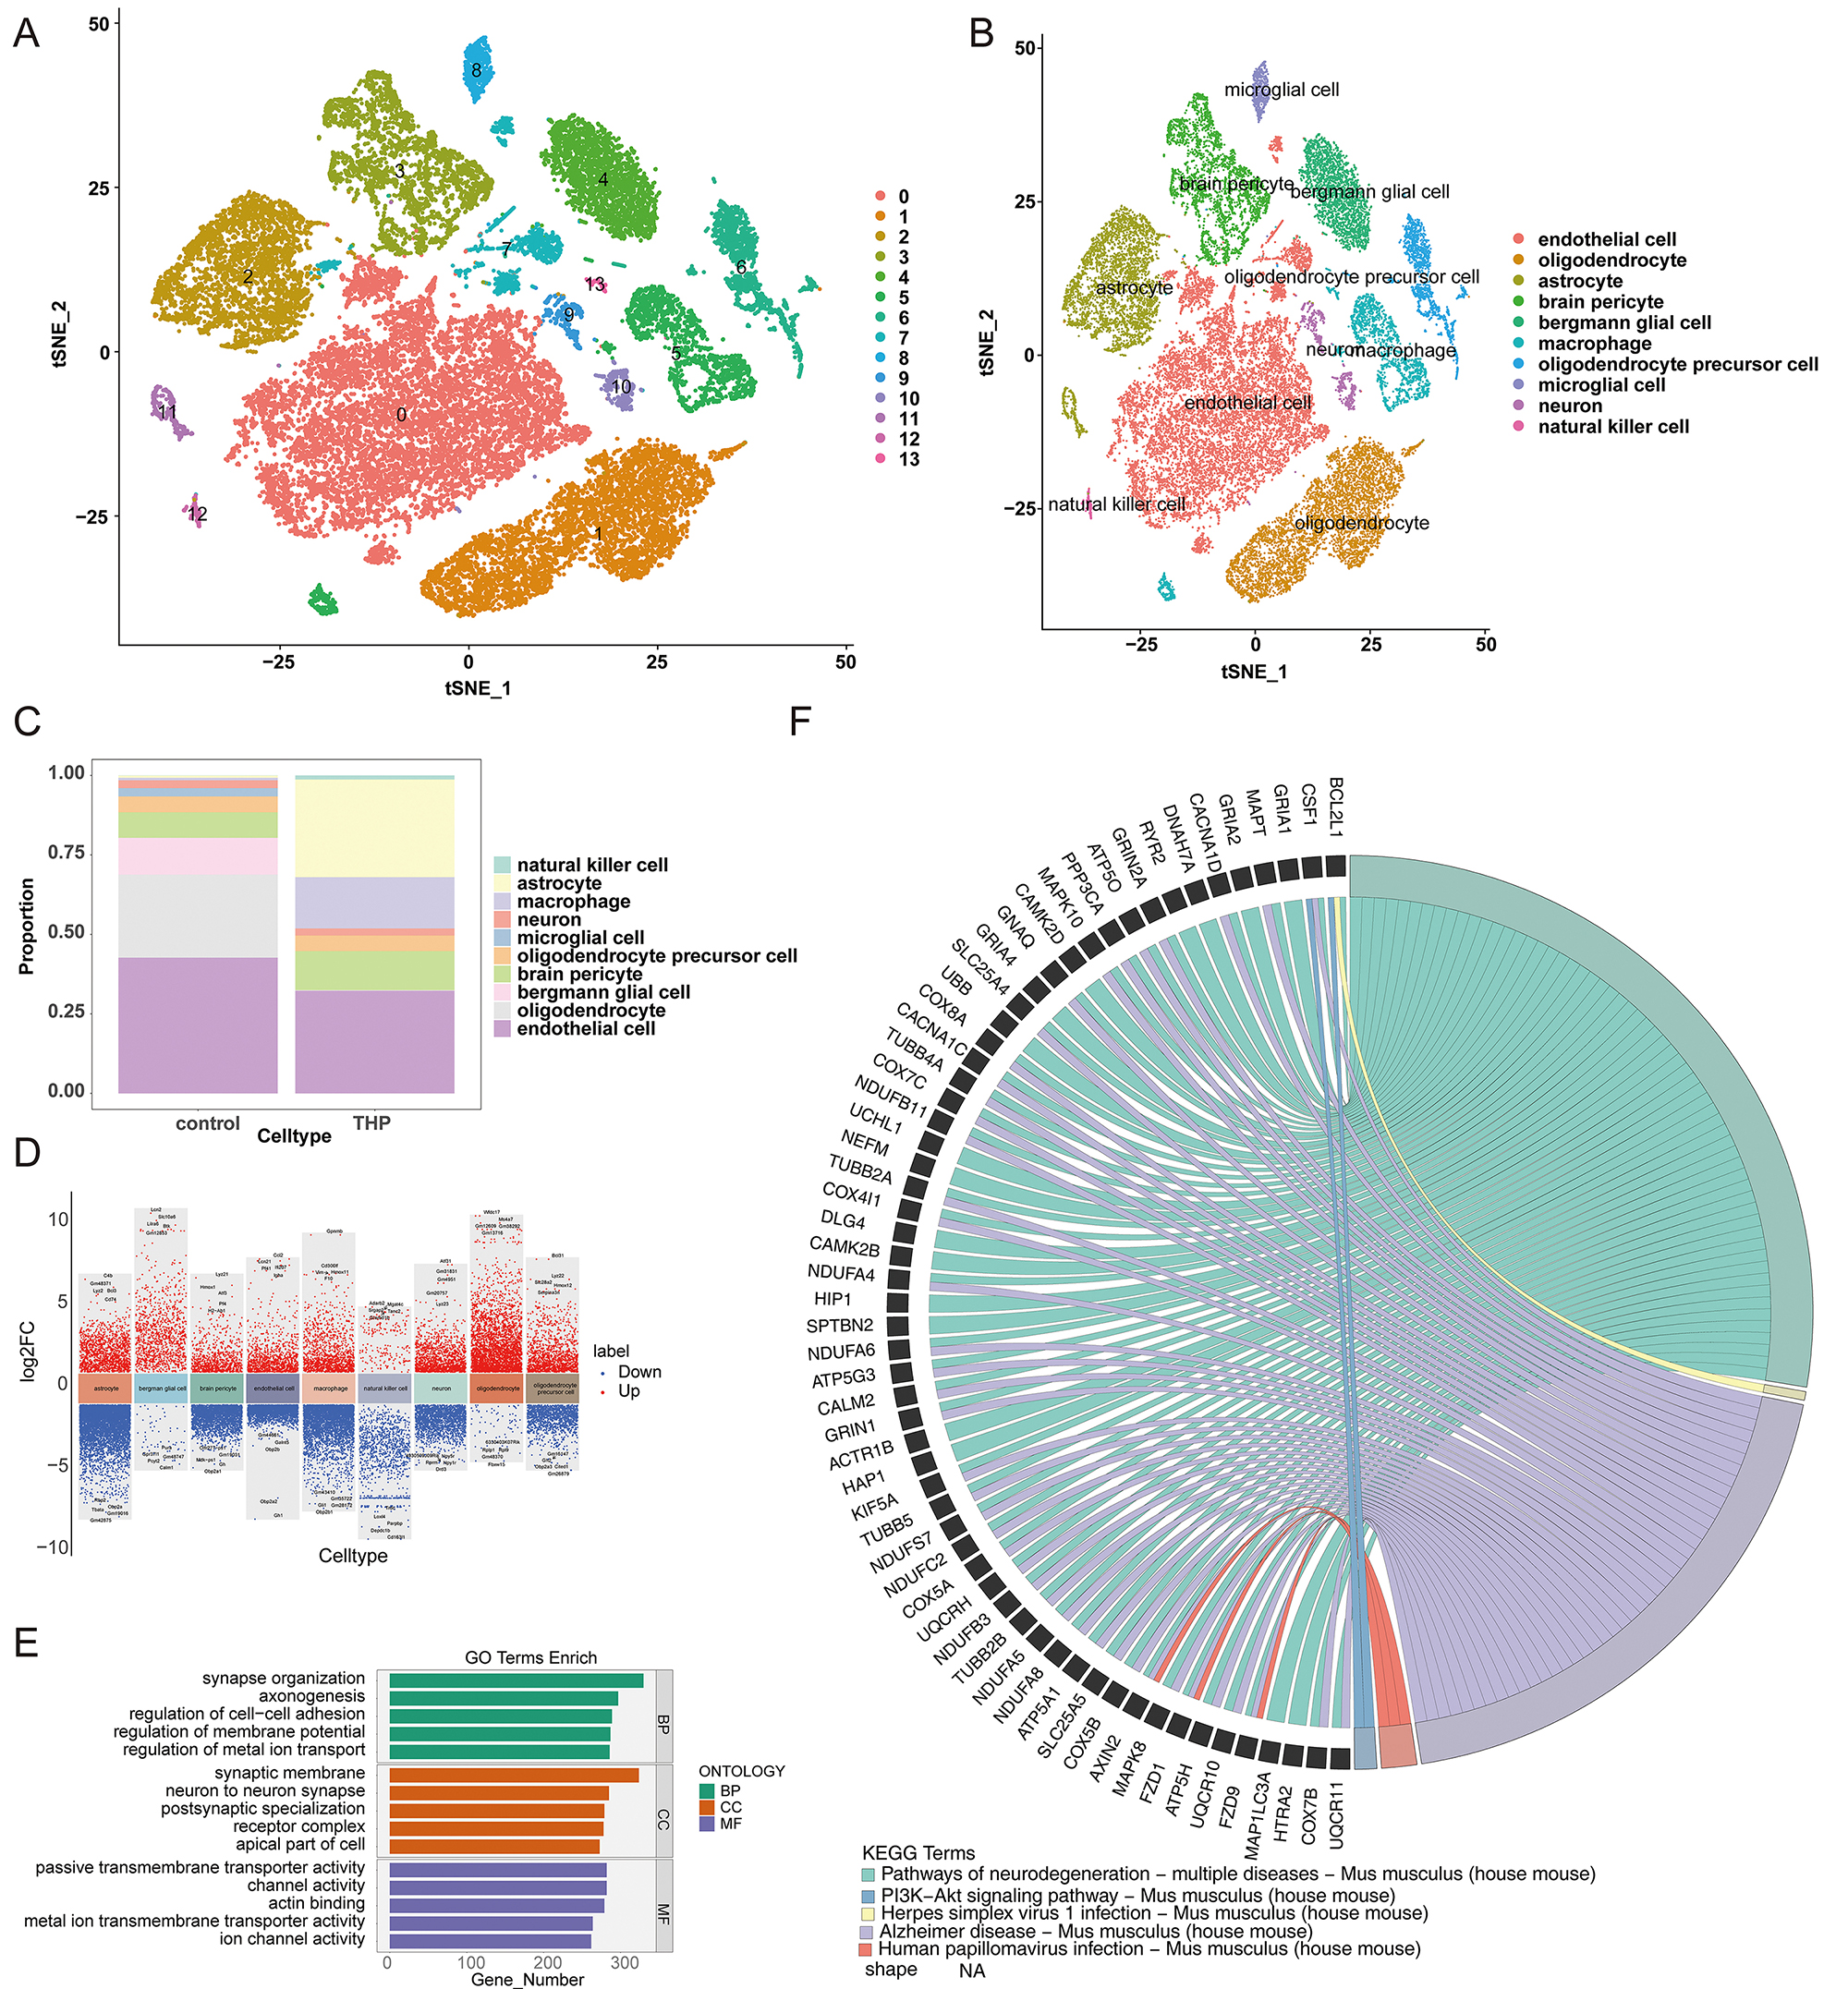 Fig. 1.
Overview of single-cell analysis of cell-DEGs. (A) Identification of 14 distinct cell clusters using t-SNE. (B) Annotation of 10 cell types via marker genes. (C) Proportions of annotated cells in THP and control groups. (D) Overview of cell-DEGs using single-cell analysis. (E) GO analysis of signaling pathways associated with differentially expressed genes in single cells. (F) KEGG pathway analysis of signaling pathways associated with differentially expressed genes in single cells. DEGs, differentially expressed genes; t-SNE, t-distributed stochastic neighbor embedding; THP, thalamic hemorrhage pain; GO, Gene Ontology; KEGG, Kyoto Encyclopedia of Genes and Genomes; BP, biological process; CC, cellular component; MF, molecular function; NA, not applicable.
Transcriptome profiling identified 12 hub genes with potential relevance to THP-associated pathology. QC metrics for the transcriptomic dataset are detailed in Supplementary Fig. 3. Differential expression analysis detected 376 THP-DEGs, including 211 upregulated and 165 downregulated transcripts (Fig. 2A). The top 20 THP-DEGs, ranked by absolute log2FC, were further analyzed for expression patterns and distribution (Fig. 2B). GO enrichment analysis yielded 1569 significant terms (Supplementary Table 1), emphasizing biological processes, such as the positive regulation of responses to external stimuli and secretion, cellular components including secretory granules and membrane microdomains, and molecular functions, involving G protein-coupled receptor binding and passive transmembrane transporter activity (Fig. 2C). KEGG pathway analysis indicated significant enrichment in pathways related to neuroactive ligand-receptor interactions, cytokine-cytokine receptor interactions, calcium signaling, and additional intercellular signaling cascades (Fig. 2D), underscoring their potential role in cellular communication and signal mediation. A PPI network was constructed after removing isolated and singly connected nodes, revealing Il6 as the central node with the highest connectivity (Fig. 2E). Integration of five distinct analytical algorithms led to the consistent identification of 12 hub genes: Ccl3, Ccl4, Ccr2, Il33, Cxcl2, interleukin 1 receptor antagonist (Il1rn), selectin P (Selp), C-C motif chemokine ligand 17 (Ccl17), selectin L (Sell), Ly6c2, selectin E (Sele), and indoleamine 2,3-dioxygenase 1 (Ido1) (Fig. 2F). In the PPI network of hub genes, Ccr2, Ccl4, and Ccl3 displayed prominent interaction patterns, suggesting a core role in the regulatory network (Fig. 2G).
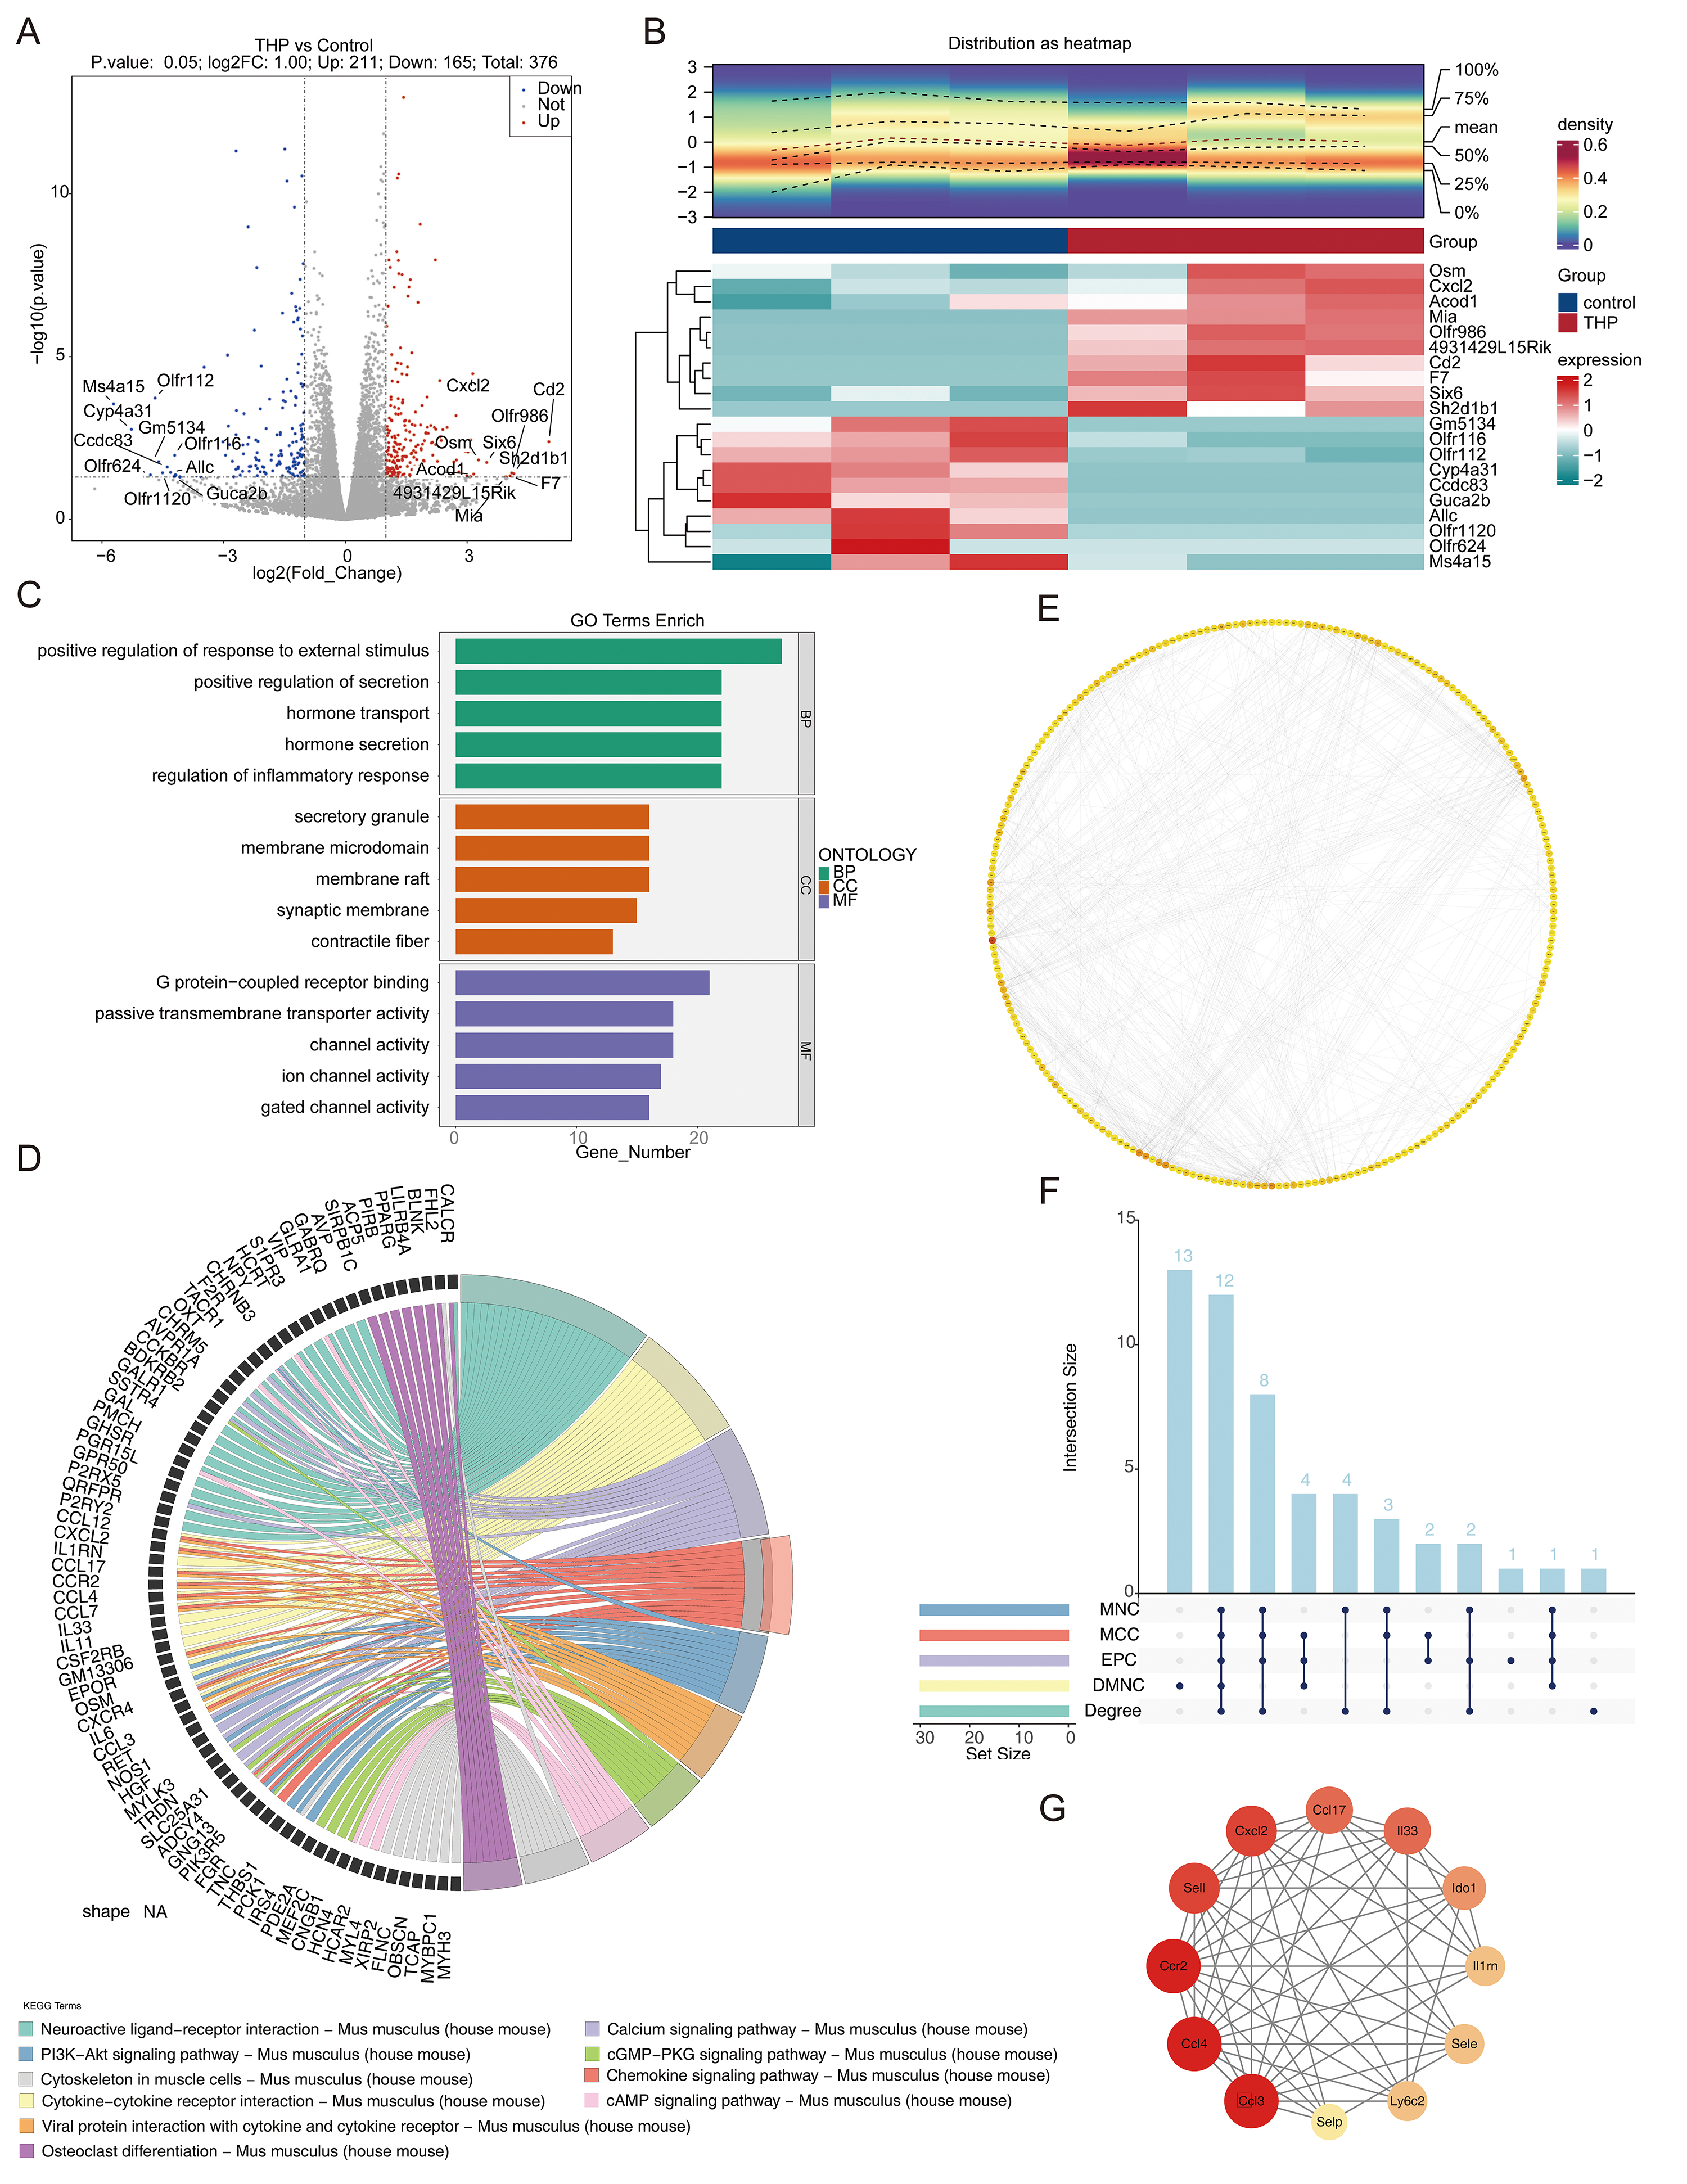 Fig. 2.
Overview of THP-DEGs using transcriptome analysis. (A) Volcano plot of THP-DEGs using transcriptome analysis. (B) Top 20 THP-DEGs identified by transcriptome analysis. (C) GO analysis of signaling pathways associated with differentially expressed genes. (D) KEGG analysis of signaling pathways associated with differentially expressed genes. (E) Interacting genes identified from the PPI network. (F,G) Hub genes identified using transcriptome analysis of THP-DEGs. PPI, protein-protein interaction; MCC, Maximal Clique Centrality; DMNC, density of maximum neighborhood component, MNC, maximum neighborhood component, EPC, edge percolated component; cGMP, cGMP-dependent protein kinase; PKG, protein kinase G; cAMP, cyclic adenosine monophosphate.
THP-DEPs were identified via differential expression analysis. QC of the proteomic data confirmed uniform sample distribution and appropriate clustering patterns, indicating reliable data consistency across samples (Supplementary Fig. 4). A total of 106 THP-DEPs were detected, including 40 upregulated and 66 downregulated proteins (Fig. 3A,B). GO analysis yielded 217 enriched terms (Supplementary Table 2), with the most significant categories involving cytoplasm and intracellular anatomical structures (CC), protein binding (e.g., glycosaminoglycan binding), regulation of protein activity (e.g., protein phosphatase inhibitor activity) (MF), cellular component morphogenesis, and postsynapse organization (BP) (Fig. 3C). These results indicate that THP-DEPs may exert their effects predominantly through protein binding and modulation of enzymatic activity. KEGG pathway enrichment revealed significant involvement of differentially expressed proteins (THP-DEPs) in pathways related to mineral absorption, spliceosome function, cardiac muscle contraction, and other associated biological processes (Fig. 3D). PPI network analysis identified 50 highly interactive THP-DEPs, with Rpl4 and Hnrnpc demonstrating the highest interaction strengths (Fig. 3E).
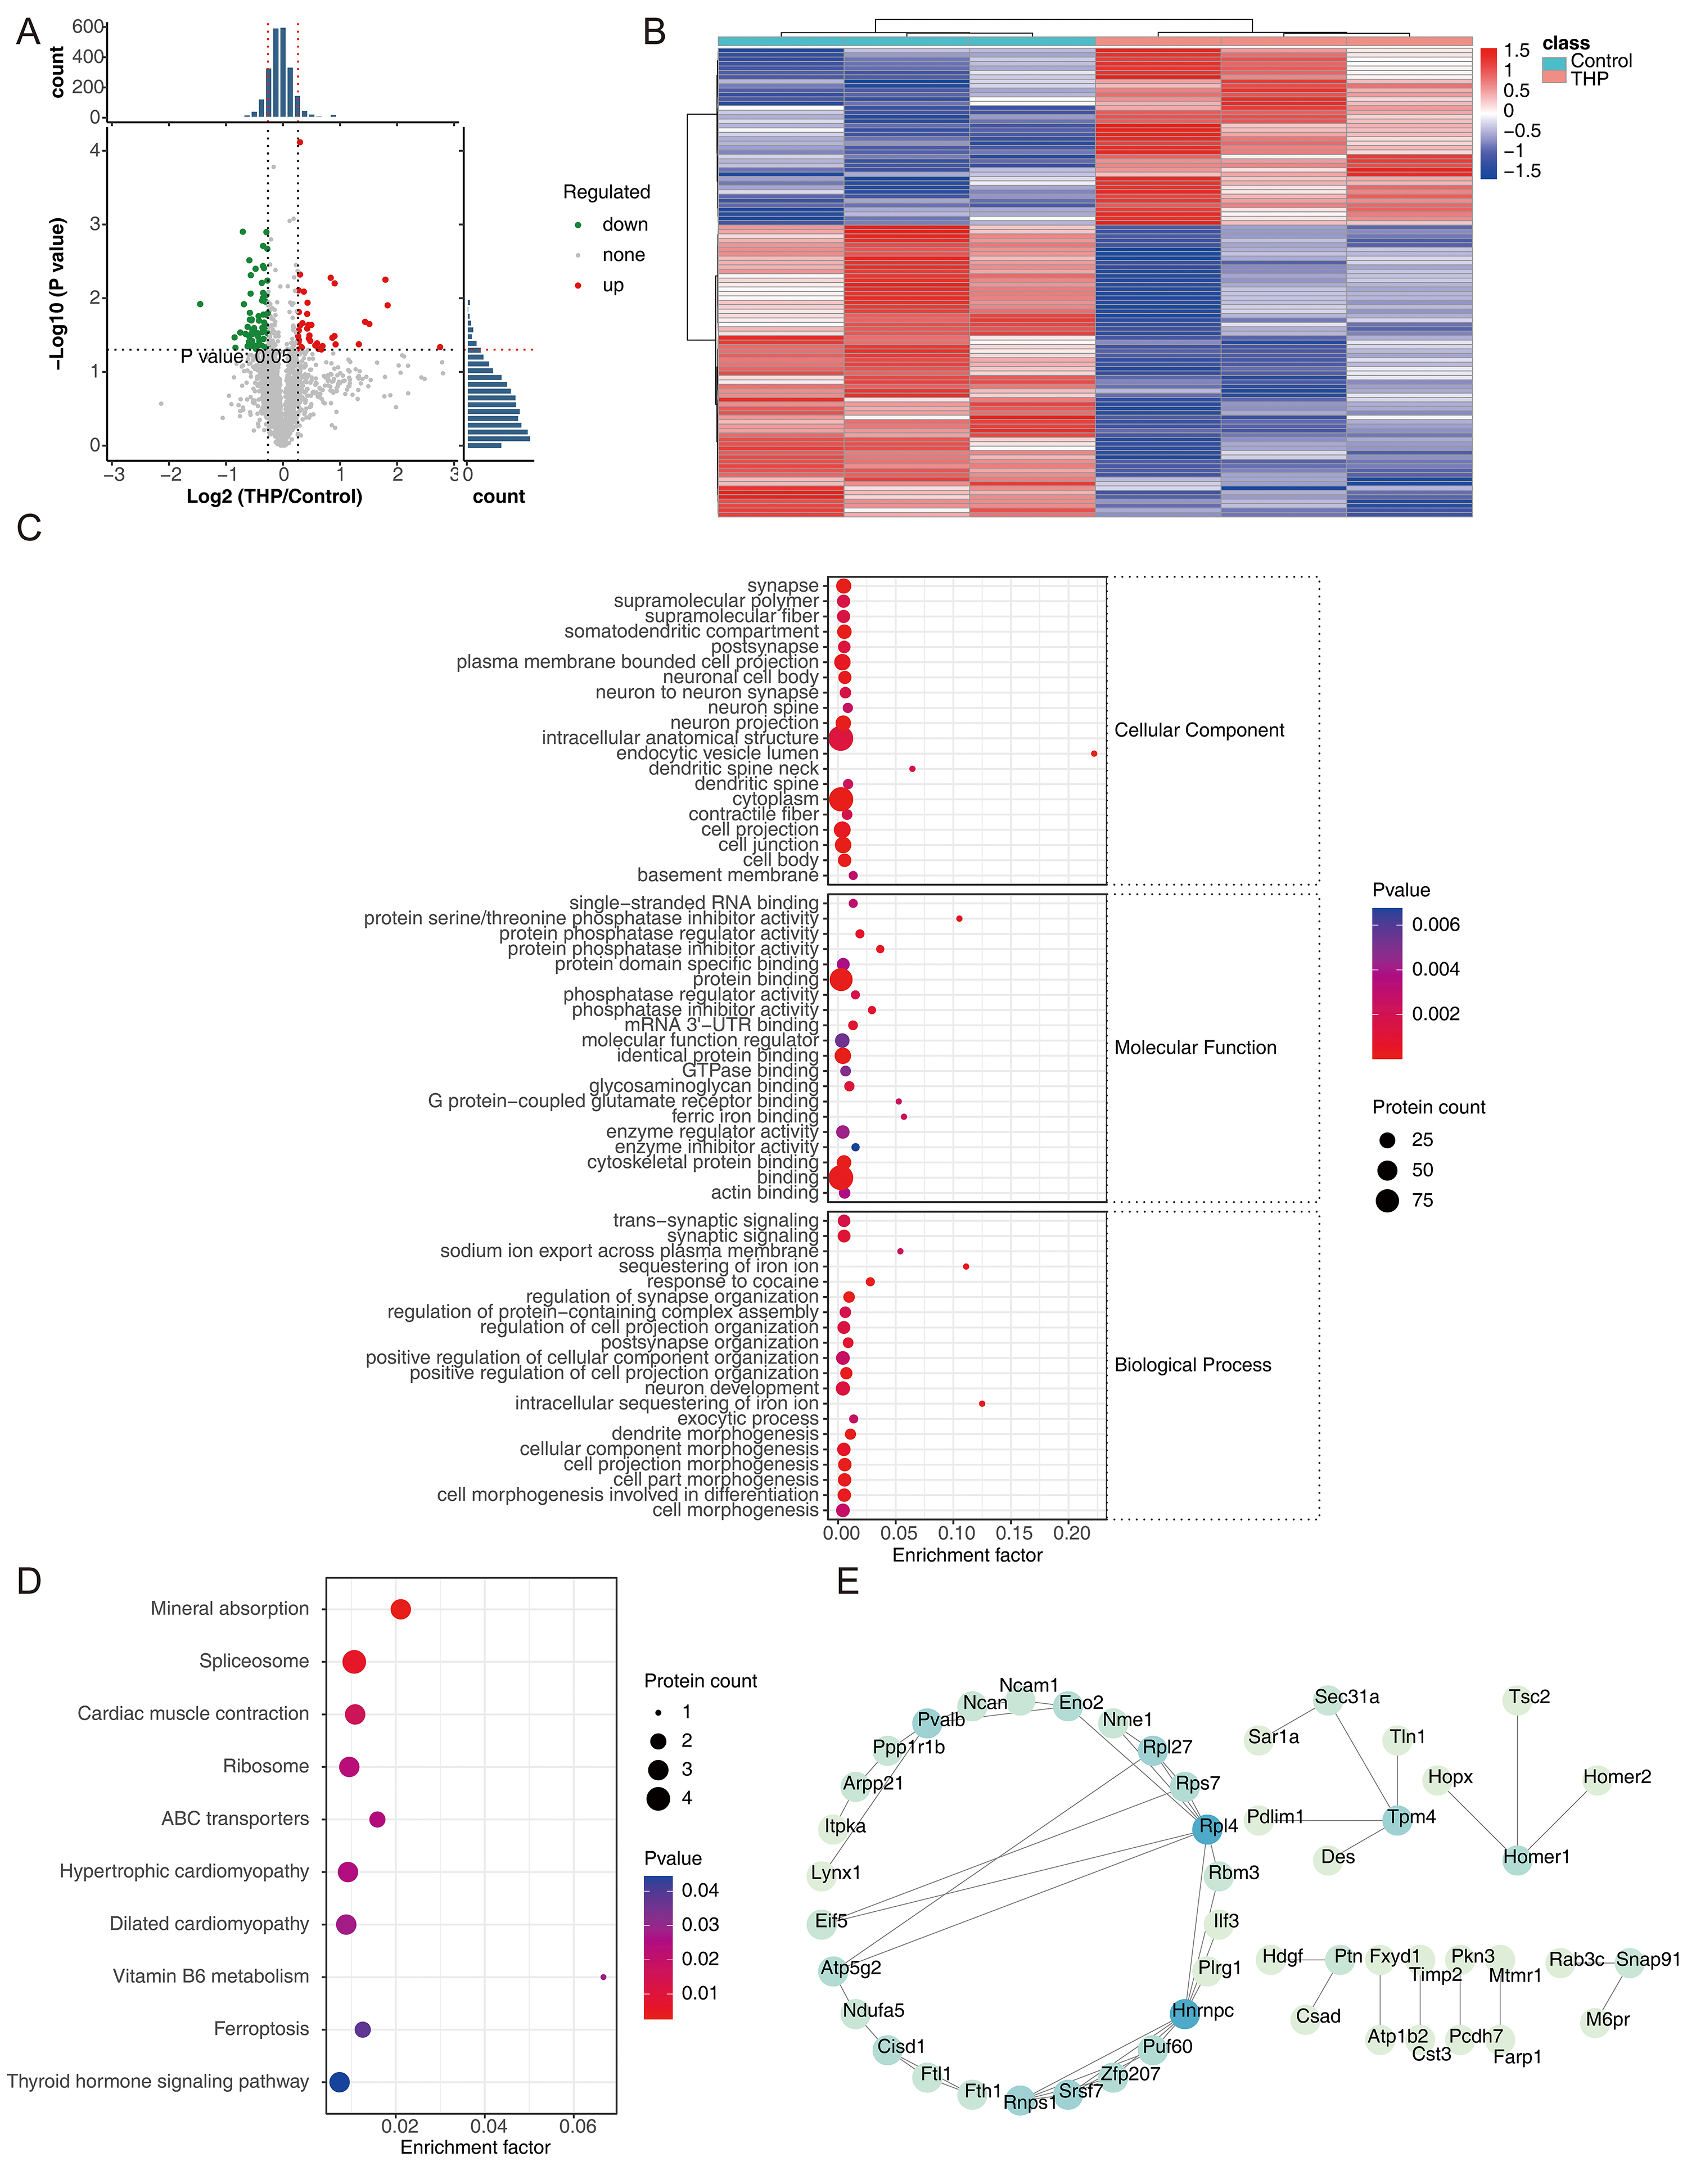 Fig. 3.
Overview of THP-DEPs identified via proteomic analysis. (A,B) Volcano plot and heatmap depicting THP-DEPs through proteomic analysis. (C) GO analysis of signaling pathways associated with differentially expressed proteins. (D) KEGG analysis of signaling pathways associated with differentially expressed proteins. (E) Interacting proteins identified through the PPI network analysis. DEPs, differentially expressed proteins; ABC, ATP-binding cassette transporter.
Prior to metabonomic profiling, PCA, PLS-DA, and RPT validation confirmed the robustness and reliability of the dataset (Supplementary Fig. 5). A total of 2387 THP-DEMs were identified, including 1022 upregulated metabolites (e.g., 6-formylumbelliferone, DL-indole-3-lactic acid, benzyl chloride) and 1365 downregulated metabolites (e.g., isopentenyladenosine, uracil, cystine) (Fig. 4A,B). Notably, 7 KEGG pathways were enriched, encompassing eicosanoids (drug development), arachidonic acid metabolism, linoleic acid metabolism (metabolism), intestinal immune network for IgA production, serotonergic synapse, and ovarian steroidogenesis (organismal systems) (Fig. 4C). These data indicate that differentially expressed metabolites are primarily associated with signaling cascades related to organismal systems.
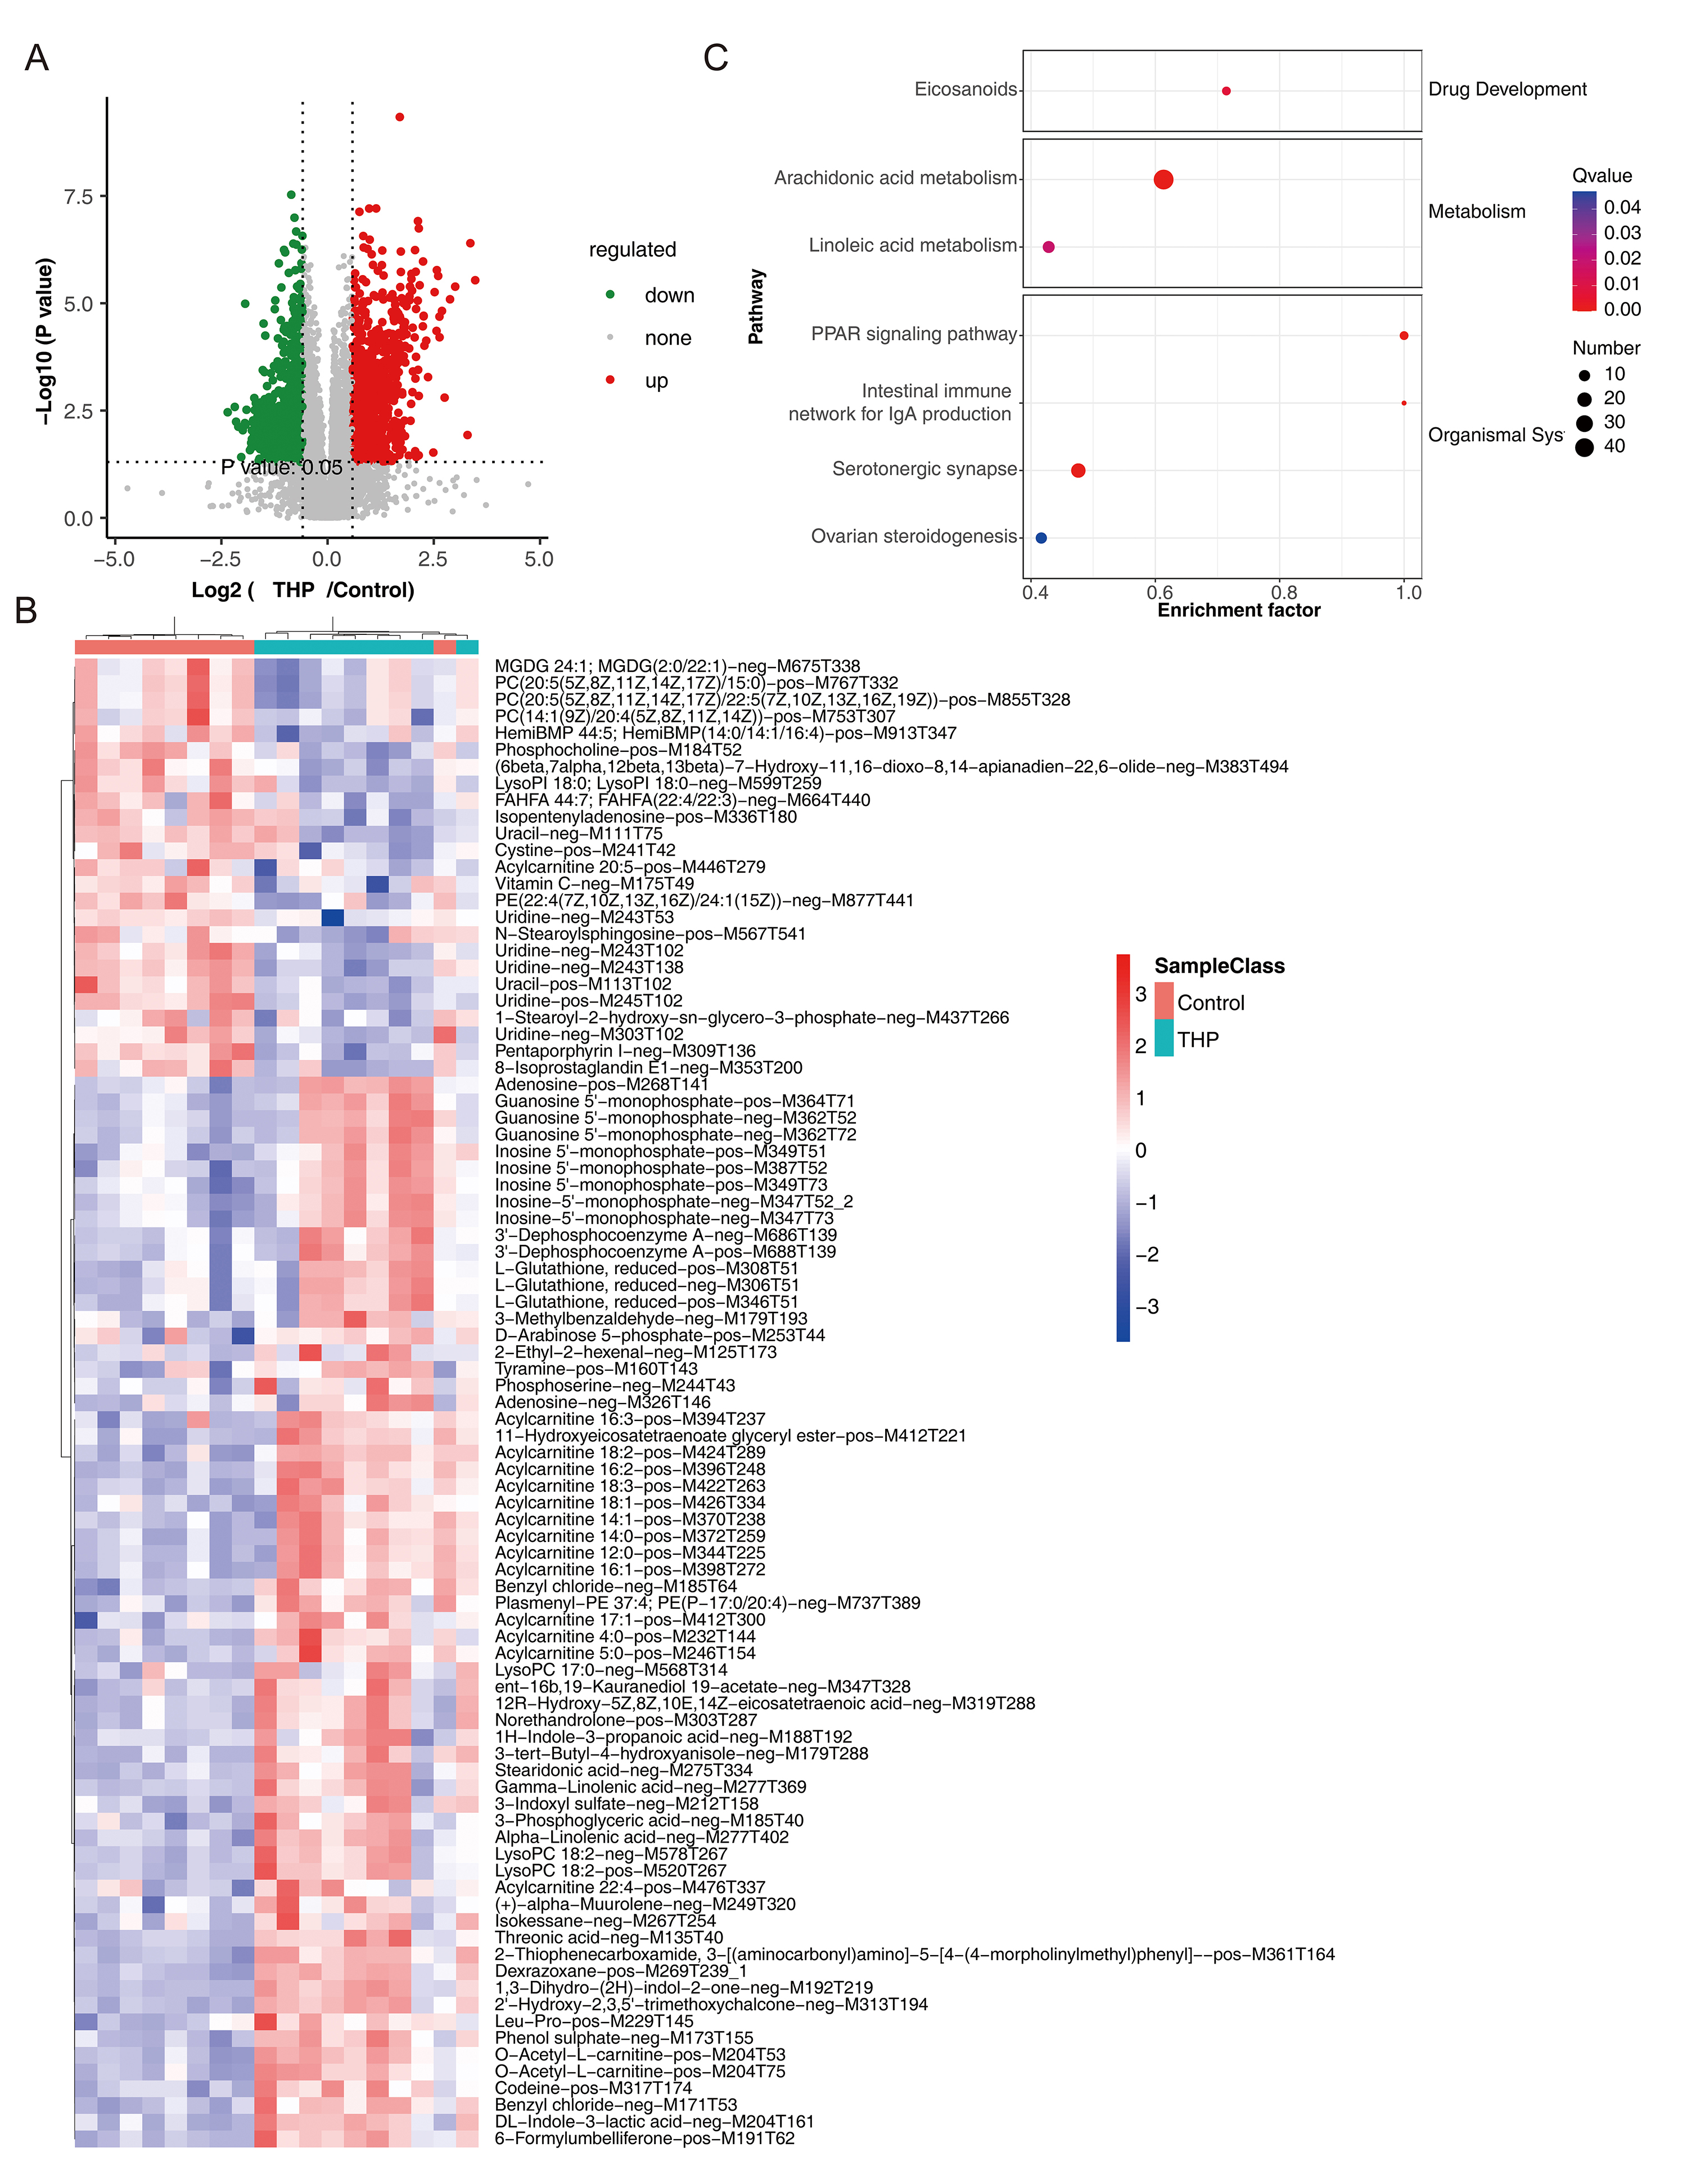 Fig. 4.
Metabolomic landscape of THP-DEMs. (A,B) Volcano plot and heatmap illustrating the distribution and expression patterns of THP-DEMs identified through metabolomic analysis. (C) KEGG pathway enrichment analysis of signaling pathways associated with differentially expressed metabolites. DEMs, differentially expressed metabolites.
Following filtration and normalization of the Ribo-seq dataset, high-quality ribosome profiling results were obtained, as presented in Supplementary Fig. 6. This process yielded 436 RF-DEGs, comprising 355 upregulated and 81 downregulated genes (Fig. 5A,B). GO enrichment analysis revealed 2163 terms (Supplementary Table 3), with RF-DEGs predominantly associated with leukocyte migration and positive regulation of response to external stimuli (BP), collagen-containing extracellular matrix and membrane microdomains (CC), and cell adhesion molecule binding and glycosaminoglycan binding (MF) (Fig. 5C). Notably, the GO terms “positive regulation of response to external stimulus” and “membrane microdomain” were commonly enriched between RF-DEGs and THP-DEGs (Figs. 2C,5C), suggesting a potential convergence of regulatory mechanisms. KEGG pathway enrichment analysis identified 66 enriched pathways, implicating RF-DEGs in lipid metabolism, atherosclerosis, cytokine–cytokine receptor interactions, and human papillomavirus infection (Fig. 5D). Integration of genes from the “ribosome_hub” and “protein_hub” categories with cell-type-specific DEGs led to the identification of 8 key genes: Ftl1, Tpm4, Ccl3, Ccl4, Ccr2, Il33, Cxcl2, and Ly6c2 (Fig. 5E).
 Fig. 5.
Overview of RF-DEGs identified through Ribo-seq analysis. (A,B) Volcano plot and heatmap illustrating the distribution and expression patterns of RF-DEGs detected using Ribo-seq analysis. (C) GO enrichment analysis of signaling pathways associated with differentially expressed ribosome footprints. (D) KEGG pathway analysis of signaling pathways related to differentially expressed ribosome footprints. (E) Identification of 8 key genes by overlapping “ribosome_hub” and “protein_hub” genes with cell-DEG. RF-DEGs, ribosome footprint-associated DEGs; Ribo-seq, ribosome profiling.
GSEA based on the 8 key genes revealed distinct functional associations. Ccl3, Ccl4, and Cxcl2 were enriched in pathways related to ribosome function, Parkinson’s disease, oxidative phosphorylation, and Huntington’s disease. Ccr2, Il33, Ly6c2, and Tpm4 were linked to cytokine–cytokine receptor interactions, oxidative phosphorylation, steroid biosynthesis, and CAMs (Fig. 6A). The related signaling pathways of key genes are illustrated in Supplementary Fig. 7. Ftl1 exhibited significant enrichment in long-term potentiation, leukocyte transendothelial migration, and complement and coagulation cascades. The recurrent enrichment of oxidative phosphorylation and ribosome-related pathways across multiple genes underscores their roles in translational control and cellular energy homeostasis. The GGI network identified 20 genes exhibiting strong connectivity with the 8 key genes, including Tpm3, Cd1, and Cxcl5 (Fig. 6B). Functional similarity analysis revealed that Ccl4 had the highest similarity score, indicating substantial overlap between its GO annotation terms and those of other genes. This finding suggests that Ccl4 has the highest similarity with other key genes and may play a central regulatory role in THP development (Fig. 6C). Chromosomal mapping localized Cxcl2 to chromosome 5; Ftl1, Tpm4, and Ccr2 to chromosomes 7, 8, and 9, respectively; Ccl3 and Ccl4 to chromosome 11; and Ly6c2 and Il33 to chromosomes 15 and 19, respectively (Fig. 6D).
 Fig. 6.
Functional enrichment, interaction networks, and chromosomal localization of key genes. (A) GSEA showing pathways significantly associated with the 8 key genes. (B) GGI network identifying genes that interact with the 8 key candidates. (C) Functional similarity analysis among the 8 key genes. (D) Chromosomal localization of the 8 key genes. GSEA, gene set enrichment analysis; GGI, gene-gene interaction.
The key gene–disease network delineated complex relationships between the eight key genes and various pathological conditions, notably chemical- and drug-induced liver injury, necrosis, and inflammation, underscoring their potential role in THP pathophysiology (Fig. 7A). Drug prediction analysis revealed no pharmacological agents targeting Ftl1 and Ly6c2. However, four compounds (alprostadil, anisomycin, 8-azaguanine, and trichostatin) were predicted to concurrently target four of the remaining key genes, indicating potential synergistic therapeutic value for THP intervention (Fig. 7B).
 Fig. 7.
Key gene–disease and drug–target networks. (A) Gene–disease associations for the eight key genes. (B) Drug prediction network for the eight key genes.
Single-cell sequencing data encompassing 10 immune-related cell types were
further analyzed to identify cell populations associated with THP. Differential
expression profiling between THP and control groups identified six key cell types
with significant alterations (p
ECs followed a five-stage differentiation path, originating at stage 1 and terminating at stage 4 (Fig. 10A). Ftl1, Il33, and Tpm4 exhibited gradual upregulation, while the other five key genes remained minimally expressed.
 Fig. 8.
Expression levels of eight key genes in immune-related cell types. Expression levels of the eight identified genes across ten immune-related cell types were compared between the THP and control groups.
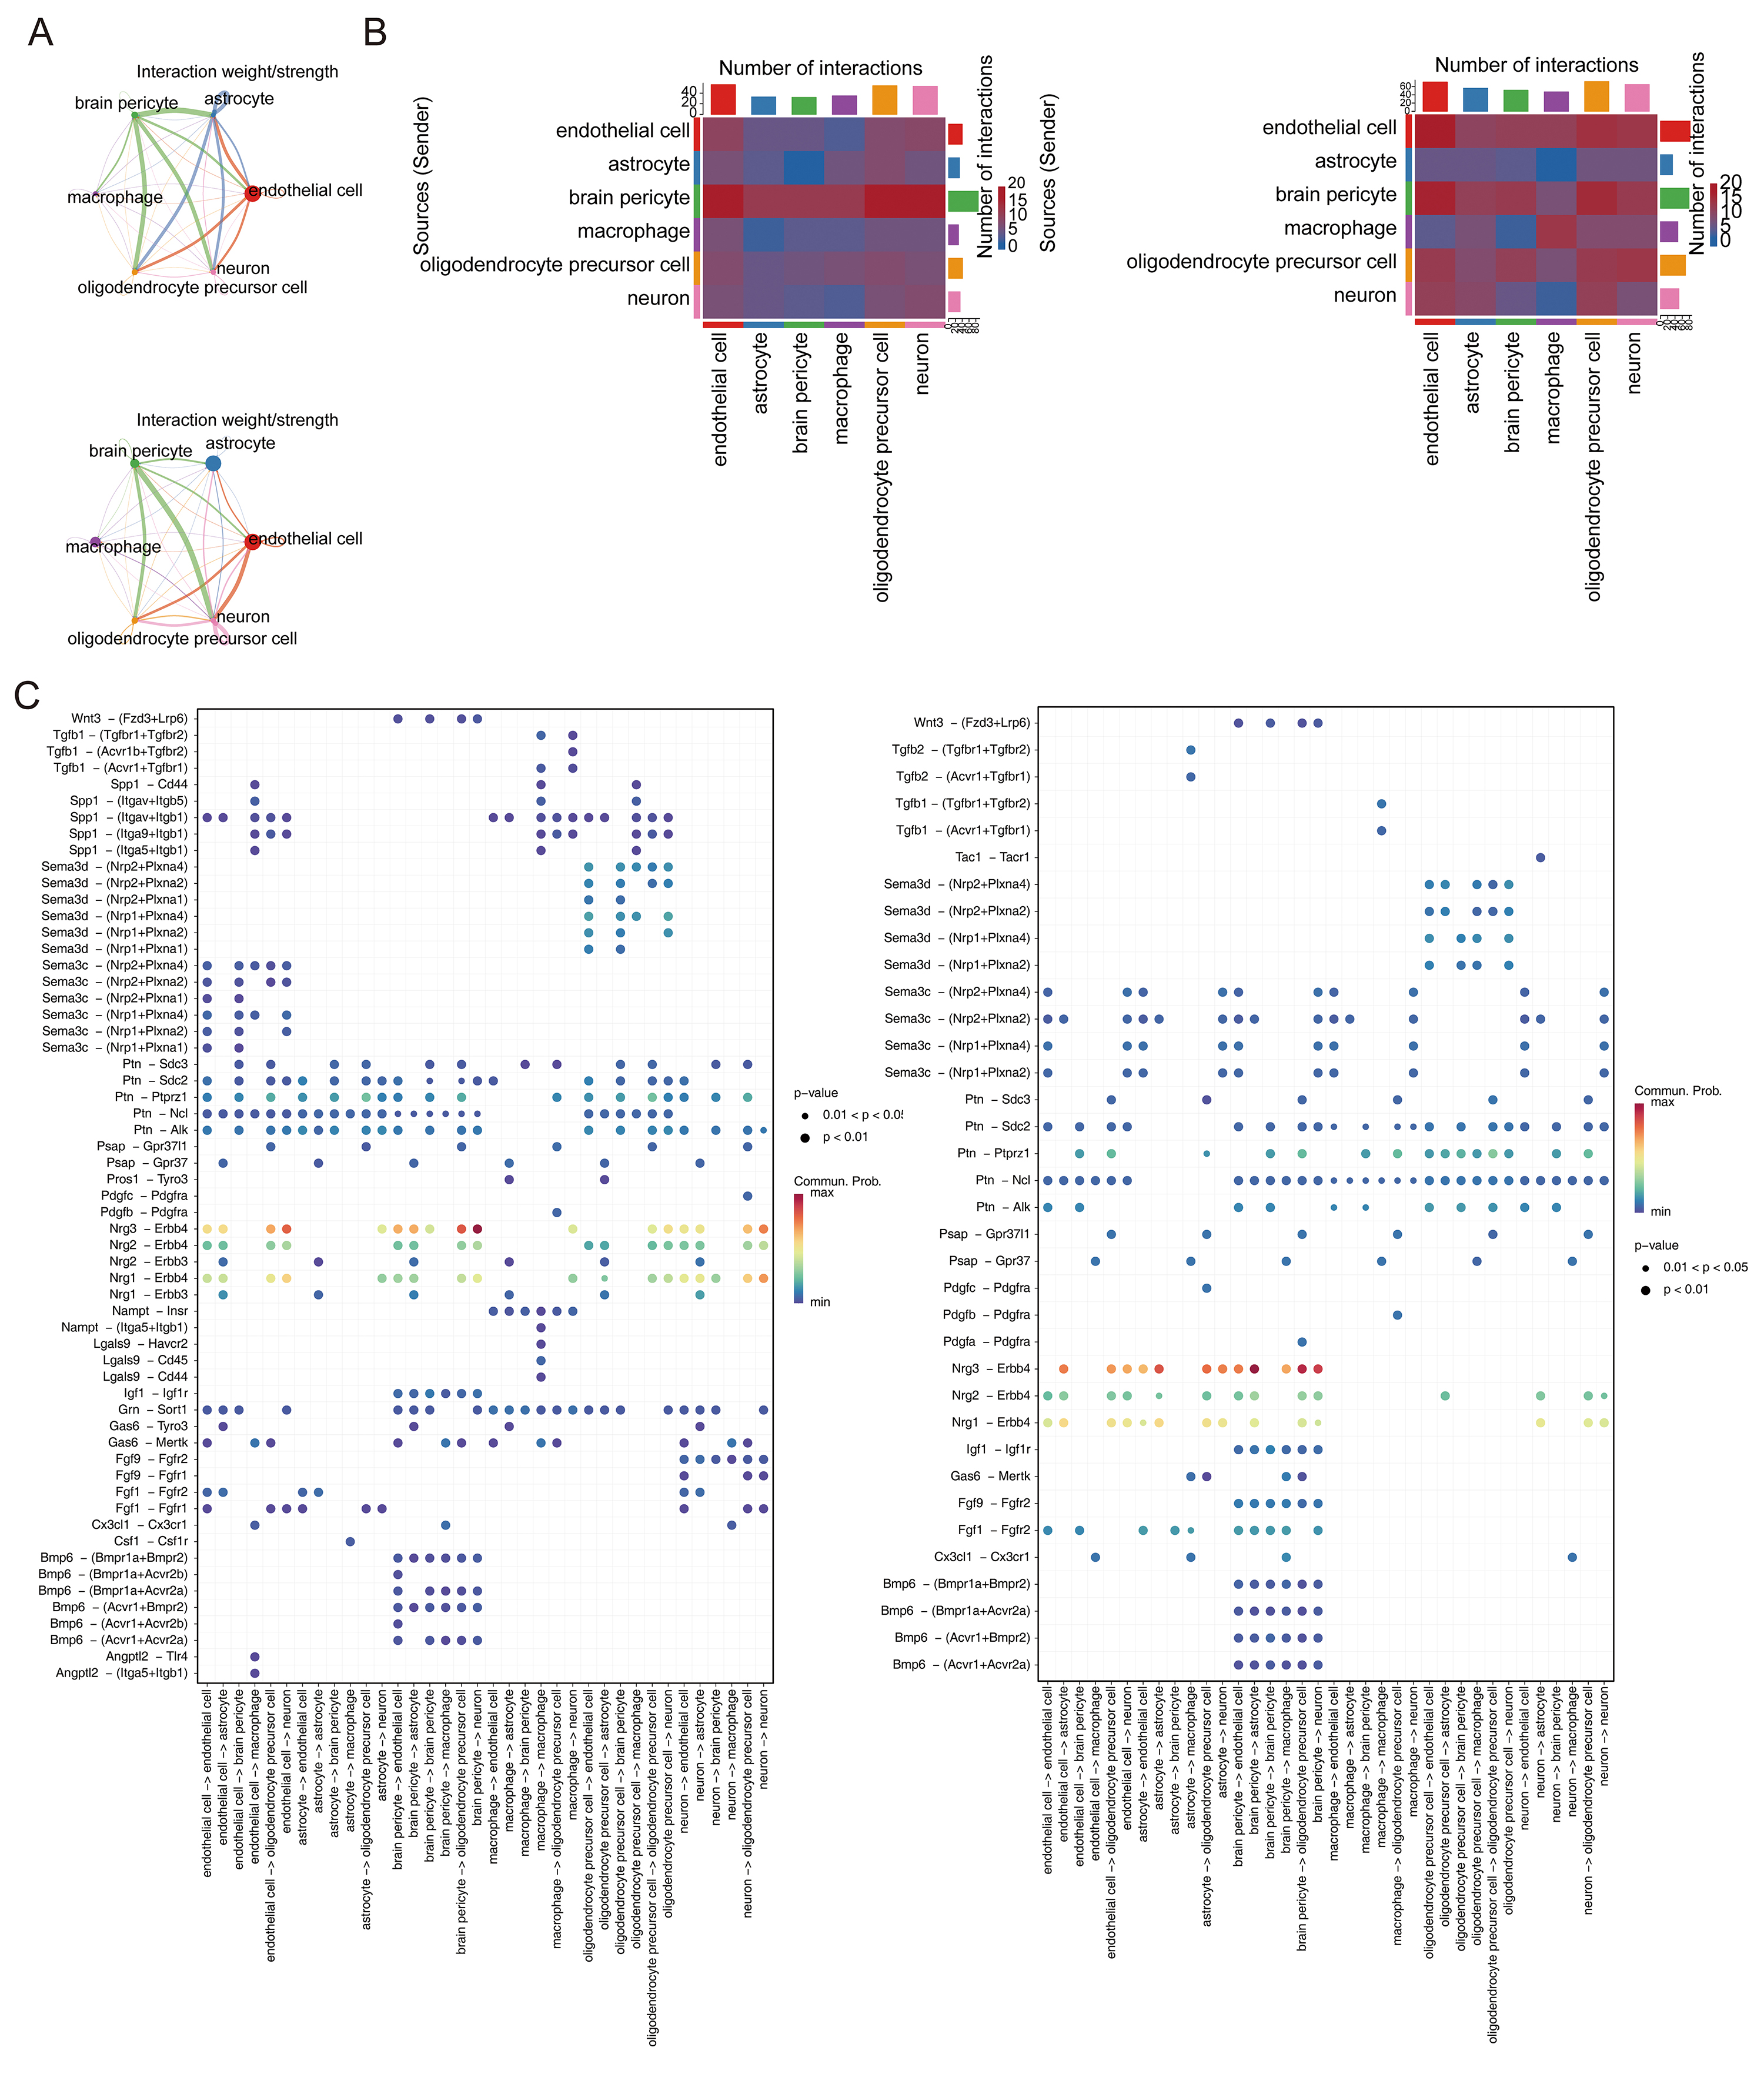 Fig. 9.
Intercellular communication among key cell populations. (A) Intercellular communication network between endothelial cells and other pivotal cell types in the THP and control groups. (B) The changes in ligands and receptors between THP and control groups. (C) Ligand–receptor interaction patterns among key cell types between THP and control groups.
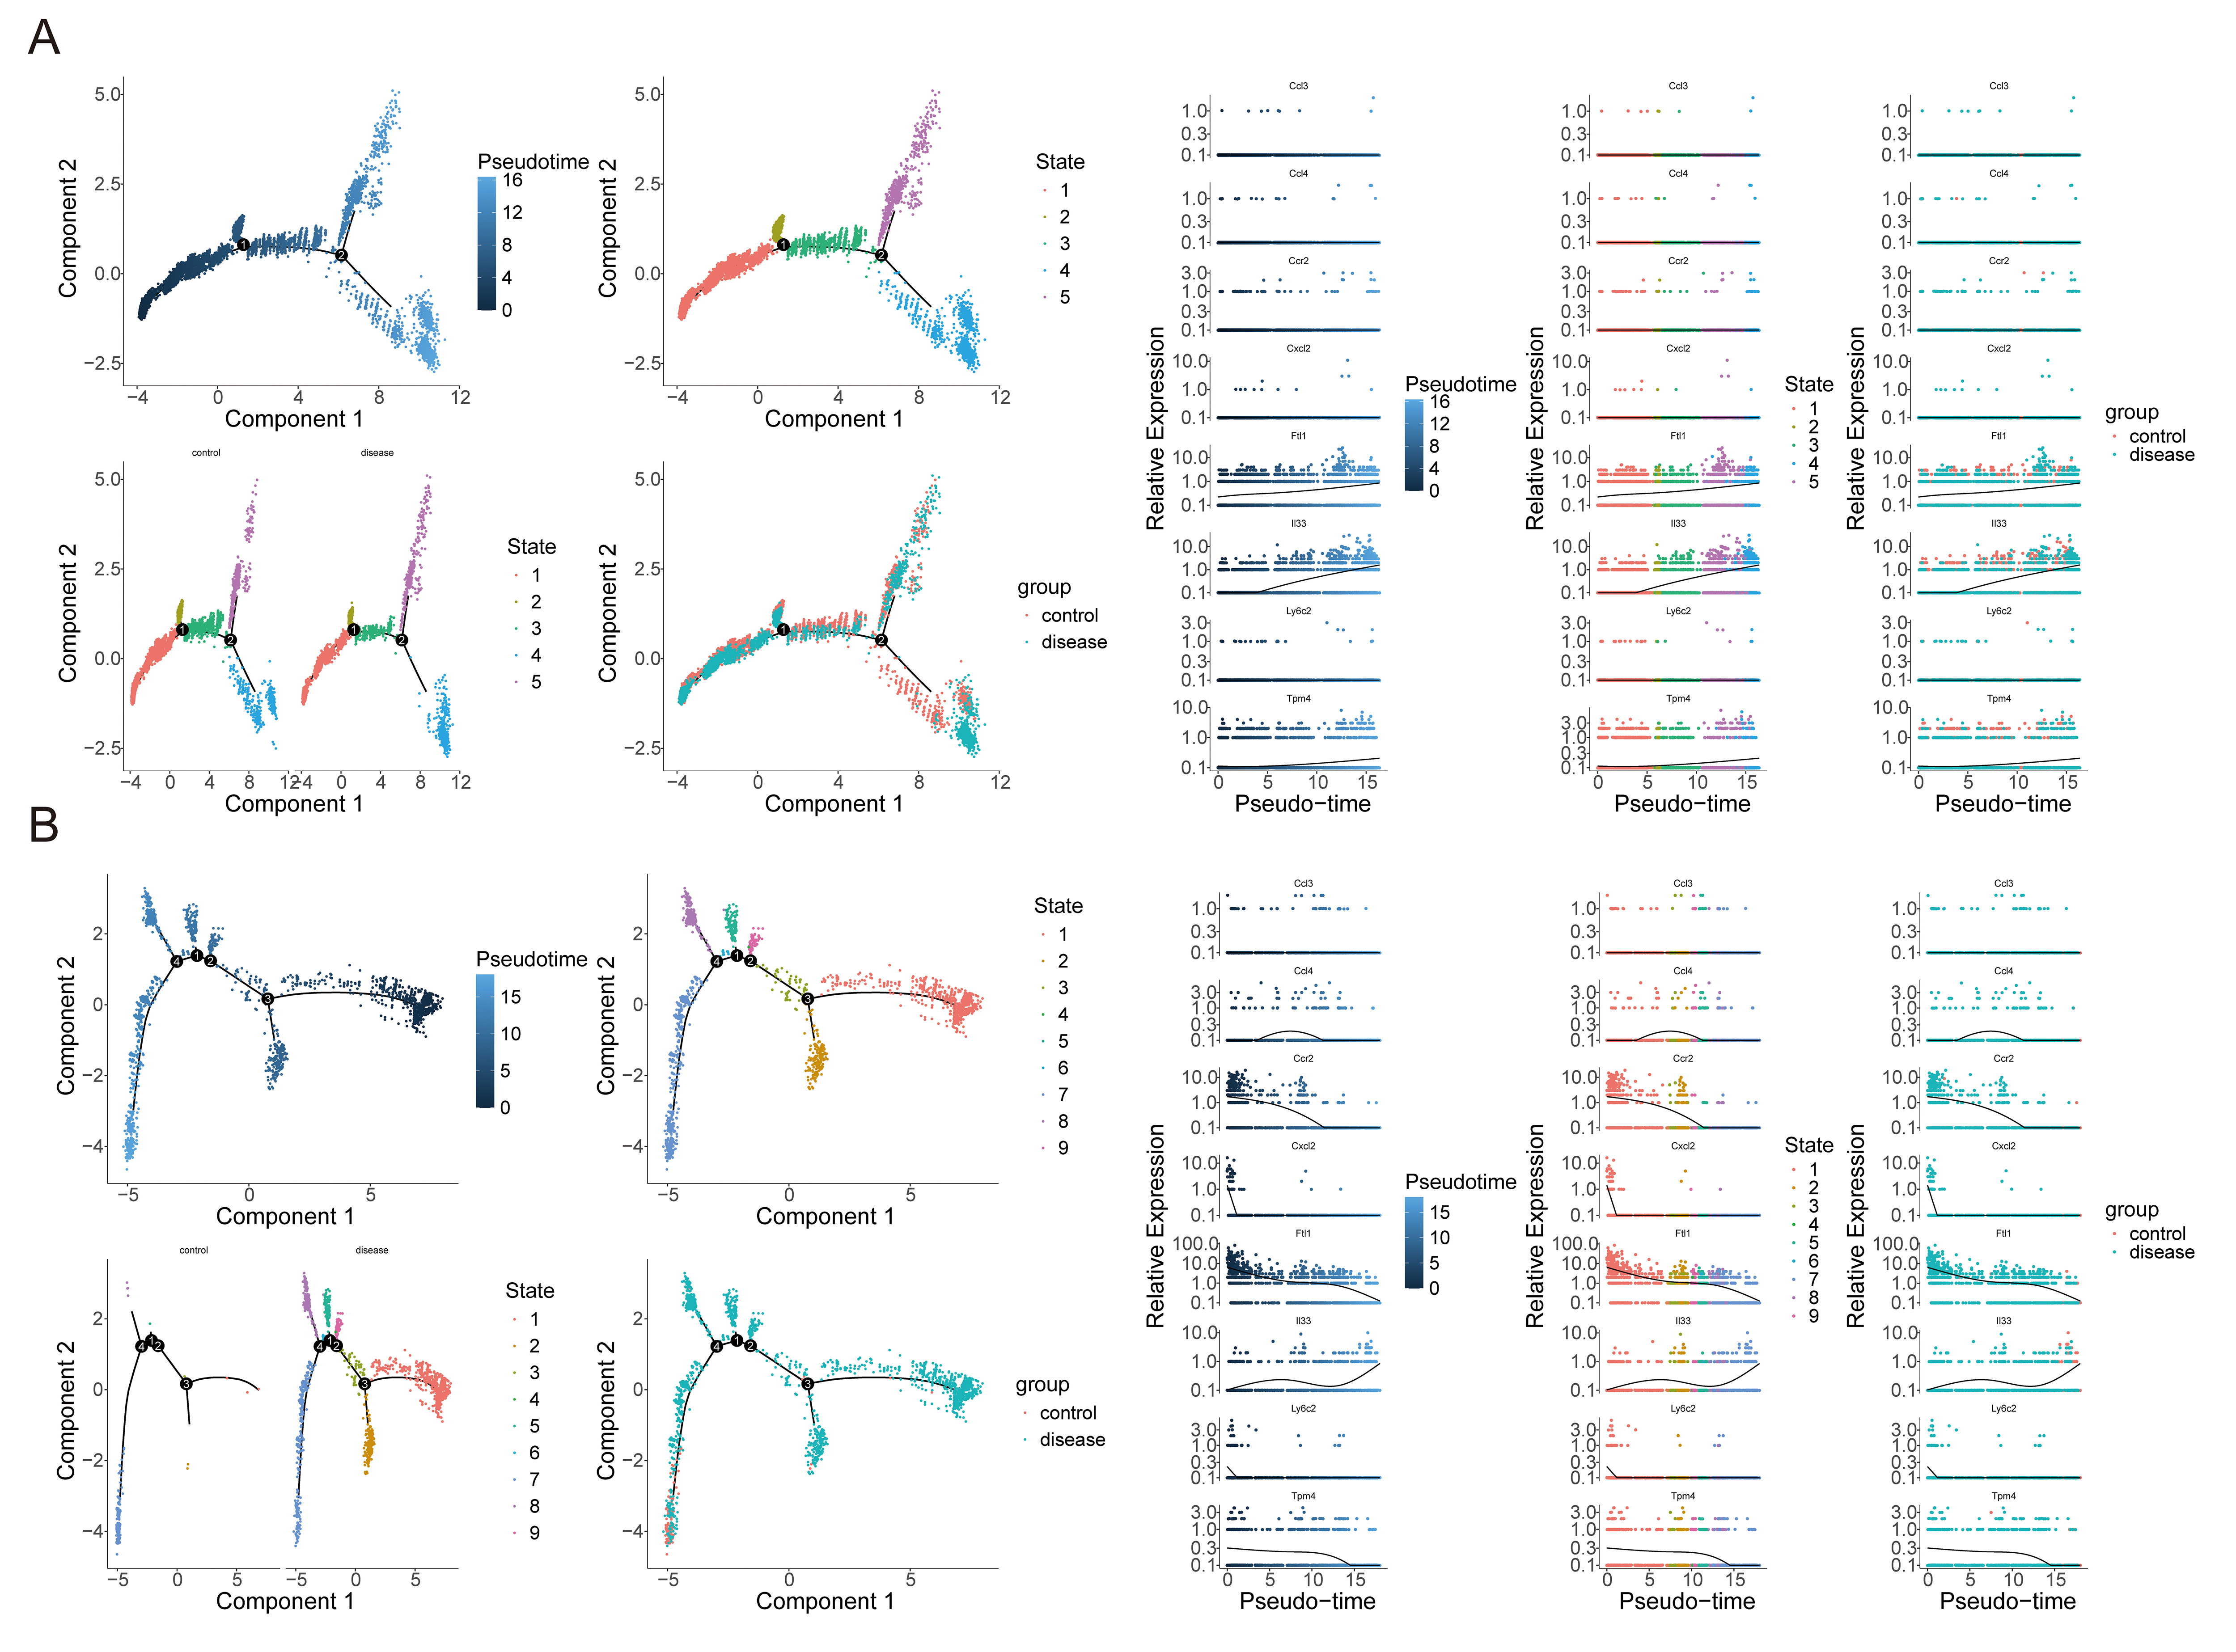 Fig. 10.
Pseudotime trajectory analysis of key cell populations. (A) Temporal dynamics of cell differentiation and expression levels of key genes in endothelial cells. (B) Pseudotime progression and expression levels of key genes in macrophages.
Macrophages exhibited a nine-stage trajectory with cells predominantly derived from the THP group. Stage 1 represented early differentiation, while stage 7 marked terminal maturation (Fig. 10B). Ccr2, Cxcl2, Ftl1, Ly6c2, and Tpm4 peaked at early stages; Ccl4 peaked at intermediate stages; and Il33 exhibited progressive upregulation toward maturation.
Pseudotime analysis of the remaining four key cell types (astrocytes, brain pericytes, OPCs, and neurons) revealed comparably complex differentiation dynamics. Notably, Ftl1 and Il33 maintained relatively high expression levels, whereas the remaining six key genes exhibited persistently low transcriptional activity (Supplementary Fig. 9). These findings highlight the context-dependent, cell-specific regulatory roles of key genes in modulating differentiation and intercellular signaling during THP progression.
To investigate the involvement of candidate genes in CPSP, RT-qPCR was performed to validate the expression levels of eight key genes identified through multi-omics integration. Among them, four genes exhibited statistically significant differential expression between the sham and CPSP groups. Specifically, Ftl1 and Ly6c2 were significantly downregulated, while Ccl4 and Ccr2 were significantly upregulated in the thalamic tissue of CPSP mice (Fig. 11A–H). In the transcriptome sequencing data, Ccl3, Ccl4, Ccr2, Cxcl2, Il33, and Ly6c2 were significantly upregulated in the THP group (Fig. 12). The expression trends of Ccl4 and Ccr2 were consistent with the RT-qPCR results.
 Fig. 11.
RT-qPCR validation of mRNA expression levels of key genes. (A)
Ftl1. (B) Tpm4. (C) Ccl3. (D) Ccl4. (E)
Ccr2. (F) Il33. (G) Cxcl2. (H) Ly6c2. Data
are presented as mean
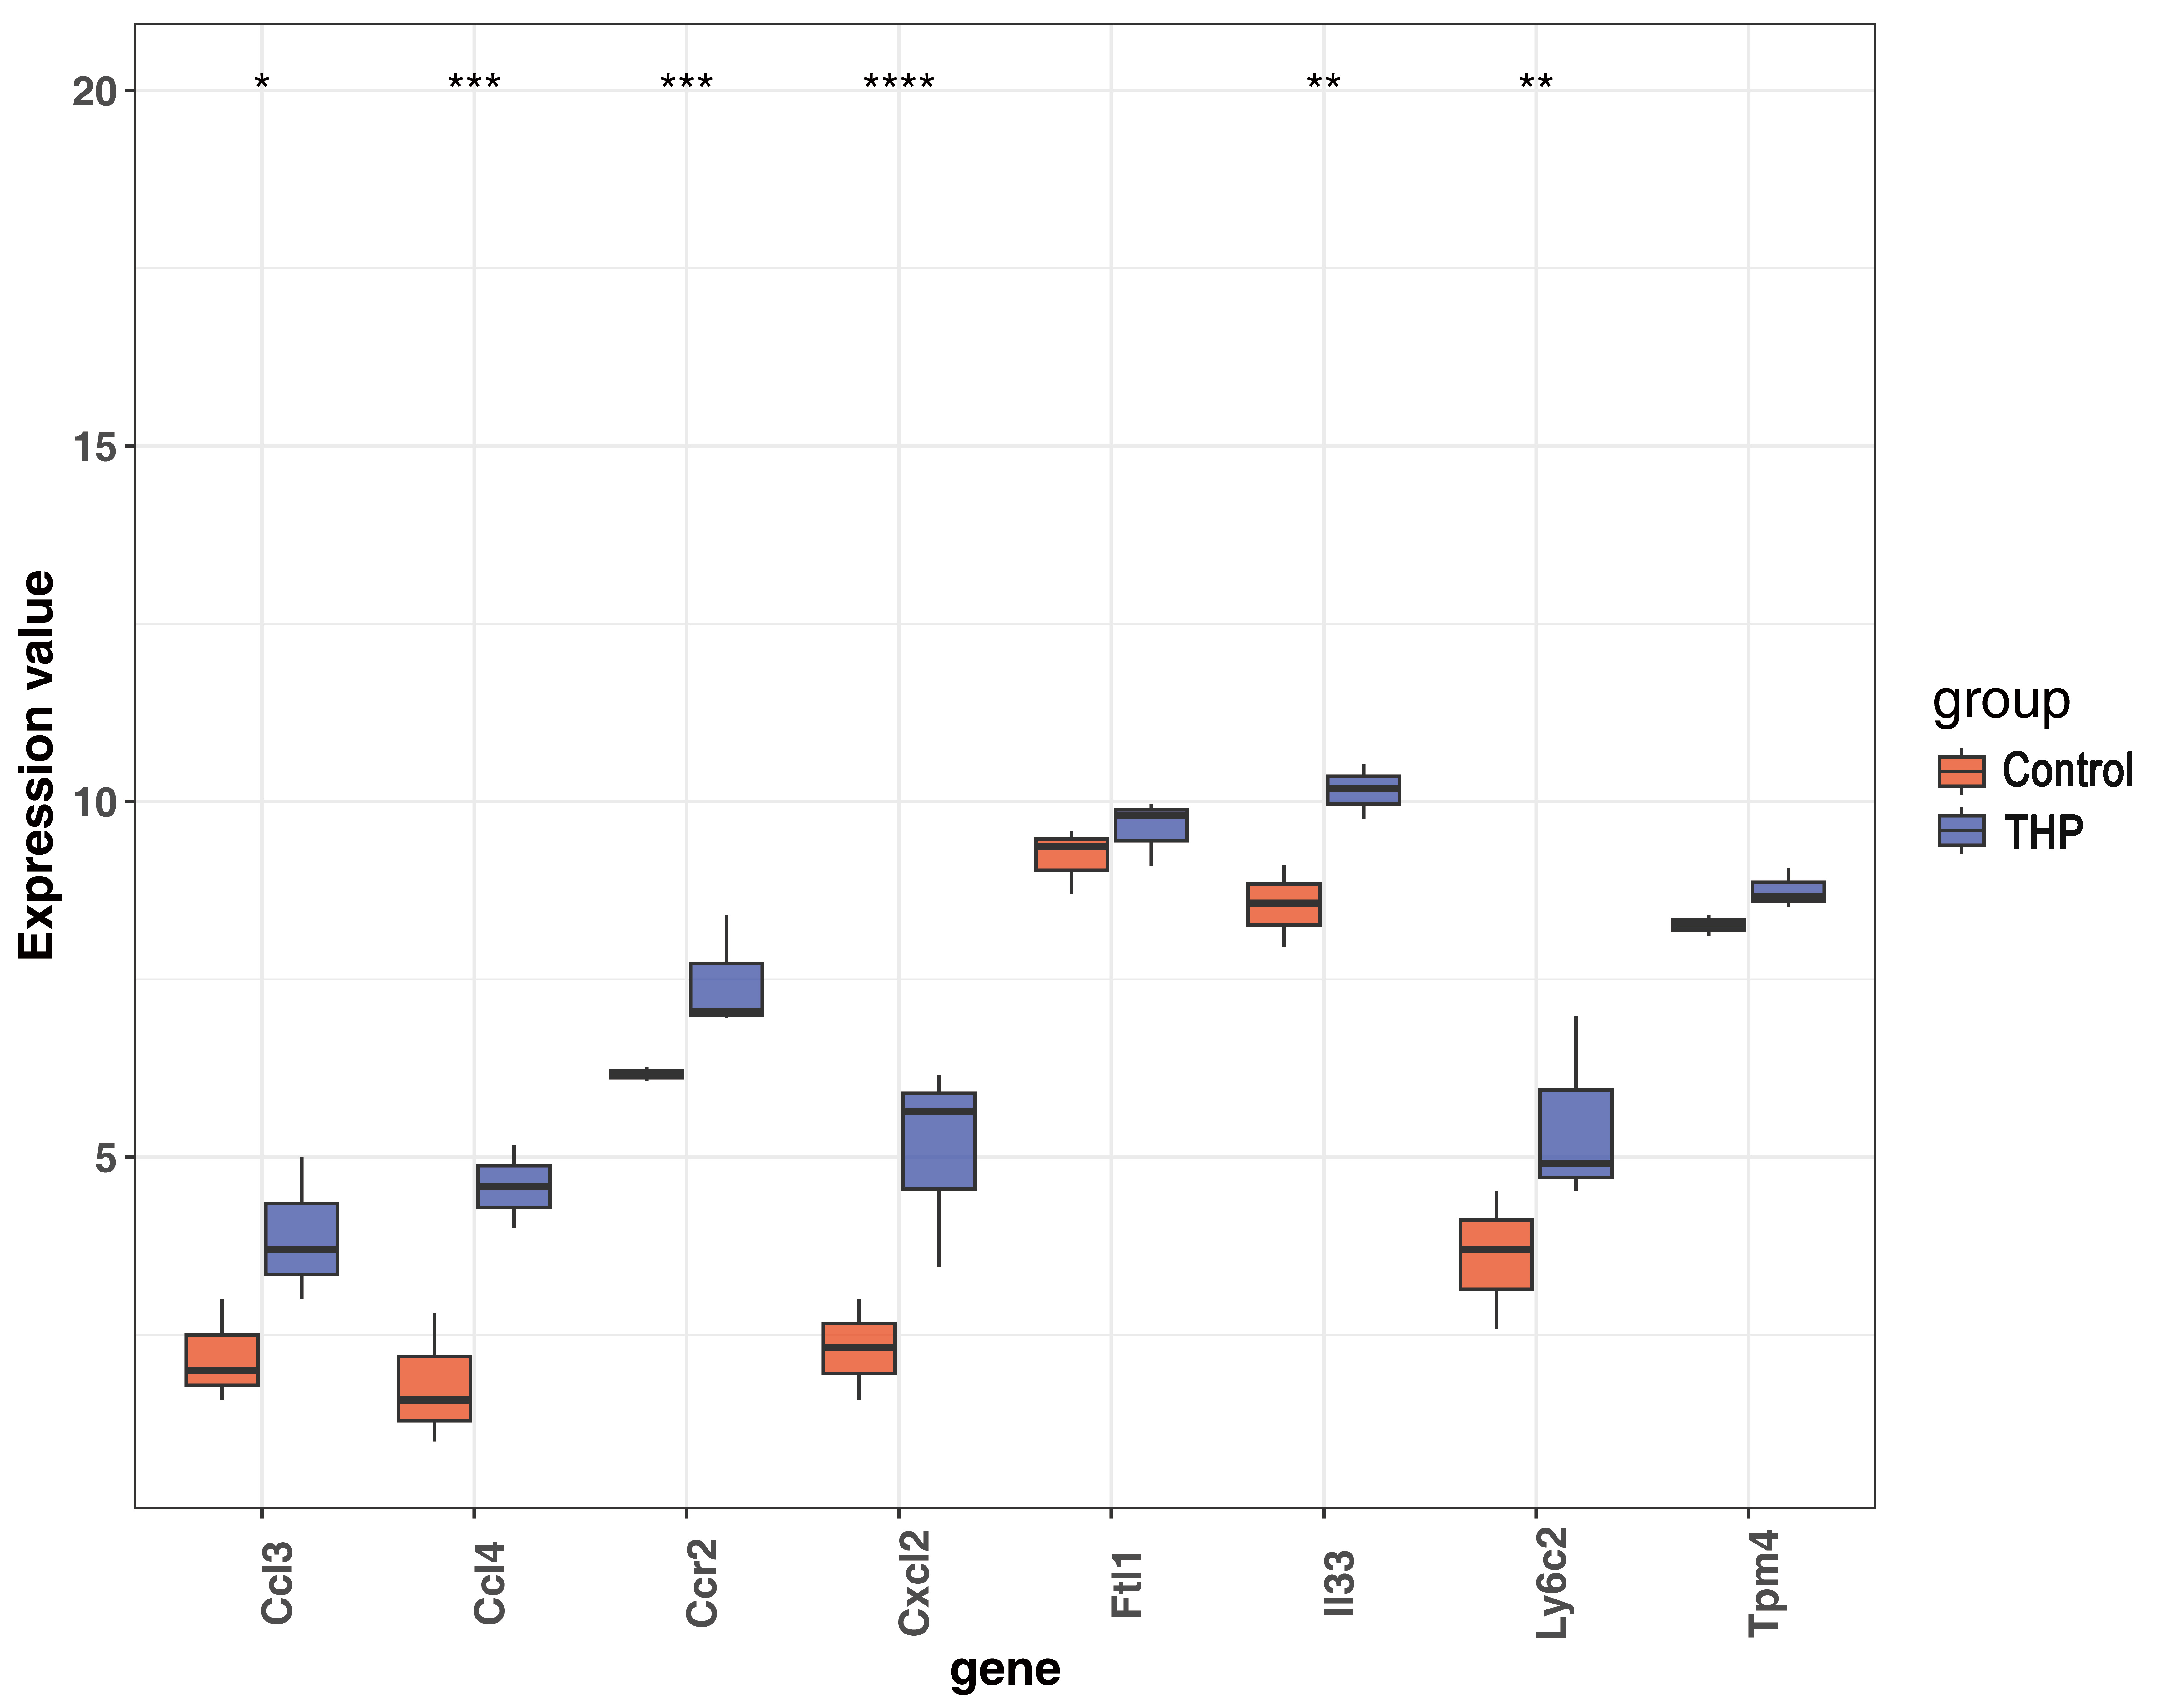 Fig. 12.
Expression levels of key genes in the transcriptome sequencing
data. *, p
In this study, a THP mouse model was established, and thalamic tissue was analyzed using an integrative multi-omics strategy, involving bulk RNA sequencing, single-cell transcriptomics, proteomics, metabolomics, and ribosome profiling. Transcriptomic analysis identified 376 DEGs, which promoted the construction of a PPI network and the selection of 12 hub genes. Parallel omics analyses revealed DEPs, metabolites, and ribosome-associated genes (RF-DEGs), with subsequent enrichment analyses (GO, KEGG) revealing their involvement in immune regulation, oxidative phosphorylation, and ferroptosis. Through integrative analysis, eight key genes were prioritized: Ftl1, Tpm4, Ccl3, Ccl4, Ccr2, Il33, Cxcl2, and Ly6c2. Expression patterns across single-cell datasets highlighted six critical cell populations contributing to THP pathophysiology: ECs, astrocytes, brain pericytes, macrophages, OPCs, and neurons. Intercellular communication networks among these cell types exhibited THP-specific alterations. Pseudotime analysis further revealed distinct differentiation trajectories and dynamic expression patterns of the key genes.
Ftl1, encoding the ferritin light chain, is a central regulator of ferroptosis. Previous study has shown that Ftl1 modulates microglial homeostasis and activation-related genes in ischemic stroke [36]. Mutations in Ftl1 are causally linked to neurodegeneration with brain iron accumulation (NBIA), and its upregulation has been associated with enhanced ferroptotic activity [37]. Notably, DEPs in the THP model were significantly enriched in the ferroptosis pathway (Fig. 3D), suggesting that Ftl1 may serve as a therapeutic target for modulating ferroptosis in THP. To date, no prior studies have reported a direct association between Ftl1 and THP.
Tropomyosin alpha-4 chain (TPM4) is expressed in human aortic endothelial cells and cultured human brain microvascular ECs [38, 39]. It has been identified as a prognostic biomarker in several malignancies. Furthermore, missense mutations in TPM4 disrupt platelet function, impair promyosin cytoskeletal architecture, and are associated with hemorrhagic and thrombotic disorders [38]. These findings suggest a mechanistic link between TPM4 dysfunction and THP, potentially through compromised platelet function and dysregulated immune–endothelial interactions. By influencing inflammatory responses and cellular integrity, TPM4 may contribute to pain pathogenesis. Therefore, therapeutic modulation of TPM4 could enhance platelet stability, attenuate immune-mediated inflammation, and ameliorate symptoms associated with thalamic hemorrhagic pain.
Interleukin-33 (IL-33), a member of the IL-1 cytokine family, is implicated in the regulation of inflammation, host defense, and autoimmunity [40]. It is abundantly expressed in secondary lymphoid organs, such as lymph nodes and appendix, and is distributed throughout the vascular system [41]. IL-33 exerts its immunomodulatory effects through the ST2 receptor (IL-33R), and accumulating evidence supports its neuroprotective role in ischemic stroke models [42, 43]. Notably, IL-33 upregulation has shown to enhance blood–brain barrier integrity and promote functional recovery following stroke [43]. These findings suggest IL-33 as a promising neuroprotective factor and potential therapeutic candidate in THP.
Ccl3, Ccl4, Ccr2, and Cxcl2 are chemokine-related genes with distinct immunological and inflammatory functions. CCL3 plays a pivotal role in the recruitment of diverse immune cell subsets to intra-tumoral microenvironments [44]. In contrast, CCL4 is associated with chronic inflammation, particularly during cellular senescence and vascular dysfunction, and is notably upregulated in endothelial cells. It contributes to senescence and functional decline by promoting reactive oxygen species (ROS) production and inflammatory signaling, potentially exacerbating the pathology of non-healing wounds [45, 46]. Similarly, CCR2 and CXCL2 are implicated in senescence-related pathways and play remarkable roles in the development and progression of cardiovascular diseases. A significant upregulation of CCR2 following subarachnoid hemorrhage is closely associated with neuroinflammation and neuronal apoptosis, while inhibition of CCR2 can effectively alleviate brain edema, decrease blood-brain barrier permeability, and mitigate neuroinflammation, thus improving clinical outcomes [47]. In acute myocardial infarction, CCR2-expressing macrophages possess pro-inflammatory characteristics that promote inflammation and tissue damage. In contrast, M2-polarized macrophages, through the secretion of small extracellular vesicles, regulate CCR2-expressing macrophage function to suppress cardiac inflammation and promote repair, demonstrating the potential of extracellular vesicle-based therapies [48]. Additionally, CXCL2 plays a critical role in age-related liver injury by recruiting neutrophils via the CXCL2-CXCR2 axis, exacerbating liver inflammation. Targeting this pathway may represent a novel therapeutic approach for aging-associated liver injury [49]. These mechanisms highlight the involvement of CCR2 and its associated signaling pathways in both acute and chronic inflammation, suggesting that they may provide novel therapeutic directions for thalamic hemorrhagic pain. The upregulation of CCR2 expression in macrophages may be associated with pain onset, and inhibition of CCR2 may alleviate inflammation-induced pain perception. Therefore, therapeutic strategies targeting CCR2, such as CCR2 antagonists, may provide new treatment approaches for the clinical management of thalamic hemorrhagic pain.
Ly6c2 is a glycosylphosphatidylinositol-anchored cell surface glycoprotein that is widely expressed on immune cells, such as monocytes, macrophages, and dendritic cells [50]. Recent study has highlighted the crucial role of Ly6c2 in various immune-related diseases, particularly in liver diseases, liver fibrosis, and tumor immunity. During liver fibrosis repair, Ly6c2 contributes to fibrosis reversal by modulating the expression level of Tlr4 in CD11b cells and by maintaining a low expression level of Ly6c2 [51]. Additionally, Ly6c2-positive monocytes can differentiate into macrophages and dendritic cells, promoting the formation of memory CD8 T cells, thereby enhancing anti-tumor immune responses [52]. These findings provide novel therapeutic insights for immunotherapy in liver diseases and liver cancer treatment. In study of obesity-induced stroke, Ly6c2 has been significantly upregulated in brain tissues, suggesting its potential role in the immune response during stroke, particularly in regulating immune cells [53]. For the treatment of THP, Ly6c2 may alleviate pain by modulating the immune response in brain tissue. Given the close association between THP and immune inflammation, Ly6c2 may further regulate neuroinflammatory responses triggered by thalamic hemorrhage through influencing the function of immune cells, such as monocytes and macrophages. Therefore, modulating Ly6c2 expression level may provide novel therapeutic strategies for the treatment of THP. By regulating the expression or function of Ly6c2, it may be feasible to reduce immune responses in the brain following stroke, thereby mitigating neuroinflammation and improving pain management and recovery for patients.
Using GSEA, we identified eight key genes potentially involved in the cytokine-cytokine receptor interaction (i.e., a biological process that is closely associated with neuroinflammation and neuropathic pain). Following neural injuries, such as spinal cord injury, cytokine-cytokine receptor interactions activate downstream signaling pathways, promoting inflammatory responses and modulating pain perception. These interactions, particularly in microglia, have shown to play a critical role in neuroinflammation [54]. Given the central role of the thalamus in pain processing, immune dysregulation in this structure may be closely linked to these interactions, further exacerbating pain. The chemokine ligand 5/C-C chemokine receptor type 5 signaling pathway is implicated in neuropathic pain [55]. Although C-C chemokine receptor type 5 and CCR2 bind to different chemokines, they mainly exhibit synergistic effects during immune responses [56]. Therefore, CCR2 may contribute to inflammatory responses in the thalamus by participating in cytokine-cytokine receptor interactions. Additionally, other key genes identified in this study may similarly modulate thalamic immunoregulatory responses, influencing the development and treatment of THP. Further investigation into the precise mechanisms of these genes may provide novel insights into their roles in THP and lay a stronger theoretical basis for clinical interventions.
In this study, scRNA-seq was employed to characterize the thalamic cellular landscape in mice with THP compared to controls, revealing microenvironmental and developmental remodeling. Six principal cell types, including endothelial cells, astrocytes, brain pericytes, macrophages, OPCs, and neurons, were identified. A comprehensive cell–cell interaction network was constructed based on ligand–receptor pair analysis, illustrating the coordinated functional interaction of these cells in THP. Astrocytes, for instance, play multifaceted roles in post-stroke brain repair [57, 58]. Stroke-induced alterations in ECs can lead to the release of extracellular microvesicles that cross the blood–brain barrier and enter the brain parenchyma [59]. These microvesicles may deliver proneural transcription factors, such as Ascl1, reprogramming astrocytes into neural progenitor-like cells [60], thereby implicating a vascular-glial axis in modulating neuroregeneration. Macrophages, commonly classified into pro-inflammatory (M1) and anti-inflammatory (M2) subtypes, are essential in modulating both the initiation and resolution phases of inflammation. Following CPSP-induced brain injury, thalamic recruitment of macrophages has shown to alleviate nociceptive behaviors and neuronal dysfunction in the thalamic–cingulate pathway by attenuating pro-inflammatory activity and cytokine release [61]. Similarly, macrophages play essential roles in resolving neuroinflammation in ischemic stroke models [62, 63, 64].
Several limitations of this study should be acknowledged. The relatively small sample size might constrain the statistical power and generalizability of the results, potentially affecting the precision of key gene and cell-type identification. Additionally, inter-model variability and species-specific differences between animal models and humans may influence the interpretation and translatability of the findings. Future cross-species comparative analyses are warranted to elucidate the extent of conservation and divergence in cellular functions, thereby providing deeper insights into species-specific biological mechanisms. Furthermore, while several DEGs were identified, their mechanistic roles in THP pathogenesis remain to be elucidated and will be the focus of future investigations.
In conclusion, this study employed a multi-omics integrative analysis framework to identify and validate key genetic and cellular markers associated with THP. The combined transcriptomic and single-cell analyses elucidated the molecular and cellular architecture of THP, revealed putative gene–cell interaction networks involved in disease progression, and identified candidate targets for therapeutic intervention. These findings advance the understanding of THP pathogenesis and lay the basis for the development of novel diagnostic and therapeutic strategies.
The datasets used and/or analyzed during the current study are available from the corresponding author on reasonable request.
CY: writing – review & editing, conceptualization, methodology, experiments, software, funding acquisition, and formal analysis. JG: writing – review & editing, conceptualization, experiments, software, review & editing, and resources. YL: writing – review & editing, methodology, experiments, and software. YX: writing – review & editing, validation and formal analysis. TH: writing – review & editing, visualization, project administration, and funding acquisition. All authors read and approved the final manuscript. All authors have participated sufficiently in the work and agreed to be accountable for all aspects of the work.
The TH model establishment was approved by Wuhan Servicebio Biotechnology Co., Ltd. (Approval No. 2022045). This research was approved by the Animal Care and Use Committee of the Medical College of Yangzhou University (Yangzhou, China; Approval No. 202303874) and adhered to the guidelines of the International Association for Pain Research. All animal experiments were performed in strict accordance with the National Institutes of Health Guide for the Care and Use of Laboratory Animals.
Not applicable.
The present study was supported by the National Natural Science Foundation of China (grant Nos. 82172190), the Class A Medical Technology Key Talent of Northern Jiangsu People’s Hospital (grant Nos. JSGG13), lv Yang Jin Feng program (grant Nos. LYJF00048), Doctoral Startup Fund of Northern Jiangsu People’s Hospital (grant Nos. BSQDJ0199 and BSQDJ0237), the Research Grant of Northern Jiangsu People’s Hospital (grant Nos. YJJ230056), the Yangzhou Natural Science Foundation (grant Nos. YZ2024159), Yangzhou Talent Program Project (grant Nos. YCJH00021), Jiangsu Province Traditional Chinese Medicine Science and Technology Development Plan - Young Talent Program (grant Nos. QN202423).
The authors declare no conflict of interest.
Supplementary material associated with this article can be found, in the online version, at https://doi.org/10.31083/JIN38130.
References
Publisher’s Note: IMR Press stays neutral with regard to jurisdictional claims in published maps and institutional affiliations.