


 , Yifan Yang 1,†, Shuang Liu 1, Guofang Zhang 1, Ru Bai 1, Shu Li 1, Ruotong Zhao 1, Yuqi Cheng 2,*
 , Jian Xu 1,*
1 Department of Rheumatology and Immunology, First Affiliated Hospital of Kunming Medical University, 650032 Kunming, Yunnan, China
2 Affiliated Mental Health Center & Hangzhou Seventh People’s Hospital, Zhejiang University School of Medicine, 310058 Hangzhou, Zhejiang, China
†These authors contributed equally.
Abstract
This study investigated cortical morphological changes in systemic lupus erythematosus (SLE) patients diagnosed with anxiety and/or depression, all of whom exhibited no major neuropsychiatric symptoms and had normal conventional magnetic resonance imaging (MRI) findings. We also further examined the correlation between these morphological alterations and clinical characteristics.
Employing advanced structural MRI (sMRI) techniques, we implemented a dual analytical approach combining voxel-based morphometry (VBM) and surface-based morphometry (SBM) to assess structural differences across three cohorts comprising 59 SLE patients with anxiety and/or depression (SLE-AD), 35 SLE patients with no anxiety and/or depression (SLE-NAD), and 48 age-matched healthy controls (HCs). Within the SBM-based analysis framework, we set a minimum clustering threshold of 50 vertices to secure robust outcomes and delineate significant brain regions. The study focused on whole-brain gray matter volume (GMV), cortical thickness (CT), depth of the sulci (SD), cortical gyrification index (GI), and fractal dimension (FD).
Quantitative analyses revealed significant GMV reductions in the SLE-AD group compared with HCs and the SLE-NAD groups (gaussian random field (GRF) correction: pvoxel < 0.0005, pcluster < 0.0005). Additionally, we observed widespread decreases in the CT and SD, as well as reduced GIs across multiple regions (puncorr < 0.001, cluster size >50 vertices). The most prominent alterations were in the left temporal lobe, bilateral thalamus, prefrontal cortex cingulate gyrus, insula, postcentral gyrus, and fusiform gyrus. GMV in the left middle temporal gyrus (r = –0.288, p = 0.027) and CT in the left fusiform gyrus (r = –0.337, p = 0.009), along with CT in the right middle frontal sulcus (r = –0.306, p = 0.018) and right middle frontal gyrus (r = –0.356, p = 0.006), were inversely associated with SLE disease activity index (SLEDAI). However, neither GMV, CT, nor cortical complexity exhibited significant associations with Hamilton Anxiety Scale (HAMA) or Hamilton Depression Scale (HAMD) scores. Multivariate linear regression analysis indicated that the CT of left hemisphere-related brain areas—including the superior occipital gyrus, parieto-occipital sulcus, cuneus and opercular part of the inferior frontal gyrus—and the GI of the superior frontal gyrus significantly influenced HAMD/HAMA scores. CT of the left hemisphere’s intraparietal sulcus and transverse parietal sulci, along with SD of the right hemisphere’s central sulcus, were predictors of HAMA scores.
Our findings demonstrate that SLE patients presenting with anxiety and/or depression exhibit distinct neuroanatomical alterations, even without prominent neuropsychiatric manifestations. These morphological changes may represent the neurobiological substrate underlying the heterogeneous clinical spectrum of neuropsychiatric SLE (NPSLE), potentially serving as early neuroimaging biomarkers. Furthermore, these findings provide a structural framework for future studies investigating the causal relationships between these anatomical changes and the neurophysiological mechanisms underlying NPSLE.
Keywords
- systemic lupus erythematosus
- anxiety
- depression
- female
- magnetic resonance imaging
- neuroimaging
Systemic lupus erythematosus (SLE) is a systemic connective tissue disorder predominantly affecting women during their reproductive years, exhibiting a striking gender disparity with an estimated 1:9 male-to-female incidence ratio [1]. SLE is characterized by autoimmune inflammation, leading to multi-organ damage due to the production of pathogenic autoantibodies and immune complex deposition, with neuropsychiatric involvement being a major contributor to morbidity and mortality [2]. Women at risk for SLE throughout their life cycle. Individuals with neuropsychiatric symptoms and signs are diagnosed with neuropsychiatric SLE (NPSLE), a condition associated with high mortality, poor prognosis, and low quality of life. Anxiety and depression are among the 19 neuropsychiatric manifestations defined by the American College of Rheumatology (ACR) in 1999 for the diagnosis of NPSLE [3]. Gender disparities in anxiety and depression have been widely observed, with women exhibiting a higher susceptibility [4]. Epidemiological studies indicate that SLE patients exhibit a two-fold increased susceptibility to anxiety and depression disorders relative to the general public, with prevalence rates of 25.8% and 35.0%, respectively [5, 6]. Anxiety and depression remain prevalent among patients lacking major neuropsychiatric symptoms and normal routine magnetic resonance imaging (MRI) results [7, 8]. The precise mechanisms underlying NPSLE remain incompletely understood. However, it is postulated that autoantibodies, blood-brain barrier, and small vessel disease may play contributory roles. These pathological processes may contribute to brain parenchymal atrophy and the emergence of non-specific neuropsychiatric symptoms, including anxiety and depression in SLE patients [9, 10, 11].
Advances in brain imaging technology offer valuable, non-invasive, and quantitative analytical techniques for investigating the pathogenesis of SLE patients experiencing concurrent anxiety and/or depression. Research utilizing structural and functional MRI has demonstrated that changes in brain structure and function among SLE patients may stem from complex autoimmune inflammatory responses, which contribute to symptoms of anxiety and depression [10, 12, 13, 14, 15, 16]. Comorbid anxiety and depression in SLE patients may have overlapping pathophysiological mechanisms, including immune dysregulation, neuroinflammation, and blood-brain barrier impairment that may activate or exacerbate autoimmune inflammation, thereby negatively impacting treatment outcomes, prognosis, and increasing the disease burden [17, 18]. Despite significant improvements in survival rates over recent decades, SLE patients continue to experience compromised health-related quality of life [19]. Therefore, besides managing SLE, early identification and proactive intervention for anxiety and depression are essential, as they contribute to facilitating disease outcomes and enhanced quality of life.
Advances in MRI techniques, including three-dimensional structural MRI (3D-sMRI) and functional MRI (fMRI), have significantly improved the sensitivity and specificity of early brain damage detection in SLE, establishing them as the preferred non-invasive approach for studying the SLE-related neuroimaging [20]. 3D-sMRI encompasses voxel-based morphometry (VBM) [21] and surface-based morphometry (SBM) [22]. These complementary approaches provide quantitative assessments of central nervous system structural alterations, yielding critical insights into SLE pathogenesis, diagnostic evaluation, therapeutic strategies, and prognosis indicators. VBM quantifies structural abnormalities through volumetric or density analyses of gray and white matter within individual MRI voxels. In contrast, SBM employs advanced tissue segmentation and cortical reconstruction algorithms to measure multiple morphological parameters, including cortical thickness (CT), depth of the sulci (SD), cortical gyrification index (GI), and fractal dimension (FD). Notably, the latter three indicators collectively characterize cortical complexity. Compared to fMRI, 3D-sMRI is less susceptible to emotional influences and exhibits strong repeatability. Consequently, it has been extensively used to capture the complex changes induced by early neurodevelopment and disease-related damage in the brain.
Fluctuations in estrogen levels throughout the female reproductive lifespan significantly influence B cell development, selection, and activation processes. These hormonal changes may interfere with immune tolerance, contributing to the increased susceptibility of women to SLE [23]. Females with SLE experience a higher age-adjusted mortality rate than males, exhibit greater reductions in brain volume and are more prone to an earlier onset of neuropsychiatric manifestations [16, 24]. Microstructure alterations in white matter integrity appear to be intrinsic to the pathophysiology of SLE and are associated with clinical neuropsychiatric symptoms manifestations. This suggests that neuroaxonal damage emerges early in the disease course, potentially preceding the onset of mood disorders [25]. A VBM study revealed that female non-NPSLE patients exhibited significantly reduced gray matter volume (GMV) and white matter volume (WMV) compared to male counterparts. This suggests that brain structural alterations may occur before the onset of clinically obvious neuropsychiatric symptoms [16]. Early identification of subclinical neuroanatomical alterations before the manifestation of overt neuropsychiatric symptoms could enable timely therapeutic interventions. This proactive approach may mitigate progressive neural injury and inform optimized clinical management strategies.
Previous fMRI-based studies have reported alterations in brain network connectivity related to emotion regulation, including abnormalities in functional connectivity of the prefrontal-limbic system and default mode network, and hyperactivity of the thalamus, which have been associated with cognitive impairment and mood disorders in NPSLE [13, 26, 27, 28, 29]. Even among non-NPSLE patients, reductions in GMV and changes in white matter integrity have been found across various brain regions [16, 25, 30]. However, the early diagnosis of anxiety and depression disorders remains clinically challenging in SLE patients who present with normal MRI findings and lack overt neuropsychiatric symptoms, primarily due to the non-specific nature of these psychiatric manifestations. Given that women make up the majority of the SLE population, focusing on female participants can reduce confounding factors associated with sex differences in disease manifestations. Therefore, our study aims to combine VBM and SBM to investigate microstructural changes more comprehensively in the brains of female patients with SLE who have anxiety and/or depression, by analyzing multiple indicators including GMV, CT, and cortical complexity. Additionally, we seek to further explore possible correlations between clinical indicators and abnormal cerebral structures.
SLE outpatients and inpatients from the Department of Rheumatology and Immunology at the First Affiliated Hospital of Kunming Medical University were recruited. Concurrently, healthy volunteers were enrolled to serve as healthy controls (HCs). Clinical and MRI imaging data were collected using standardized protocols and tracked by the same researcher. A rheumatologist and psychiatrist with extensive clinical experience examined each subject and did a complete physical examination to assess neuropsychiatric changes. The inclusion and exclusion criteria were defined as follows:
Inclusion criteria for the SLE group: (1) patients who met the 1997 ACR SLE
classification criteria [31], had no history of NPSLE, exhibited no evident
neuropsychiatric symptoms, and displayed unremarkable T1- and T2-weighted images
on standard cranial MRI, indicating SLE patients without major neuropsychiatric
manifestations; (2) participants aged between 18 and 50 years, assessed as
right-handed (score
Exclusion criteria for the SLE group: (1) individuals with a history of severe traumatic brain injury; (2) patients with organic brain disease or neurological disease that may interfere with brain structure (such as head trauma or surgery, Parkinson’s disease, epilepsy, stroke, etc.); (3) patients with a history of severe mental illness (such as depression, anxiety, schizophrenia, etc.); (4) individuals with a history of alcohol use disorder and substance misuse; (5) participants with other autoimmune diseases; (6) patients exhibiting serious clinical conditions that may affect brain morphology (for instance, uncontrolled hypertension, diabetes mellitus, or renal insufficiency); (7) patients deemed ineligible for MRI examinations due to contraindications: including claustrophobia, dentures, or metal foreign bodies; (8) patients who are unable to cooperate with the completion of the scale assessment and questionnaire.
Inclusion criteria for the HCs group: (1) individuals aged 18~50
years; (2) exhibiting right-handedness, as determined by the Edinburgh Handedness
Inventory (score
Approval for this study was obtained from the Ethics Committee of the First Affiliated Hospital of Kunming Medical University. The study was carried out in accordance with the guidelines of the Declaration of Helsinki. All subjects and/or their legal guardians were informed of the purpose and content of the study in detail before enrollment.
Demographics, clinical indicators, and psychiatric scales: (1) basic
demographics: gender, age, and education; (2) clinical indicators: laboratory
indicators such disease course and autoantibodies; the course of disease is the
period from SLE’s initial clinical signs to MRI acquisition. All clinical
symptoms and lab tests were recorded according to ACR standards; (3) SLE disease
activity index 2000 (SLEDAI-2k) [33]: used to assess SLE disease activity. The
examination was done on MRI day. Mild activity: SLEDAI-2k
All individuals underwent scanning on a 1.5T MRI scanner (Twinspeed; GE Medical
Systems, Milwaukee, WI, USA), utilizing a birdcage head coil to ensure the full
coverage of brain. The subjects were supine on a foam pad to minimize head
movement. They wore eye masks, closed their eyes, and remained still during the
scan. Blood pressure, pulse, and breathing were monitored during the magnetic
resonance scan via in-cabin video. After each imaging sequence, the participants
were told to stay awake. T1-weighted images and T2-weighted images were acquired
first to rule out any structural problems. 3D-sMRI data were obtained using a
3D-T1-weighted fast spoiled gradient echo (FSPGR) sequence, with the following
imaging parameters: repetition time (TR) = 10.5 ms, echo time (TE) = 2.0 ms,
inversion time (TI) = 350 ms, slice thickness = 1.8 mm (contiguous), matrix size
= 256
VBM and SBM analyses were performed using the CAT12 (Version 12.8.2; Gaser & Dahnke, Department of Psychiatry and Psychotherapy, Jena University Hospital, Jena, Germany, http://dbm.neuro.uni-jena.de/cat12/) [38] toolbox on the SPM12 (Version 6906; Functional Imaging Laboratory, Wellcome Trust Centre for Neuroimaging, Institute of Neurology, UCL, London, UK, https://www.fil.ion.ucl.ac.uk/spm/) [39] platform in MATLAB (Version 2016b; MathWorks Inc., Natick, MA, USA), which effectively calculate and compare group differences in indicators such as GMV, CT, and cortical complexity in structural imaging data. Detailed methodologies of the preprocessing procedures have been documented in earlier studies. Briefly, (1) The VBM process includes spatially adaptive nonlocal means (SANLM) denoising filters, bias correction, and affine registration. This process primarily utilizes segmented GMV, WMV and cerebrospinal fluid (CSF). Finally, the 1.5 mm template was normalized to Montreal Neurological Institute (MNI) space using the diffeomorphic anatomical registration through exponentiated lie algebra (DARTEL) algorithm, and total intracranial volume (TIV), GMV, WMV, and CSF volumes for each subject were calculated. (2) In the SBM analysis, preprocessing encompassed CT estimation and central surface reconstruction. The projection-based thickness (PBT) approach was utilized for topological correction and surface refinement. Finally, local thickness measurements are mapped to the “faverage” template to evaluate the uniformity of the processed images. After preprocessing, the GMV, CT and cortical complexity maps spatially smoothed using a Gaussian kernel to reduce individual differences, ensure normal data distribution, and improve the validity of statistical tests. Among them, the GMV map underwent smoothing using an 8 mm full width at half maximum (FWHM) Gaussian kernel, while the CT and cortical complexity maps were smoothed with Gaussian kernels of 15 mm and 20 mm FWHM, respectively.
Data on demographic, clinical, and mental scale were processed using SPSS
(version 25.0; IBM Corp., Armonk, NY, USA). The Shapiro-Wilk test was used to
assess the normality of the measurement data. Normally distributed data are
presented as mean
DPABI (Version 4.0; Yan, Key Laboratory of Behavioral Science and Magnetic
Resonance Imaging Research Center, Institute of Psychology, Chinese Academy of
Sciences, Beijing, China, http://rfmri.org/dpabi) [40], CAT12/SPM12 and SPSS
software were used to perform statistical analysis on GMV, CT, SD, GI and FD.
First, the statistical module of DPABI software was utilized to conduct analysis
of covariance (ANCOVA) on GMV differences among the three groups, using age,
years of education, and TIV as covariates. The results were then corrected using
gaussian random field (GRF) method (pvoxel
This study finally included 94 female SLE patients who did not exhibit
significant neuropsychiatric manifestations and normal MRI findings (59 of them
were SLE-AD, 35 were SLE-NAD), and 48 female HCs. We performed a correlation
analysis between HAMA and HAMD scores in SLE patients. The results showed that
anxiety and depression were exhibited a statistically significant positive
relationship (r = 0.880, p
| Clinical variables | SLE-AD (n = 59) | SLE-NAD (n = 35) | HCs (n = 48) | t/Z/F/H | p |
| Age, years | 30.20 |
28.69 |
31.88 |
1.856 | 0.160c |
| Education, years | 11.00 (9.00, 15.00) | 12.00 (9.0, 14.00) | 12.00 (12.00, 15.00) | 4.761 | 0.093d |
| Duration of illness, months | 12.00 (2.00, 36.00) | 12.00 (1.00, 32.00) | NA | –0.917 | 0.359b |
| SLEDAI-2k | 10.15 |
9.29 |
NA | 0.698 | 0.487a |
| MMSE | 28.00 (25.00, 29.25) (n = 54) | 28.00 (26.00, 29.00) (n = 34) | 30 (30, 30) | –0.282 | 0.778b |
| HAMA | 9.00 (7.00, 13.00) | 3.00 (2.00, 4.00) | 0.00 (0.00, 1.00) | –7.994 | |
| HAMD-17 | 11.24 |
4.00 (2.00, 6.00) | 0.00 (0.00, 0.00) | –7.735 |
Note: SLE-AD (n = 59), SLE with anxiety and/or depression; SLE-NAD (n = 35), SLE with no anxiety and/or depression; HCs (n = 48), healthy controls; SLEDAI-2k, SLE Disease Activity Index 2000; MMSE, Mini-Mental State Examination; HAMA, Hamilton Anxiety Rating Scale; HAMD-17, 17-item Hamilton Depression Rating Scale; NA, not applicable; SLE, systemic lupus erythematosus. p a, two independent samples t-test; p b, Mann-Whitney U test; p c, one-way analysis of variance (ANOVA); p d, Kruskal-Wallis H test; *, indicates that the p value is less than 0.05.
Variance analysis revealed significant differences in the GMV of the left middle
temporal gyrus, left gyrus rectus, and bilateral thalamus across the SLE-AD,
SLE-NAD, and HCs groups (GRF correction: pvoxel
| Brain region | Cluster sizes (mm3) | F | MNI coordinates | The p value of Post hoc | ||||
| X | Y | Z | SLE-AD vs. SLE-NAD | SLE-AD vs. HCs | SLE-NAD vs. HCs | |||
| Middle temporal gyrus_L | 4691.25 | 16.3807 | –48 | –13.5 | –24 | 0.2108 | 0.0005*** | |
| Gyrus rectus_L | 5528.25 | 15.6423 | 6 | 37.5 | –22.5 | 0.1492 | 0.0031** | |
| Thalamus_bilateral | 6257.25 | 20.4602 | 0 | –1.5 | 4.5 | 0.0153* | 0.0077** | |
Note: SLE-AD (n = 59); SLE-NAD (n = 35); HCs (n = 48); GMV, gray
matter volume; MNI, Montreal Neurological Institute; X Y Z, spatial coordinates of the MNI 152 template; L, left; Post hoc
comparison p-value shows: ****p
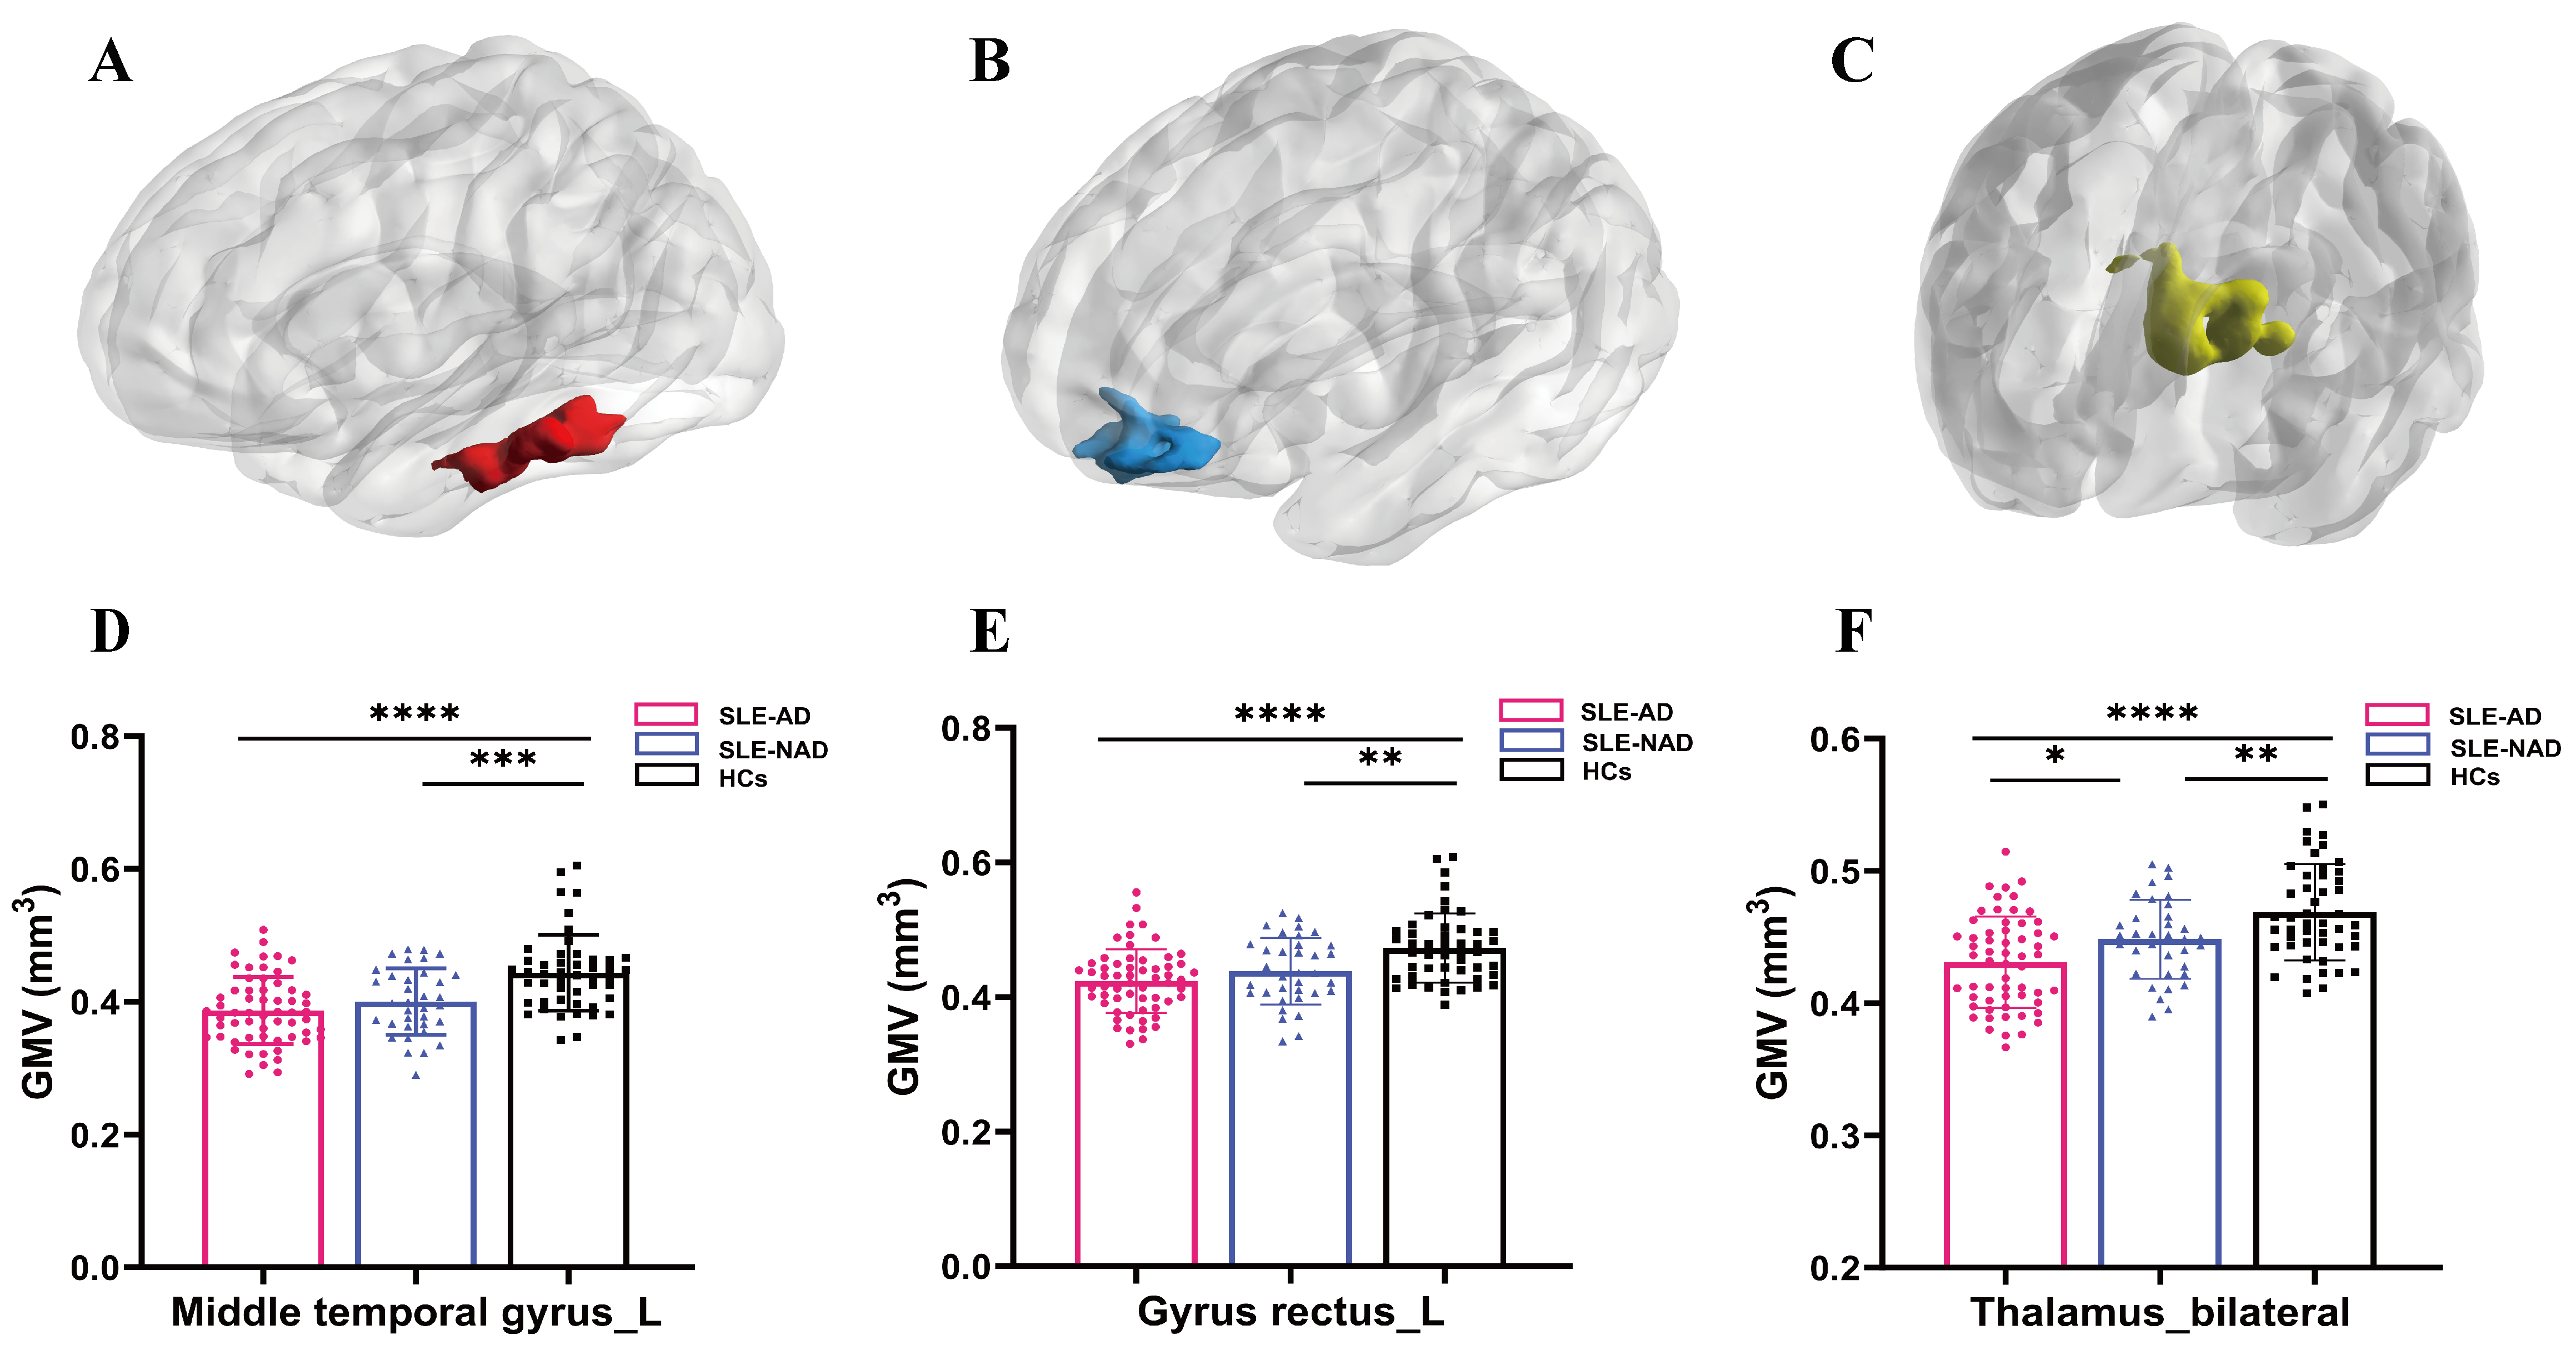 Fig. 1.
The results of clusters with significant differences in GMV
between the SLE-AD, the SLE-NAD, and the HCs groups, along with post hoc
comparison. (A–C) GMV reduction regions in SLE-AD group. (D) Post hoc analysis
results of the left middle temporal gyrus GMV: compared with HCs, the GMV of
SLE-AD (****p
Through analysis of variance found that significant differences in CT across
eight clusters in the left hemisphere among the SLE-AD, SLE-NAD and HCs groups
(puncorr
| Cluster | Size | Brain regions | F | p | MNI coordinates | The p value of post hoc | ||||||
| X | Y | Z | SLE-AD vs. SLE-NAD | SLE-AD vs. HCs | SLE-NAD vs. HCs | |||||||
| CT | ||||||||||||
| LH | ||||||||||||
| Cluster 1 | 152 | 38% Superior occipital gyrus | 10.41 | 0.00006 | –6 | –87 | 33 | 0.4075 | 0.0014** | |||
| 32% Parieto-occipital sulcus | ||||||||||||
| 30% Cuneus | ||||||||||||
| Cluster 2 | 115 | 69% Middle frontal sulcus | 9.88 | 0.00010 | –25 | 48 | 11 | 0.0792 | 0.0395* | |||
| 17% Fronto-marginal gyrus and sulcus | ||||||||||||
| 14% Middle frontal gyrus | ||||||||||||
| Cluster 3 | 90 | 56% Opercular part of the inferior frontal gyrus | 9.24 | 0.00017 | –59 | 4 | 7 | 0.0273* | 0.0616 | |||
| 24% Superior segment of the circular sulcus of the insula | ||||||||||||
| 19% Subcentral gyrus and sulci | ||||||||||||
| 1% Inferior part of the precentral sulcus | ||||||||||||
| Cluster 4 | 87 | 46% Marginal branch of the cingulate sulcus | 9.63 | 0.00012 | –8 | –28 | 49 | 0.1201 | 0.0002*** | 0.0288* | ||
| 31% Superior frontal gyrus | ||||||||||||
| 17% Middle-posterior part of the cingulate gyrus and sulcus | ||||||||||||
| 6% Paracentral lobule and sulcus | ||||||||||||
| Cluster 5 | 86 | 99% Intraparietal sulcus and transverse parietal sulci | 9.57 | 0.00013 | –24 | –71 | 30 | 0.0004*** | 0.0004*** | 0.7024 | ||
| 1% Superior parietal lobule | ||||||||||||
| Cluster 6 | 62 | 58% Middle frontal sulcus | 10.37 | 0.00006 | –26 | 43 | 31 | 0.0777 | 0.0217* | |||
| 32% Middle frontal gyrus | ||||||||||||
| 10% Superior frontal sulcus | ||||||||||||
| Cluster 7 | 54 | 100% Inferior frontal sulcus | 10.31 | 0.00007 | –37 | 16 | 30 | 0.1453 | 0.0004*** | 0.0493* | ||
| Cluster 8 | 52 | 100% fusiform gyrus | 10.21 | 0.00007 | –27 | –55 | –17 | 0.0006*** | 0.8168 | |||
| RH | ||||||||||||
| Cluster 1 | 71 | 72% Marginal branch of the cingulate sulcus | 9.90 | 0.00010 | 12 | –28 | 47 | 0.0403* | 0.0739 | |||
| 20% Middle-posterior part of the cingulate gyrus and sulcus | ||||||||||||
| 8% Superior frontal gyrus | ||||||||||||
| Cluster 2 | 71 | 94% Middle frontal sulcus | 8.91 | 0.00023 | 26 | 51 | 10 | 0.9354 | 0.0013** | 0.0038** | ||
| 6% Transverse frontopolar gyri and sulci | ||||||||||||
| Cluster 3 | 64 | 98% Middle frontal gyrus | 11.45 | 0.00003 | 48 | 25 | 32 | 0.1973 | 0.0080** | |||
| 2% Inferior frontal sulcus | ||||||||||||
| Cluster 4 | 60 | 83% Postcentral gyrus | 8.41 | 0.00036 | 56 | –17 | 44 | 0.0037** | 0.0001*** | 0.5285 | ||
| 13% Postcentral sulcus | ||||||||||||
| 3% Central sulcus | ||||||||||||
| SD | ||||||||||||
| RH | ||||||||||||
| Cluster 1 | 445 | 49% Posterior ramus of the lateral sulcus | 9.65 | 0.00012 | 36 | –15 | 19 | 0.0865 | 0.0384* | |||
| 40% Superior segment of the circular sulcus of the insula | ||||||||||||
| 5% Anterior transverse temporal gyrus | ||||||||||||
| 4% Subcentral gyrus and sulci | ||||||||||||
| 2% Transverse temporal sulcus | ||||||||||||
| Cluster 2 | 89 | 100% Central sulcus | 9.01 | 0.00021 | 23 | –26 | 52 | 0.1478 | 0.0078** | |||
| GI | ||||||||||||
| LH | ||||||||||||
| Cluster 1 | 59 | 100% Superior frontal gyrus | 8.76 | 0.00026 | –12 | 32 | 52 | 0.2084 | 0.0019** | |||
| FD | ||||||||||||
| - | - | - | - | - | - | - | - | - | - | - | ||
Note: SLE-AD (n = 59); SLE-NAD (n = 35); HCs (n = 48); CT, cortical
thickness; SD, depth of the sulci; GI, gyrification index; FD, fractal dimension;
LH, left hemisphere; RH, right hemisphere; -, region where no difference cluster was found; Post hoc comparison
p-values shows: ****p
 Fig. 2.
The results of clusters exhibiting significant differences in
CT, SD and GI across SLE-AD, SLE-NAD, and the HCs groups. (A) The distribution
of brain regions with reduced CT in clusters 1~8 of the left
hemisphere and clusters 1~4 of the right hemisphere. (B) The
distribution of brain regions with reduced SD in clusters 1~2 of
the right hemisphere. (C) The distribution of brain regions with reduced GI in
cluster 1 of the left hemisphere. Note: SLE-AD (n = 59); SLE-NAD (n = 35); HCs (n =
48).
puncorr
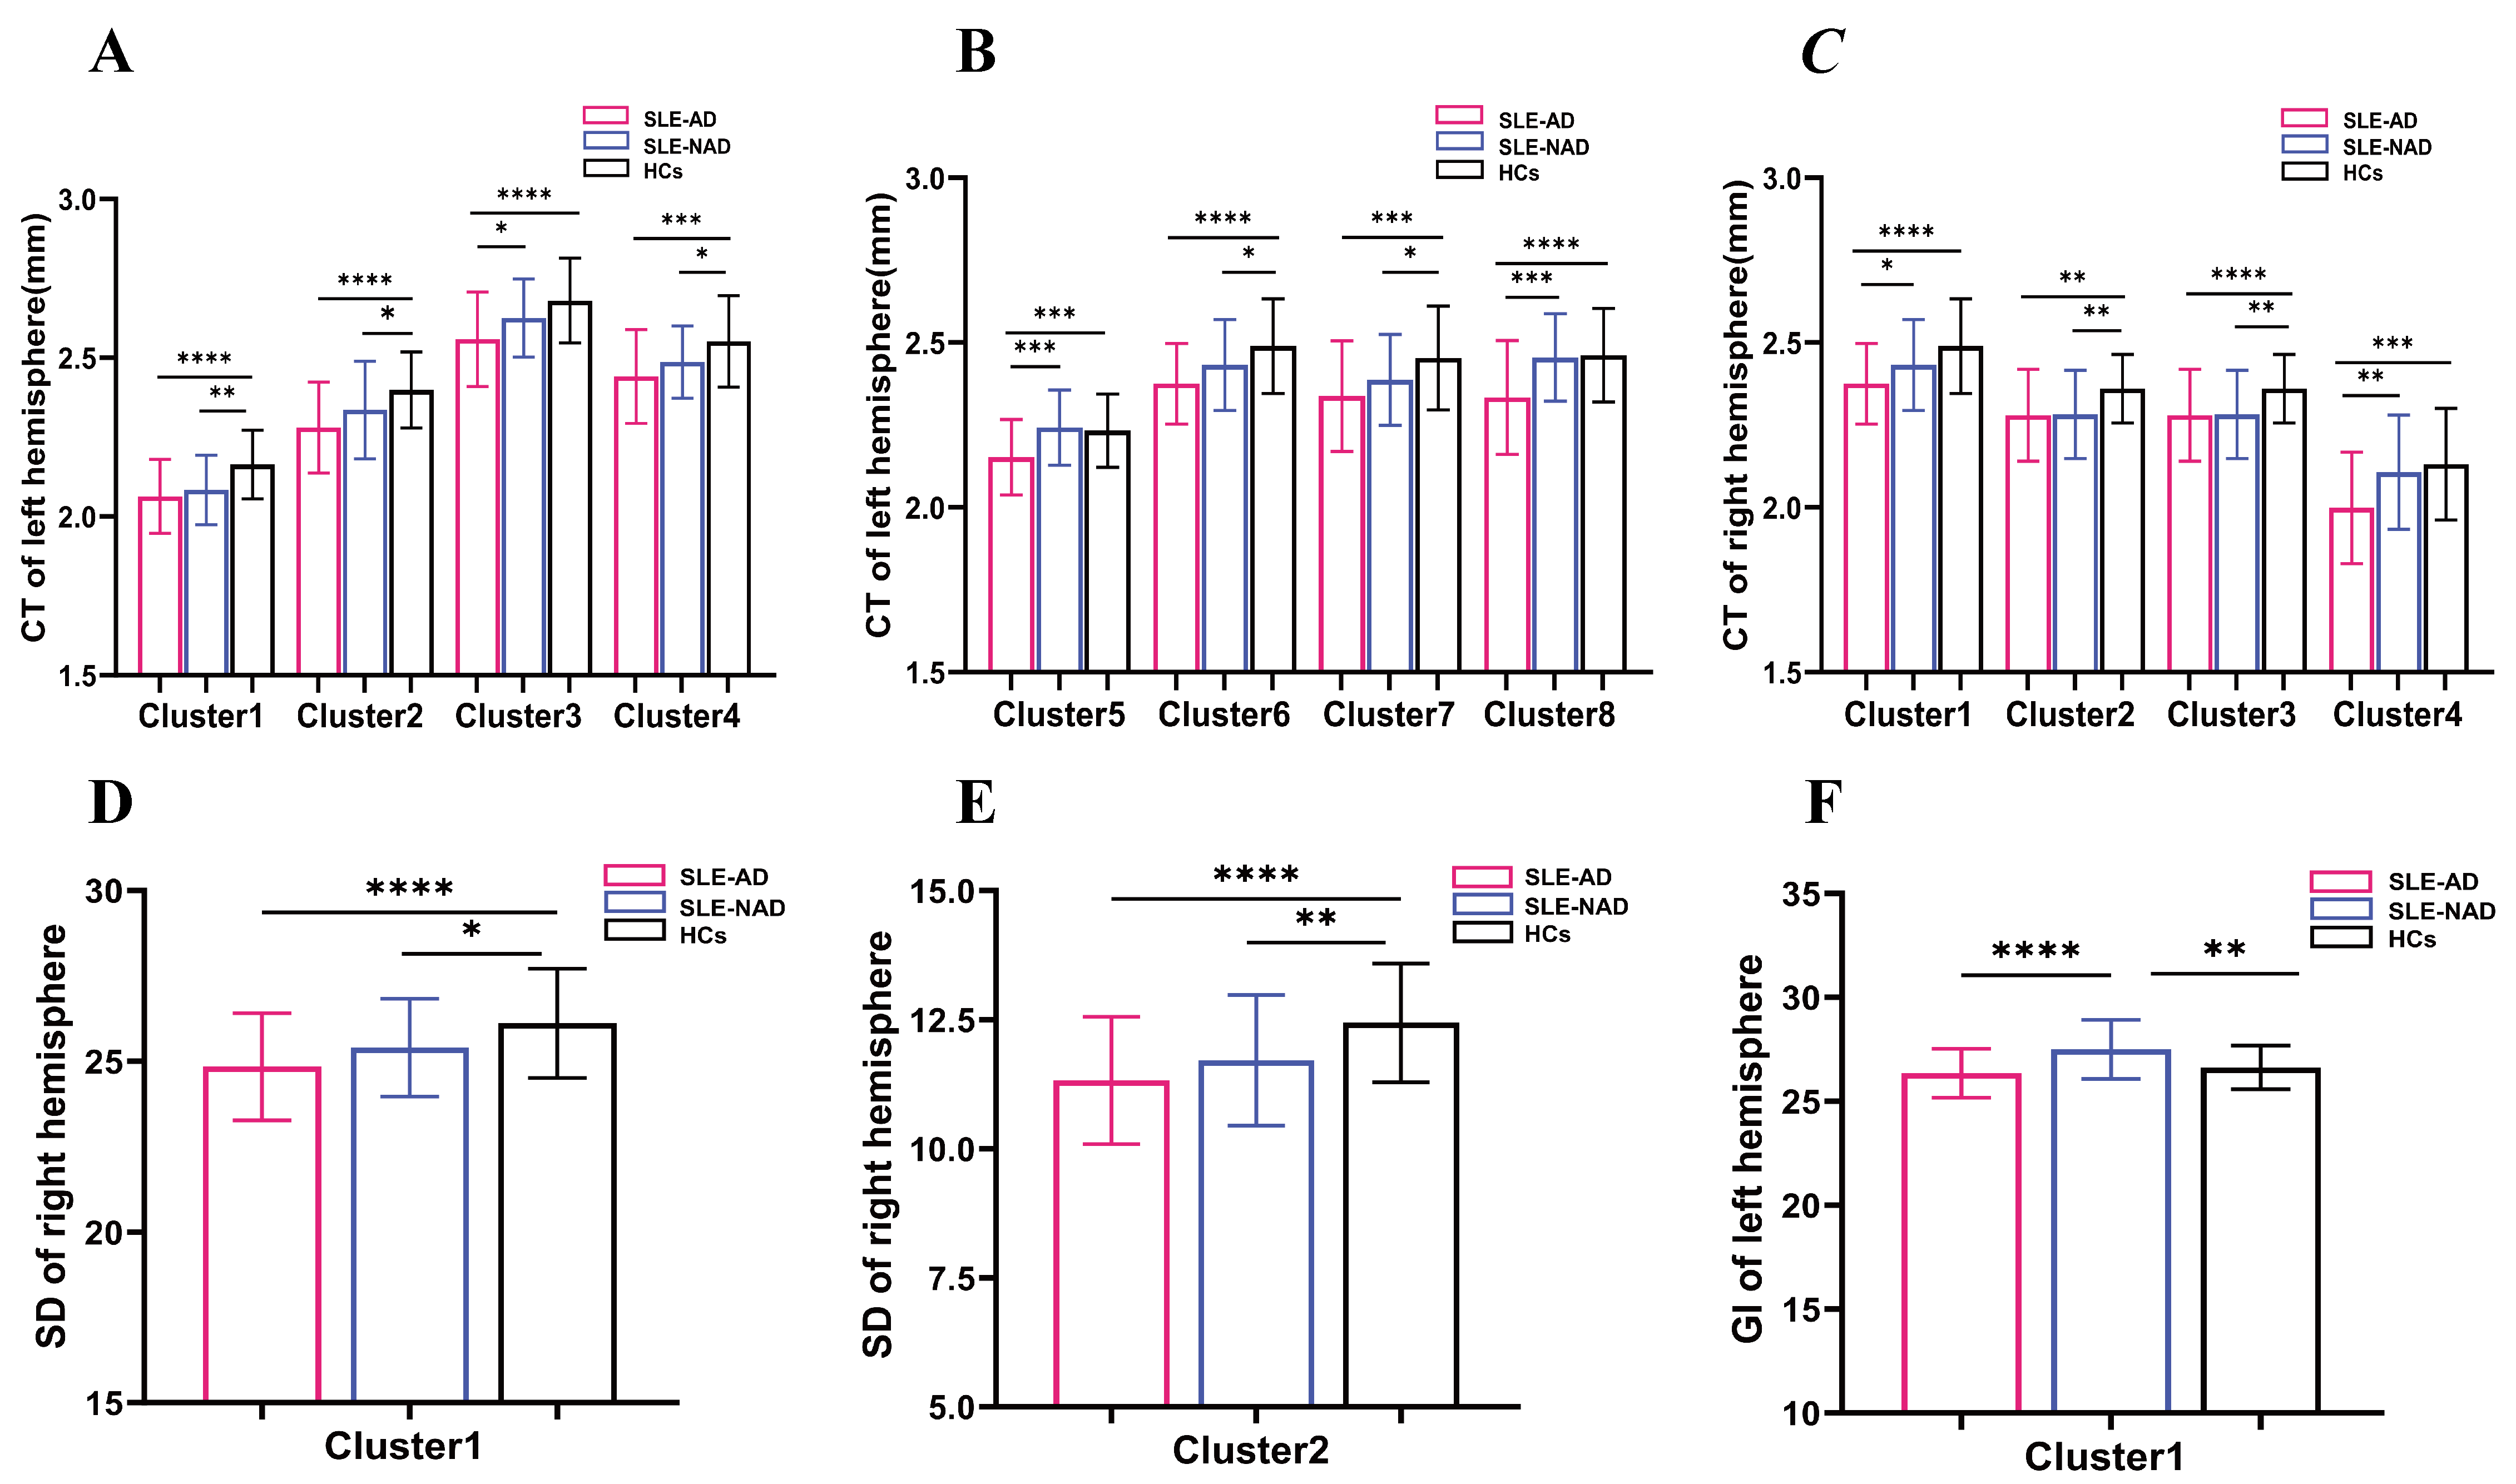 Fig. 3.
The results of clusters and post hoc comparison of significant
differences in CT, SD and GI across SLE-AD, SLE-NAD, and HCs groups. (A)
Cortical thickness of clusters 1~4 in the left hemisphere. (B)
Cortical thickness of clusters 5~8 in the left hemisphere. (C)
Cortical thickness of clusters 1~4 in the right hemisphere. (D)
Sulcus depth of cluster 1 in the right hemisphere. (E) Sulcus depth of cluster 2
in the right hemisphere. (F) Gyrification index of cluster 1 in the left
hemisphere. Note: SLE-AD (n = 59); SLE-NAD (n = 35); HCs (n = 48). Post hoc
comparison p-values shows: ****p
Analysis of variance revealed no significant differences among clusters in the
left hemisphere. However, two clusters in the right hemisphere exhibited
significant differences (puncorr
Analysis of variance revealed no significantly different clusters in the right
hemisphere, while one significant cluster was identified in the left hemisphere
(puncorr
Our study did not identify any significant differences among the three groups (see Table 3).
GMV analysis revealed an inverse relationship between left middle temporal gyrus and SLEDAI score within the SLE-AD group (r = –0.288, p = 0.027). CT analysis revealed a negative correlation between the left fusiform gyrus, right middle frontal sulcus, and right middle frontal gyrus with the SLEDAI score in the SLE-AD group (r = –0.337, p = 0.009; r = –0.306, p = 0.018; r = –0.356, p = 0.006) (see Fig. 4). GMV, CT and cortical complexity of all clusters showed no significant correlation with HAMA and HAMD scores.
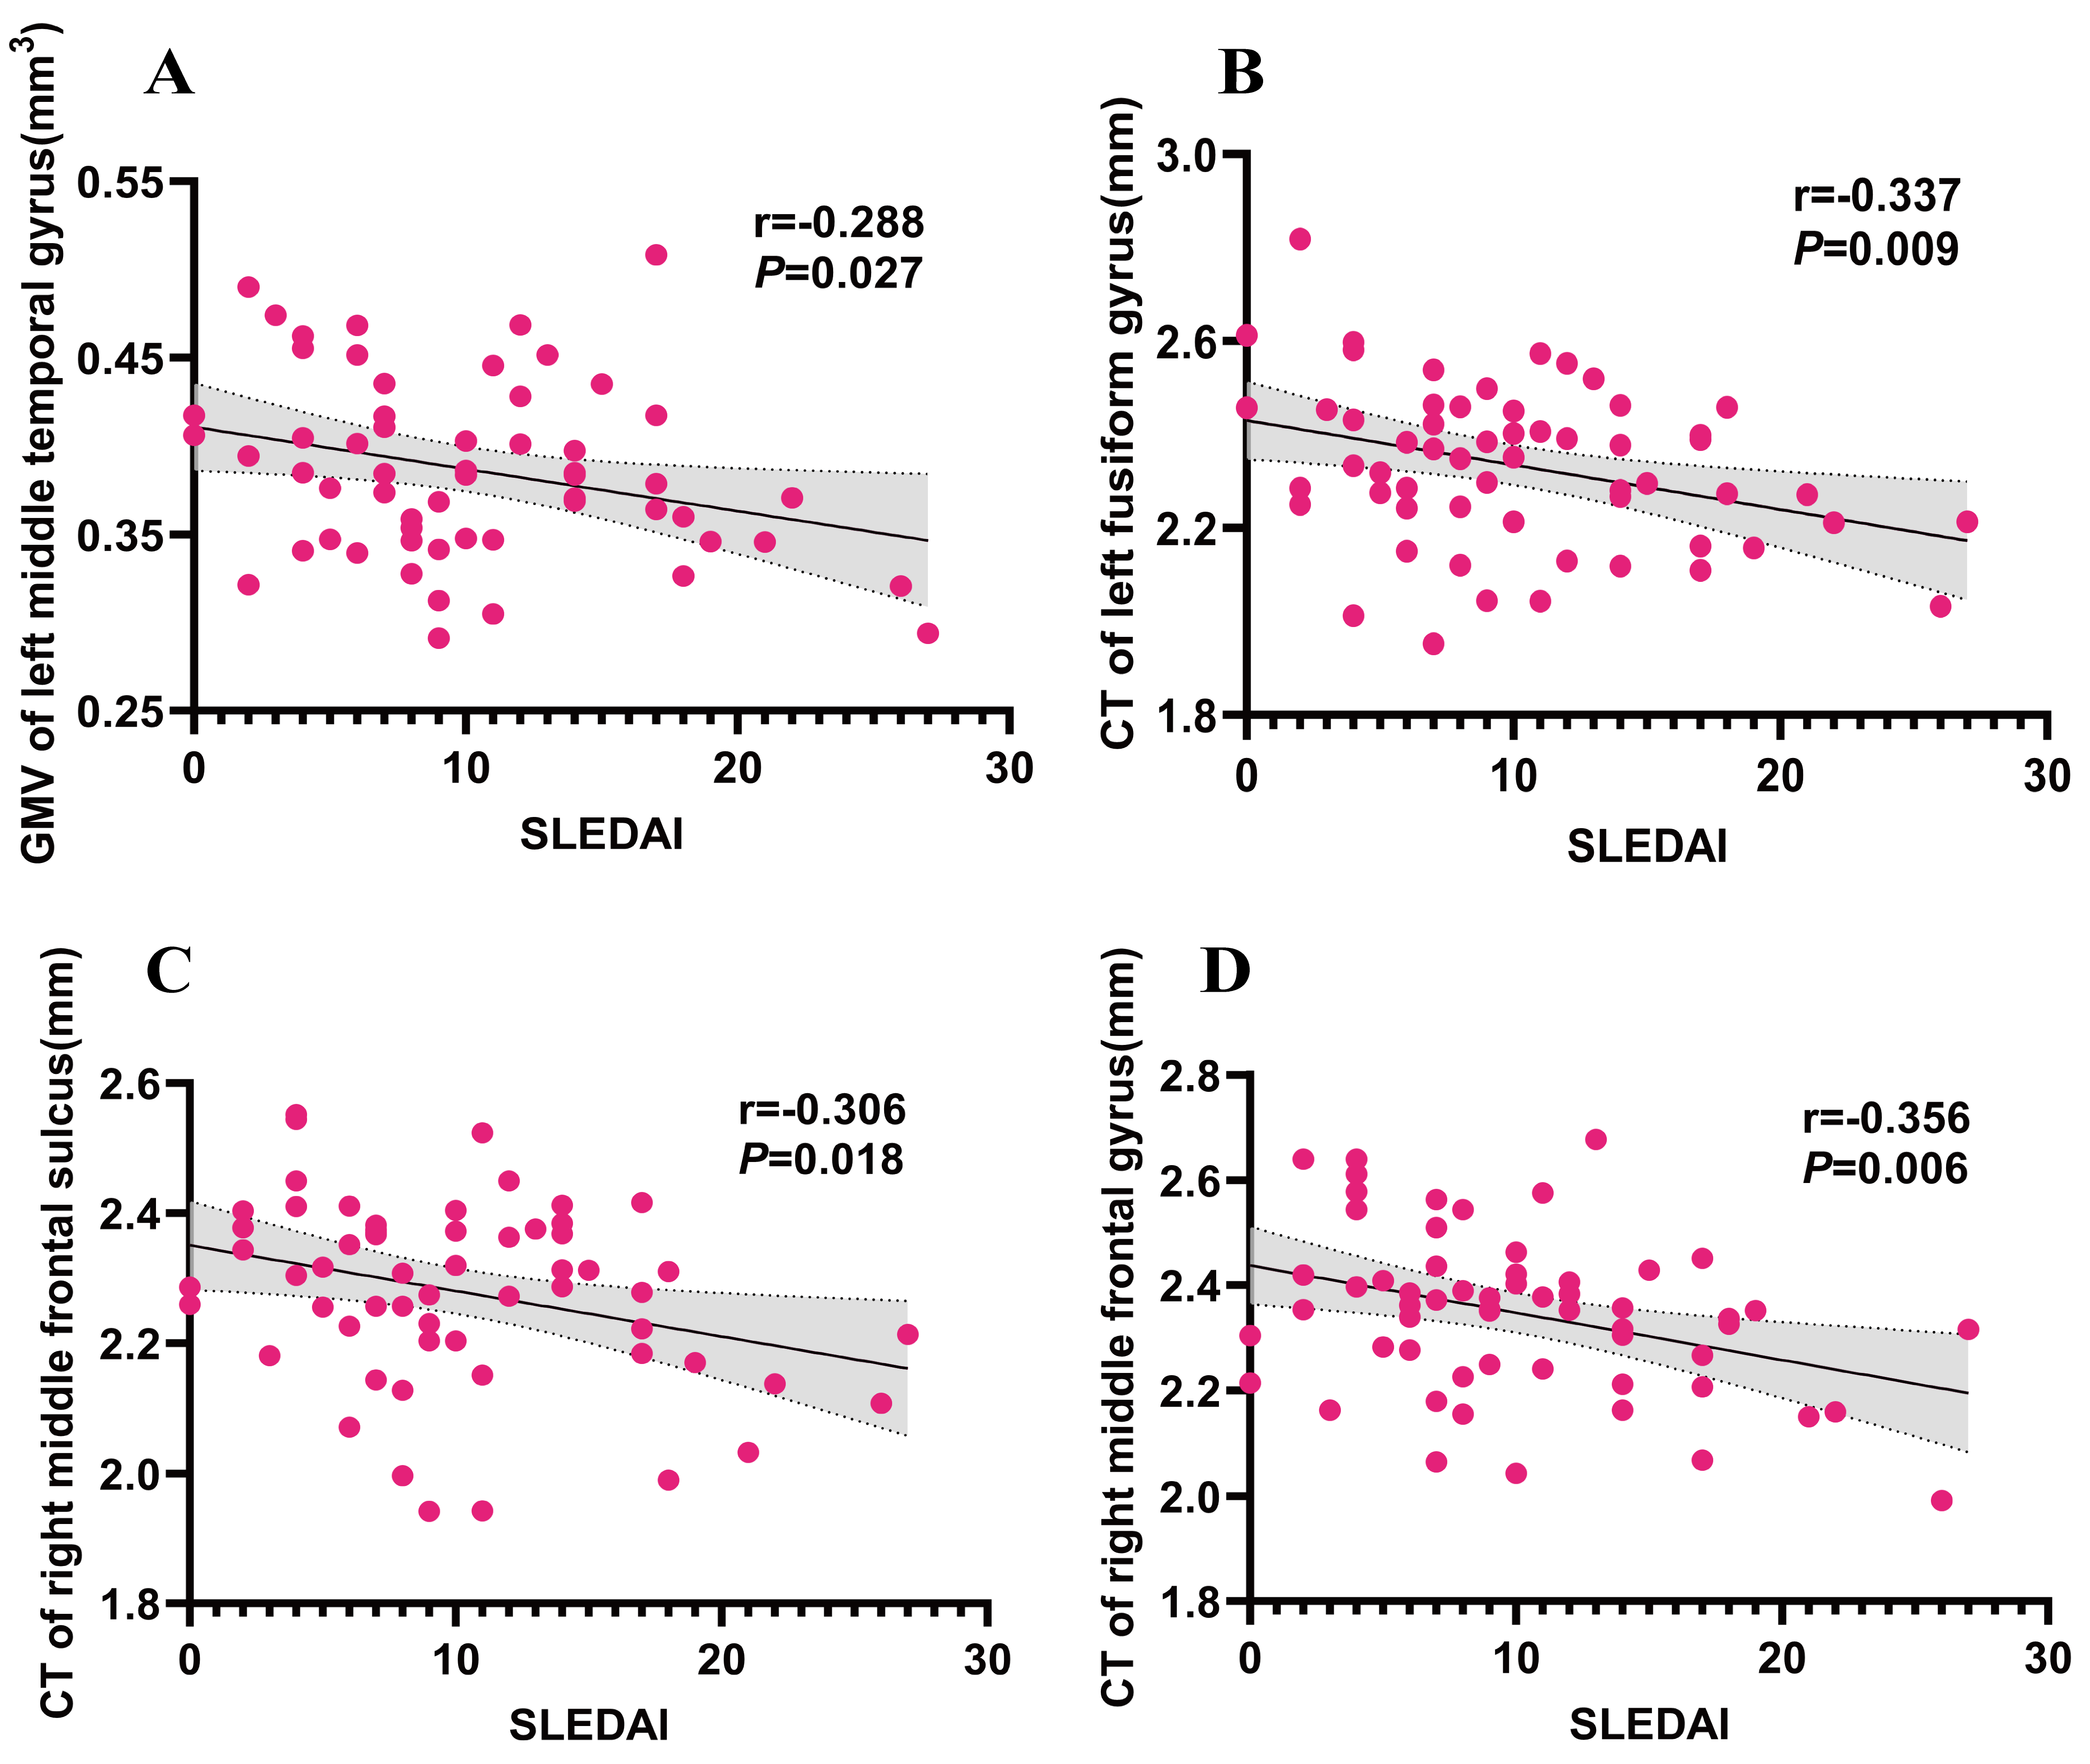 Fig. 4.
Results of the correlation between GMV/CT and clinical characters in SLE-AD group. (A) correlation analysis between GMV of left middle temporal gyrus and SLEDAI. (B) correlation analysis between CT of left fusiform gyrus and SLEDAI. (C) correlation analysis between CT of right middle frontal sulcus. (D) correlation analysis between CT of right middle frontal gyrus. Note: SLE-AD (n = 59); SLEDAI, SLE disease activity index.
We included all the SLE patients’ GMV, CT, SD and GI of all the clusters with significant differences to construct a multivariate linear regression equation. The findings indicated that the CT in the left hemisphere clusters 1 (comprising the superior occipital gyrus, parieto-occipital sulcus and cuneus) and 3 (encompassing the opercular part of the inferior frontal gyrus), along with the GI in the left hemisphere cluster 1 (superior frontal gyrus), significantly influenced the HAMD scores (b = 13.527, t = 2.262, p = 0.027; b = –12.754, t = –2.562, p = 0.015; b = –1.361, t = –3.244, p = 0.002). The CT of in left hemisphere clusters 1 (comprising the superior occipital gyrus, parieto-occipital sulcus and cuneus), 3 (including the opercular part of the inferior frontal gyrus), and 5 (encompassing the intraparietal sulcus and transverse parietal sulci), the SD of in right hemisphere cluster 2 (central sulcus), and the GI of in left hemisphere cluster 1 (superior frontal gyrus) had a statistically significant effect on the HAMA score (b = 11.629, t = 2.287, p = 0.025; b = –10.051, t = – 2.318, p = 0.023; b = –11.923, t = –2.32, p = 0.023; b = –0.881, t = –2.231, p = 0.029; b = –1.428, t = –4.001, p = 0.0001).
Multi-modal advanced MRI technology has been extensively utilized to study brain damage in SLE. A large number of studies have demonstrated that SLE patients may exhibit early-stage brain parenchymal atrophy and functional changes. These alterations may help explain the early non-specific symptoms, including anxiety and depression, seen in SLE patients with neuropsychiatric manifestations. Nevertheless, the mechanisms underlying neuropsychiatric involvement in SLE remain partially understood. Our findings demonstrate that SLE patients with no major neurological manifestations in the early stage and normal routine MRI results often experience mild or moderate anxiety and/or depression. Compared with HCs, brain morphological indicators such as GMV, CT, SD, and GI of these patients were significantly reduced. Our study further supplements the characteristics of more obvious brain microstructural damage in SLE-AD patients. These changes in brain microstructure show global and non-targeted characteristics. Some brain regions are negatively correlated with disease activity and have an impact on HAMD/HAMA scores, suggesting that changes in brain structure may precede obvious neuropsychiatric symptoms, providing potential imaging markers for early detection and providing clinically valuable clues for us to reveal the early pathological mechanisms of NPSLE.
Our previous research has shown that SLE patients have significantly reduced GMV and WMV at the whole-brain level, with alterations spanning the frontal, temporal, and occipital lobes in both hemispheres. These regions are involved in various neuropsychiatric functions, including emotion, memory, and cognition [16]. Su et al. [41] demonstrated that patients with NPSLE exhibited reduced GMV in the left superior temporal gyrus and experienced more severe functional impairment than non-NPSLE patients. In contrast, non-NPSLE patients exhibited no significant GMV reductions. The superior temporal gyrus has strong connections with the hippocampus, a key structure involved in social cognition and emotional regulation. A meta-analysis utilizing VBM revealed decreased GMV in the left middle temporal gyrus among patients with anxiety disorders without comorbid major depressive disorder [42]. Relative to HCs, both non-NPSLE and NPSLE patients exhibited reduced functional connectivity in the bilateral middle temporal gyrus, potentially contributing to impairments in language processing, memory, and social abilities in SLE patients [26]. Additionally, a study has reported that elevated spontaneous neural activity and coherence in the bilateral inferior temporal gyrus of non-NPSLE patients are strongly linked to emotional function [43]. Non-NPSLE patients exhibit chronic neuropathological changes suggestive of non-specific focal vasculopathy, whereas NPSLE patients with more distinct lesions, such as diffuse vasculopathy and microthrombi, which are associated with overt neuropsychiatric manifestations [44]. Among SLE patients lacking major neuropsychiatric symptoms, our study found a reduction in GMV in the left middle temporal gyrus in those with anxiety and/or depression. Building on these results, we hypothesize that multiple regions within the left temporal lobe, comprising the superior, middle, and inferior temporal gyrus, may be particularly vulnerable to pathological changes such as SLE-related inflammation or ischemia. These pathological changes may influence brain structure and function, potentially driving the development and progression of mood disorders like anxiety and depression.
The thalamus acts as a central hub in the brain, transmitting sensory signals between the subcortex and the cortex. Research indicates that individuals with major depression demonstrate a marked increase in hypothalamic activity during the resting state [45, 46]. Thalamic dysfunction in SLE patients exhibit robust clinical associations with the progression of neuropsychiatric manifestations [47]. Neuroimaging investigations by Nystedt’s group [27] have reported that thalamocortical network overconnectivity in non-NPSLE patients may function as a neuroadaptive response. We observed that among SLE patients without major neuropsychiatric manifestations, bilateral thalamic GMV was significantly reduced in those with anxiety and/or depression. This reduction may help explain functional changes in the thalamus, and damage to this area could be linked to psychiatric symptoms in SLE patients. Additionally, our study also revealed decreased in GMV in the left gyrus rectus. The gyrus rectus, located within the olfactory groove on the orbital surface of the frontal lobe, is involved in the regulation of higher cognitive functions. Damage to this region may be closely related to cognitive impairments observed in SLE patients.
The prefrontal cortex plays a vital role in complex cognitive operations, including memory, judgment, reasoning, and decision-making. In patients suffering from depression, the prefrontal cortex is frequently characterized by notable atrophy and functional impairment, which contribute to deficits in executive function and attention. Evidence indicates that individuals with SLE experience significant, asymmetrical reductions in perfusion across the frontal, temporal, parietal, and occipital lobes, with a pronounced decline in the frontal lobe of those in the NPSLE subgroup [48]. Furthermore, SLE patients with comorbid anxiety and depression exhibit altered blood flow and connectivity in the limbic and prefrontal regions [13, 28]. When compared to HCs, the NPSLE group shows significantly diminished cerebral blood flow and volume in both the dorsolateral and ventromedial prefrontal cortices. Additionally, anxiety symptoms correlate with diminished blood flow in the striatum [49]. Another key finding reveals that SLE patients with depressive symptoms have decreased serum levels of brain-derived neurotrophic factor (BDNF) in the hippocampus and prefrontal cortex, a change that impairs neuroplasticity and is linked to the pathogenesis of neuropsychiatric disorders [14]. Ren et al. [50] found that in non-NPSLE patients, increased activity in the frontal lobe may act as a compensatory mechanism for dysfunction in the cortico-basal ganglia-thalamocortical circuits, helping to sustain cognitive function despite impairments. Quantitative analyses revealed significant CT thinning in multiple prefrontal areas, encompassing the superior frontal gyrus on both hemispheres, as well as the middle frontal sulcus, middle frontal gyrus, and sub-frontal sulcus. Additionally, reduced GI was observed specifically in the left superior frontal gyrus among SLE-AD patients. These regions are predominantly localized within the prefrontal lobe. Based on these findings, we hypothesize that among SLE patients lacking significant neuropsychiatric manifestations, the prefrontal cortex undergoes early microstructural alterations, accompanied by functional decline. Notably, the prefrontal cortex appears to preserve cognitive functioning via neuroplastic compensatory while these neuroadaptive changes might also drive the onset of neuropsychiatric symptoms in SLE.
The limbic system comprises the limbic lobe and associated subcortical structures, including the amygdala and thalamus. The limbic lobe encompasses key areas like the cingulate gyrus, hippocampus, and insula, which are crucial for functions related to motivation, emotion, and memory. Accumulating evidence suggests that dysfunctions in frontostriatal regions and anterior cingulate gyrus are causally related to depression [51, 52]. However, a study indicates that chronic depression may lead to or worsen neuropathological changes in the frontostriatal and limbic regions [53]. A meta-analysis using VBM revealed that patients with anxiety disorders exhibit a reduction in GMV in the anterior cingulate gyrus and prefrontal cortex [42]. Furthermore, anxiety symptoms were linked to diminished perfusion in the frontostriatal and right anterior cingulate gyrus [49]. In SLE patients experiencing severe anxiety and depressive symptoms, alterations in perfusion dynamics and functional connectivity were observed in the limbic and prefrontal regions [13]. The anterior cingulate gyrus, closely connected to the limbic system, also interfaces with the prefrontal region, playing a crucial role in the integration of neural circuits involved in emotion regulation [54]. A study has indicated that hypoperfusion in specific limbic and frontostriatal areas of NPSLE patients is directly associated with the onset of anxiety symptoms [49]. Additionally, heightened connectivity between the anterior cingulate gyrus and amygdala contributes to early-adulthood anxiety and depression [55]. The amygdala, a central hub for emotional processing, regulates responses such as fear, anger, and pleasure. Research by Robinson et al. [12] has demonstrated that the insula is directly involved in the pathogenesis of depression and anxiety. Prolonged psychological stress can cause systemic inflammation, damaging emotional processing centers such as the amygdala, which in turn leads to blood-brain barrier dysfunction and increased permeability [12]. Increased permeability of the blood-brain barrier in the right insula of SLE patients is correlated with anxiety and depression symptoms [10]. Additionally, research indicates that these patients might display dysfunction in the posterior cingulate gyrus, which is associated with the severity of psychiatric symptoms [47]. Our investigation revealed a marked reduction in CT within the marginal branches and the middle-posterior regions of the cingulate gyrus/sulcus across both hemispheres among SLE-AD patients. Furthermore, the SD within the superior region of the right insula circular sulcus exhibited pronounced reductions. These regions are primarily located within the limbic system. Importantly, none of the SLE patients in our study had a prior history of mental illness before their diagnosis. Based on these findings, we posit that early microstructural modifications localized to the cingulate gyrus and right insula regions—critical components of the limbic network—may drive the manifestation of affective symptoms in SLE populations [10]. However, future longitudinal studies are required to further investigate the causal relationship between these changes and psychiatric symptoms, as well as their underlying neurophysiological mechanisms.
The postcentral gyrus, a primary region of the somatosensory cortex, participates in emotional processing and regulation, playing a key role in maintaining emotional equilibrium. Damage to the postcentral gyrus can disrupt emotional regulation, potentially increasing the susceptibility to anxiety and depression [56]. Existing neuroimaging evidence demonstrates that somatosensory cortex pathology, characterized by GMV reduction, cortical thinning, disrupted functional connectivity networks, and abnormal metabolic activity, significantly correlates with distinct phases of emotional processing [57]. A study has suggested that decreased functional connectivity in the postcentral gyrus of SLE patients correlates with an increased vulnerability to mood disorders [26]. Furthermore, reductions in spontaneous neural activity and coherence in the postcentral gyrus have been linked to a decline in motor function in non-NPSLE patients [43]. Our study observed a notable decrease in CT within the right postcentral gyrus, postcentral sulcus, and other related regions in SLE-AD patients. Additionally, the SD of the right central sulcus was reduced. These regions are primarily located within the somatosensory cortex of the parietal lobe. Based on these findings, we propose that somatosensory cortex degeneration may occur in early-stage SLE patients, even in the absence of significant neuropsychiatric symptoms. Such degeneration could be closely linked to the emergence of anxiety and depressive symptoms.
The occipital lobe is essential for interpreting visual information within the brain. Research has revealed that individuals with SLE frequently exhibit deficits in visual attention, reasoning, and memory, accompanied by changes in functional connectivity within the middle occipital gyrus and cuneus. Moreover, functional changes in the occipital regions have been associated with anxiety severity, indicating a potential connection between visual cognitive deficits and the onset of NPSLE [26]. Our study further supports this idea, showing significantly reduced CT in regions such as the left superior occipital gyrus, parieto-occipital sulcus, cuneus, intraparietal sulcus and transverse parietal sulci in SLE-AD patients. These findings imply that early visual processing dysfunctions may manifest alongside structural brain changes, potentially serving as early indicators of psychiatric symptoms in these patients. The fusiform gyrus, integral to the brain’s visual recognition network, is involved in processing emotional faces, characters, visual attention, and learning. A study has demonstrated that individuals with non-NPSLE exhibit thinning of the fusiform and lingual gyri, alongside disrupted functional connectivity during rest, suggesting that cortical abnormalities may impair brain connectivity in these patients [58]. Similarly, Mak et al. [59] reported reduced fusiform gyrus activity in non-NPSLE individuals, which aligns with our findings. Additionally, we identified an inverse relationship between fusiform gyrus function and HAMD scores [60]. Consistent with these findings, our results suggest that SLE-AD patients show reduced CT in the left fusiform gyrus. These structural alterations may be closely linked to mood disorders and could act as early indicators of psychiatric symptoms in SLE. The fusiform gyrus alterations suggest a potential role of visual processing deficits in mood disturbances.
During the early stages of SLE, patients engage compensatory processes to preserve cerebral function. However, as the disease progresses, structural brain changes and functional decline emerge, leading to cognitive impairment and neurological symptoms [27, 61]. Research by Rocca et al. [61] and Fitzgibbon et al. [62] revealed that patients with NPSLE exhibit increased activation in brain regions associated with sensory-motor functions as the frontal lobe, parietal lobe, and middle occipital gyrus-when performing tasks, compared to healthy controls. This heightened activation may reflect the recruitment of alternative cortical pathways to compensate for damage to the primary neural pathways, and it is closely correlated with the extent of brain damage [61, 62]. Furthermore, SLE patients with a shorter disease duration exhibited higher cortical activation than those with a longer duration, suggesting that functional compensation occurs early on, whereas prolonged disease can exacerbate neural damage and reduce cortical activation [63]. Collectively, these findings underscore the close relationship between early brain function changes and structural brain damage in NPSLE. Our study revealed that SLE patients without major neuropsychiatric symptoms but with anxiety and/or depression exhibited early alterations in cortical thickness and complexity, particularly in the frontal lobe, limbic system, parietal lobe, and occipital lobe. This is consistent with our previous findings of reduced GMV in these brain areas [16]. Non-SLE patients with depression and anxiety disorders exhibit structural and functional disruptions primarily within the orbitofrontal-limbic-striatal system [51, 52, 64]. In contrast, SLE-AD patients demonstrate more diffuse and widespread structural changes rather than focal damage confined to specific brain regions. This pattern likely reflects the systemic nature of SLE, which induces extensive brain damage through specific pathological processes, such as complement deposition and diffuse vascular lesions [44]. These non-region-specific alterations likely reflect the systemic inflammatory and autoimmune processes inherent to SLE, rather than being solely attributed to mood disorders [2]. However, additional prospective cohort studies are essential for enhancing stratification and elucidate key pathological mechanisms and early biomarkers.
Previous studies have consistently shown that gray matter atrophy in NPSLE patients is inversely related to disease activity, suggesting that its pattern and severity may serve as crucial indicators of disease burden [16, 65]. We further identified an inverse relationship between disease activity and GMV in the left middle temporal gyrus, along with CT in the left fusiform gyrus, the right middle frontal sulcus, and the right middle frontal gyrus. These findings suggest that early disease activity in individuals with SLE, especially among those exhibiting anxiety and/or depression, could drive alterations in cerebral microstructure. Nevertheless, further longitudinal investigations are necessary to elucidate the causal links between these neuroanatomical changes and SLE disease progression. Unlike previous studies, no significant associations were observed between these brain structural changes and clinical indices such as HAMA, HAMD, MMSE scores, and disease duration, we speculate that the relatively mild disease in the selected patient group may have contributed to the absence of these associations. This suggests a potential subclinical phase of neuropsychiatric involvement, where brain structural changes precede clinical manifestations, rather than resulting solely from them.
Our results showed that changes in CT and reduction in GI of the left hemisphere clusters could affect the HAMD/HAMA scores, and reduction in SD of the right hemisphere cluster was an influencing factor of the HAMA score. Specifically, CT, GI, and SD can detect alterations in the cerebral cortical architecture and may serve as early imaging diagnostic markers for SLE-related mood disorders. These observed structural alterations—in areas including the frontal lobe, insula, central sulcus and occipital lobe—corroborate earlier research that associates dysfunction in brain regions, notably the frontal lobe, insula, and somatosensory cortex, with mood disorders in SLE patients [13, 28, 42, 48, 57]. In the future, it is necessary to combine longitudinal imaging and functional analysis to further clarify the clinical significance of these findings.
Although our study offers significant contributions, it remains essential to recognize its limitations. First, as a cross-sectional, single-center study, the sample selection may introduce bias, and the limited sample size prevented us from conducting subgroup analyses. Second, while we controlled for factors that could influence the onset of anxiety and depression, such as age, education, disease activity, and cognitive function, we could not fully account for the potential effects of treatment regimens, particularly glucocorticoids, on anxiety and depression [66, 67]. Furthermore, we implemented the false discovery rate (FDR) correction to assess regional brain differences; however, no significant regions persisted after adjustment. This may be due to the relatively broad criteria we used to define SLE-AD patients, as all participants had no major neuropsychiatric manifestations and normal routine MRI findings. Therefore, future studies with larger cohorts and stricter classification standards, particularly those focusing on NPSLE patients, are essential. Furthermore, given that SLE is a chronic condition, it is crucial to acknowledge that the lifelong social and psychological burdens on women might precipitate or worsen anxiety and depression.
This study integrated volumetric brain imaging techniques, specifically VBM and
SBM, to demonstrate that female SLE patients, exhibiting no significant
neuropsychiatric symptoms in the early stages and normal MRI results, may
experience widespread, non-region-specific morphological and structural
alterations in the brain. This is particularly true for those who also experience
anxiety and/or depression. We speculate that these alterations may contribute to
the diversity and non-specificity of the clinical symptoms of NPSLE. Furthermore,
there is a specific association that exists between structural alterations in
certain brain regions and disease activity, which are factors affecting the
HAMD/HAMA scores. Therefore, we recommend that all SLE patients undergo
evaluation using these scales as early as possible. Patients with HAMD/HAMA
scores
We collected high-resolution MRI scans of participants’ heads. As the raw data could potentially be used to reconstruct facial features, releasing them may compromise participants’ personal privacy. Therefore, the datasets generated and analyzed during the current study are not publicly available but can be obtained from the corresponding author upon reasonable request.
ZCL and YFY contributed equally to this study and should be considered as co-first authors. ZCL performed the research and wrote the original draft of the manuscript. YFY participated in the study design and analyzed the data. SLiu was responsible for the recruitment of participants and the collection of raw data. GFZ and RB recruited and managed clinical data. SLi and RTZ were responsible for the collection of clinical data and the evaluation of the scale. JX and YQC designed the study and provided funding support. All authors contributed to editorial changes in the manuscript. All authors read and approved the final manuscript. All authors have participated sufficiently in the work and agreed to be accountable for all aspects of the work.
The study was conducted in accordance with ethical guidelines, and ethical approval was obtained from the Ethics Committee of the First Affiliated Hospital of Kunming Medical University with the approval number (2022) Ethics L No. 225. The study was carried out in accordance with the guidelines of the Declaration of Helsinki. All subjects and/or their legal guardians were informed of the purpose and content of the study in detail before enrollment.
We are very grateful to all the volunteers who participated in this study.
This work was supported by grants from the National Natural Science Foundation of China (32270947, 81760296, 82060259), Yunnan Province High-level health technical talents (leading talents) (L-2019004 and L-2019011), Yunnan Province Special Project for Famous Medical Talents of the “Ten Thousand Talents Program” (YNWRMY-2018-040 and YNWR-MY-2018-041), the Funding of Yunnan Provincial Health Science and Technology Plan (2017NS051 and 2018NS0133), the Funding of Ministry of Science and Technology of Yunnan Province (2018ZF016), Yunnan Province Clinical Research Center for Skin Immune Diseases (2019ZF012), and Yunnan Province Clinical Center for Skin Immune Diseases (ZX2019-03-02), and Doctoral Research Fund Project of the First Affiliated Hospital of Kunming Medical University (newly appointed doctoral research specialty) (2023BS018), 535 Talent Project of First Affiliated Hospital of Kunming Medical University (2022535Q01), and The Youth Talent of Ten Thousand Scientists Program of Yunnan Province (YNWR-QNBJ-2018-152), Beijing Bethune Charitable Foundation (PAYJ-043).
The authors declare no conflict of interest.
References
Publisher’s Note: IMR Press stays neutral with regard to jurisdictional claims in published maps and institutional affiliations.