


 , Maja Machcińska 1,3, Marta Maruszewska-Cheruiyot 1,3, Ludmiła Szewczak 1,2, Anna Karlińska 4, Rafał Rola 4, Michael Stear 5, Katarzyna Donskow-Łysoniewska 1,3,*
1 Laboratory of Parasitology, General Karol Kaczkowski Military Institute of Hygiene and Epidemiology, 01-163 Warsaw, Poland
2 Department of Histology and Embryology, Medical University of Warsaw, 02-004 Warsaw, Poland
3 Department of Experimental Immunotherapy, Faculty of Medicine, Lazarski University, 02-662 Warsaw, Poland
4 Department of Neurology, Military Institute of Aviation Medicine, 01-755 Warsaw, Poland
5 Department of Animal, Plant and Soil Sciences, AgriBio, La Trobe University, Bundoora, VIC 3086, Australia
Abstract
Peripheral immune cells participate in the pathogenesis and progression of central nervous system diseases including relapsing-remitting multiple sclerosis (RRMS), which is an immune-mediated demyelinating disorder. The association between IL-6 and RRMS pathogenesis is clear but there is some uncertainty about the role of IL-6 and IL-6 pathway components in blood and the molecular mechanisms through which T regulatorys (Tregs) contribute to MS pathogenesis. The purpose of this study was to identify markers of IL-6 pathways in serum and regulatory CD8+ and CD4+ T cells in the blood of RRMS patients and to analyze their associations with multiple sclerosis, with each other, and with age.
Peripheral blood was collected from female RRMS patients (16), and healthy controls (18) recruited between December, 2019 and July, 2022. The serum levels of IL-6, TGF-β1, IL-6Rα, IL-6/IL-6Rα complex, and soluble glycoprotein-130 (sgp-130) were measured by ELISA. Flow cytometry was used to quantify the surface expression of IL-6R (CD126), membrane glycoprotein 130 (gp130, CD130), and phospho-STAT3 (pSTAT3) and pSTAT5 in CD4+CD25+FoxP3+, CD8+CD25+FoxP3+, and CD8+CD122+ Tregs. Differences were compared using the Student’s t-test or Welch’s t-test. Pearson product-moment correlations were used to detect correlations. A p-value ≤ 0.05 was considered statistically significant.
The CD8+CD122+ Treg subset in RRMS patients exhibited an increased level of surface CD126 and CD130 associated with classical IL-6R signaling without STAT3 phosphorylation. For CD4+CD25+FoxP3+ and CD8+CD25+FoxP3+ Tregs, no changes in classical IL-6R surface markers were observed in RRMS, but there was an increased percentage of pSTAT3 in these cells. Age-related changes in pSTAT5 expression across Treg subsets in healthy controls were absent in RRMS patients.
Our findings underscore the complex interplay between IL-6 signaling and Tregs as well as age-related immune regulation. The observed alterations in the expression of receptors and in signaling activity may contribute to the dysregulation of CD8+CD122+ Treg function activated via the classic IL-6 pathway and suggests IL-6 trans-signaling in CD25-positive Tregs. RRMS may interfere with normal immune aging patterns, possibly by promoting a sustained inflammatory state that overrides the senescence of Tregs.
Keywords
- multiple sclerosis pathogenesis
- blood
- IL-6
- IL-6 signaling
- CD4 Tregs
- CD8 Tregs
The central nervous system (CNS) is strongly connected to the peripheral immune system. A robust inflammatory response in the peripheral system can result in the infiltration of immune cells into the CNS [1]. Immune cells can migrate in and out of the CNS as a consequence of the increased permeability of the blood brain barrier (BBB), amplifying inflammatory processes in CNS and in the periphery. Therefore, peripheral immune cells may participate in the pathogenesis and progression of CNS diseases. Multiple sclerosis (MS) is a heterogeneous and complex autoimmune disease that is characterized by inflammation, demyelination, and axon degeneration in the CNS. The relevance of pro-inflammatory signaling in the pathogenesis of MS has been highlighted [2].
IL-6 is a key pro-inflammatory cytokine which is involved in autoimmunity. An alteration in IL-6 responsiveness is associated with the activation of T regulatory (Treg) populations [3]. IL-6 action is regulated by the expression of its receptor, both on the cell surface and in its soluble form, which, unlike the soluble receptors for other cytokines, tends to stabilize and strengthen the effect of IL-6.
Classical IL-6R signaling is the binding of IL-6 to the membrane-bound a-receptor (IL-6R, CD126). Binding is followed by dimerization of the signal-transducing b-receptor glycoprotein 130 (gp130) (CD130), which is ubiquitously expressed. Cells that do not express IL-6R obtain their IL-6 signals via trans-signaling. Enzymatic cleavage of the membrane receptor creates the soluble form of IL-6R (sIL-6R). Alternatively, the soluble form is produced by alternative splicing of the IL-6 receptor alpha transcript. IL-6/sIL-6R forms a signaling complex with gp130 on the cell surface. Further signaling through gp130 is mainly carried out by the Janus-kinase/signal transducer and activator of transcription (JAK/STAT). In contrast to classic signaling which is anti-inflammatory, trans-signaling is responsible for the pro-inflammatory effects of IL-6 [4] and the inhibited activity of Treg subpopulations. Activation of trans-signaling is tightly controlled at multiple levels. One of the natural inhibitors in human blood is the soluble form of gp130 (sgp-130). Sgp-130 inhibits IL-6 trans-signaling, whereas IL-6 classic signaling is largely unaffected [5].
The association between IL-6 and Relapsing-remitting multiple sclerosis (RRMS) pathogenesis is clear but there is some uncertainty about the role of IL-6 and IL-6 pathway components in blood. Specifically, whether the concentration of IL-6 in serum differs in patients with MS and whether this difference influences disease pathogenesis [6].
Recent studies have demonstrated phenotypic and functional changes in subpopulations of CD8+ Tregs in several CNS diseases including MS [7]. CD8+ T cells are age dependent and there is an exponential increase in the number of transcriptionally senescent CD8+ T cells. However, the role of aging in inducing changes in CD8+ Treg cells in MS is not well understood. In particular, how CD8+ T lymphocytes influence MS pathogenesis is unclear.
Here, we defined markers for IL-6 pathways in serum and regulatory CD8+ and CD4+ T cells in the blood of newly diagnosed RRMS females and analysed the associations among them and with age.
Peripheral venous blood was obtained from 16 RRMS females aged 19 to 48 years
(mean age 36 years, SD
Females with the first attack of MS made up the RRMS patient group. All patients
met the 2017 Revised McDonald Criteria for a diagnosis of MS [8]. The clinical
disability was evaluated at the time of enrollment with the Kurtzke Expanded
Disability Status Scale (EDSS) [9]. All patients were in remission and were
categorized as no disability (1–1.5 EDSS) to minimal disability (2–2.5 EDSS)
(mean EDSS 1.7, SD
Blood samples were collected by antecubital venipuncture between 7:30 AM and
9:30 AM. The tubes were then centrifuged at 3000 rpm for 15 min and then at 6000
rpm for 15 min before storage at –70 °C before analysis. The serum
levels of IL-6, TGF-
Density gradient centrifugation was used to isolate PBMC from RRMS patients and
healthy donors (HC) [10, 11]. The viability and total number of PBMC were
assessed with the Muse Count and Viability Kit (MCH100102, Merck-Millipore,
Billerica, MA, USA) followed by a Muse Cell Analyzer
(0500-3115B, Merck-Millipore), following the
instructions of the manufacturer. The viability of isolated PBMCs was
Treg cells were characterized by flow cytometry according to a previously described protocol [10]. There were two separate flow cytometry panels for immunophenotyping with surface expression of CD126 and CD130 and pSTAT3/pSTAT5 phosphorylation. Fixable Viability Dye (FVD) eFluor 455UV (65-0868-18, eBioscience, San Diego, CA, USA) was used to exclude dead cells.
The following fluorochrome-conjugated monoclonal antibodies were used following the manufacturers’ instructions: CD3-eFluor506 (clone UCHT1; eBioscience), CD4-BUV496 (clone SK3; BD Biosciences), CD8-APC-eFluor780 (clone RPA-T8; eBioscience), CD122-PerCP-eFluor710 (clone TU27; eBioscience), CD25-BV650 (clone M-A251; BD Biosciences), CD14-AF700 (clone: 61D3; eBioscience), CD16-AF700 (clone: eBioCB16; eBioscience), CD19-AF700 (clone: Hib19; eBioscience), CD126 (IL-6R)-PE (clone M5; BD Biosciences) and CD130 (gp130)-BV421 (clone AM64; BD Biosciences). Intracellular analysis of FoxP3-APC (clone: PCH101; eBioscience) was carried out after fixation and permeabilization, with a FoxP3/Transcription Factor Staining Buffer Set (00-5523-00, eBioscience) following the manufacturer’s recommended procedures.
To analyze phosphorylation of STAT3 (pSTAT3) and STAT5 (pSTAT5), PBMC were stimulated with 100 ng/ml recombinant human IL-6 (200-06, PeproTech EC, Cranbury, NJ, USA) or IL-2 (200-02, PeproTech EC) respectively or left unstimulated for 15 min at 37 °C in a water bath. Simultaneously, for T cell immunophenotyping, cells were stained with antibodies against CD3, CD4, CD8 and FVD. After washing, cells were processed using the Transcription Factor Phospho Buffer Set (563239, BD Pharmingen; BD Biosciences). First, cells were fixed and permeabilized, followed by treatment with buffer containing methanol, to enable staining of phosphorylated protein epitopes. Following two washes, cells were stained with antibodies against both surface markers: CD25, CD122 and intracellular targets: FoxP3 and phosphorylated proteins: STAT3-PE (clone 4/P-STAT3; BD Biosciences) and STAT5-Alexa Fluor 488 (clone 47/Stat5 (pY694); BD Biosciences). After incubation, cells were washed twice.
All data were obtained on a 5-laser, 19-color CytoFLEX LX (Beckman Coulter, Brea, CA, USA) which was calibrated daily using CytoFLEX Daily QC Fluorospheres (Beckman Coulter). Compensation settings were obtained with single-stained cells or the VersaComp Antibody Capture Bead Kit (B22804, Beckman Coulter). Positive staining and the gating strategy were decided by comparison with an unstained control, a fluorescence minus one (FMO) control or an unstimulated control. Gating of the lymphocytes was determined with morphological parameters in a forward vs. side scatter (FSC-A/SSC-A) plot. Cell aggregates were detected with a sequential gating strategy with forward scatter (FSC) and side scatter (SSC) parameters and discarded from the analysis. Data were analysed with Kaluza Analysis Software version 2.1 (Beckman Coulter). The results are presented as the percentage of positively labelled cells, and the mean fluorescence intensity (MFI) was calculated by CytoFLEX LX. Results are expressed as the percentage of pSTAT3 or STAT5A (pSTAT5A). The gating strategy is presented in Fig. 1.
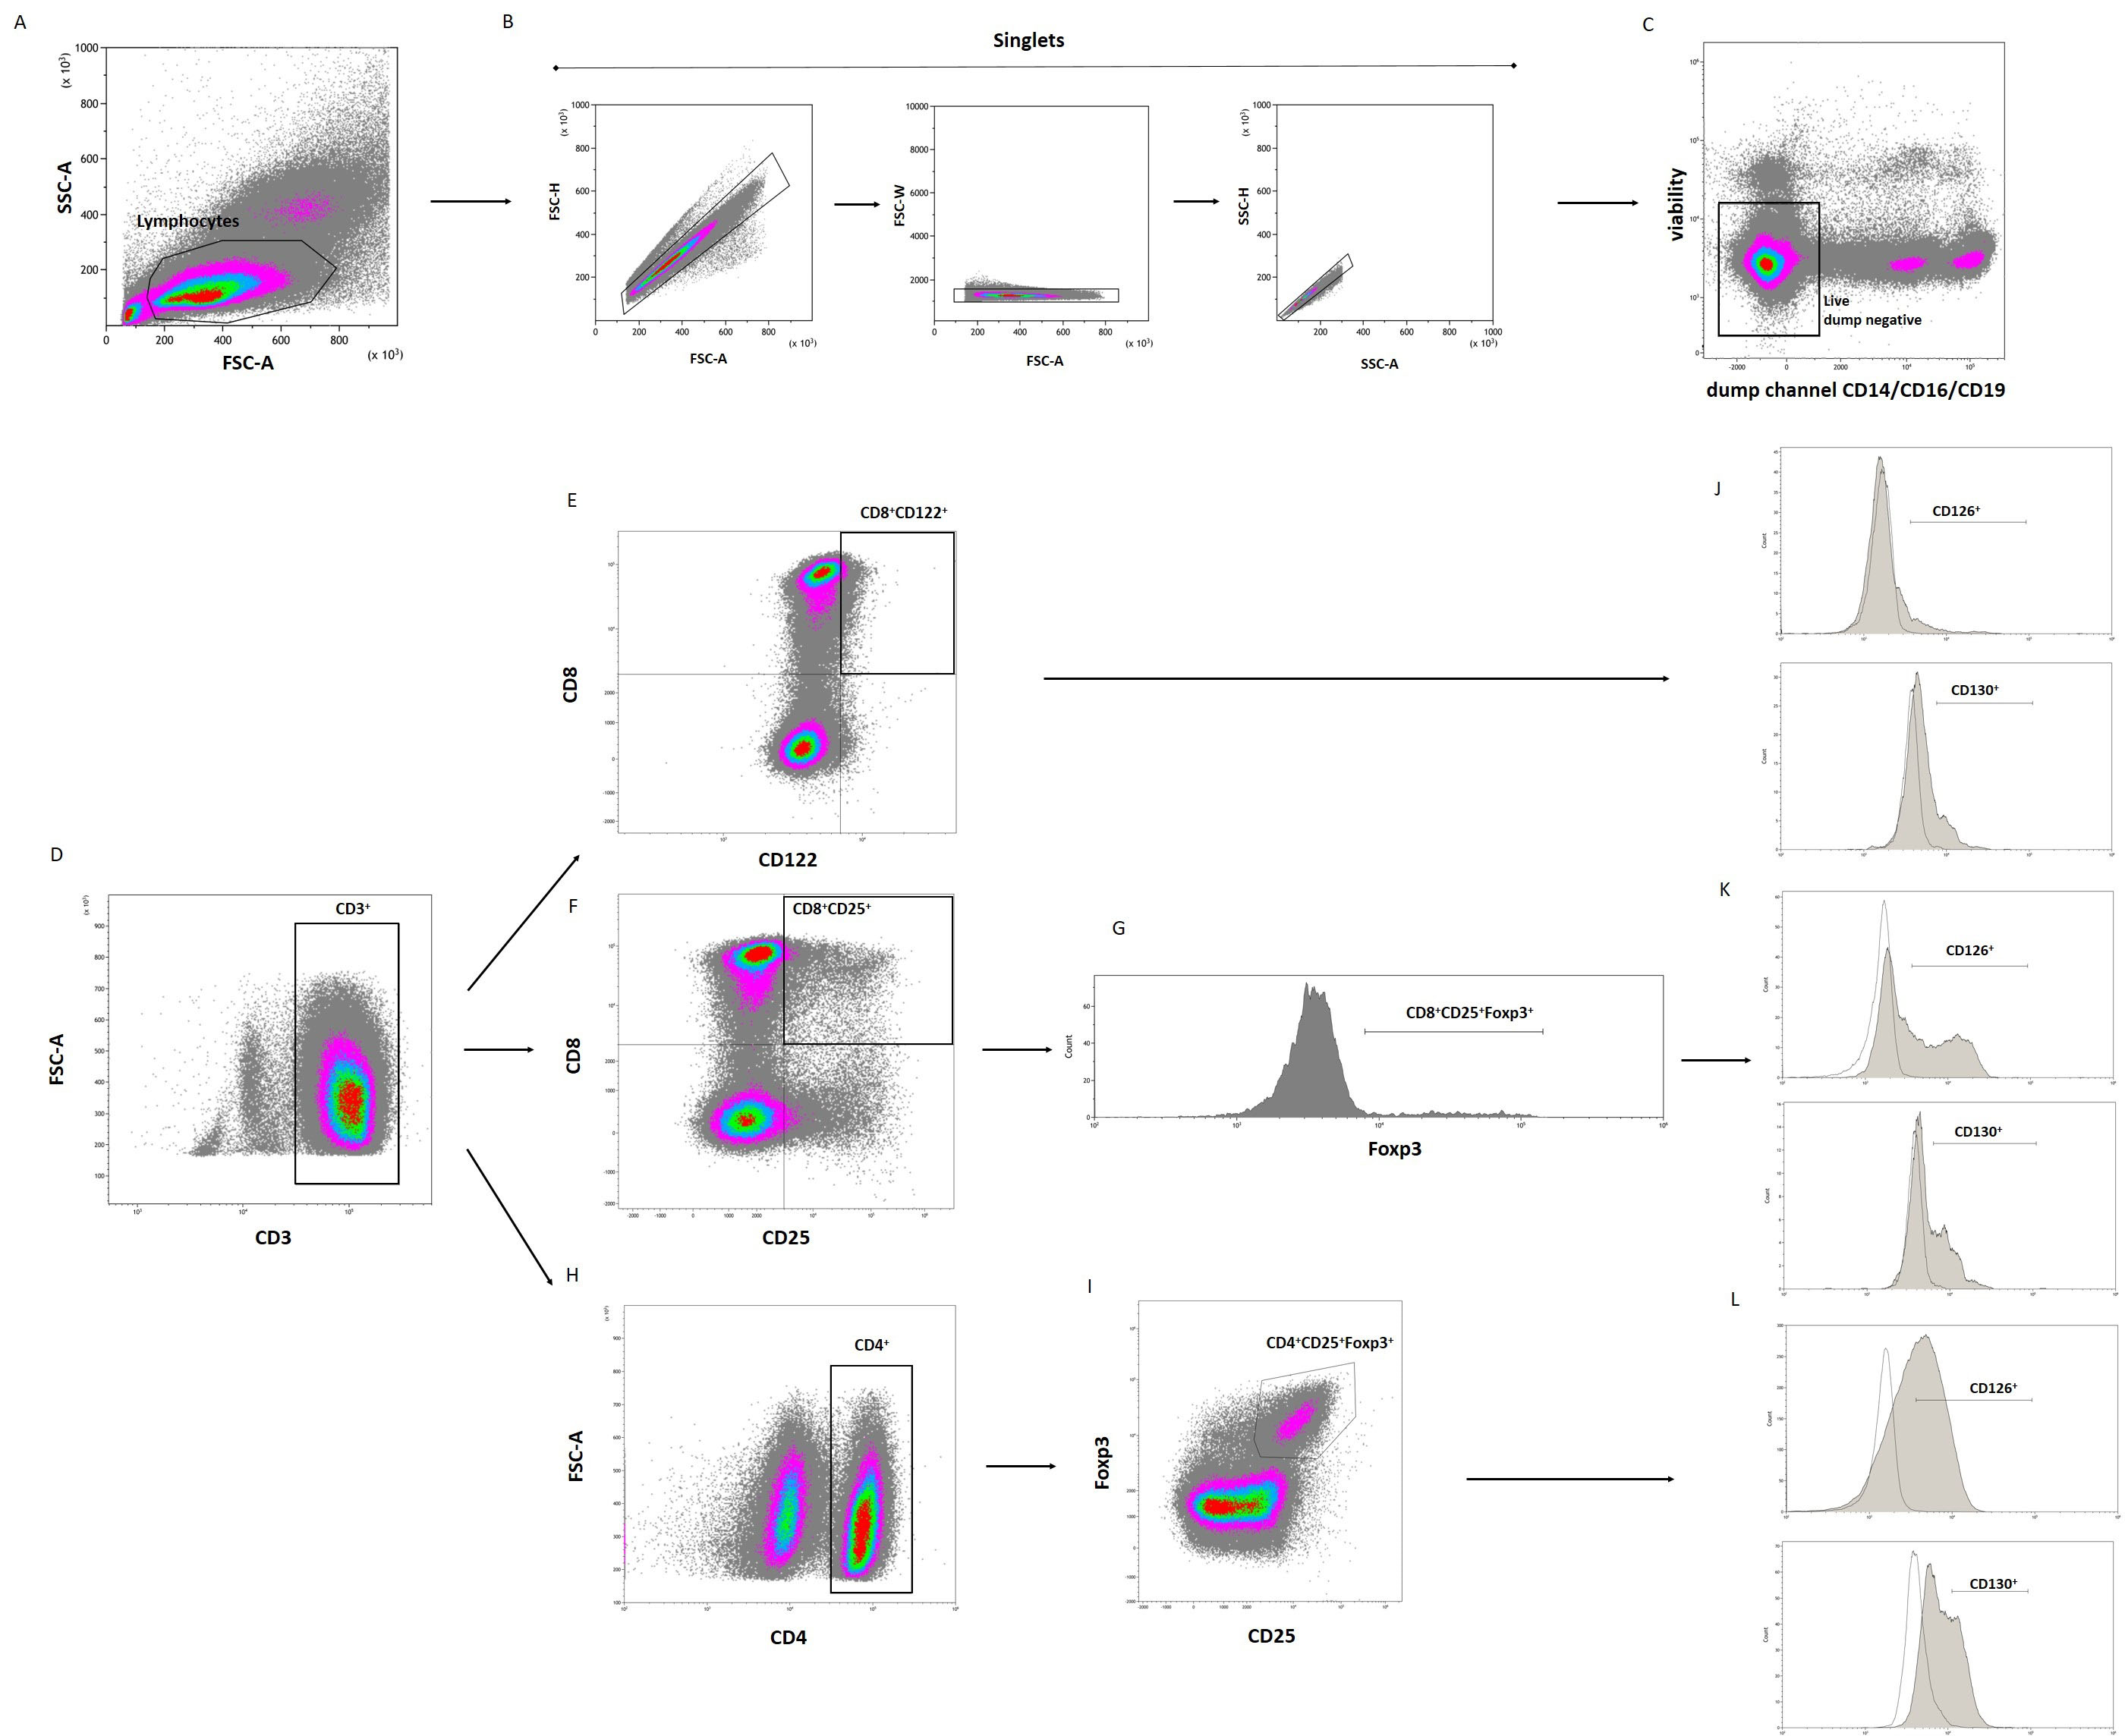 Fig. 1.
The gating strategy used in flow cytometry of the lymphocyte population to identify CD8+CD122+, CD8+CD25+FoxP3+ and CD4+CD25+FoxP3+ Tregs with CD126 and CD130 expression. Initially, a time gate was used to exclude electronic noise and artifacts (not shown here). Next, lymphocytes, determined by size and granularity, were gated in a forward scatter area (FSC-A) versus side scatter area (SSC-A) plot (A). Then, doublet cells were excluded using FSC-A/FSC-height (FSC-H), FSC-A/FSC-width (FSC-W) and SSC-A/SSC-height (SSC-H) parameters (B). Subsequently, cells that expressed monocyte (CD14), NK cell (CD16) and B cell lineage (CD19) markers were excluded (“dump channel”, dump negative gate) (C), followed by expression of CD3 (D). Tregs were identified as CD8+CD122+ (E), CD8+CD25+FoxP3+ (F,G), and CD4+CD25+FoxP3+ (H,I) cells. Expression of CD126 and CD130 were analyzed on the gated Treg populations (J–L). The unfilled histograms show the fluorescence minus one (FMO) control. Representative plots are presented. Treg, T regulatory.
The purpose of the study was to compare the concentrations of IL-6 and related molecules in the blood of patients with MS and healthy controls. All patients were female to avoid confounding between differences due to disease and potential differences due to gender.
The method used to compare means between healthy controls and patients with MS
depended on whether the variables in the two groups were normally distributed. If
not, the Wilcoxon Rank-Sum Test was used. If yes, Fisher’s F-test was used to
check whether the variances in both groups were equal. If the analysis indicated
that the variances between the groups were not significantly different, Student’s
two-sample t-test was used. If the variances were not equal, the
significance of the differences in the mean values was tested using Welch’s
t-test. Pearson product-moment correlations were used. Statistical
analysis was performed in R (version version 4.3.1, R Foundation for Statistical
Computing, Vienna, Austria. For all tests, p
The mean concentration of free IL-6 in HC was 4.4 pg/mL; range 1–12.1 pg/mL. In RRMS patients, mean IL-6 levels were 191 pg/mL; range 1.6–683 pg/mL. Although large, the differences were not statistically significant.
TGF-
The mean IL-6R
The quantity of IL-6/IL-6R
The mean concentration of sgp-130 was 310 ng/mL in the serum of HC (range 143.5–400 ng/mL). The mean concentration in RRMS was noticeably higher (p = 0.02): mean 432.8 ng/mL (range 267.6–741.7 ng/mL; Fig. 2).
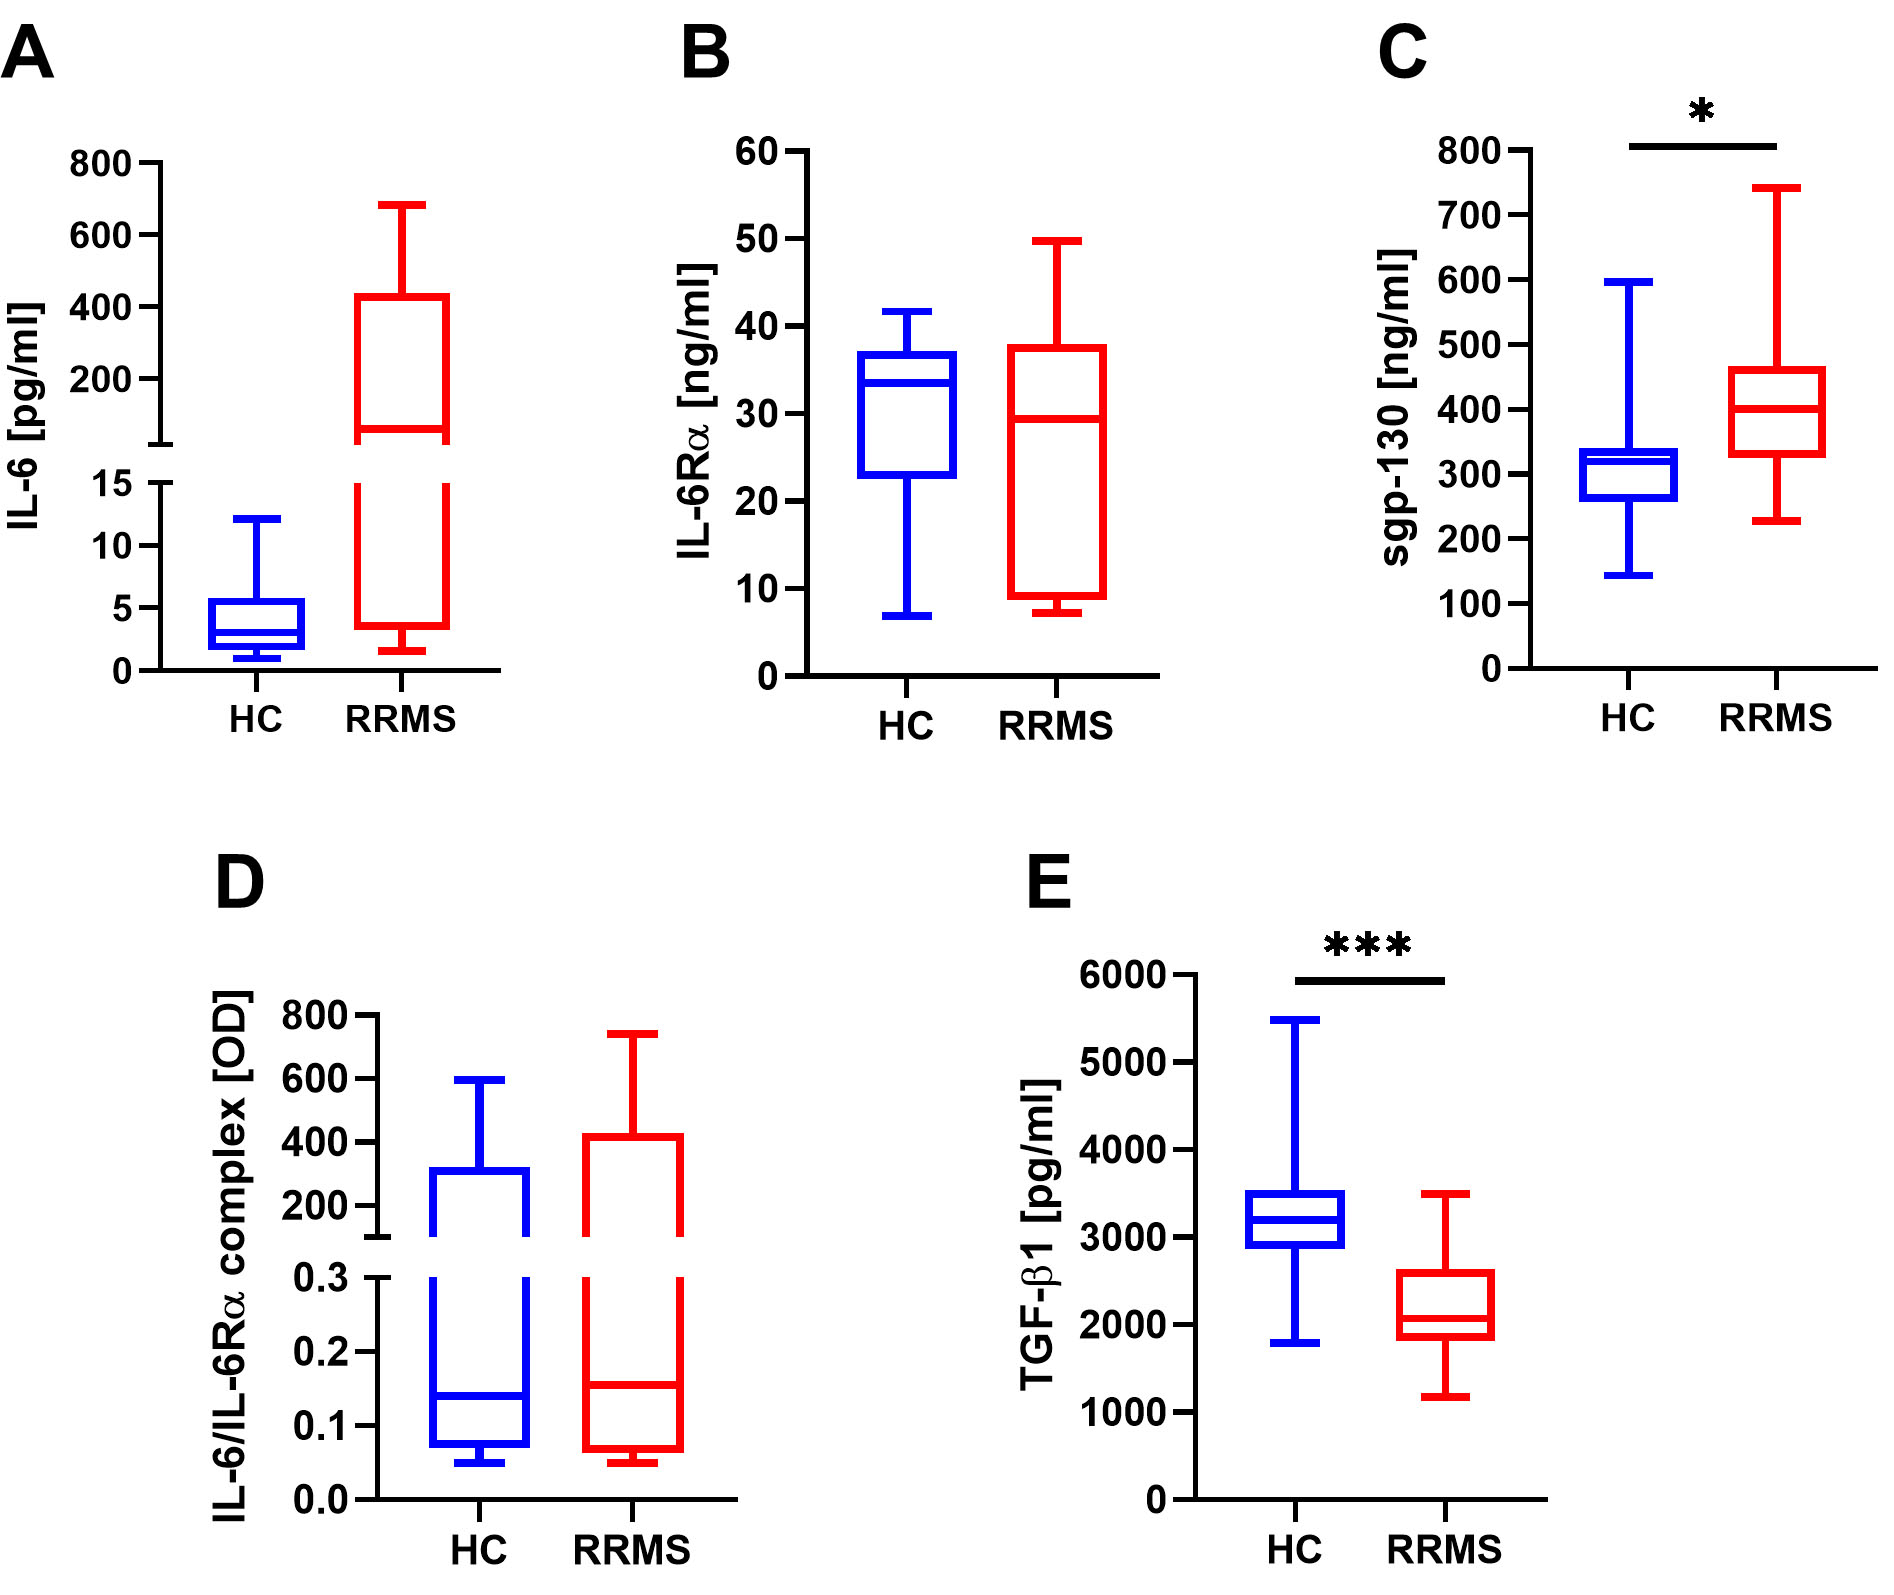 Fig. 2.
Serum concentrations of free IL-6 (A), IL-6R
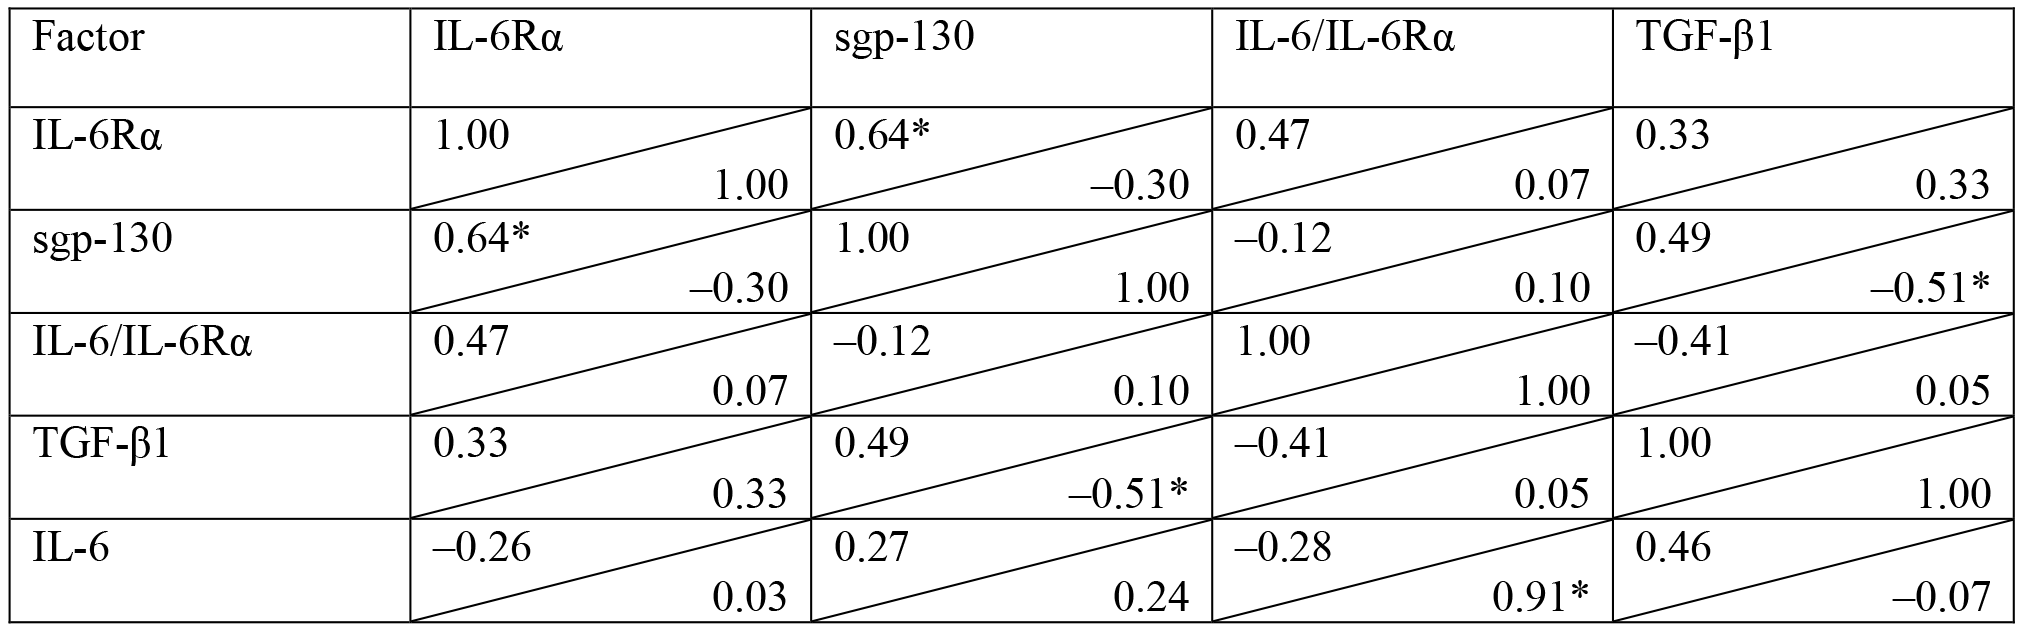
In HC, the concentration of free serum IL-6 showed a positive correlation with
the concentration of IL-6/IL-6R
|
| Pearson’s product-moment correlation was calculated, *p |
The expression of both CD126 and CD130 receptors was detected on CD4+ T cells including CD4+CD25+FoxP3+ T cells and CD8+ T cells including CD8+CD122+ and CD8+CD25+FoxP3+ T cells. Similar patterns of CD126 and CD130 expression were observed among the CD4+CD25+FoxP3+ and CD8+CD25+FoxP3+ T cell subsets in HC and RRMS patients. However, different patterns of CD126 and CD130 expression on CD8+CD122+ T cells were observed (Fig. 3). The frequency of CD126-positive CD8+CD122+ T cells was significantly higher in RRMS patients compared to HC (p = 0.04). There were no significant differences in the percentage of CD130-positive CD8+CD122+ T cells; In contrast, the expression (MFI—mean fluorescence intensity) of gp130 was significantly higher in RRMS patients (p = 0.02).
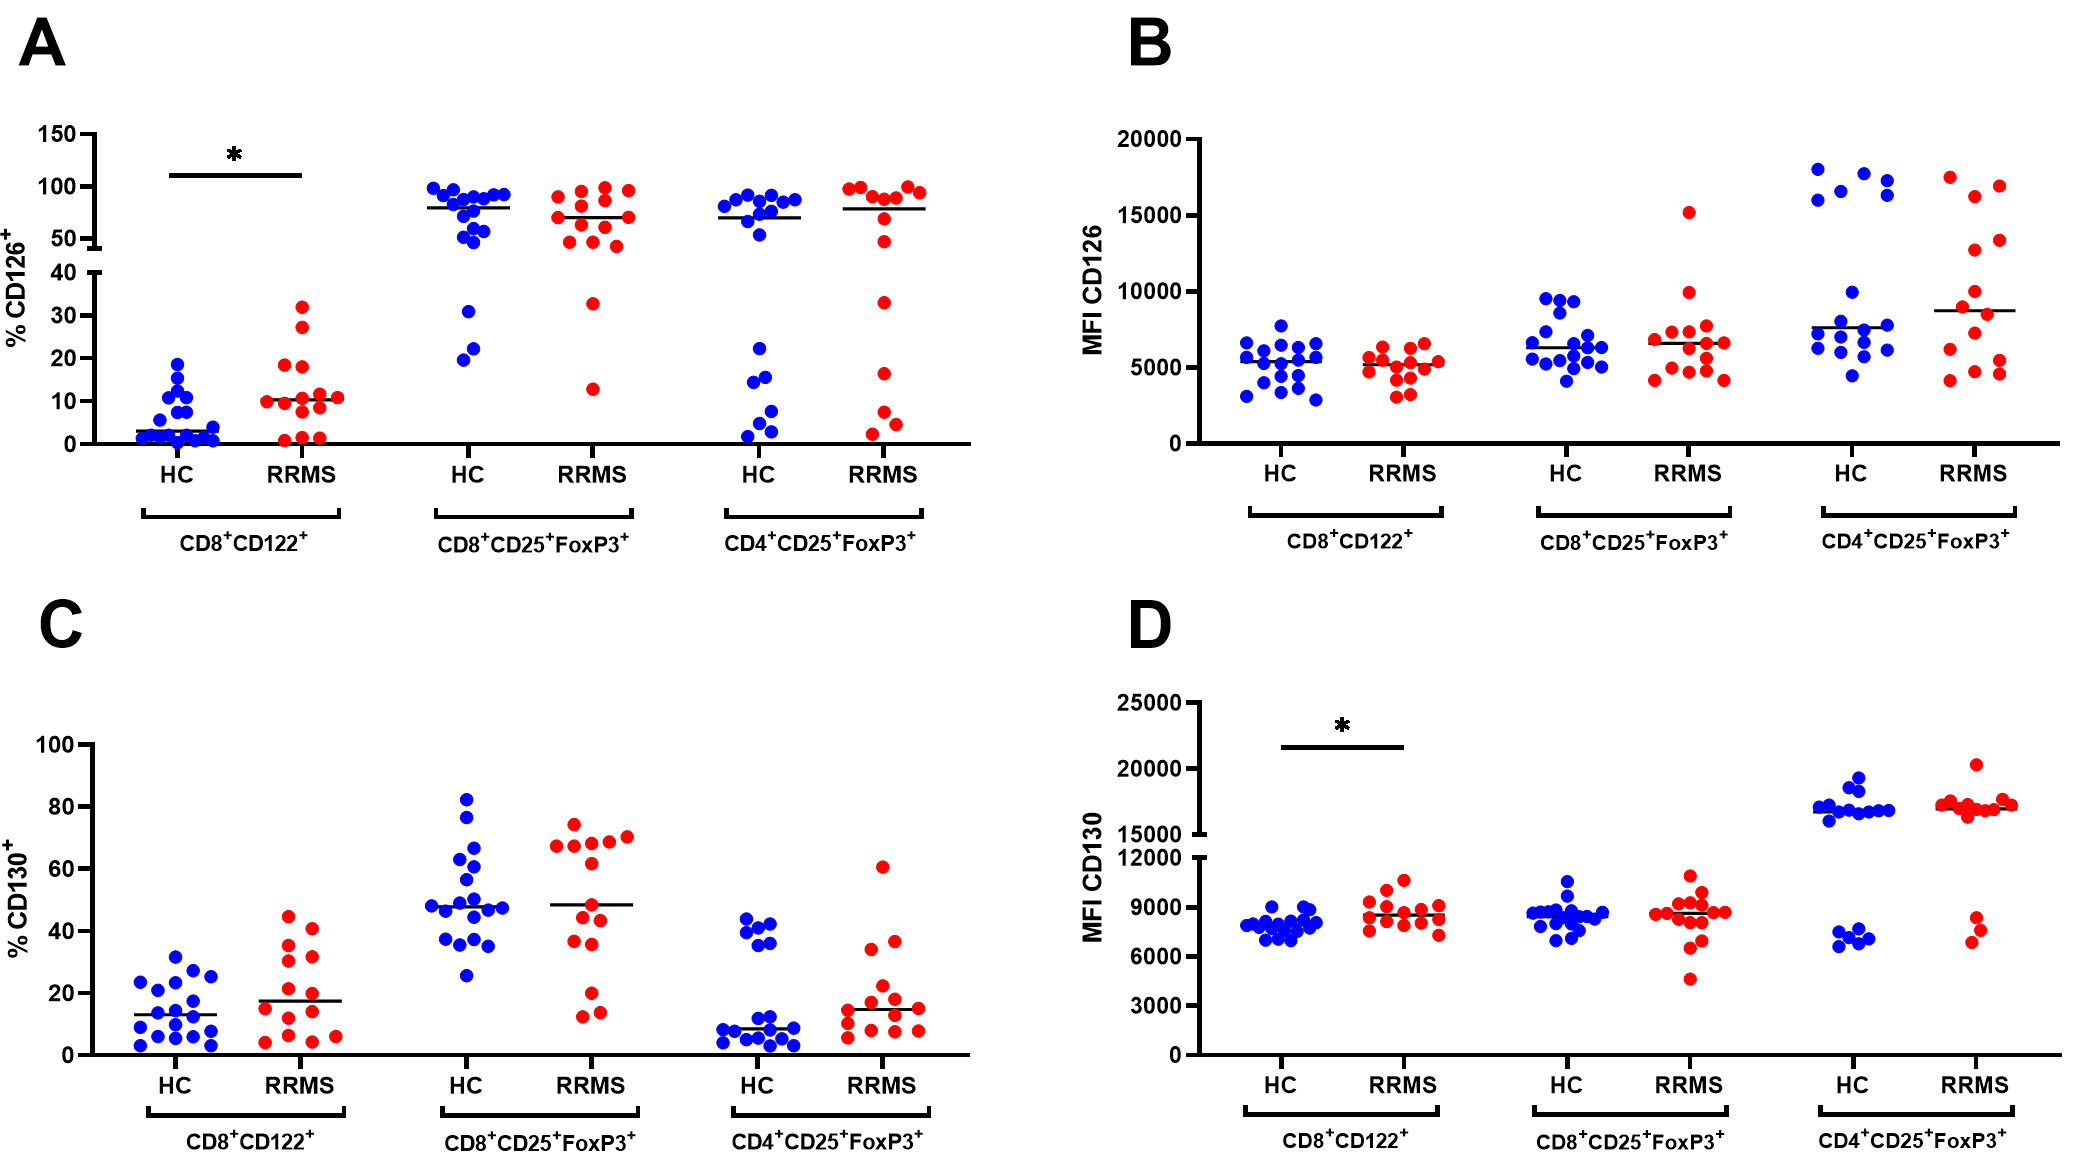 Fig. 3.
Percentage (%) and expression (MFI) of CD126+ (A,B) and
CD130+ (C,D) cells within CD8+CD122+,
CD8+CD25+FoxP3+ and CD4+CD25+FoxP3+ Treg
populations in HC (n = 18) and RRMS patients (RRMS, n = 16). *p
The percentage of CD8+CD122+CD126+ T cells showed a significant positive correlation with serum sgp-130 levels (r = 0.77, p = 0.03) in healthy controls. However, there was no significant correlation in RRMS patients where the positive correlation was between CD126 frequency and serum IL-6 levels (r = 0.68, p = 0.003) (Fig. 4).
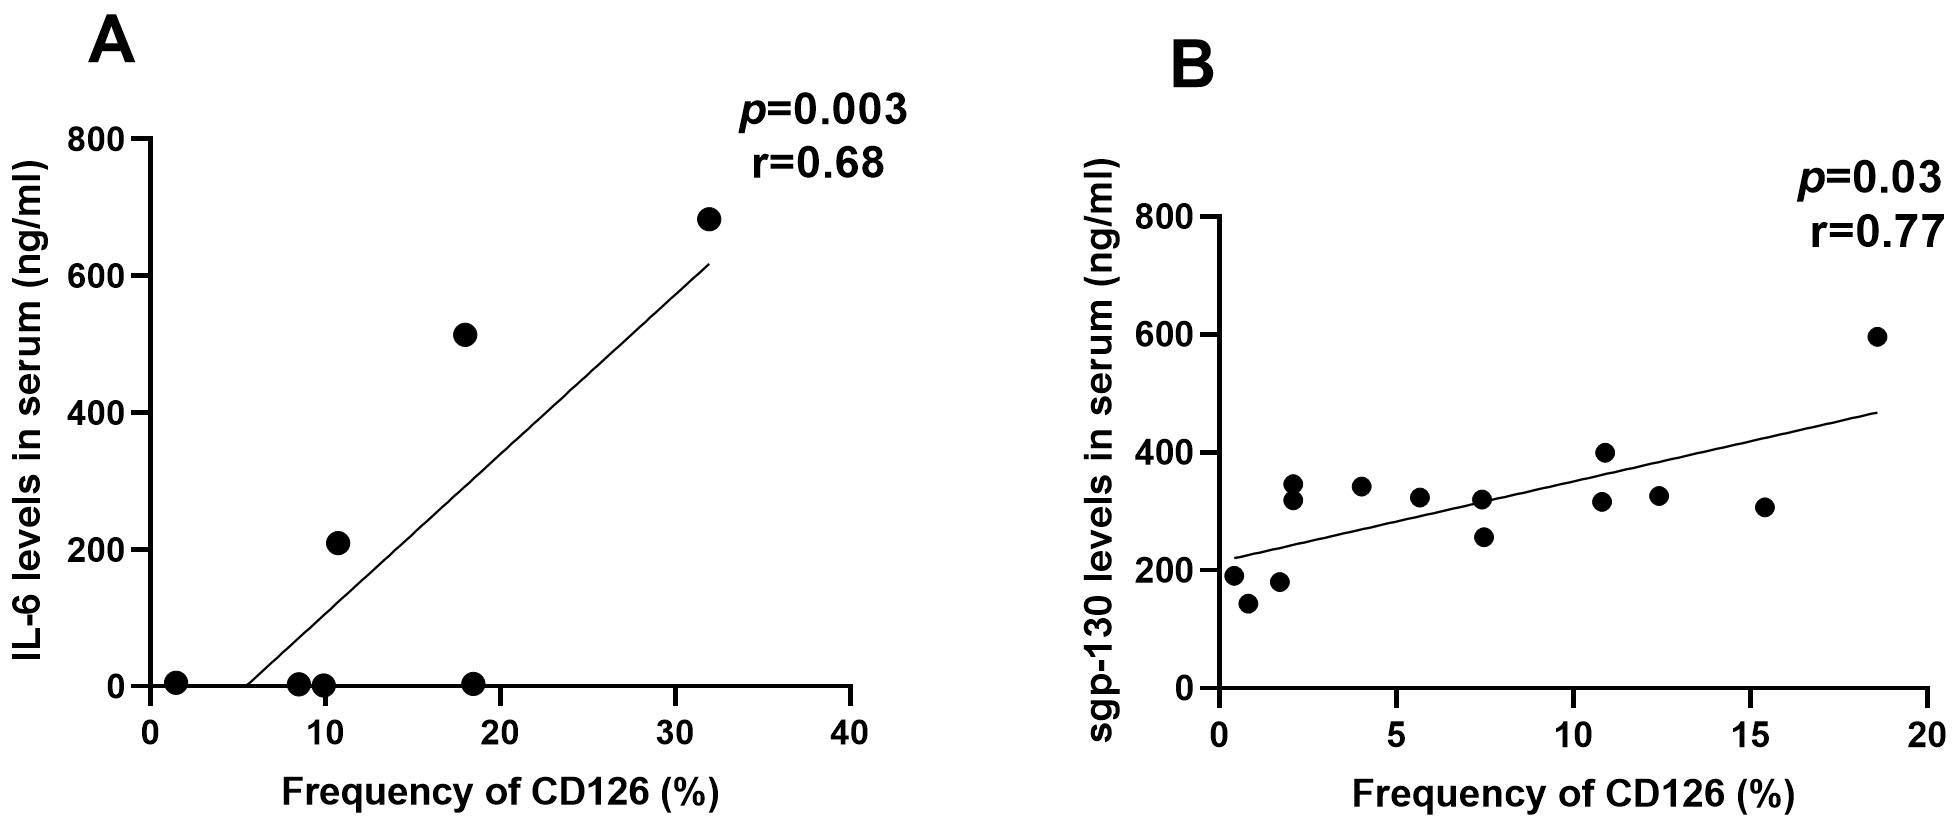 Fig. 4.
Pearson correlation coefficients and regression line of frequency of CD8+CD122+CD126+ T cells with peripheral blood IL-6 in RRMS patients (A, n = 7) and sgp-130 in HC (B, n = 14).
In line with the increased expression of CD126 and CD130 in CD8+CD22+ T cells, we did not observe an increase in STAT3 phosphorylation. Among T cells, differential expression of STAT3 phosphorylation in response to IL-6 was observed in cells expressing CD25. RRMS patients had a significant increase in the percentage of pSTAT3 in CD4+CD25+FoxP3+ (p = 0.01) and CD8+CD25+FoxP3+ Tregs (p = 0.04) (Fig. 5). CD8+CD122+ T cells of RRMS patients did not show increased sensitivity to stimulation with IL-6 compared to cells from healthy donors. Nevertheless, there was no significant correlation between the frequency of STAT3 phosphorylated T cell subtypes and the detected soluble markers in serum.
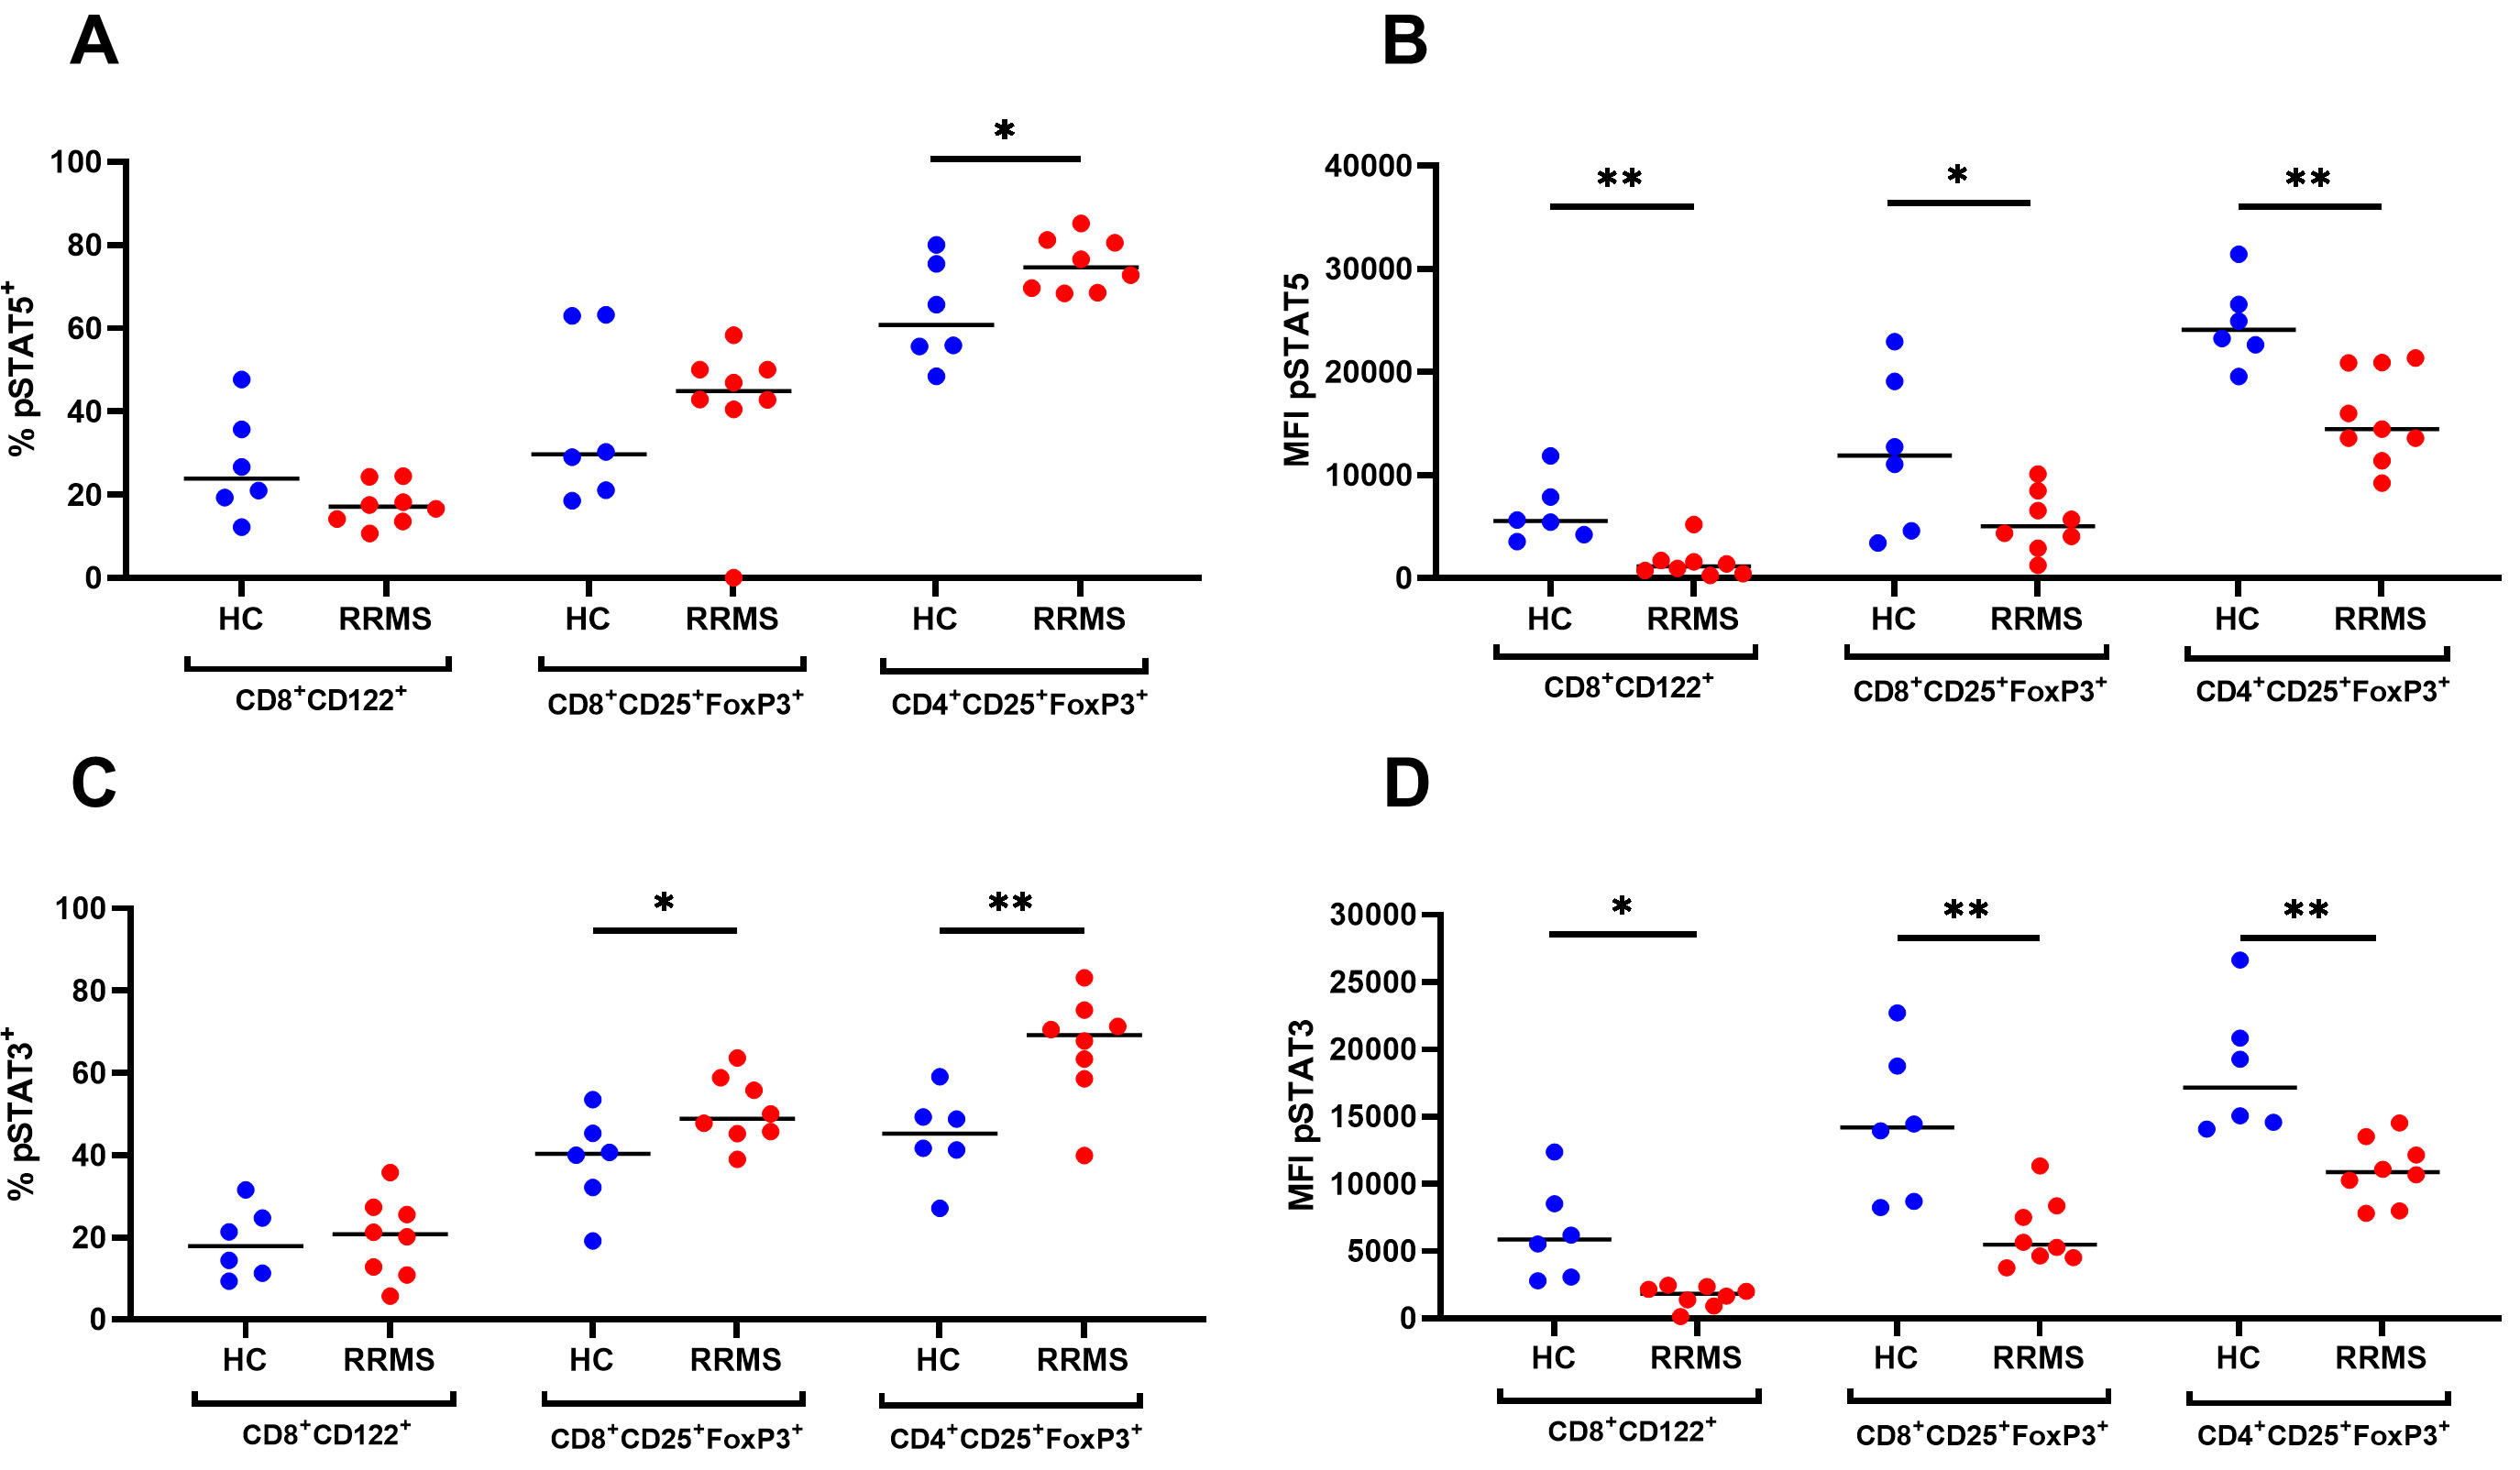 Fig. 5.
Percentage (%) and expression (MFI) of phosphorylated STAT5
(pSTAT5, A,B) and STAT3 (pSTAT3, C,D) cells within CD8+CD122+,
CD8+CD25+FoxP3+ and CD4+CD25+FoxP3+ Treg
populations in HC (n = 6) and RRMS patients (n = 8).
*p
In healthy donors, there was an inverse correlation between the levels of CD126
and pSTAT5 measured by the percentage (%) and expression (MFI) in
CD8+CD25+FoxP3+ T cells (Fig. 6). However, there was no
significant correlation between CD126, CD130 and pSTATs in RRMS patients. In
these patients, the expression of pSTAT3 on CD8+CD122+ T cells showed a
significant inverse correlation with serum IL-6R
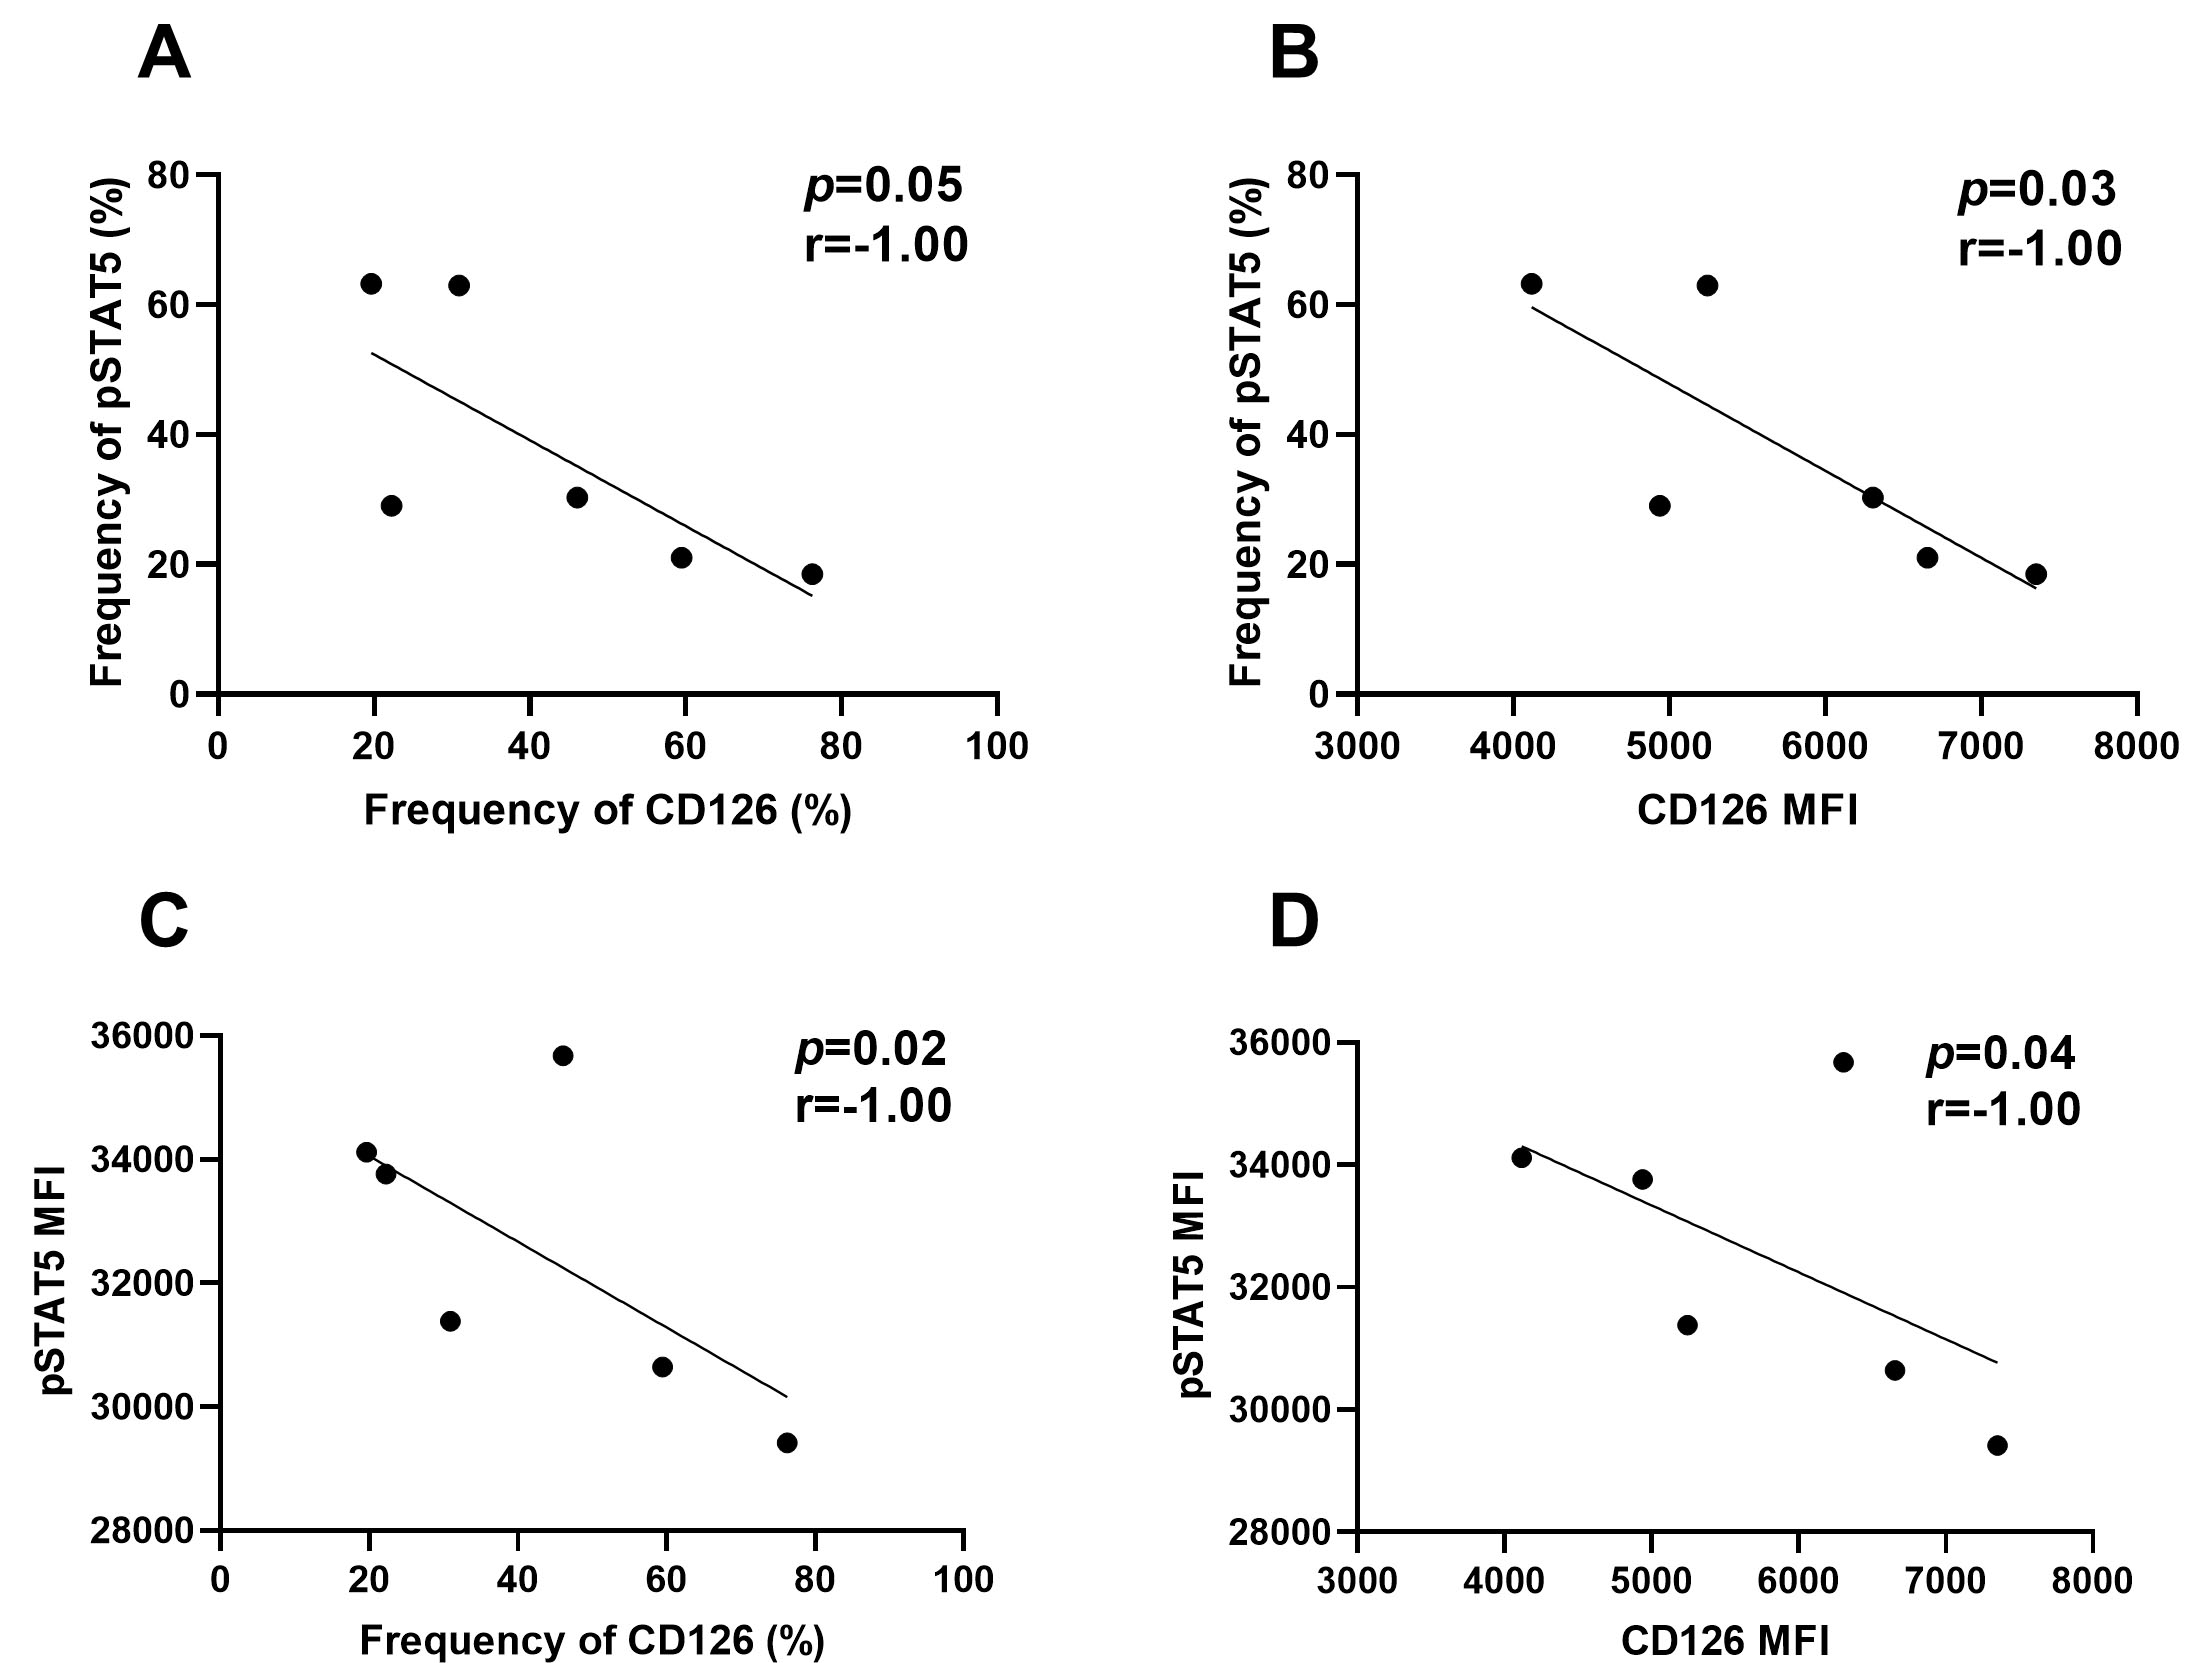 Fig. 6.
Pearson correlation coefficient and regression line of pSTAT5 (%, A) and pSTAT5 (MFI, C) with CD126 (%) and pSTAT5 (%, B) and pSTAT5 (MFI, D) with CD126 (MFI) of CD8+CD122+ in RRMS patients (n = 6).
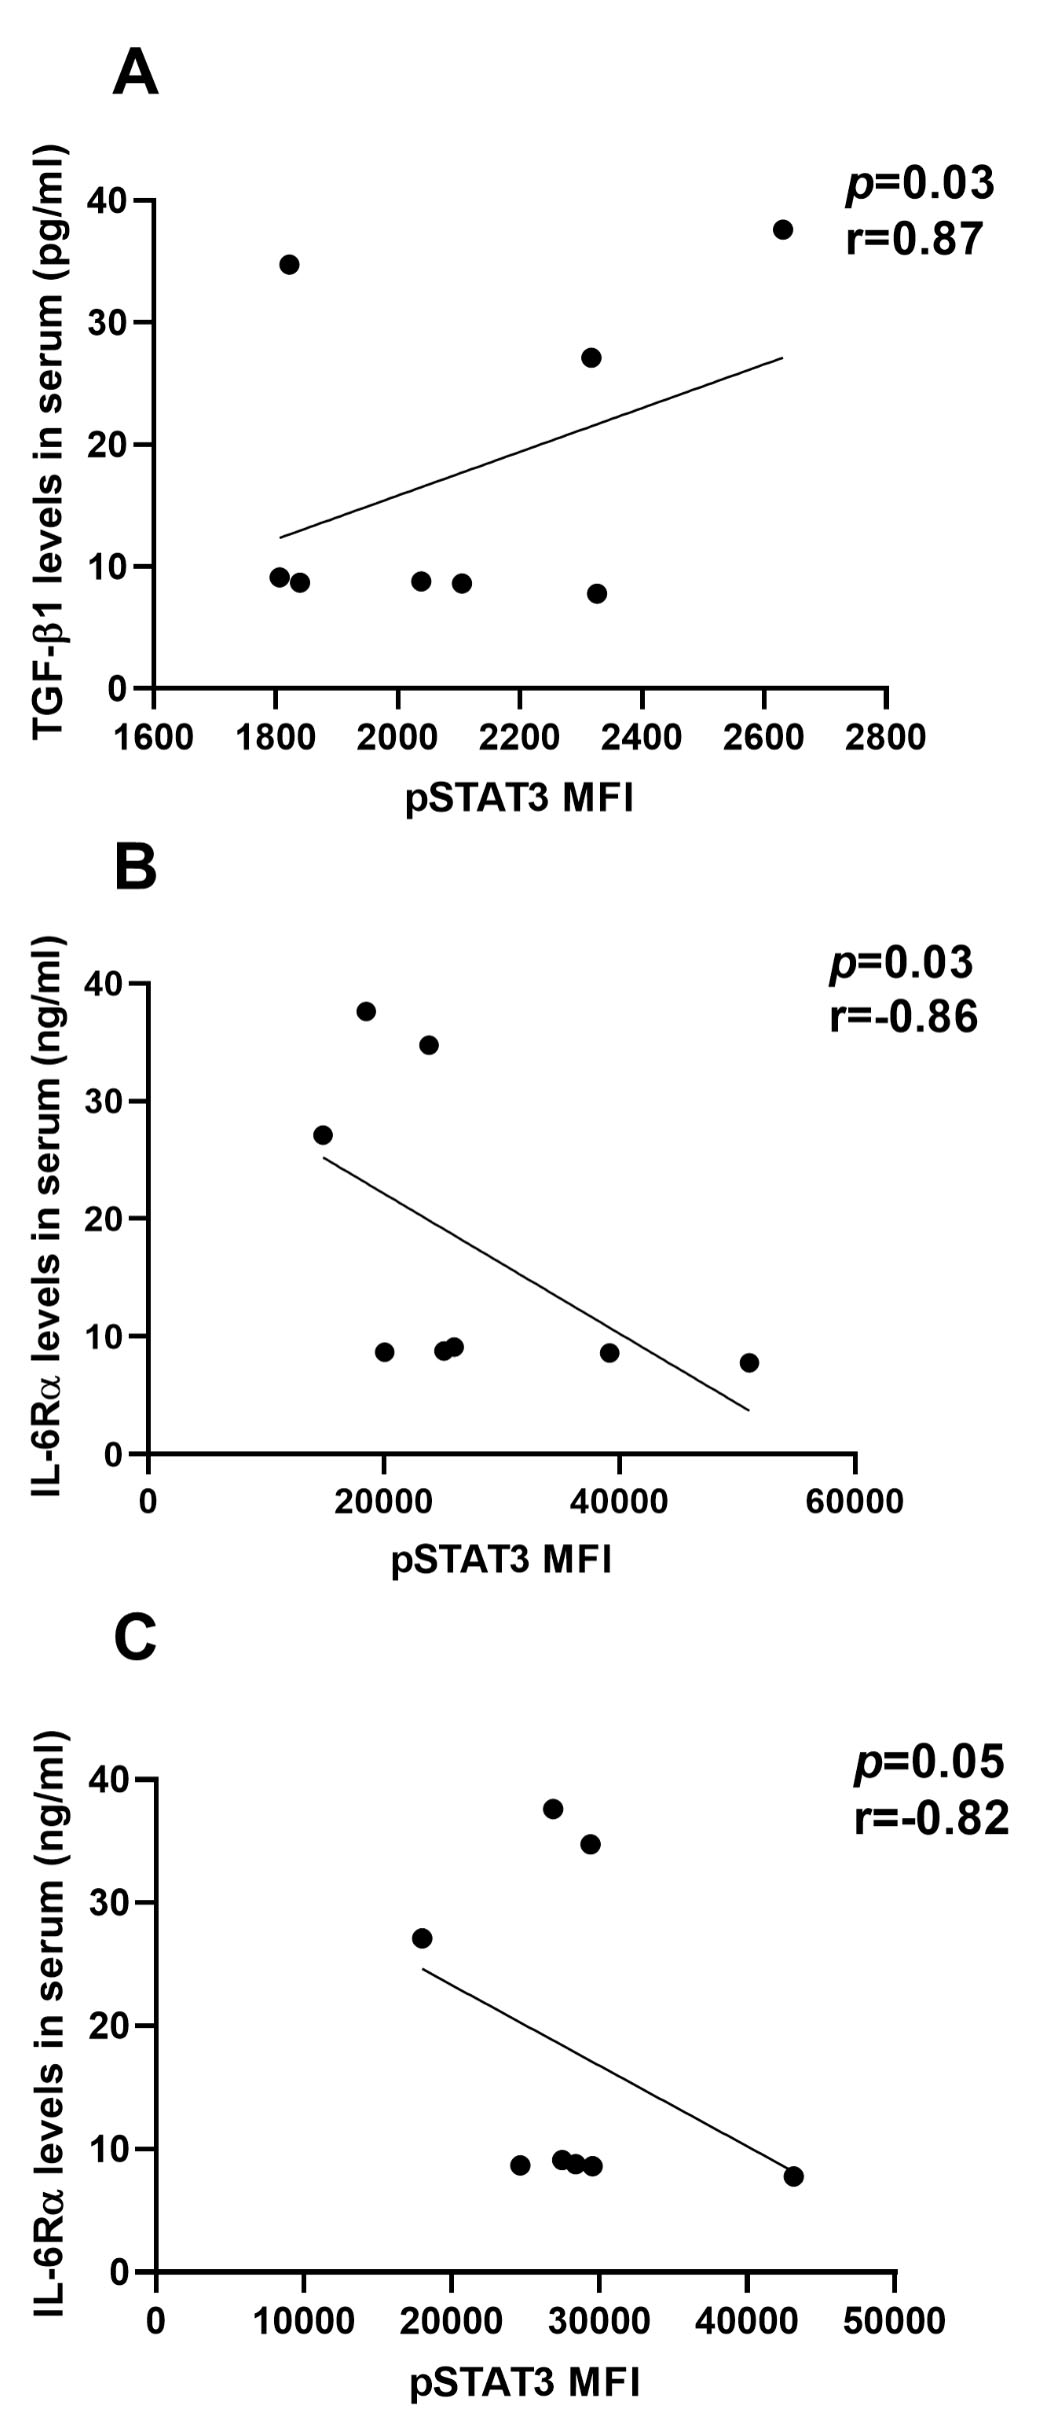 Fig. 7.
Pearson correlation coefficient and regression line of pSTAT3
(MFI) in CD4+CD25+FoxP3+ Tregs (A,C) and in CD8+CD122+ Tregs (B)
with serum level of TGF-
There were no statistically significant differences in age between the studied groups. There were age differences in the expression of some detected parameters in healthy donors only (Supplementary Fig. 1). In HC the frequency of pSTAT5 expression increased with age in all Treg populations: CD8+CD122+ (p = 0.01) CD8+CD25+FoxP3+ (p = 0.02) and CD4+CD25+FoxP3+ (p = 0.01). However, the MFI of pSTAT5 decreased only in Tregs CD4+CD25+FoxP3+ (p = 0.04). These differences were not observed in the age-related RRMS group. Analysis within patients did not show an association between the EDSS and other parameters at the time of diagnosis.
This study has described associations among IL-6 pathways in serum and
regulatory CD4+ and CD8+ T cells in the blood of newly diagnosed female patients
with RRMS and the influence of age. These associations confirm, extend and
clarify the existing literature. There was no statistically significant
difference between the RRMS and the healthy control group in the serum
concentration of IL-6. However, there were significant differences between
patients and controls in both TGF-
The cells responsible for serum IL-6 and TGF-
Activated TGF-
Our results suggest that most free IL-6 cannot bind IL-6R
It is not known if the concentration of IL-6/IL-6R
A possible explanation is that endogenous sgp-130 might inhibit the recognition
of IL-6/IL-6R
Detection of cytokine receptors is often a more robust guide to immunological mechanisms, because cytokines have a short half-life in blood [23]. Here, we analysed the classic IL-6 pathway receptors and STAT activation in CD4+ and CD8+ Treg subsets. IL-6 signaling through gp130 triggers JAK1, and dimerization and phosphorylation of STAT3, followed by translocation to the nucleus and transcription of target genes. The mitogen activated protein kinase (MAPK) pathway is activated by IL-6, leading to additional gene transcription [24].
We found striking differences in CD126 and CD130 expression between healthy donors and RRMS in peripheral blood CD8+CD122+ Tregs. A higher frequency of the CD126 membrane receptor and increased CD130 expression were observed in the CD8+CD122+ T cell subset of RRMS patients, confirming a previous report [25]. This result indicates the increased involvement of the classical IL-6 activation pathway in CD8+CD122+ Tregs within RRMS. In RRMS patients, CD8+CD122+CD126+ Tregs showed a significant positive association with levels of free IL-6 in serum. RRMS patients have a 3-fold lower percentage of CD8+CD122+ T cells than healthy donors and the distribution of CD8+CD25+FoxP3 and CD4+CD25+FoxP3+ Tregs was unchanged [10]. Therefore, in RRMS fewer cells are available for classical IL-6 signaling. This is particularly important, as classical IL-6 signaling has homeostatic and anti-inflammatory effects [26]. The increased expression of CD126 and CD130 could be a mechanism that supports anti-inflammatory effects of the reduced population of CD8+CD122+ T cells.
Surprisingly, despite increased levels of IL-6R and gp-130 in CD8+CD122+ T
cells, these cells did not exhibit sensitivity to IL-6 and IL-2, as indicated by
the unchanged frequency of phosphorylated STAT3 and STAT5, and inhibited STAT3
and STAT5 MFI, respectively. Further the concentration of pSTAT3 was negatively
correlated with the serum concentration of IL-6R
The PI3K/Akt signaling pathway, is involved in multiple signaling pathways which control the development, differentiation, maturation, migration and activation of CD8+ T cells. Defective signaling by STAT5 in response to cytokines such as IL-2 and IL-15 is associated with constitutively active Akt in CD8 T cells [28]. Another explanation is that activation of STAT3 leads to the expression of SOCS3; this molecule negatively regulates the IL-6 signaling pathway. However, there was no difference in SOCS1 and SOCS3 expression in blood between RRMS patients and healthy controls [29].
Recently published data support the concept that classical IL-6 signaling through STAT3 is anti-inflammatory while trans-signaling by IL-6 is pro-inflammatory. IL-6 trans-signaling could inhibit the differentiation of regulatory T-cells [4]. Our results show that classical IL-6 signaling in CD8+CD122+ T cells is disrupted in RRMS. This disruption could contribute to the dysregulation of Treg function and enhance the inflammatory process provoked by CD25-positive CD4 and CD8 Tregs.
No differences in the levels of CD126 and CD130 were observed in CD25-positive
Tregs (CD4+CD25+FoxP3+ and CD8+CD25+FoxP3+) between healthy donors and patients
with RRMS but these cells exhibited sensitivity to IL-6 stimulation, resulting in
an increase in the intracellular percentage of pSTAT3. This implicates
trans-signaling of IL-6 in these cells. Interestingly, the percentage of
pSTAT3-positive cells in the CD4+CD25+FoxP3+ population was positively correlated
with the level of TGF-
CD4+ T cells strongly express IL-6R. This expression is lost in activated T cells during inflammation, probably due to proteolytic cleavage of the extracellular membrane protein domain [30]. On the other hand, CD8+ T cells do not produce A disintegrin and metalloprotease 17 (ADAM17) and consequently do not express sIL-6R [25]. CD126 expression on CD8+ T cells is inhibited by STAT5 [31]. These results suggest that induction of the IL-6 pathway may depend on CD25 expression by Tregs.
Age-related changes in pSTAT5 expression across all Treg populations: CD8+CD122+, CD8+CD25+FoxP3+ and CD4+CD25+FoxP3+ in healthy controls were absent in RRMS patients, suggesting that RRMS may interfere with normal immune aging patterns, possibly by promoting a sustained inflammatory state that overrides senescence of T cells. STAT5 phosphorylation maintains the expression of CD25 and supports Treg stability during aging [32].
MS patients show early immunosenescence and have fewer naïve T cells, and fewer functional regulatory T cells [33]. Although, the adaptive immune system shows reduced efficacy earlier in men [34], here we demonstrated disrupted frequency of pSTAT5 expression in Treg populations in RRMS females.
The main limitation of our study was the small size of the study population. Statistical power is influenced by the number of individuals tested as well as the size of the effect and statistical test. Although all patients were female to avoid confounding between differences due to disease and potential differences due to gender, inclusion of only one gender in studies is the second limitation of the study. The results strongly indicate that further studies are needed to explain the role of key signaling pathways in the development of Tregs populations and RRMS pathogenesis.
The level of IL-6 pathway markers in serum reflects both classic and trans-signaling in RRMS patients. The CD8+CD122+ Treg subset in RRMS patients exhibited an increased level of markers associated with classical IL-6R signaling without STAT3 phosphorylation. The observed alterations in the expression of receptors and in signaling activity may contribute to the dysregulation of CD8+CD122+ Treg function. For CD4+CD25+FoxP3+ and CD8+CD25+FoxP3+ Tregs, no changes in classical IL-6R surface markers were observed in RRMS, but these cells exhibited sensitivity to IL-6 stimulation, resulting in an increase in the percentage of pSTAT3 in cells, suggesting IL-6 trans-signaling in these cells. Our findings underscore the complex interplay between IL-6 signaling and age-related immune regulation. Age-related changes in pSTAT5 expression across all Treg populations in healthy controls were absent in RRMS patients. The study enhances our understanding of the peripheral immune system changes associated with CNS pathology and disease progression. It also opens a new avenue to identify biomarkers of disease progression and potentially offers a new approach to manipulate the immune system to protect the CNS.
The datasets used and/or analyzed during the current study are available from the corresponding author on reasonable request.
MK: conceptualization, investigation, methodology, data analysis, writing; MM: conceptualization, investigation, methodology, data analysis, review and editing draft; LS: investigation, review and editing draft; MMC: data analysis, visualization, editing draft; RR: resources, design of the work, review and editing draft; AK: resources, design of the work, review and editing draft; MS: data analysis, review and editing draft; KDŁ: conceptualization, funding acquisition, project administration, supervision, data analysis, writing, review and editing draft. All authors read and approved the final manuscript. All authors have participated sufficiently in the work and agreed to be accountable for all aspects of the work.
The study was performed in accordance with The Code of Ethics of the World Medical Association (Declaration of Helsinki) for experiments involving humans and was approved by the local ethics committee at the Military Institute of Hygiene and Epidemiology (No. 17/2019). All patients or their families/legal guardians gave written informed consent before enrollment.
We are grateful to Małgorzata Malinska (Department of Neurology, Military Institute of Aviation Medicine, Warsaw, Poland) for the excellent clinical support, Beata Kon for the statistical analysis and all patients who agreed to donate blood for research.
This work was supported by the TEAM TECH/2017-4/22 project carried out within the TEAM TECH programme of the Foundation for Polish Science, co-financed by the European Union under the European Regional Development Fund.
The authors declare no conflict of interest.
Supplementary material associated with this article can be found, in the online version, at https://doi.org/10.31083/JIN36207.
References
Publisher’s Note: IMR Press stays neutral with regard to jurisdictional claims in published maps and institutional affiliations.