


 , Jing Ning 1,†, Jiarui Ma 1, Jiejia Chen 2,*
1 College of Music, Southwest University, 400715 Chongqing, China
2 School of Electronic and Information Engineering, Southwest University, 400715 Chongqing, China
†These authors contributed equally.
Abstract
Inhibitory control is an important component of cognitive processing that is influenced by multimodal information processing. Recent research has mainly focused on the influence of visual information on inhibitory control, paying less attention to the impact of auditory training, which limits the exploration of the mechanism and practical training of inhibitory control. The influence of music training on inhibitory control has received considerable attention in recent years. To explore the modality-specificity of inhibitory control, this study compares the behavioral and brain electrical activities of different music training experiences through visual and auditory inhibitory control tasks.
This investigation utilized event-related potential (ERP) and time-frequency analysis methodologies to examine the behavioral and neural patterns of thirty participants with musical expertise alongside thirty individuals without such training while completing both visual and auditory Stroop tasks. Further analysis was conducted to examine the modality-specific effect of music training on inhibitory control.
The results showed no significant group differences in behavioral performance or traditional ERP components (N450 and sustained potential (SP)) in either modality. Time-frequency analysis revealed no significant differences in theta power in the visual modality. However, in the auditory modality, the music training group exhibited significantly lower beta power, suggesting that music training may more efficiently recruit neural resources when resolving auditory conflict.
These findings indicate that inhibitory control exhibits modality specificity across both visual and auditory modalities. Specifically, music training mainly improves auditory conflict resolution, suggesting its impact on inhibitory control is limited to specific sensory modalities.
Keywords
- music training
- inhibitory control
- conflict resolution
- time-frequency analysis
Inhibitory control is a core component of executive function and is defined as an individual’s ability to suppress impulses or distracting information unrelated to a goal or task by regulating attention, behavior, thoughts, or emotions, thereby enabling goal-directed action [1]. This capacity not only underpins higher-order cognitive processes such as attentional control, conflict processing, and decision-making, it is also closely linked to a range of psychopathologies [2, 3]. Consequently, enhancing inhibitory control has become a focal concern in both psychology and clinical medicine. In the current era of increasingly abundant online information, effectively improving inhibition control of redundant stimuli has become the focus of cognitive development. Previous research demonstrates enhanced inhibitory control via pharmacological interventions, cognitive training, and exercise programs [4, 5, 6, 7]. Pharmacological interventions (e.g., methylphenidate, which is commonly used to improve attention deficit hyperactivity disorder) primarily enhance inhibitory control by modulating neurotransmitter levels; however, they often have side effects and may increase long-term treatment costs [8, 9]. Cognitive training typically involves task-based repetitive practice, such as the Go/No-Go, Stroop, or working memory tasks, which strengthen executive functions. However, the monotonous nature of such training often leads to participant fatigue, thereby reducing intervention effectiveness [1, 10]. Exercise-based interventions have shown positive effects on inhibitory control; however, the magnitude of these effects varies considerably across populations and the evidence remains inconclusive [11, 12]. Although these approaches have demonstrated some effectiveness in improving inhibitory control, they have notable limitations. Therefore, interventions that are both engaging and effective must be identified. Music training offers distinct and comprehensive advantages through rich cognitive stimulation and effective artistic engagement [13].
Music training, as a typical multisensory-channel and multilevel cognitive processing activity, constitutes a multidimensional stimulus involving motor, somatosensory, auditory, visual, and spatial processing, as well as localization and the integration of these diverse forms of processing [14, 15], which has a particularly positive effect on inhibitory control ability [16]. According to the “Audiation” theory proposed by Edwin Gordon, the comprehension and processing of music depends on the brain’s ability to encode, maintain, and retrieve rhythmic and pitch patterns, a process that requires sustained cognitive engagement. To process these auditory patterns accurately, individuals must continuously suppress irrelevant and distracting stimuli, thereby maintaining selective attention to the target auditory information [17]. Therefore, repeatedly activating auditory processing and regulatory mechanisms during music training may effectively enhance long-term inhibitory control capacity. This advantage is closely related to the operational demands of instrumental performance. Musicians need to continuously monitor and rapidly adjust their playing actions based on auditory and proprioceptive feedback while simultaneously suppressing irrelevant distractions, indicating that this highly refined motor process in music training fundamentally requires substantial involvement in inhibitory control ability [10, 18].
Although music training relies heavily on auditory processing, most previous studies have focused on inhibitory control within the visual modality, paying limited attention to auditory channels. Even in relation to inhibitory control in music training [18], traditional research may neglect the inherent auditory-centered nature of music training. Some studies have found that professional musicians demonstrate significantly smaller interference effects in Stroop tasks than amateur musicians, reflecting their more efficient inhibitory control abilities [19]. The reduced interference observed in the professional group underscores the notion that music training, characterized by its highly refined integration of motor and cognitive demands, inherently necessitates the continuous engagement of inhibitory control mechanisms. However, assessing music training’s impact on inhibitory control via only visual stimuli may fail to represent music’s unique processing channels. In fact, the neural processing of inhibitory control exhibits significant modality-specific differences. Auditory conflict tasks are more closely aligned with the actual processing demands of musical training than visual tasks [20]. Previous research has demonstrated that musicians outperform non-musicians in auditory conflict tasks across behavioral measures, event-related potential (ERP) components, and time–frequency features, reflecting enhanced neural processing efficiency [21, 22], which may be closely linked to the auditory-based nature of music training. Compared with visual tasks, auditory tasks can better simulate the real cognitive demands imposed by music training. Therefore, a unimodal visual perspective is insufficient to completely elucidate the impact of music training on the inhibitory control (IC), and it is necessary to investigate its neural processing characteristics in a multimodal context.
Based on this, the present study employed the Stroop paradigm, utilizing both visual and auditory channels, combined with ERP and time-frequency analyses, to compare differences in inhibitory control tasks between university students with long-term systematic music training (music training group) and non-music majors (control group) to investigate the differences in the neural processing of inhibitory control across different perceptual modalities. Furthermore, a particular focus should be on whether the effects of musical training on inhibitory control are modality-specific or modality-general. The Stroop task is a classical method used to investigate the neural mechanisms of conflict processing. It consists of congruent (where semantic meaning and word color match) and incongruent (where semantic meaning and word color do not match) conditions [23]. Regarding ERPs, the Stroop task elicited prominent conflict-related N450/Ninc and late sustained potential (SP) components [24]. Specifically, N450 typically emerges approximately 300–500 ms after the presentation of visual stimuli, whereas Ninc is observed around 300–400 ms after auditory stimuli [25]. The SP component, appearing after N450/Ninc around 500–800 ms post-stimulus, is associated with the ability to resolve conflicts [26]. Regarding time-frequency, previous studies have shown that Stroop tasks can elicit significant theta- and beta-band activity. Theta power enhancement is widely considered an index of conflict monitoring and cognitive control and is closely associated with attentional regulation and error monitoring during tasks [27, 28]. Beta-band activity, on the other hand, is closely related to conflict resolution or processing [29, 30, 31]. This study examined both frequency bands to explore the modality specificity of inhibitory control by comparing the behavioral and brain electrical activities of different music training experiences through visual and auditory inhibitory control tasks.
To minimize potential confounding factors, this study recruited 32 university
students majoring in music and 32 university students from non-music majors. Each
subject possessed unimpaired hearing, either normal or corrected vision,
right-handed dominance, and no documented history of psychological conditions. We
eliminated four participants from the analysis due to ERP artifact trials
surpassing the 25% threshold, ultimately including 30 individuals in each
experimental group (music training group: age 20.76
The visual Stroop task materials consisted of Chinese characters “红” (“red”) and “蓝” (“blue”) displayed in either red or blue font, yielding a total of four stimulus combinations. Among them, two were congruent stimuli (e.g., the character “红” in red), and two were incongruent (e.g., the character “蓝” in blue). All stimuli were presented in a uniform font size against a gray background. Participants were instructed to ignore the semantic meaning of the characters and respond only to the font color. That is, ‘press the “F” key if the color matched the word’s meaning, and press the “J” key if it did not’. Following a practice session, participants undertook an assessment split into two segments, with a brief intermission between them.
The auditory Stroop task materials consisted of spoken words with the semantic content “big” or “small”, each presented at two volume levels: 50 decibel (dB) (representing low volume) and 70 dB (representing high volume), forming congruent or incongruent combinations between loudness and meaning, for a total of four stimuli. Among these, two were congruent stimuli (e.g., the word “small” presented at 50 dB), and two were incongruent (e.g., the word “small” presented at 70 dB). All stimuli were presented through professional closed-back headphones (Sennheiser HD 280 Pro; frequency response 8–25,000 Hz; noise isolation up to 32 dB, Sennheiser electronic GmbH & Co. KG, Wedemark, Lower Saxony, Germany) to ensure consistent and high-quality audio. The experiment was conducted in a sound-attenuated electrophysiology laboratory, where background noise was maintained below 25 dB sound pressure level (SPL). To ensure that the subjective loudness differences across conditions were perceptually clear, all stimuli were pre-calibrated for SPL and verified using equal-loudness contours, according to ISO 226:2023 [33]. Participants were instructed to judge the loudness level of the voice while ignoring its semantic content. That is, ‘press the “J” key for soft sounds (50 dB), and press the “F” key for loud sounds (70 dB)’. Before the formal task, participants listened to sample stimuli of different loudness levels to establish a reference for distinguishing between “soft” and “loud” volumes. Following a practice session, participants undertook an assessment split into two segments, with a brief intermission between them.
Each trial followed the same sequence: first, a fixation point “+” was presented for 500 ms; this was followed by a blank screen lasting 200–500 ms. Then, a visual or auditory stimulus was presented for 300 ms, with a response window of 1000 ms. Finally, a blank screen was displayed for 1000–1500 ms as the inter-trial interval. The procedures were identical for the visual and auditory tasks.
For behavioral measures, the Stroop interference effect was used to assess participants’ conflict control ability, which was determined by contrasting performance metrics between matching and non-matching test conditions. This measurement captures the contrast in both precision and speed when participants encounter congruent versus incongruent stimuli. Notably, a diminished Stroop interference effect reflects an enhanced aptitude for regulating conflicting information.
Electroencephalogram (EEG) data were recorded using a 128-channel BioSemi
ActiveTwo system (Active3, BioSemi, Heerlen, Netherlands). The EEG signals were
sampled online at 1024 Hz, with all electrode impedances kept below 5
k
Time-frequency amplitude and phase were calculated via a short-time Fourier transform using Discrete Fourier Transform (DFT). Specifically, EEG signals were decomposed in a time window spanning 800 ms before stimulus onset to 1000 ms after stimulus onset using a sliding window with a step size of 0.4 s. Frequency resolution was set to 1 Hz, covering the 3–30 Hz band. The resulting time-frequency power spectra were then baseline-corrected, with the baseline interval defined as –800 to –200 ms prior to stimulus onset. Baseline correction was performed using the subtraction method, whereby the power at each time point was adjusted by subtracting the mean power of the baseline interval, thereby eliminating nonspecific power shifts.
Based on previous studies, observations, and analyses of grand-average waveforms and time–frequency maps [25, 34], the following time windows and electrode sites were selected for the ERP and time-frequency analyses. In ERP analysis, the mean amplitudes of the N450 and late SP components were examined. In the visual modality, the N450 component’s time window spanned 400–500 ms, with these electrode sites chosen: CZ, C1, C2, CPZ, CP1, CP2, Pz, P1, P2, FZ, F1, F2, FCz, FC1, and FC2. The SP component was analyzed in the 600–800 ms time window at the same electrode sites. In the auditory modality, the Ninc component was analyzed in the 300–400 ms time window at CPZ, P1, P3, Pz, P2, CP2, P4, and CP1. The SP component in the auditory modality was analyzed in the 500–700 ms window at PO7, Pz, POZ, OZ, and PO8. In the time-frequency analysis, the average power in the theta (4–7 Hz) and beta (21–30 Hz) frequency bands was computed. Theta-band activity was analyzed at the following electrodes: FZ, F1, F2, FCz, FC1, FC2, CZ, C1, and C2. Beta activity was analyzed at CZ, C1, C2, FCz, FC1, and FC2.
SPSS 27.0 (IBM Corporation, Armonk, NY, USA) was utilized for the statistical evaluations. For the behavioral data from the Stroop task (accuracy and reaction time) and the EEG data, including ERP components (mean amplitudes of N450 and SP) and time-frequency data (mean power in the theta and beta bands), separate two-way repeated-measures ANOVAs were performed with Condition (congruent, incongruent) as the within-subject factor and Group (music training, control) as the between-subject factor. For the time–frequency analysis, power values were converted to dB units relative to the pre-stimulus baseline to represent changes in oscillatory activity. When the assumption of sphericity was violated, p-values were corrected using the Greenhouse-Geisser method.
In the visual modality, ANOVA on accuracy revealed a significant main effect of
condition, F(1, 58) = 36.332, p
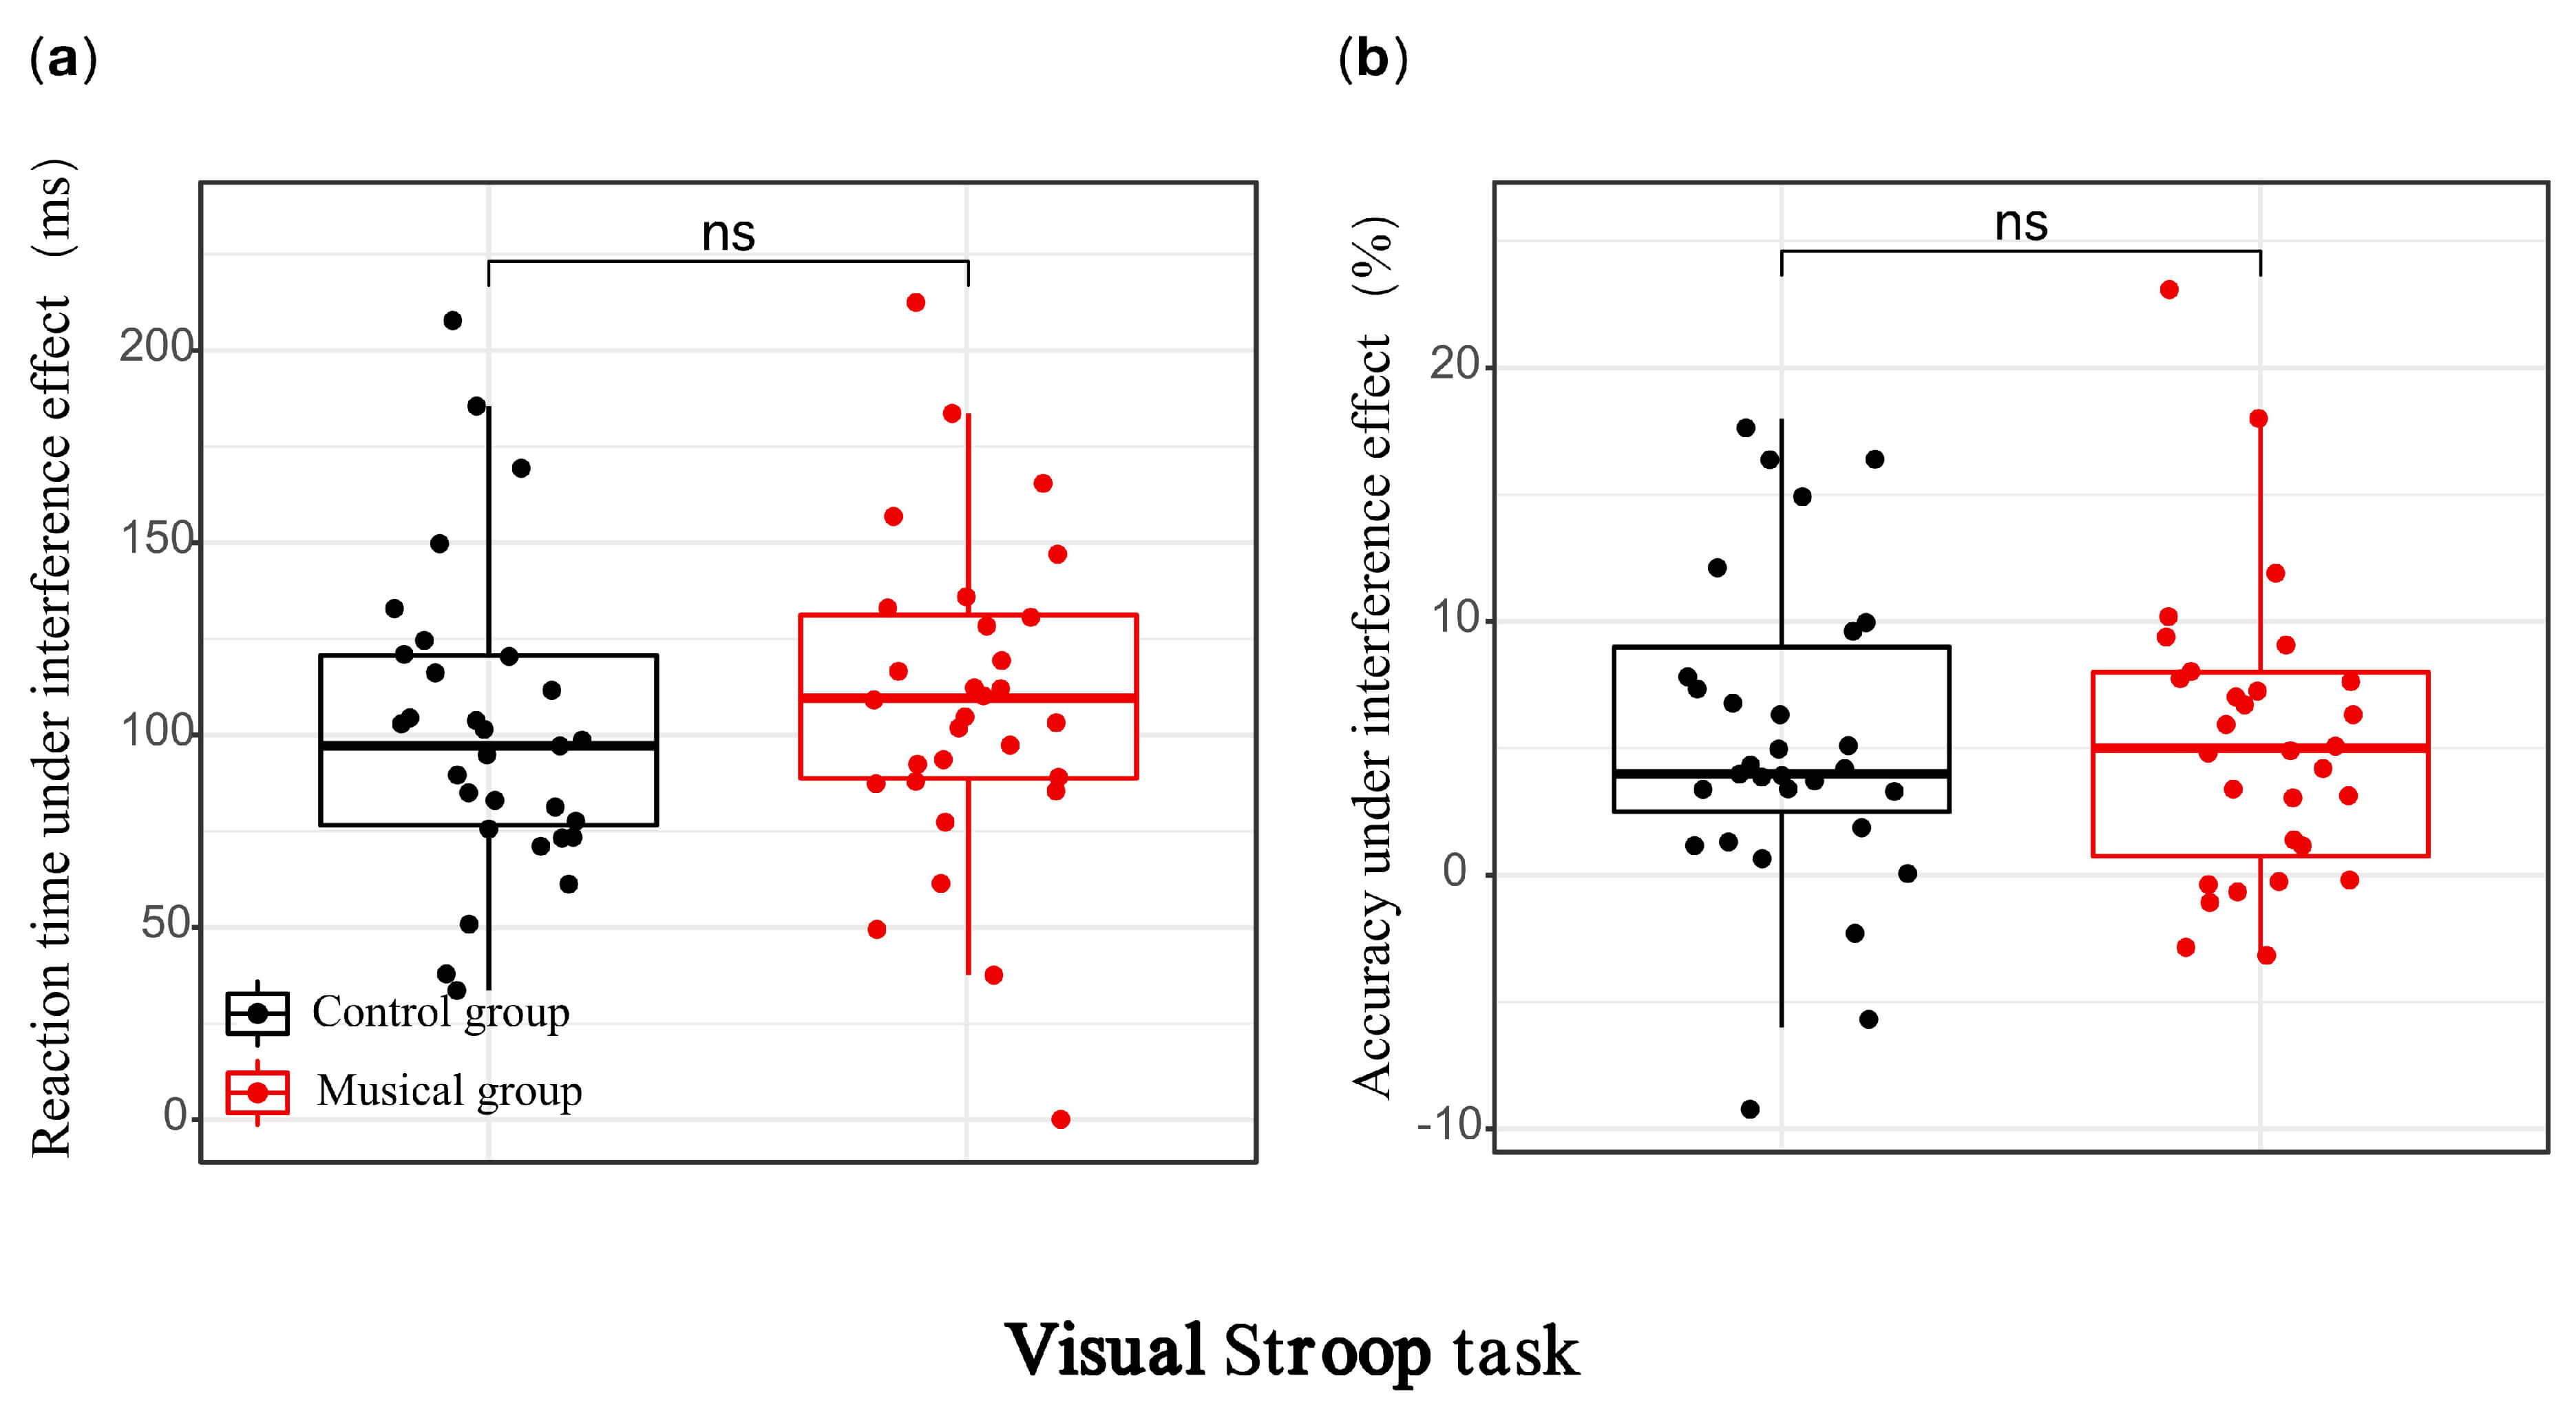 Fig. 1.
Behavioral performance of the music training group and control
group in the visual modality. (a) Stroop interference effect in reaction time;
(b) Stroop interference effect in accuracy. ns, not significant
(p
In the auditory modality, ANOVA on accuracy revealed a significant main effect
of condition, F(1, 58) = 48.906, p
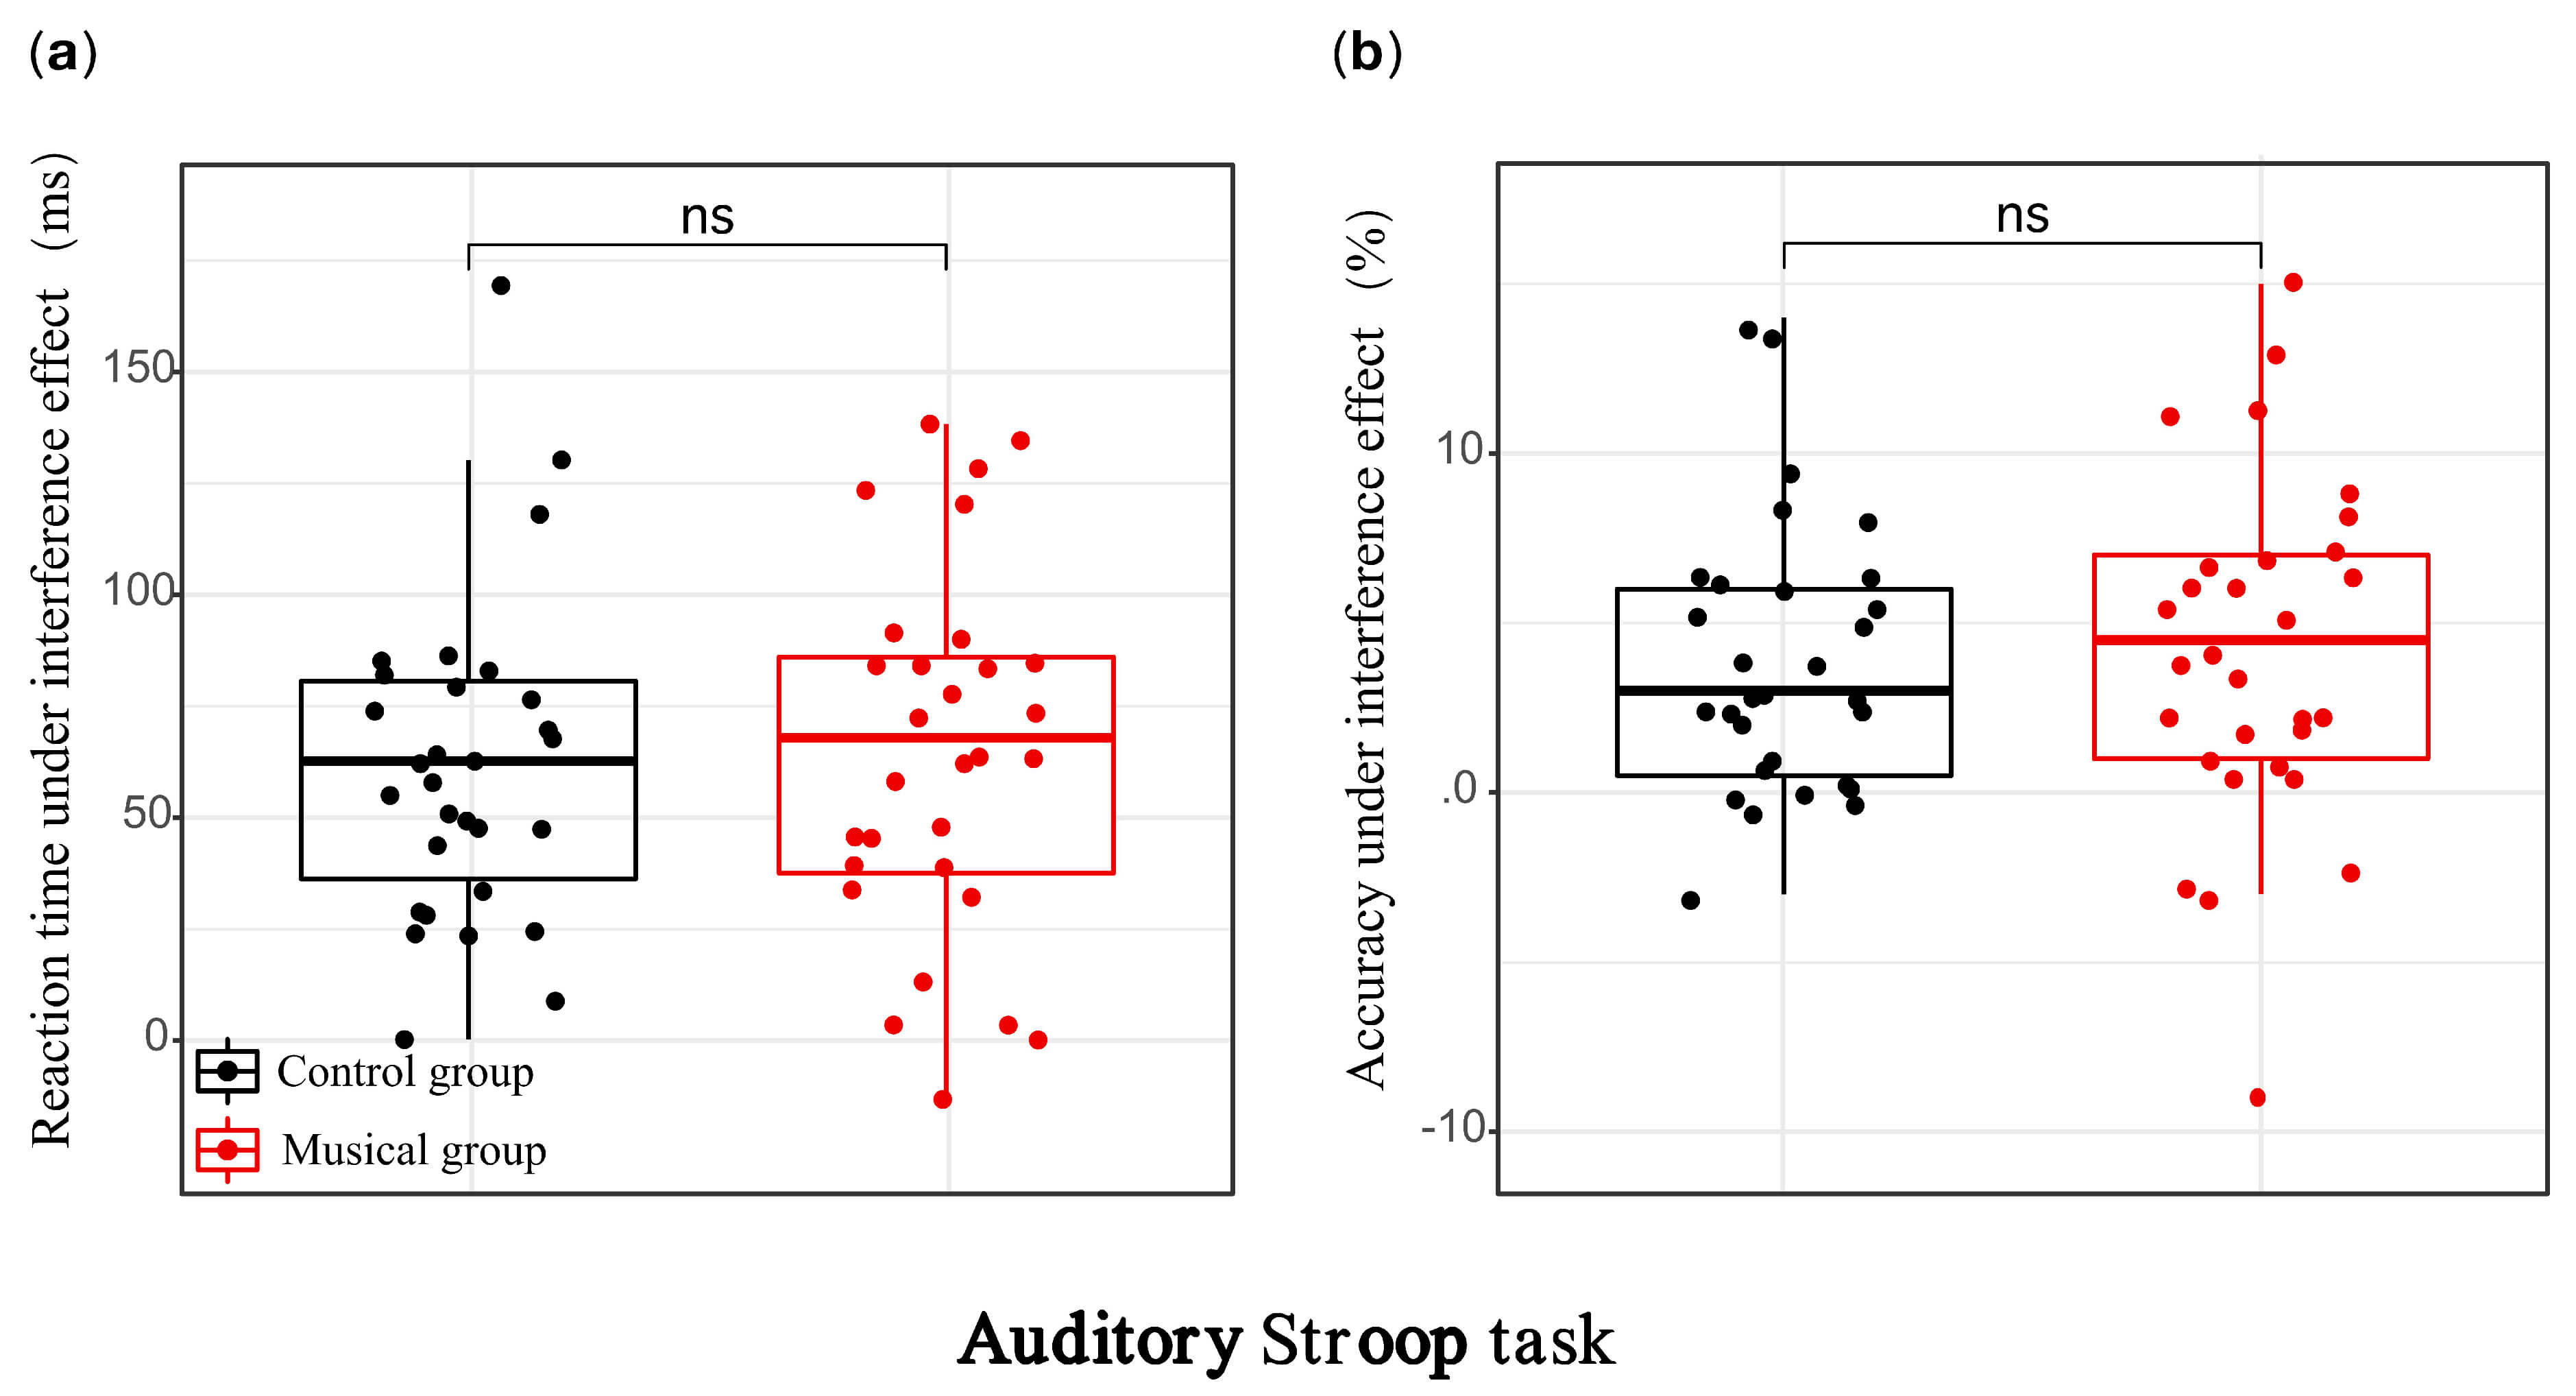 Fig. 2.
Behavioral performance of the music training group and the
control group in the auditory modality. (a) Stroop interference effect in
reaction time; (b) Stroop interference effect in accuracy. ns, not significant
(p
In the visual modality, the ANOVA results for the mean amplitude of the N450
showed a significant main effect of condition, F(1, 58) = 6.635,
p = 0.013,
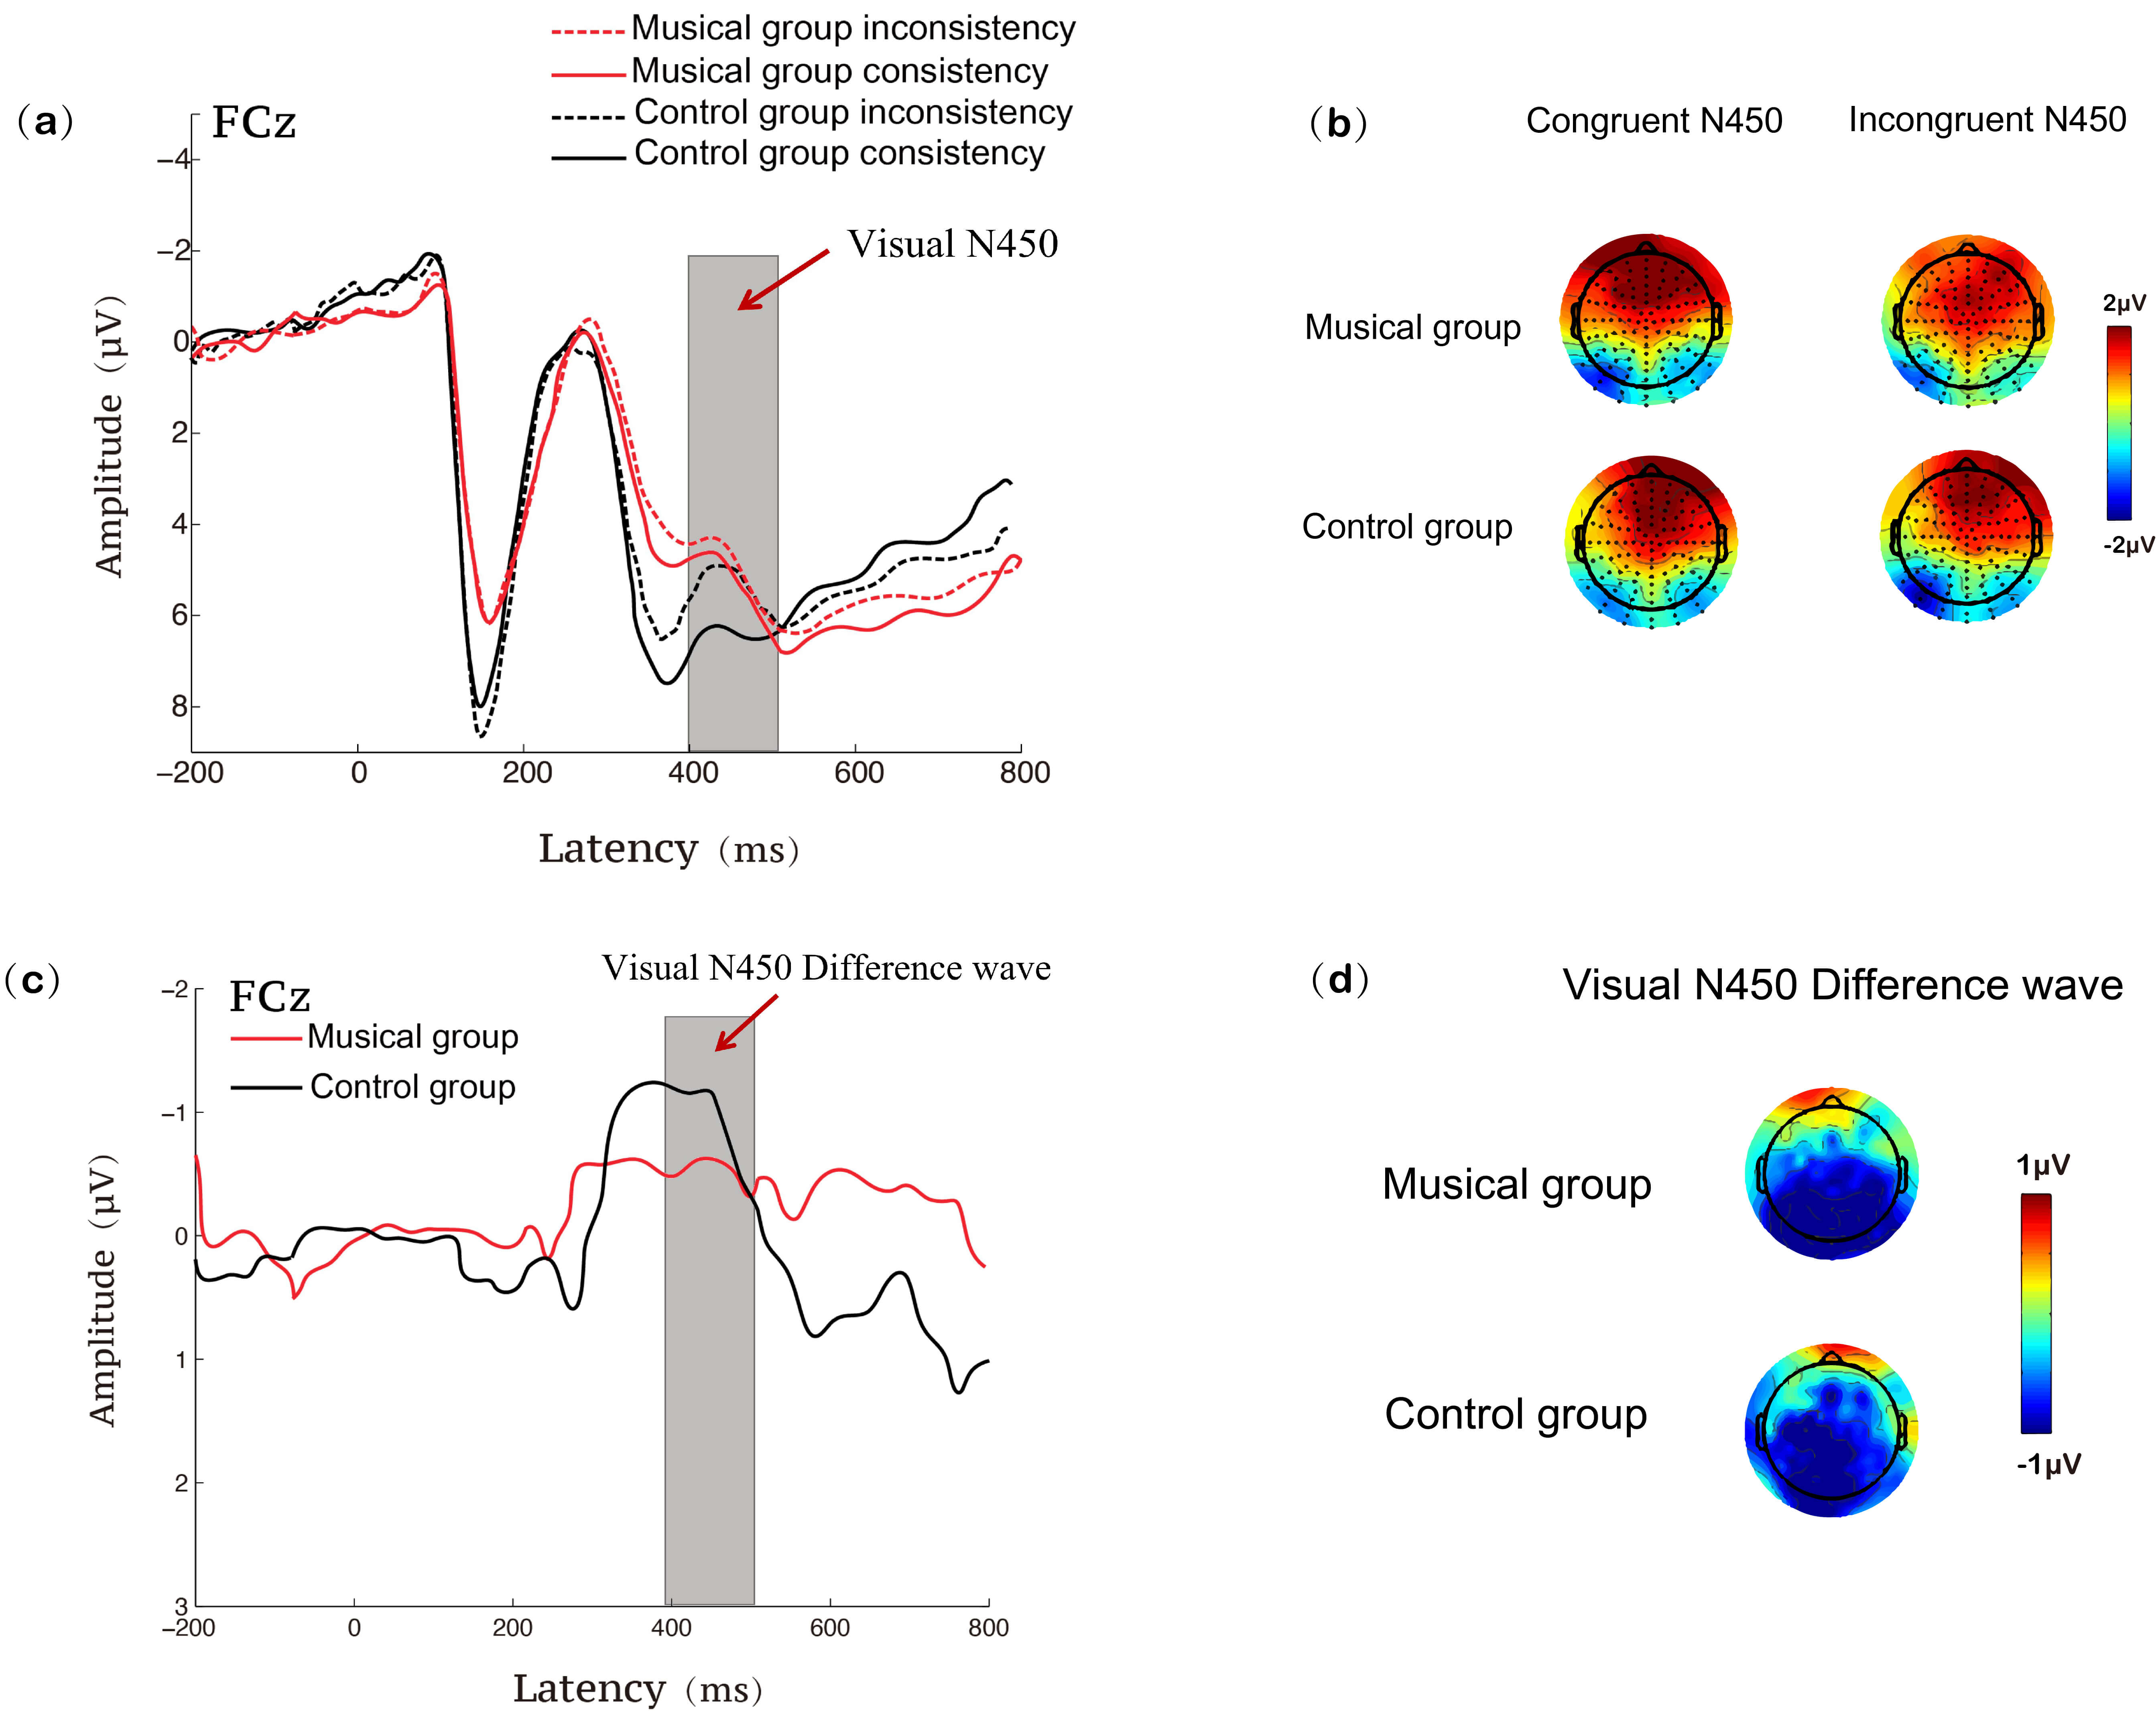 Fig. 3.
ERP results at the FCz site during the visual Stroop task for the music training and control groups. (a) N450 waveforms under congruent and incongruent conditions; (b) N450 topographies under congruent and incongruent conditions; (c) N450 difference waveforms (incongruent minus congruent); (d) N450 difference topographies (incongruent minus congruent). ERP, event-related potential.
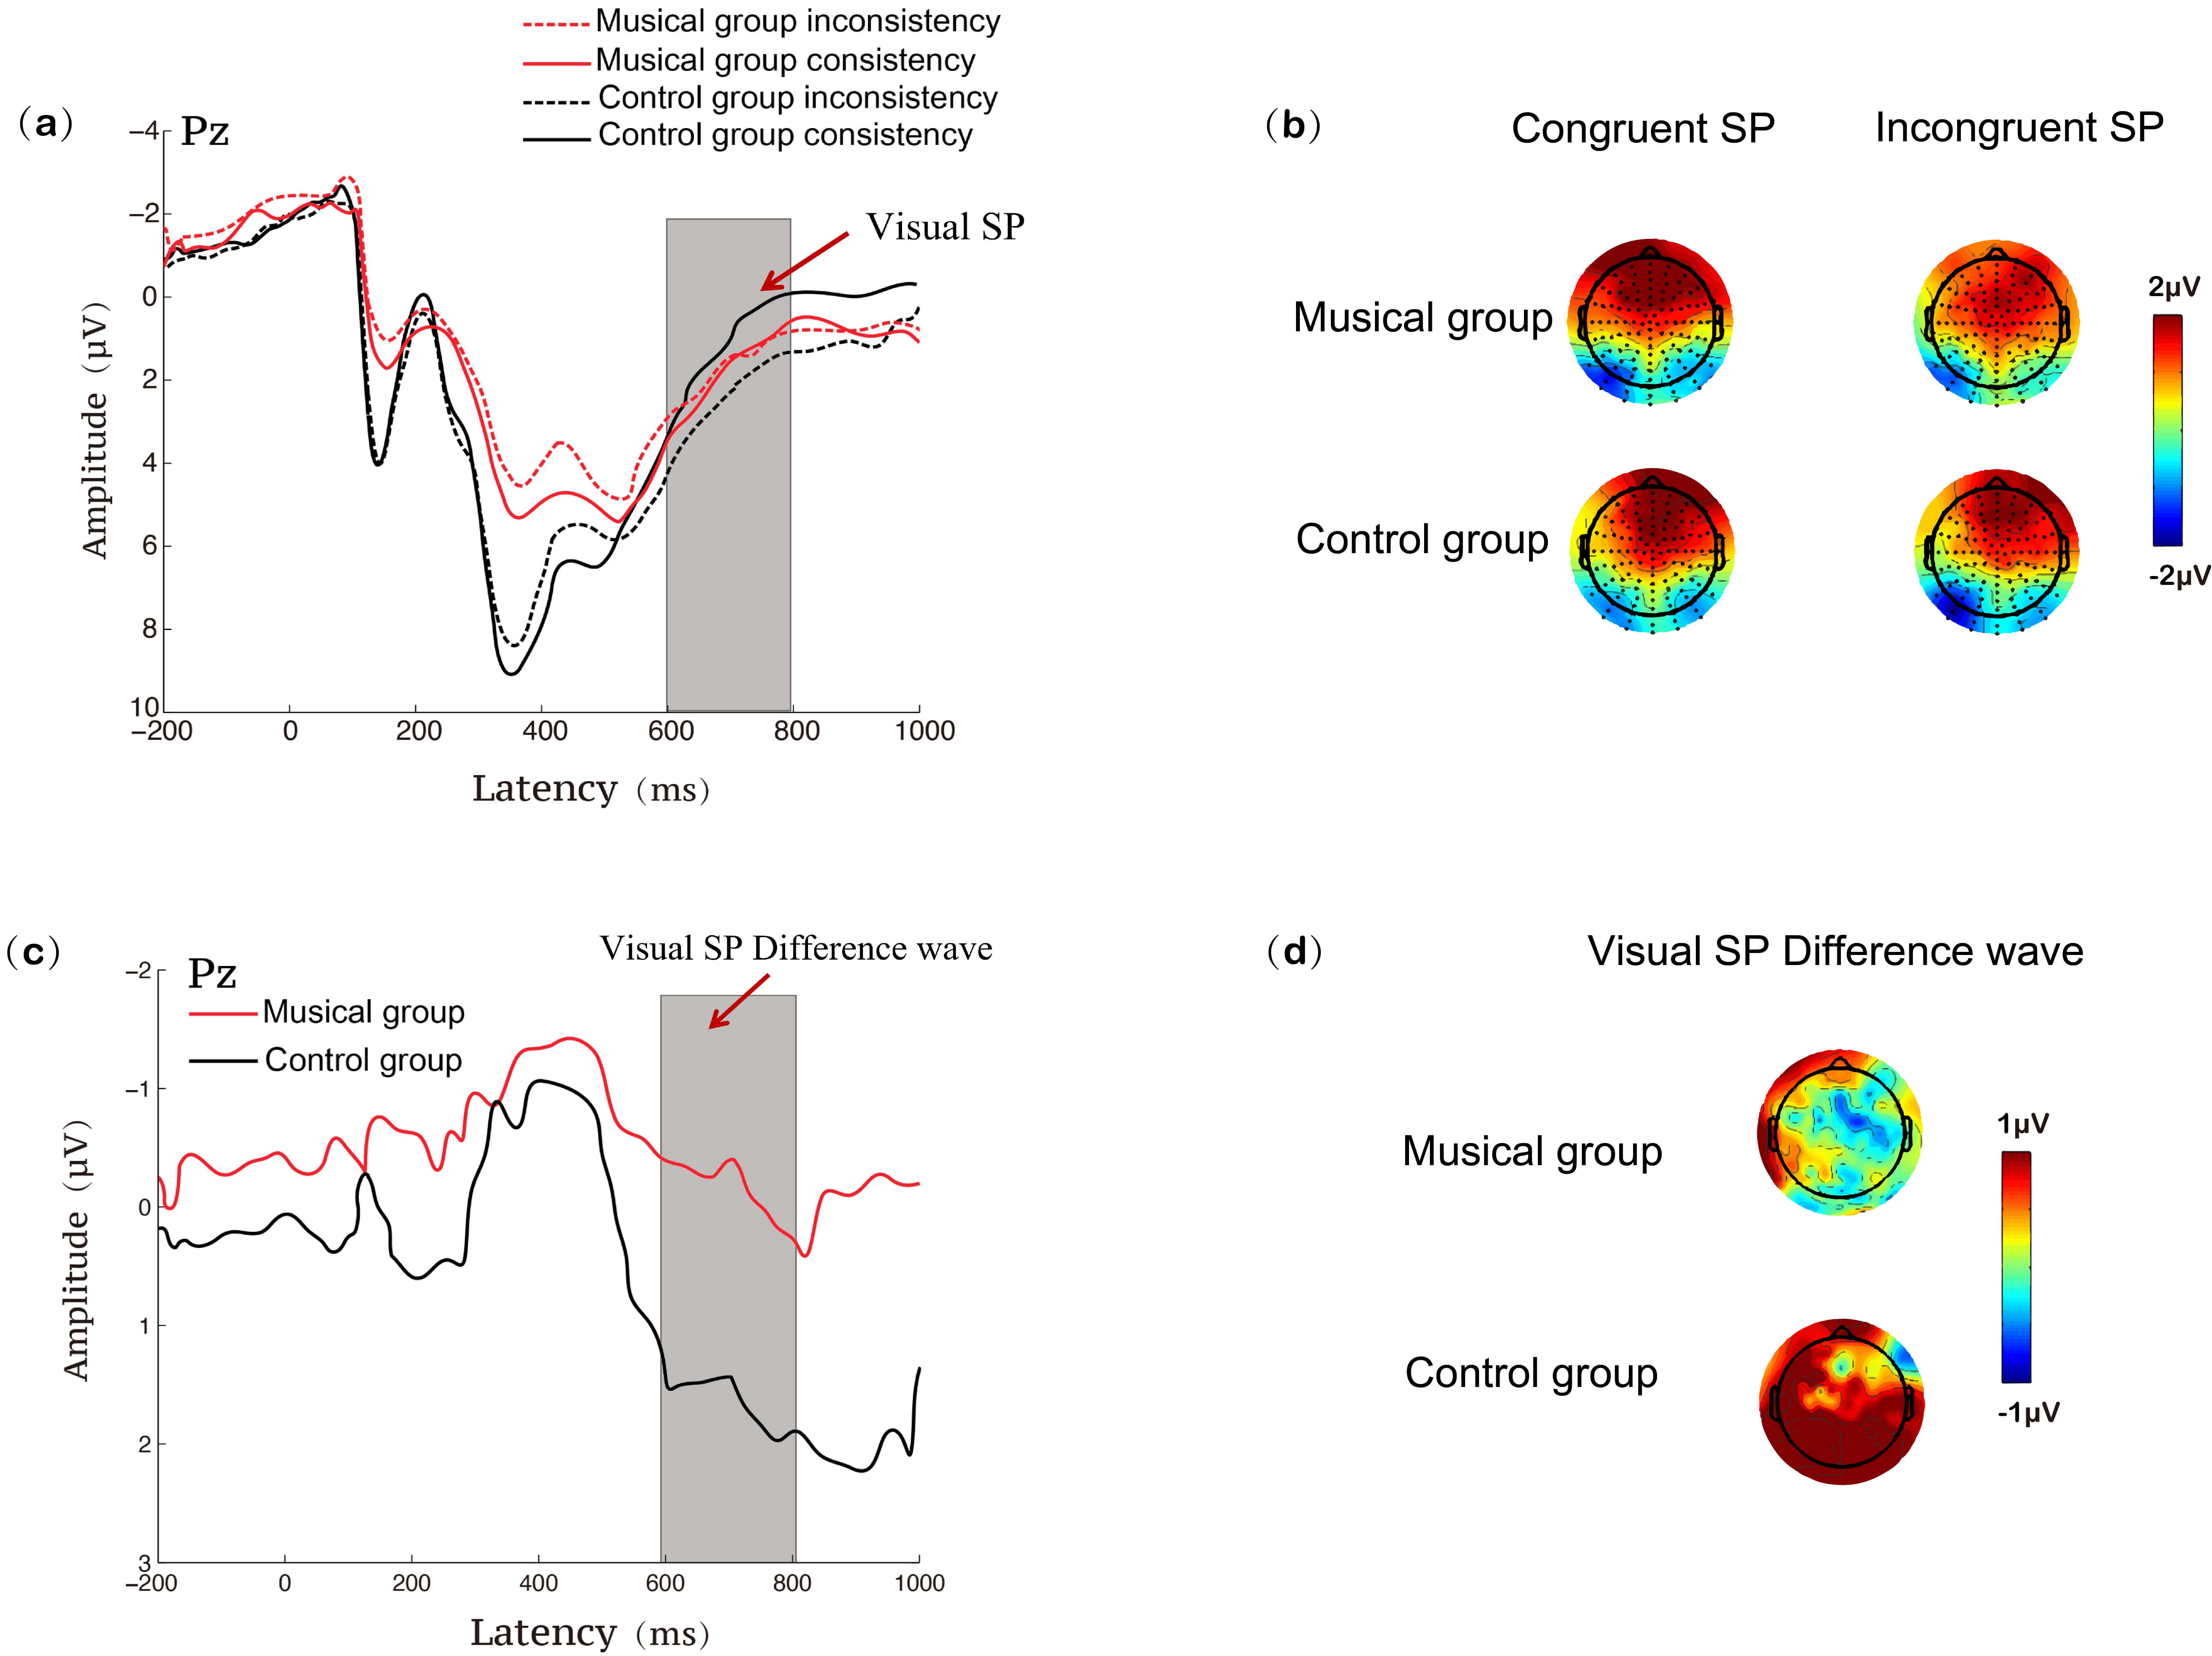 Fig. 4.
ERP results at the Pz site during the visual Stroop task for the music training and control groups. (a) SP waveforms under congruent and incongruent conditions; (b) SP topographies under congruent and incongruent conditions; (c) SP difference waveforms (incongruent minus congruent); (d) SP difference topographies (incongruent minus congruent). SP, sustained potential.
In the auditory modality, the ANOVA results for the mean amplitude of the Ninc
revealed a significant main effect of condition, F(1, 58) = 8.338,
p = 0.005,
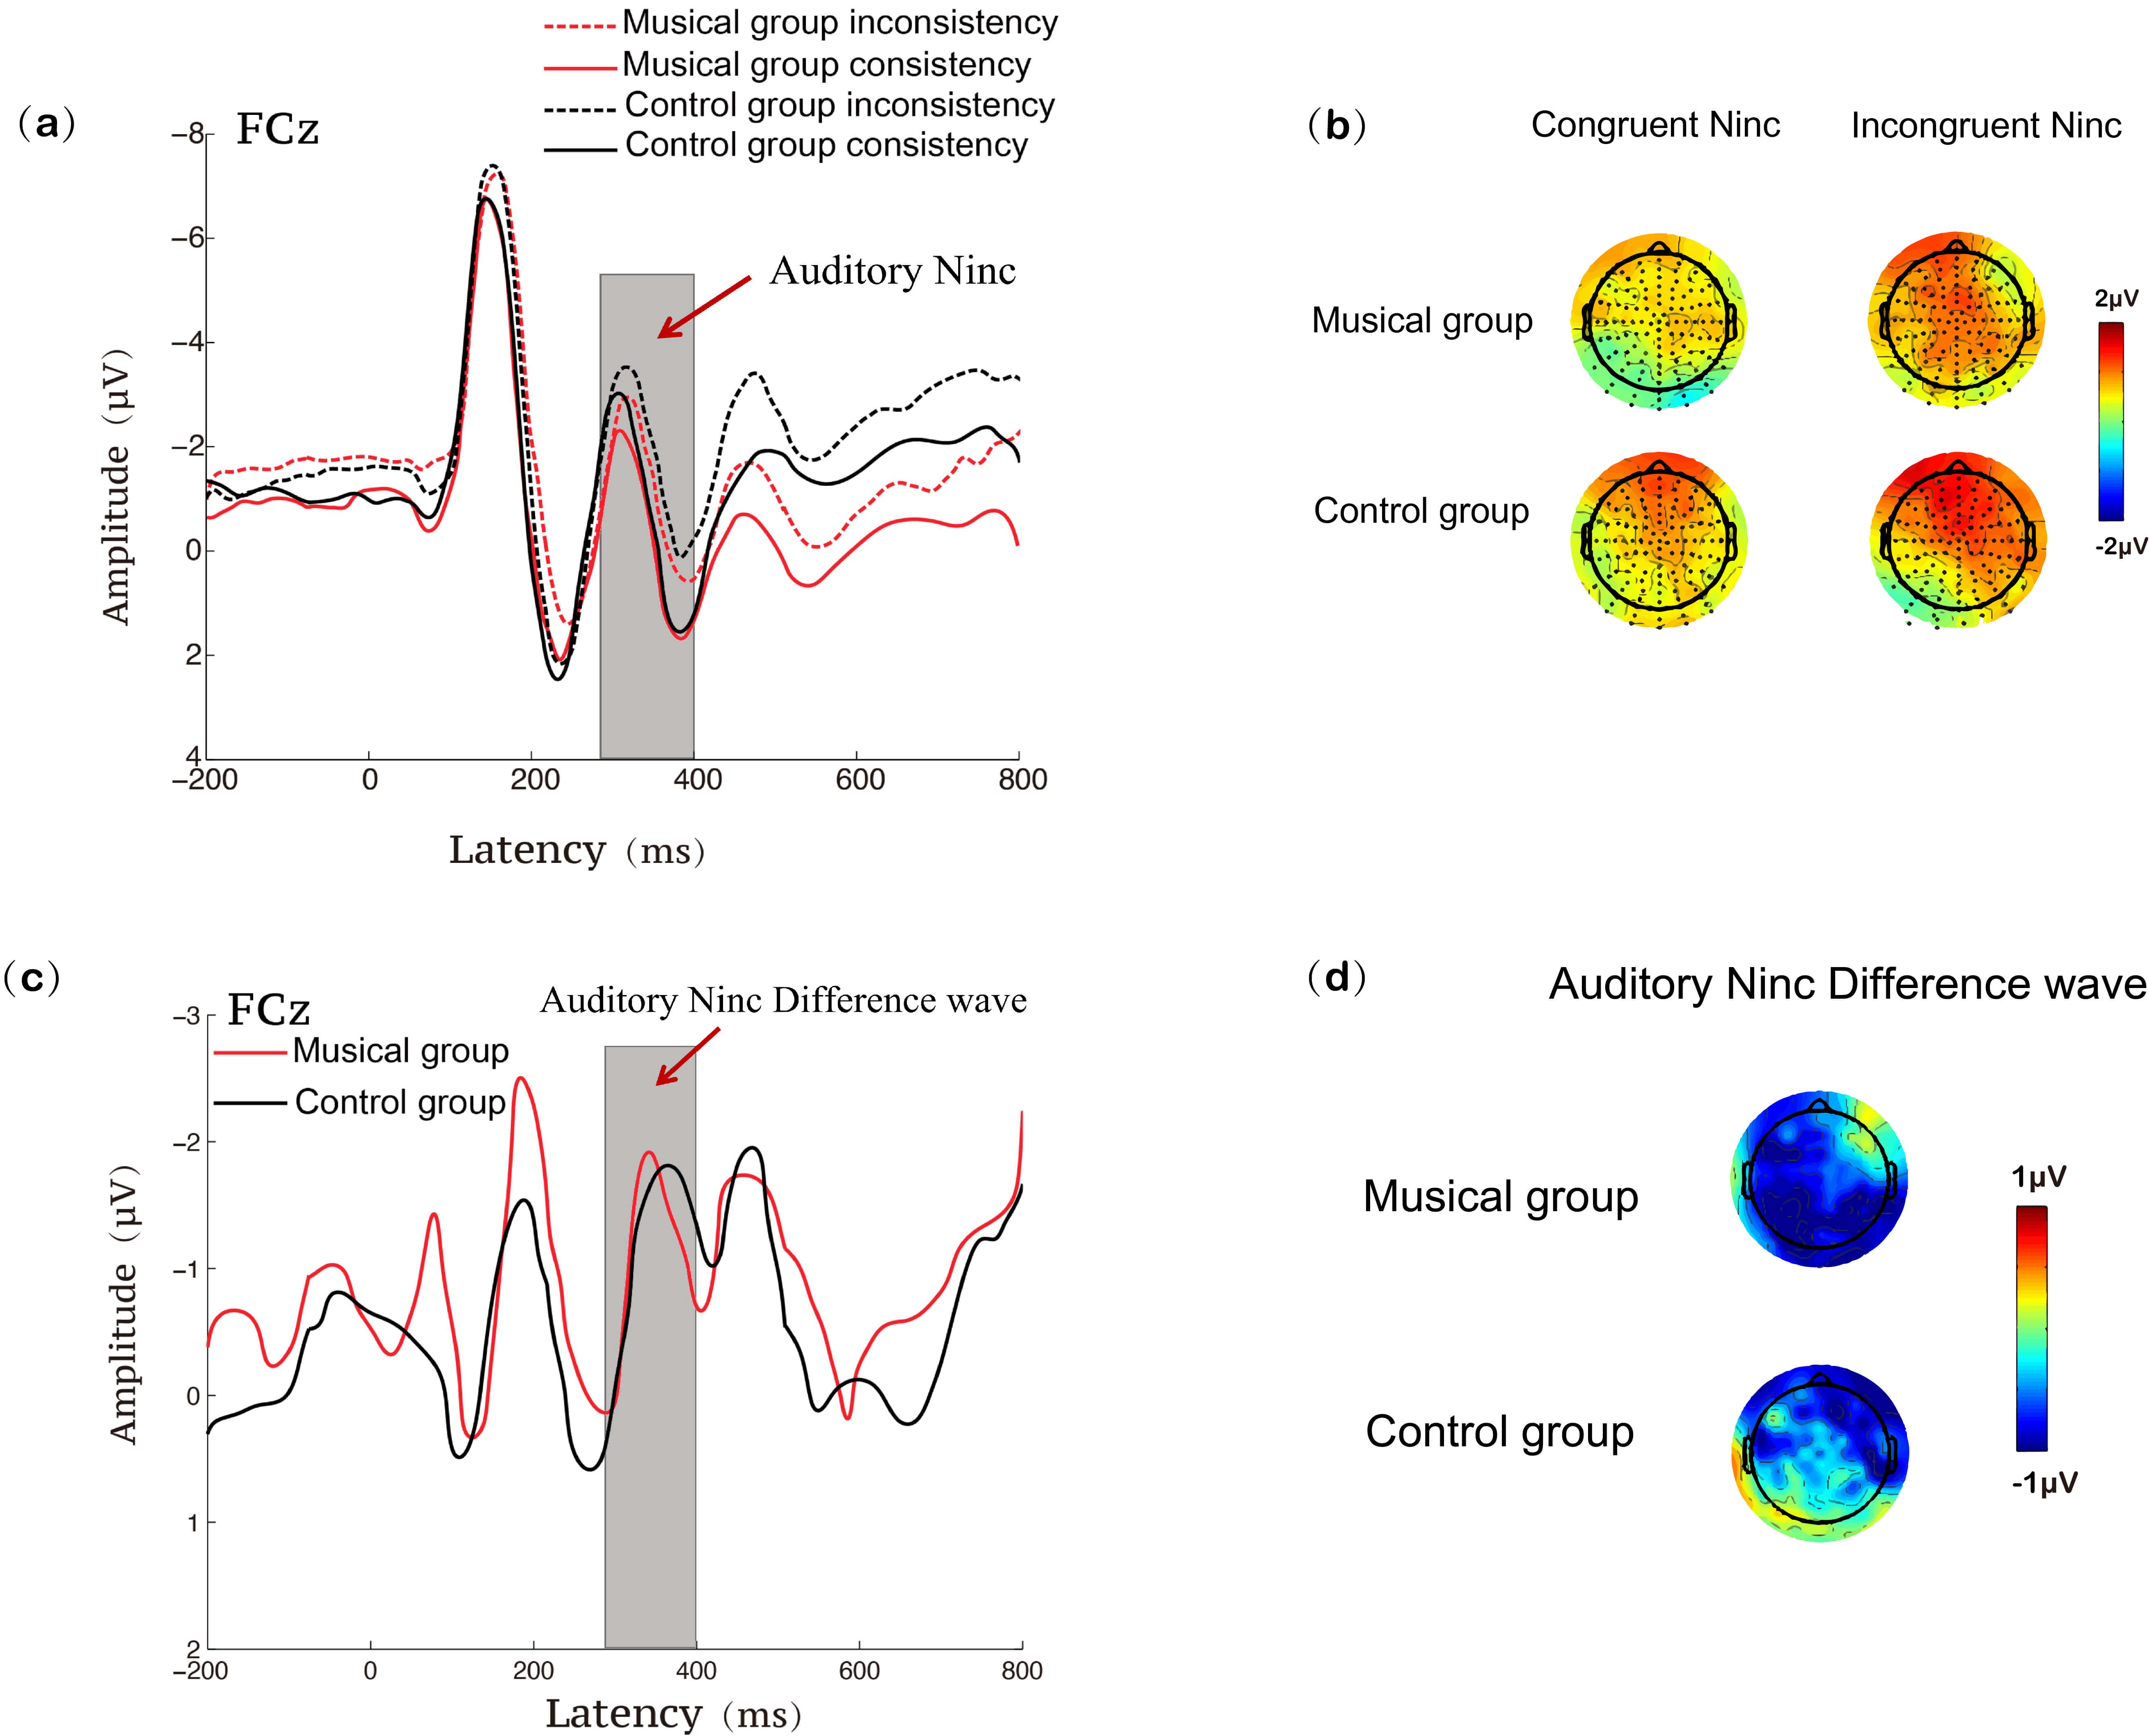 Fig. 5.
ERP results at the FCz site during the auditory Stroop task for the music training and control groups. (a) Ninc waveforms under congruent and incongruent conditions; (b) Ninc topographies under congruent and incongruent conditions; (c) Ninc difference waveforms (incongruent minus congruent); (d) Ninc difference topographies (incongruent minus congruent).
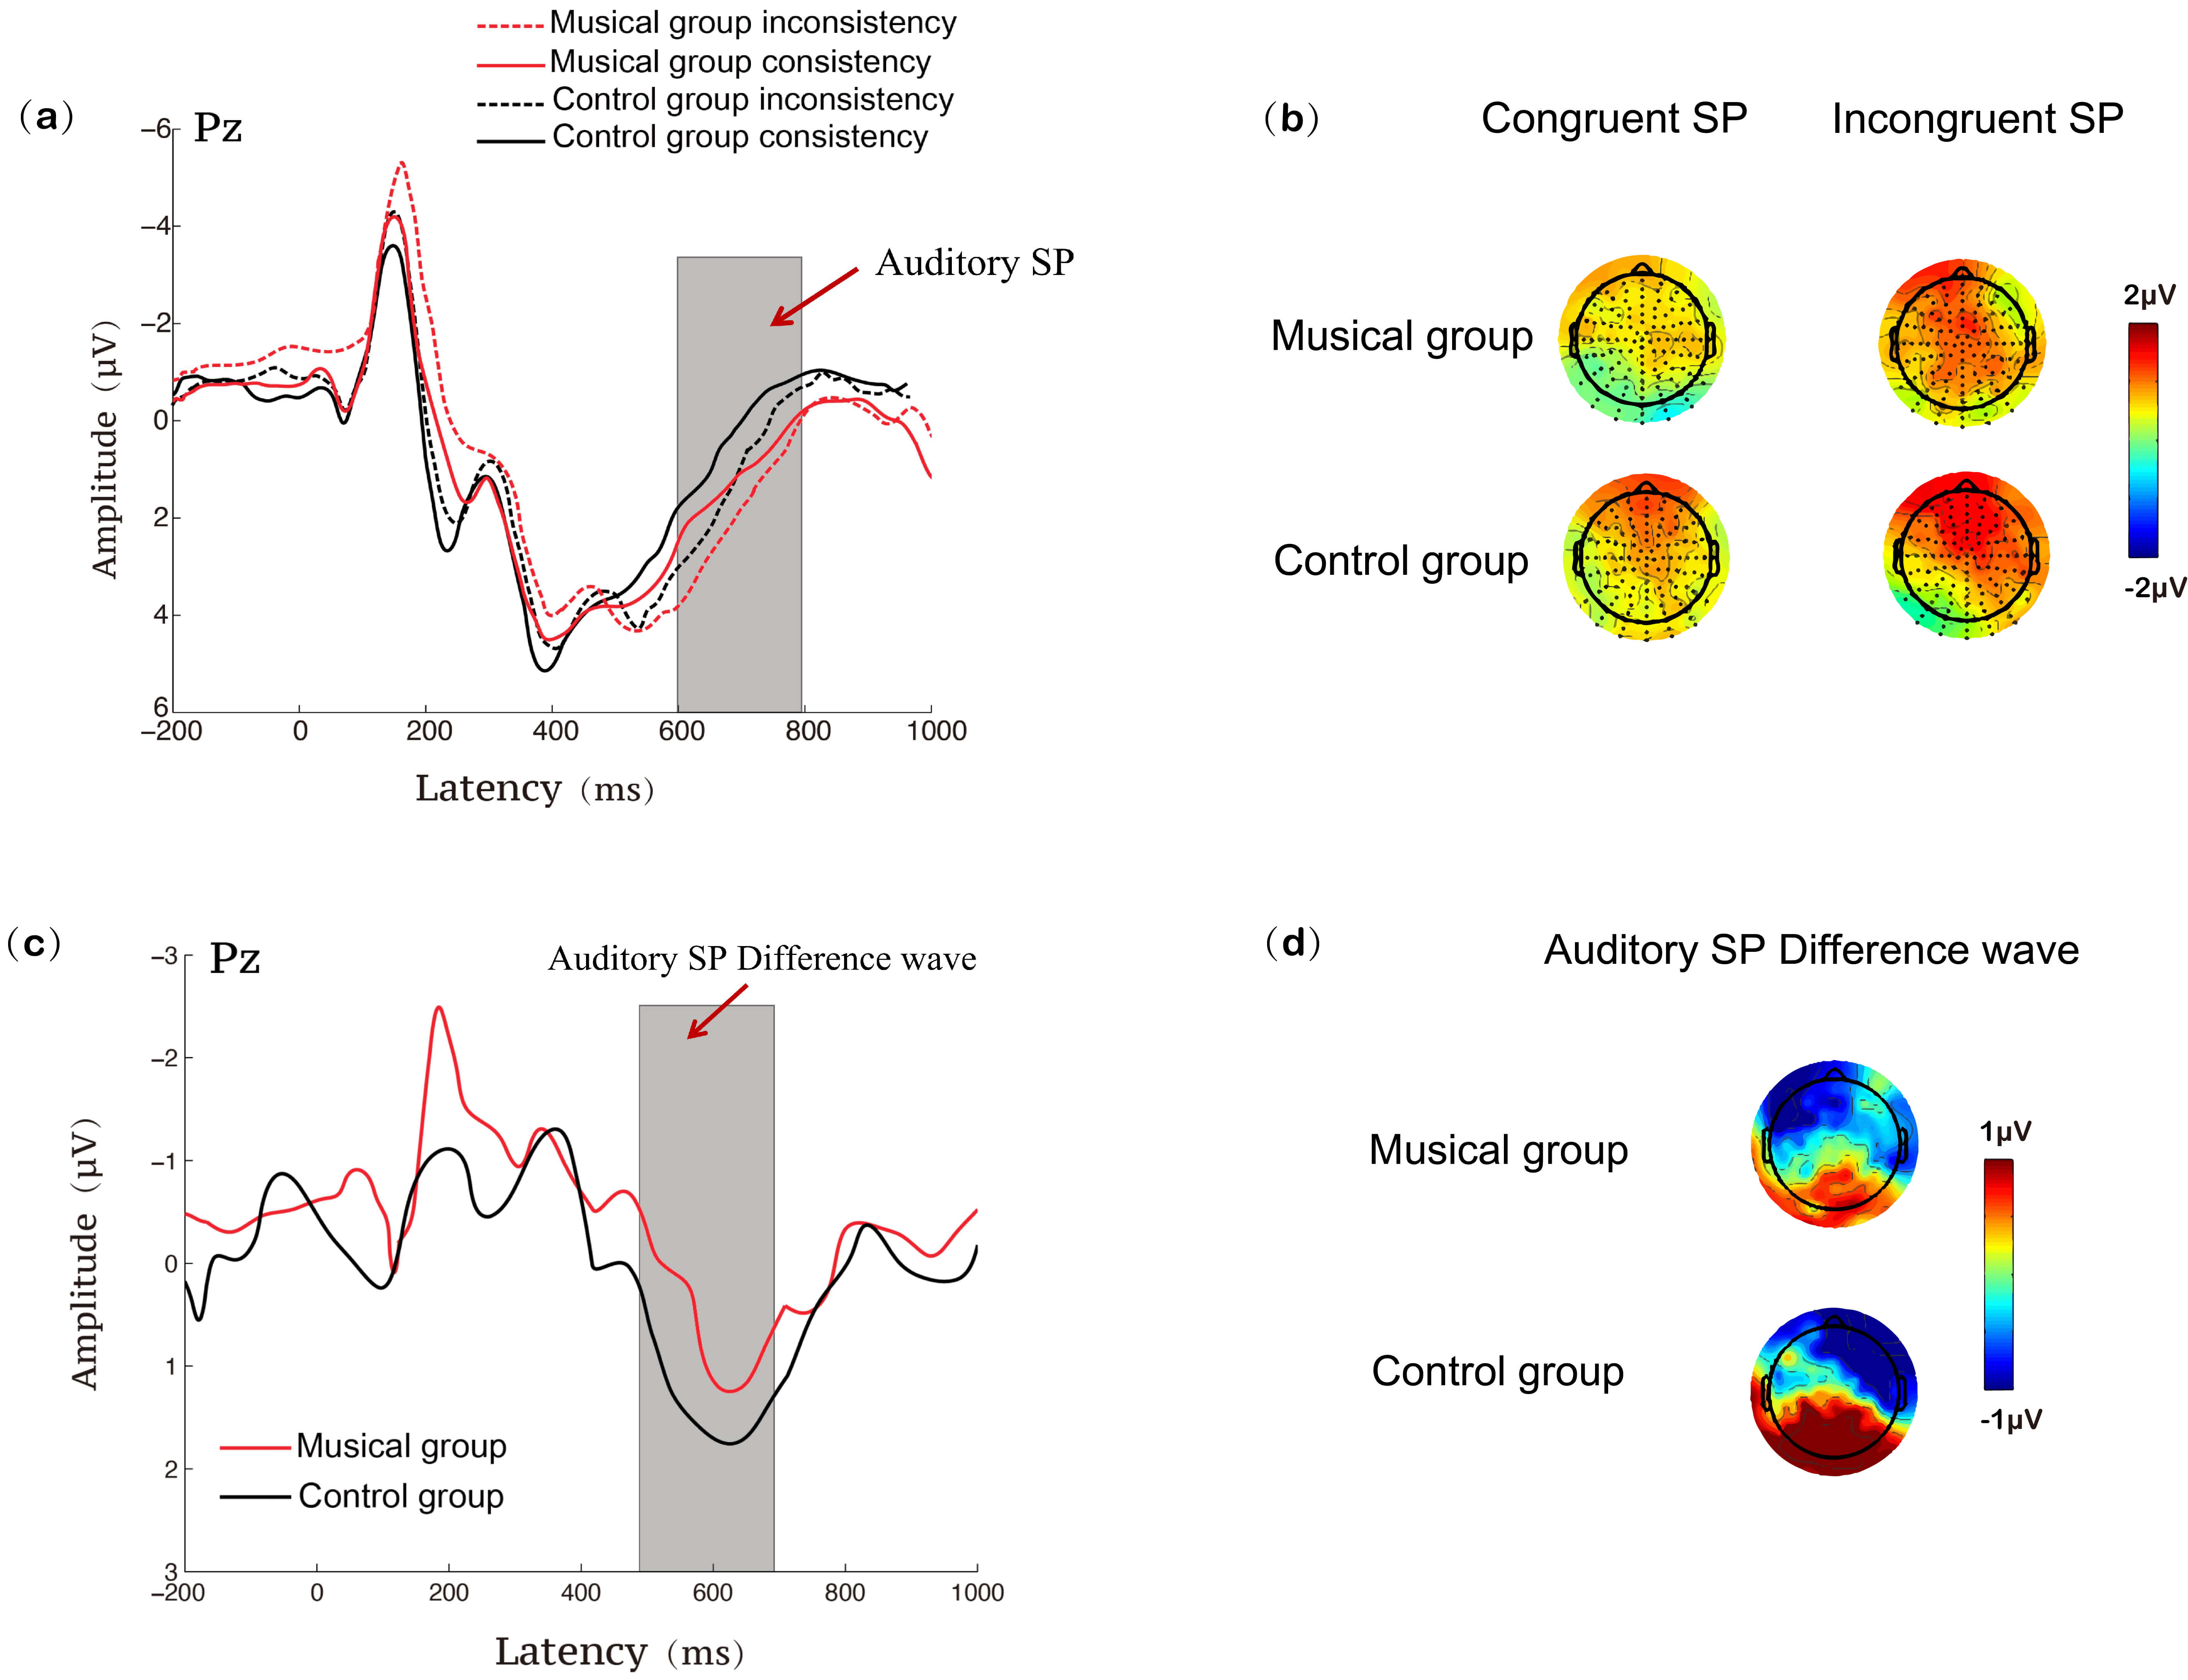 Fig. 6.
ERP results at the Pz site during the auditory Stroop task for the music training and control groups. (a) SP waveforms under congruent and incongruent conditions; (b) SP topographies under congruent and incongruent conditions; (c) SP difference waveforms (incongruent minus congruent); (d) SP difference topographies (incongruent minus congruent).
The means and standard deviations of the amplitudes for the congruent and incongruent conditions across the visual and auditory tasks in both groups are presented in Supplementary Table 1.
In the visual modality, ANOVA on theta-band power within the 400–700 ms time
window revealed no significant main effect of condition, F(1, 58) =
0.196, p = 0.660,
Within the 400–700 ms time window, ANOVA on beta-band power showed no notable
condition impact, F(1, 58) = 0.264, p = 0.609,
In the auditory modality, ANOVA on theta-band power within the 400–700 ms time
window revealed no significant main effect of condition, F(1, 58) =
3.933, p = 0.052,
In the auditory modality, ANOVA on high-beta band power within the 400–700 ms time window demonstrated no substantial primary effect of condition, F(1, 58) = 2.917, p = 0.093, indicating no significant difference in beta power between the congruent and incongruent conditions. The main effect of group was significant, F(1, 58) = 3.999, p = 0.050. Moreover, the interaction between group and condition was significant, F(1, 58) = 6.103, p = 0.016. Independent-sample t-tests revealed that the music training group exhibited significantly lower beta power than the control group under both congruent (t(58) = –3.240, p = 0.002) and incongruent conditions (t(58) = 2.242, p = 0.033; see Fig. 7, and Fig. 8).
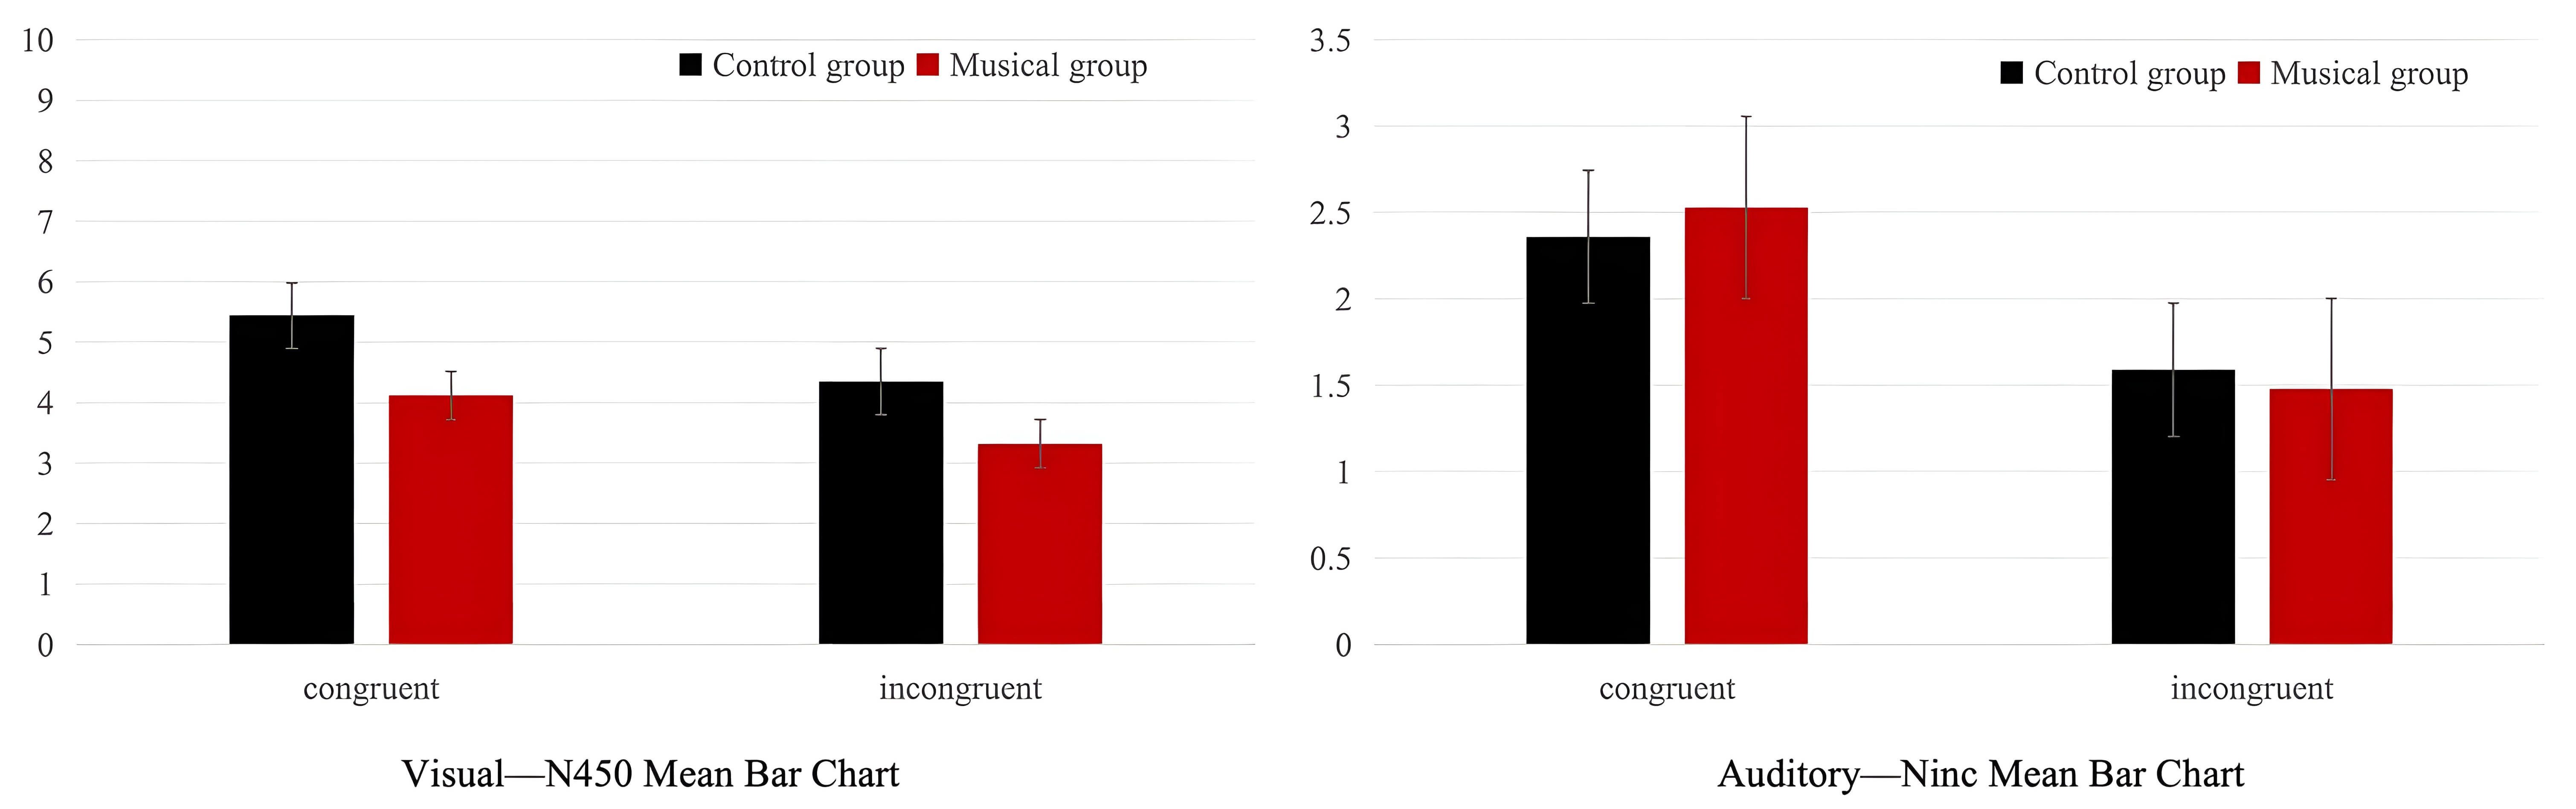 Fig. 7.
Means and standard deviations of the N450 component in the musician and non-musician groups across visual and auditory modalities.
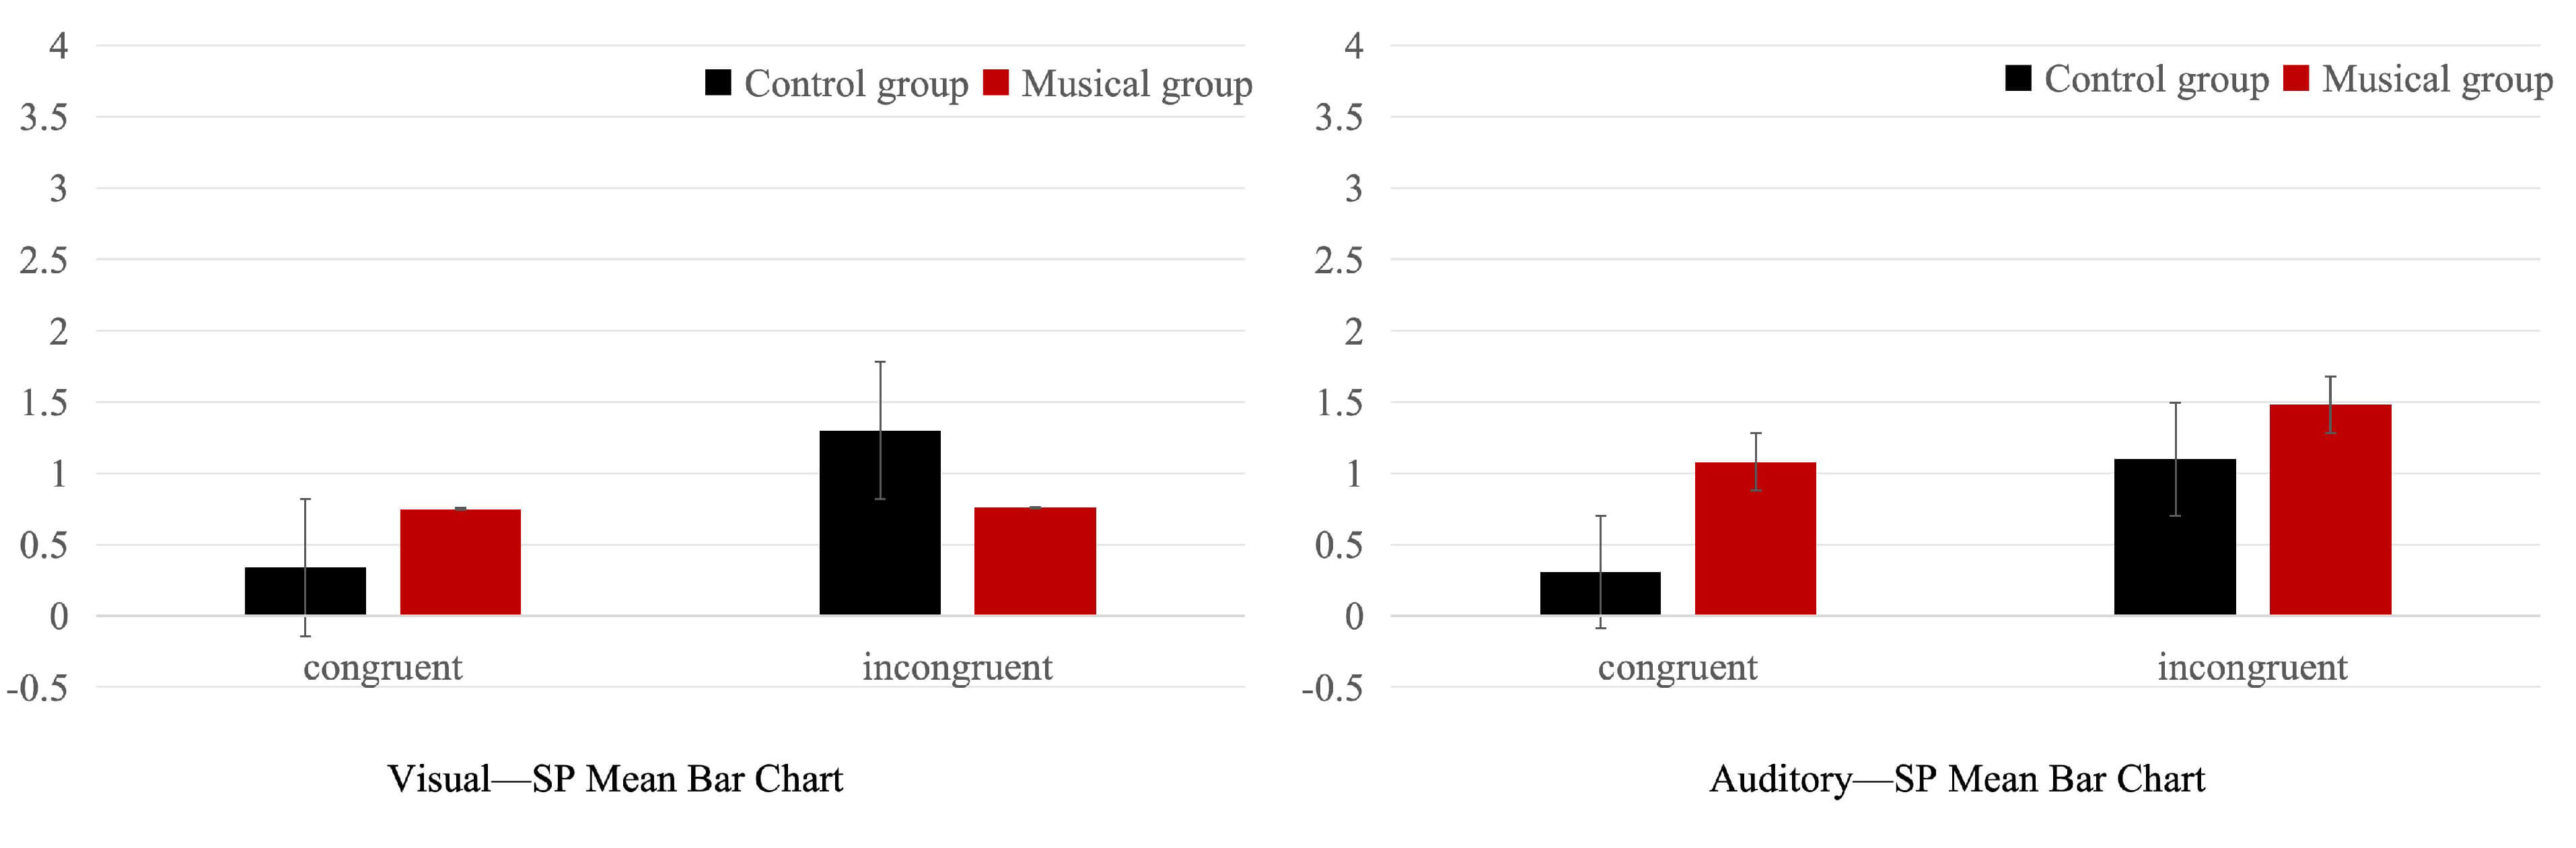 Fig. 8.
Means and standard deviations of the SP component in the musician and non-musician groups across visual and auditory modalities.
Within the 400–700 ms time window, ANOVA on beta-band power demonstrated no
substantial primary effect of condition, F(1, 58) = 2.917, p =
0.093,
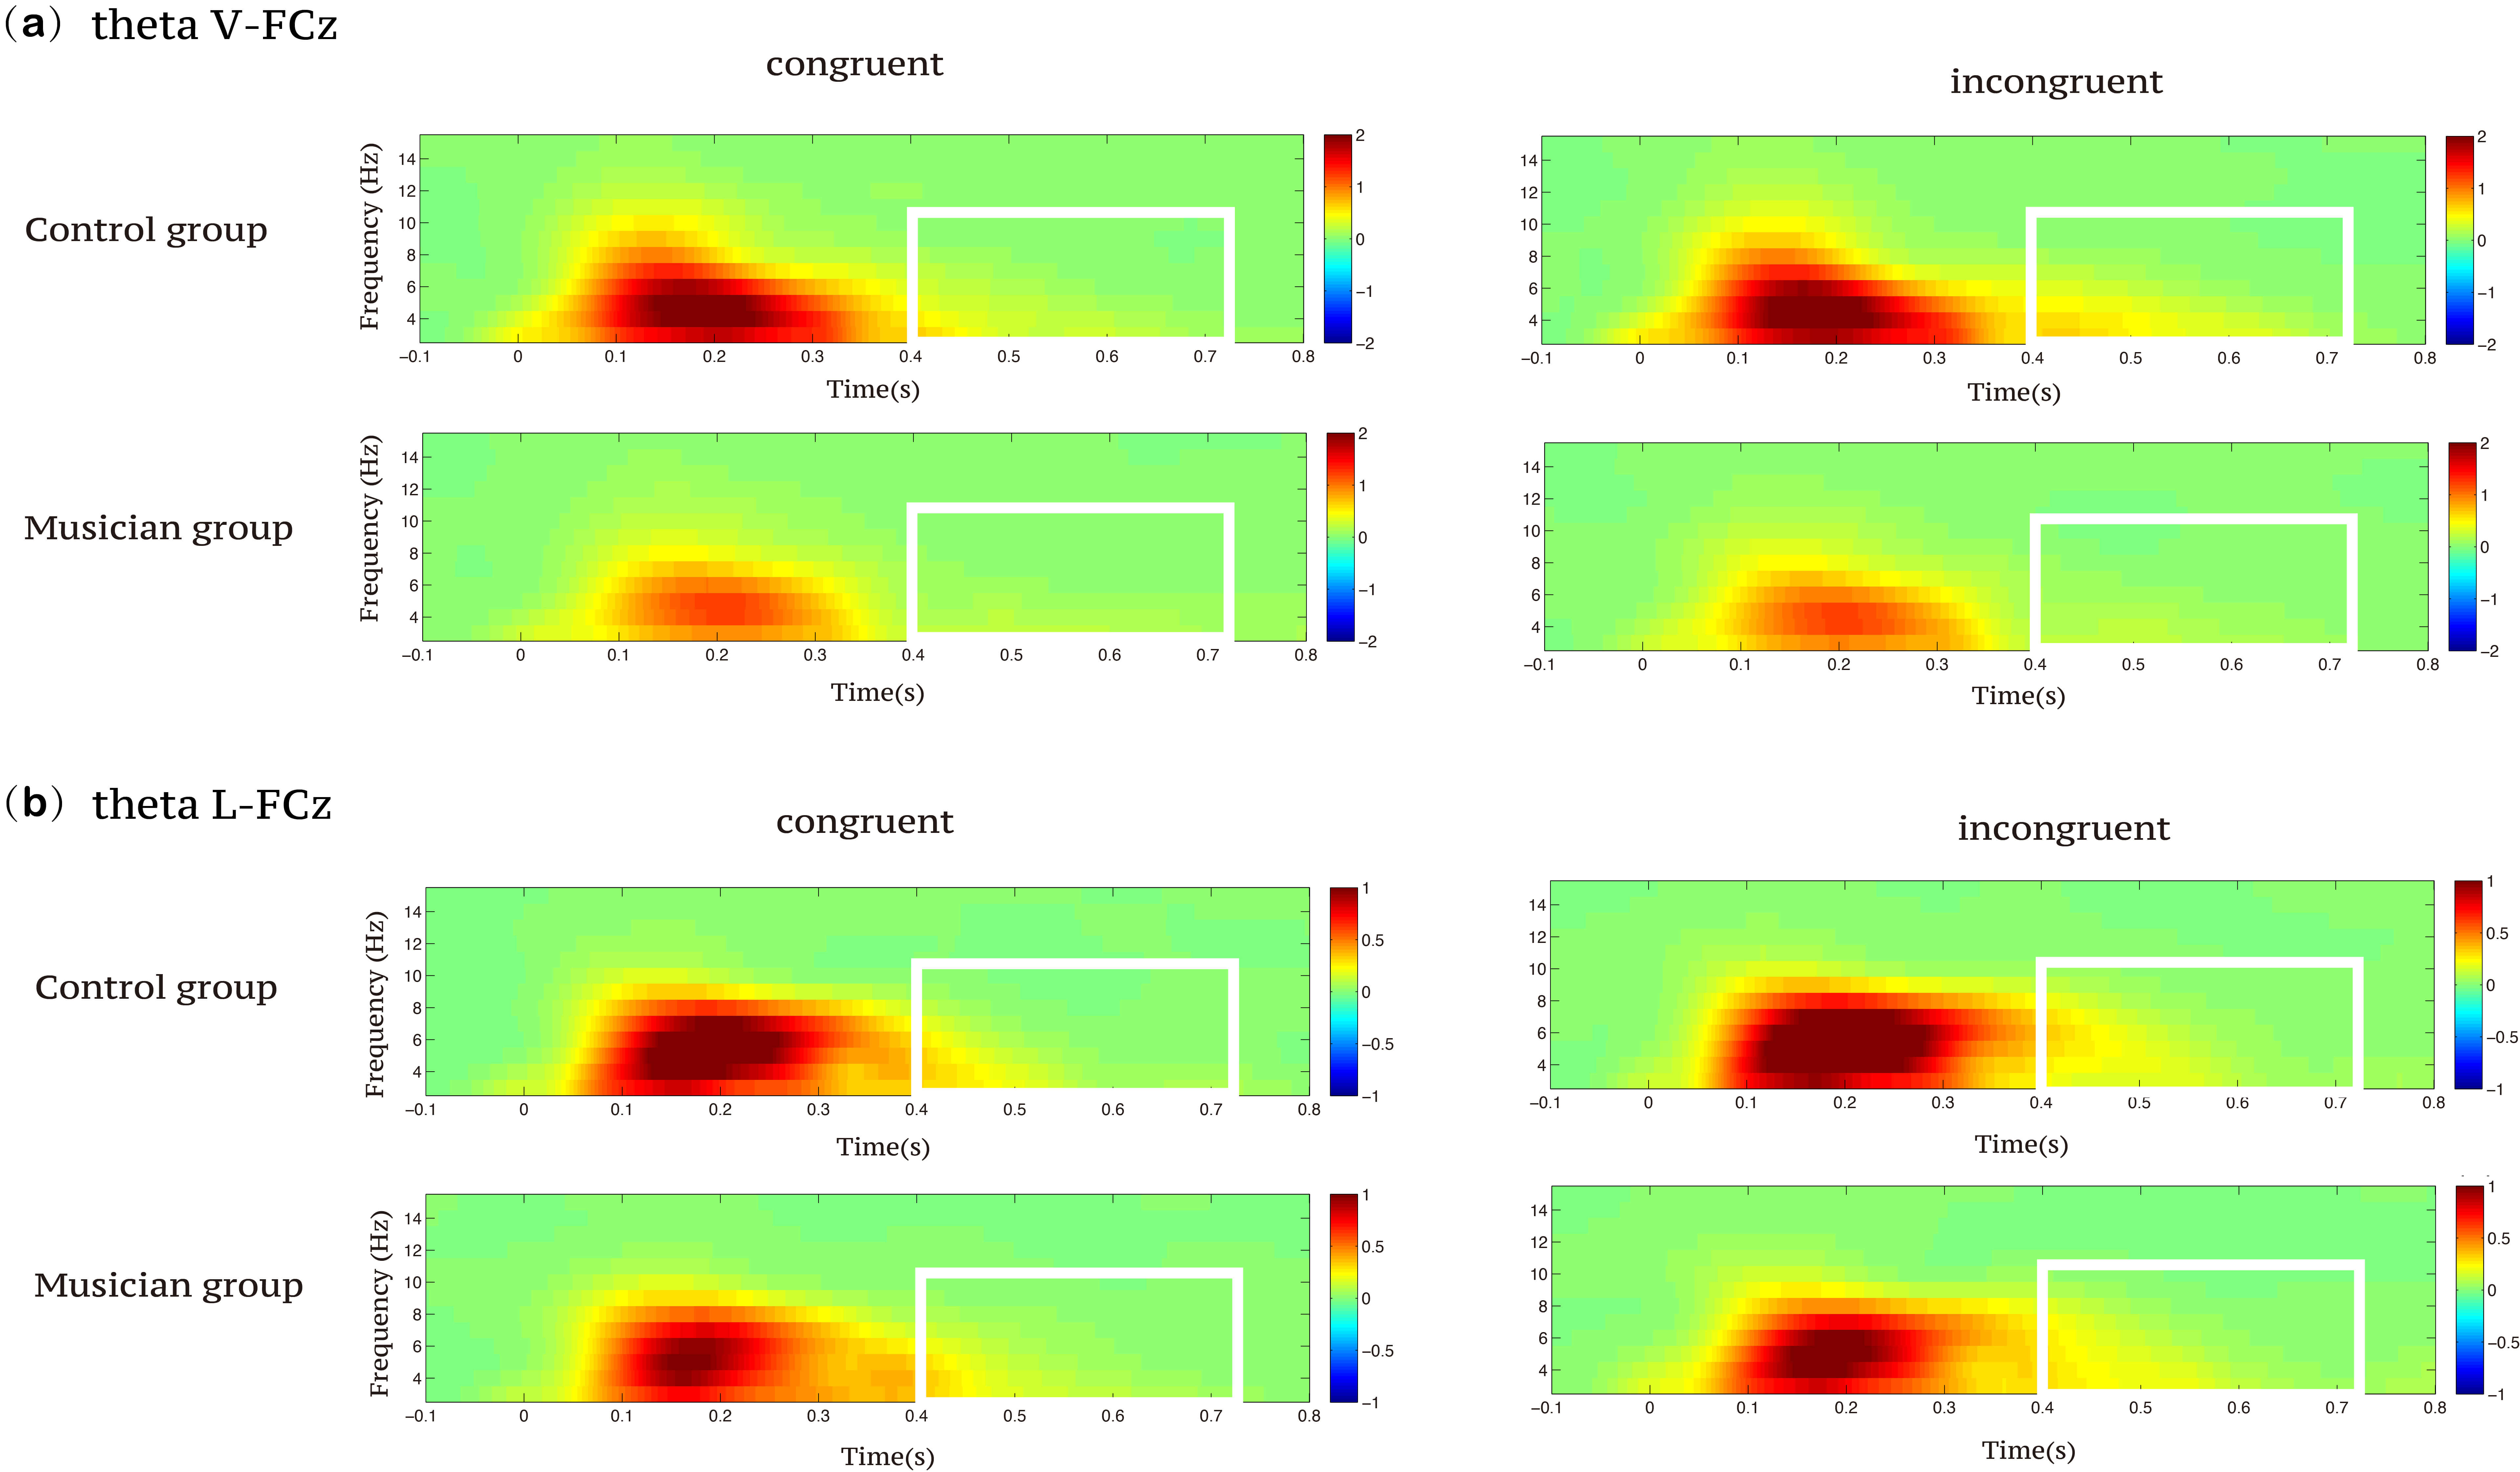 Fig. 9.
Time–frequency representations of theta activity during the Stroop task in the musician and control groups across visual and auditory modalities. (a) Visual task-related theta-band activity at the FCz electrode site. (b) Auditory task-related theta-band activity at the FCz electrode site.
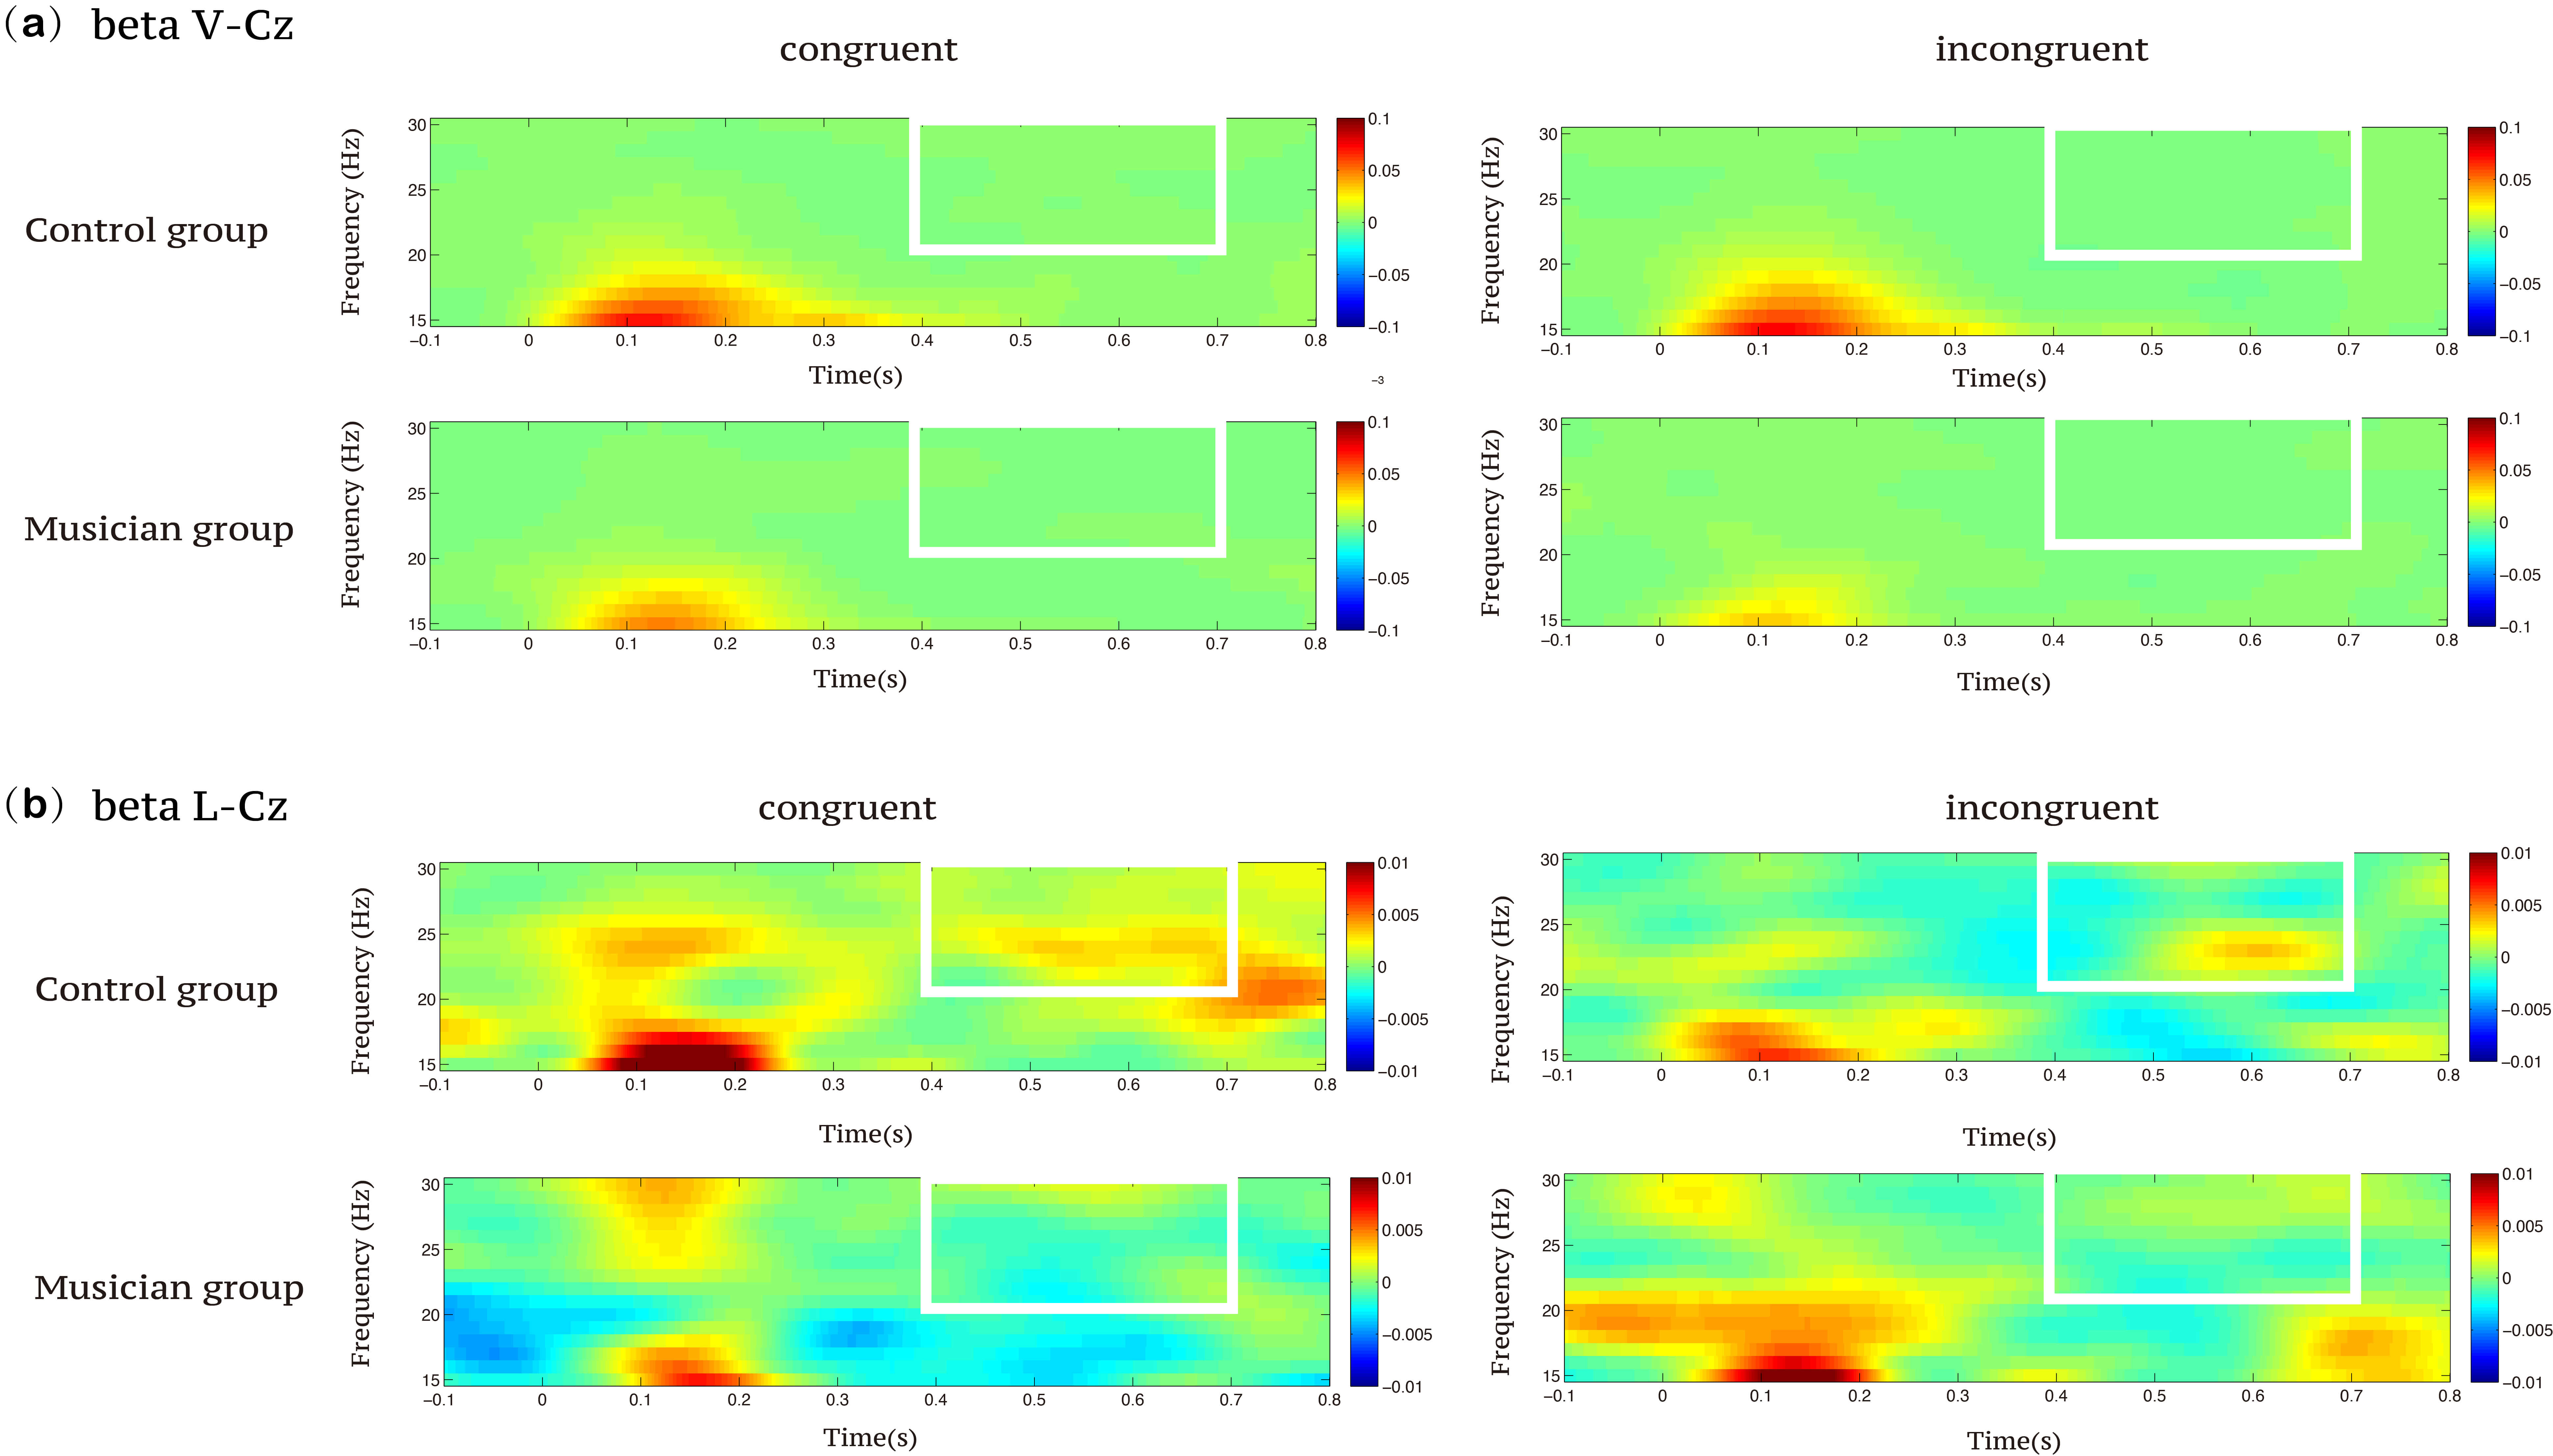 Fig. 10.
Time–frequency representations of beta activity during the Stroop task in the musician and control groups across visual and auditory modalities. (a) Visual task-related beta-band activity at the Cz electrode site. (b) Auditory task-related beta-band activity at the Cz electrode site.
The means and standard deviations of theta and beta power under the congruent and incongruent conditions in the two groups are presented in Supplementary Table 2.
To further assess whether the observed neural effects were functionally related to behavioral performance, we conducted correlation analyses between ERP/time-frequency measures and Stroop behavioral indices. Several significant associations emerged.
(a) The Stroop reaction time (RT) effect was positively correlated with the visual N450 difference wave (r = 0.26, p = 0.048). It showed an even stronger positive correlation with the late SP difference wave (r = 0.38, p = 0.003). These findings suggest that individuals with greater conflict-related ERP effects also exhibit greater behavioral Stroop interference.
(b) In the time-frequency domain, the Stroop RT effect was positively
correlated with left-hemispheric high-
(c) Moreover, in the visual modality, frontal-central
Taken together, these results indicate that neural indices, including slow potentials and oscillatory activity, are not epiphenomenal but are directly related to behavioral measures of Stroop interference. Importantly, the correlations with the Stroop RT effect suggest that at least some of the group-related neural differences reflect variability in conflict-resolution efficiency, rather than purely motor-related processes (see Supplementary Table 3).
To investigate the modality-specific versus modality-general effects of music training on inhibitory control, this study employed ERP and time-frequency analysis techniques to examine differences in inhibitory control between university-level music majors (music training group) and non-music majors (control group) during visual and auditory Stroop tasks. Previous studies have suggested that inhibitory control may exhibit both cross-modal and modality-specific characteristics, although the evidence remains inconsistent. Most research has focused on the visual modality, using N450 and SP to index conflict monitoring and resolution [24, 25]. In contrast, the function of inhibitory control in the auditory modality has been largely neglected, despite auditory processing being a core component of musical training. This study compared a music and non-music group on Stroop tasks in both visual and auditory modalities to examine whether the effects of musical training on inhibitory control are modality-specific.
At the behavioral level, no significant differences were observed between the music training and control groups in terms of accuracy, reaction time, or Stroop interference effects across both the visual and auditory modalities. In the ERP results, a significant group difference was found only in the visual modality; the Stroop-related SP difference wave (incongruent minus congruent) was significantly smaller in the music training group than in the control group. This pattern may indicate that the music group allocated fewer cognitive resources to the visual modality or employed more automated processing strategies to complete the task [35]. This does not preclude the possibility that the music group employed alternative information processing strategies in other brain regions or at different time windows, which warrants further investigation with additional electrode sites and temporal analyses in future studies. However, the time-frequency results revealed that in the auditory modality, the music training group exhibited significantly lower beta-band power under both congruent and incongruent conditions, suggesting more efficient neural resource allocation during auditory conflict resolution. Overall, the findings demonstrate that inhibitory control exhibits modality specificity across visual and auditory channels. Specifically, music training significantly enhanced individuals’ conflict-resolution abilities in the auditory modality, indicating a modality-specific facilitative effect of music training on inhibitory control.
The SP component and beta-band activity are widely recognized as neural indices reflecting conflict resolution processing [24, 36, 37, 38, 39]. Larger SP difference amplitudes typically indicate that individuals recruit more cognitive resources to resolve conflict [24]. Conversely, reductions in beta-band power generally reflect greater neural regulatory efficiency during conflict resolution. Therefore, although the music training group exhibited smaller SP amplitudes in the visual modality, possibly suggesting a lack of advantage in that channel, the significant decrease in beta power observed in the auditory modality reflects more efficient neural processing [36, 40]. Taken together, these results demonstrate that music training significantly enhances the neural regulatory capacity during conflict resolution in the auditory channel. However, no similar advantage was observed in the visual channel, indicating that the music training modality specifically facilitated inhibitory control. Previous studies have found that beta-band activity is associated with response inhibition and conflict resolution abilities, with lower beta power commonly linked to stronger conflict regulation capacity. For example, Bartoli et al. (2018) [41] demonstrated a strong correlation between beta-band neural oscillations and conflict processing, with notably heightened beta-wave amplitudes detected in the dorsolateral prefrontal cortex during tasks involving cognitive incongruity. Similarly, Li et al. (2025) [42] demonstrated that beta band activity is tightly linked to the process of conflict resolution, showing significant changes during the later stages of the Stroop task (920–1040 ms), with lower beta power observed in incongruent trials. Consistent with these findings, the present study revealed that participants in the music training group exhibited lower beta band power, which may reflect more efficient conflict resolution. This suggests that music training enhances conflict resolution ability, potentially in a modality-specific manner, with more pronounced effects on auditory processing.
Musicians’ advantages in conflict resolution may stem from continuous training in conflict monitoring and behavioral regulation abilities during long-term music practice [16, 43]. First, music training is a cognitively demanding, integrative activity in which individuals must continuously monitor multiple dimensions such as rhythm, pitch, and fingering during performance. They need to rapidly adjust their actions based on auditory feedback and bodily sensations, a process that requires ongoing error detection and conflict monitoring [44, 45]. Especially during instrumental performance, and more so in ensemble or improvisational contexts, performers must maintain high levels of attention and focus on complex tasks while actively suppressing interference from both internal sources (e.g., mind-wandering and irrelevant thoughts) and external distractions (e.g., environmental noise and phone notifications). Additionally, they must coordinate their timing and intonation with others [10], placing high demands on cognitive control systems. Therefore, long-term music training may enhance individuals’ selective processing of goal-relevant information during conflict tasks and improve their ability to inhibit irrelevant distractions [46]. Secondly, the inhibitory control advantages exhibited by the music training group may also arise from long-term training-induced plasticity in brain regions related to inhibitory control, such as the dorsolateral prefrontal cortex, anterior cingulate cortex, supplementary and pre-supplementary motor areas (SMA/pre-SMA), insula, and inferior frontal gyrus [47]. These regions are core neural substrates of executive function and conflict resolution [48, 49]. Previous studies indicated that musical training intensity correlates with inhibitory control-related brain activity. For example, James et al. (2014) [50] used functional magnetic resonance imaging (fMRI) and found a significant positive correlation between musical training experience and gray matter density in the middle orbitofrontal gyrus of the right hemisphere and the left inferior frontal gyrus. Fauvel et al. (2014) [51] reported that a music training group showed significantly enhanced functional connectivity between the right inferior frontal gyrus and the anterior cingulate cortex compared to the control group. These brain regions are thought to play key roles in inhibitory control processes [52, 53, 54]. Additionally, Gaser and Schlaug (2003) [55] found that amateur musicians exhibit moderate increases in gray matter volume compared with non-musicians and professional musicians. Other evidence also indicates structural and functional differences in the prefrontal cortex between musicians and non-musicians [51].
Music training shows a more pronounced advantage in the auditory modality than in the visual modality, a phenomenon supported by research across multiple dimensions, including sensory channel processing advantages and neural plasticity. For example, Sharma et al. (2019) [56] found that musicians outperformed controls under incongruent stimulus conditions in an auditory Stroop task, indicating that music training significantly enhanced inhibitory control efficiency in the auditory system during conflict resolution. This suggests that the facilitative effect of music training on inhibitory control is not universally applicable across all sensory modalities but is more explicitly manifested in the auditory channel, closely related to its processing pathways. Furthermore, music training can continuously shape individuals’ multilevel auditory processing pathways from the auditory brainstem to the cortex. Studies have shown that early musical experience promotes the development of key regions, such as the left temporal auditory cortex, with musicians generally exhibiting greater cortical thickness and enhanced auditory perceptual abilities [57]. Additional research has demonstrated that musicians exhibit superior auditory perception in noisy environments, with their auditory brainstem responses showing more precise neural encoding of speech signals than non-musicians [58].
It is worth noting that this study employed a cross-sectional design comparing a music training group with a control group, which limits the ability to establish a causal relationship between music training and inhibitory control. Additionally, it cannot entirely rule out potential individual differences between the two groups, such as personality traits and baseline cognitive abilities [59]. Therefore, this study controlled for extraneous variables that may affect inhibitory control, including age and intelligence level, as rigorously as possible. This strict control of variables may partially explain why no significant group differences were found in visual modality. This result differs from those of previous studies that have reported differences in visual conflict processing. We speculate that such discrepancies may stem from the varying degrees of control over confounding variables in different research designs. Therefore, to interpret the nonsignificant group differences observed in the visual modality, we considered the effect sizes and their 95% confidence intervals. The intervals indicated that any differences were minimal and likely of little practical significance, suggesting that the findings more accurately reflected the limited impact of musical training on visual conflict processing than the complete absence of an effect. In contrast, time-frequency analysis in the auditory modality revealed a significant group difference in beta-band power, with the music training group exhibiting a distinct neural advantage. The observed modulation of beta activity, which may reflect enhanced efficiency in resolving auditory conflicts among musically trained individuals, suggests that the facilitative effects of music training on inhibitory control are primarily modality-specific and most prominent in the auditory domain. The identification of this modality-specific pattern offers novel evidence of the domain-constrained benefits of musical training and provides a promising direction for future research aimed at uncovering the underlying neural mechanisms.
Our study aimed to investigate the modality-specific versus modality-general effects of music training on inhibitory control by examining processing differences across perceptual modalities. To this end, we employed ERP and time–frequency analysis techniques to compare the neural processing characteristics and behavioral performance of two groups during both visual and auditory Stroop tasks. The results revealed that significant group differences emerged only in the beta-band power during the auditory modality: the music-trained participants demonstrated reduced beta activity compared to controls under both congruent and incongruent circumstances. These findings suggest that inhibitory control is modality-specific. Specifically, music training primarily enhanced conflict resolution abilities in the auditory modality, indicating a facilitative effect of music training on inhibitory control within auditory processing contexts.
The original contributions presented in this study are included in this article/supplementary material, further inquiries can be directed to the corresponding authors.
JN, JJC, JRM: the acquisition, analysis, and interpretation of data. YL: design of the work, funding acquisition, project administration, supervision. JN, JJC: writing–review & editing. All authors contributed to editorial changes in the manuscript. All authors read and approved the final manuscript. All authors have participated sufficiently in the work and agreed to be accountable for all aspects of the work.
These experiments were approved by the Ethics Committee of the School of Electronics and Information Engineering at Southwest University (Ethics Approval No. 18A08998) and complied with local regulations and institutional requirements. All participants provided written informed consent before their involvement in the study. The study was carried out in accordance with the guidelines of the Declaration of Helsinki.
We would like to express our sincere gratitude to all the participants in the study.
The authors declare that financial support was received for the research and/or publication of this article. This study was partially supported by the National Natural Science Foundation of China (NSFC) Young Scientists Fund (Grant No. 32200823), Chongqing Postgraduate Education and Teaching Reform Research Project (No. YJG233025), Chongqing Education Science “14th Five-Year Plan” Research Project (No. K23ZG2020062), Chongqing 2024 Municipal Higher Education (Undergraduate) Teaching Reform Research Project (No. 243045).
The authors declare no conflict of interest.
Supplementary material associated with this article can be found, in the online version, at https://doi.org/10.31083/JIN45358.
References
Publisher’s Note: IMR Press stays neutral with regard to jurisdictional claims in published maps and institutional affiliations.