


 , Tong Li 2,†, Lin Li 3, Baojin Chen 2, Yunna Zhou 2, Shangming Song 4, Shifeng Yang 2, Cuicui Li 2,*
 , Ximing Wang 2,*
1 School of Medical Imaging, Binzhou Medical University, 264003 Yantai, Shandong, China
2 Department of Radiology, Shandong Provincial Hospital Affiliated to Shandong First Medical University, 250021 Jinan, Shandong, China
3 Department of Radiology, Qingdao Central Hospital, 260042 Qingdao, Shandong, China
4 Department of Cardiology, Shandong Provincial Hospital Affiliated to Shandong First Medical University, 250021 Jinan, Shandong, China
†These authors contributed equally.
Abstract
Individuals with atrial fibrillation (AF) are more likely to develop mild cognitive impairment (MCI), but the underlying mechanisms remain unclear. The study aimed to investigate cognitive-related gray matter (GM) volume alterations in stroke-free individuals with AF using voxel-based morphometry (VBM).
3D-T1-weighted magnetic resonance imaging (MRI) scans were obtained from 40 stroke-free AF individuals with MCI (AF-MCI), 40 stroke-free AF individuals with normal cognition (AF-NC), and 40 healthy controls (HCs). GM atrophy was assessed using VBM.
The results revealed widespread GM atrophy in stroke-free individuals with AF, regardless of their cognitive status, with more pronounced GM loss in the AF-MCI group. Significant GM volume reductions were found in several brain regions, including the temporal lobe, parahippocampal gyrus (PHG), cerebellum, and frontal lobe, in the AF-MCI group. Notable reductions in the left PHG and right inferior parietal lobule were observed in the AF-MCI group compared with the AF-NC group. Moreover, decreased GM volume in the left PHG, right superior temporal pole, and right orbital part of the inferior frontal gyrus was positively correlated with cognitive performance.
Among AF individuals free of stroke, degeneration of the PHG correlates with a greater probability of developing MCI. Structural alterations in the brain may be related to the transition from normal cognition to MCI in stroke-free individuals with AF. This study highlights the potential for targeted interventions aimed at slowing cognitive decline in stroke-free AF individuals by focusing on these structural alterations.
Keywords
- atrial fibrillation
- mild cognitive impairment
- gray matter
- magnetic resonance imaging
Since the heart–brain continuum hypothesis was proposed, increasing attention has been given to the connection between cognitive impairment (CI) in older adults and cardiovascular diseases [1]. Atrial fibrillation (AF) is among the most common cardiac rhythm disorders, impacting roughly 50 million people across the globe [2]. Apart from the recognized risks to the cardiovascular system, including stroke, heart failure, and increased mortality, accumulating research suggests that AF is also associated with adverse neurological outcomes, particularly cognitive decline [3]. Multiple meta-analyses have indicated that AF may increase the likelihood of cognitive deterioration and dementia, even in patients who have never experienced a stroke [4, 5, 6, 7, 8]. Mild cognitive impairment (MCI), which has attracted increasing research attention, is considered a transitional phase between normal cognitive aging and Alzheimer’s disease (AD) [9]. Prior investigations have demonstrated that individuals with AF face a significantly higher probability of developing MCI [10]. Early detection of MCI and investigation into its neuropathological mechanisms may provide an opportunity for timely intervention before irreversible neurological damage develops in AF individuals.
With the advancement of neuroimaging technologies such as magnetic resonance imaging (MRI) and positron emission tomography, earlier and more accurate diagnoses of MCI are now possible [11]. Structural MRI (sMRI), known for its stability, noninvasive nature, absence of radiation, and ease of use, has become a key tool in this area. Among the different sMRI analysis methods, voxel-based morphometry (VBM) has gained popularity due to its ease of use and the relatively consistent, reliable outcomes it provides [12]. VBM is an automated approach that identifies volumetric differences between groups by conducting statistical analyses on each voxel within the image [12]. Additionally, it can be employed to perform voxel-wise regression, allowing for the exploration of neuroanatomical correlates of CI and clinical characteristics [11]. Over the past decade, some studies have explored macrostructural brain features in individuals with AF using sMRI, although the results have been inconsistent. In a study with a relatively small sample size, AF was found to be associated with reduced volume in the right frontal base and the inferior portion of the right cerebellum [13]. In addition, a large-scale study based on the UK Biobank cohort demonstrated that AF individuals exhibited lower bilateral gray matter (GM) volume in the primary visual cortex (V1), primary somatosensory cortex (S1), primary motor cortex (M1), as well as in the middle and inferior temporal gyri [14]. Previous studies have focused primarily on AF individuals, including those with CI or MCI and those without MCI. This inconsistency may be related to the cognitive status of AF individuals. Therefore, it is essential to further investigate alterations in the brain GM in AF individuals, with or without MCI, compared with healthy controls (HCs).
This study aimed to apply VBM to compare GM volume in three groups: stroke-free AF individuals with MCI (AF-MCI), stroke-free AF individuals with normal cognitive function (AF-NC), and HCs. Additionally, we sought to investigate the relationships between morphological patterns and cognitive function in the AF-MCI group.
The study was conducted from April 2023 to April 2025, with approval from the Shandong Provincial Hospital Research Ethics Committee. Informed consent was obtained from all participants. A flowchart depicting the selection criteria is shown in Fig. 1. All participants received either a 12-lead resting electrocardiogram (ECG) or a 24-hour Holter test prior to enrollment in the study. The diagnosis was confirmed by two physicians, including a senior cardiologist with 30 years of experience. The inclusion criteria were based on previous studies reporting cognitive dysfunction in individuals with AF [13, 15, 16]. The inclusion criteria were as follows: (1) AF diagnosis based on the International Classification of Diseases, 10th Revision; (2) aged 35–75 years; (3) right-handed; and (4) no contraindications for MRI scans. The exclusion criteria included the following: (1) participants or their first-degree relatives having a history of dementia or other psychiatric disorders, as evaluated by experienced psychiatrists; (2) history of detectable brain lesions on MRI, such as stroke or traumatic brain injury; (3) a diagnosed structural cardiovascular condition; (4) a history of substance or alcohol abuse; (5) ejection fraction lower than 60%; (6) severe system impairment due to conditions such as renal dysfunction or rheumatologic disorders; (7) significant impairments in hearing, vision, or language; (8) carotid artery stenosis confirmed by ultrasonography; (9) Fazekas scores above 2; or (10) Montreal Cognitive Assessment (MoCA) scores lower than 18.
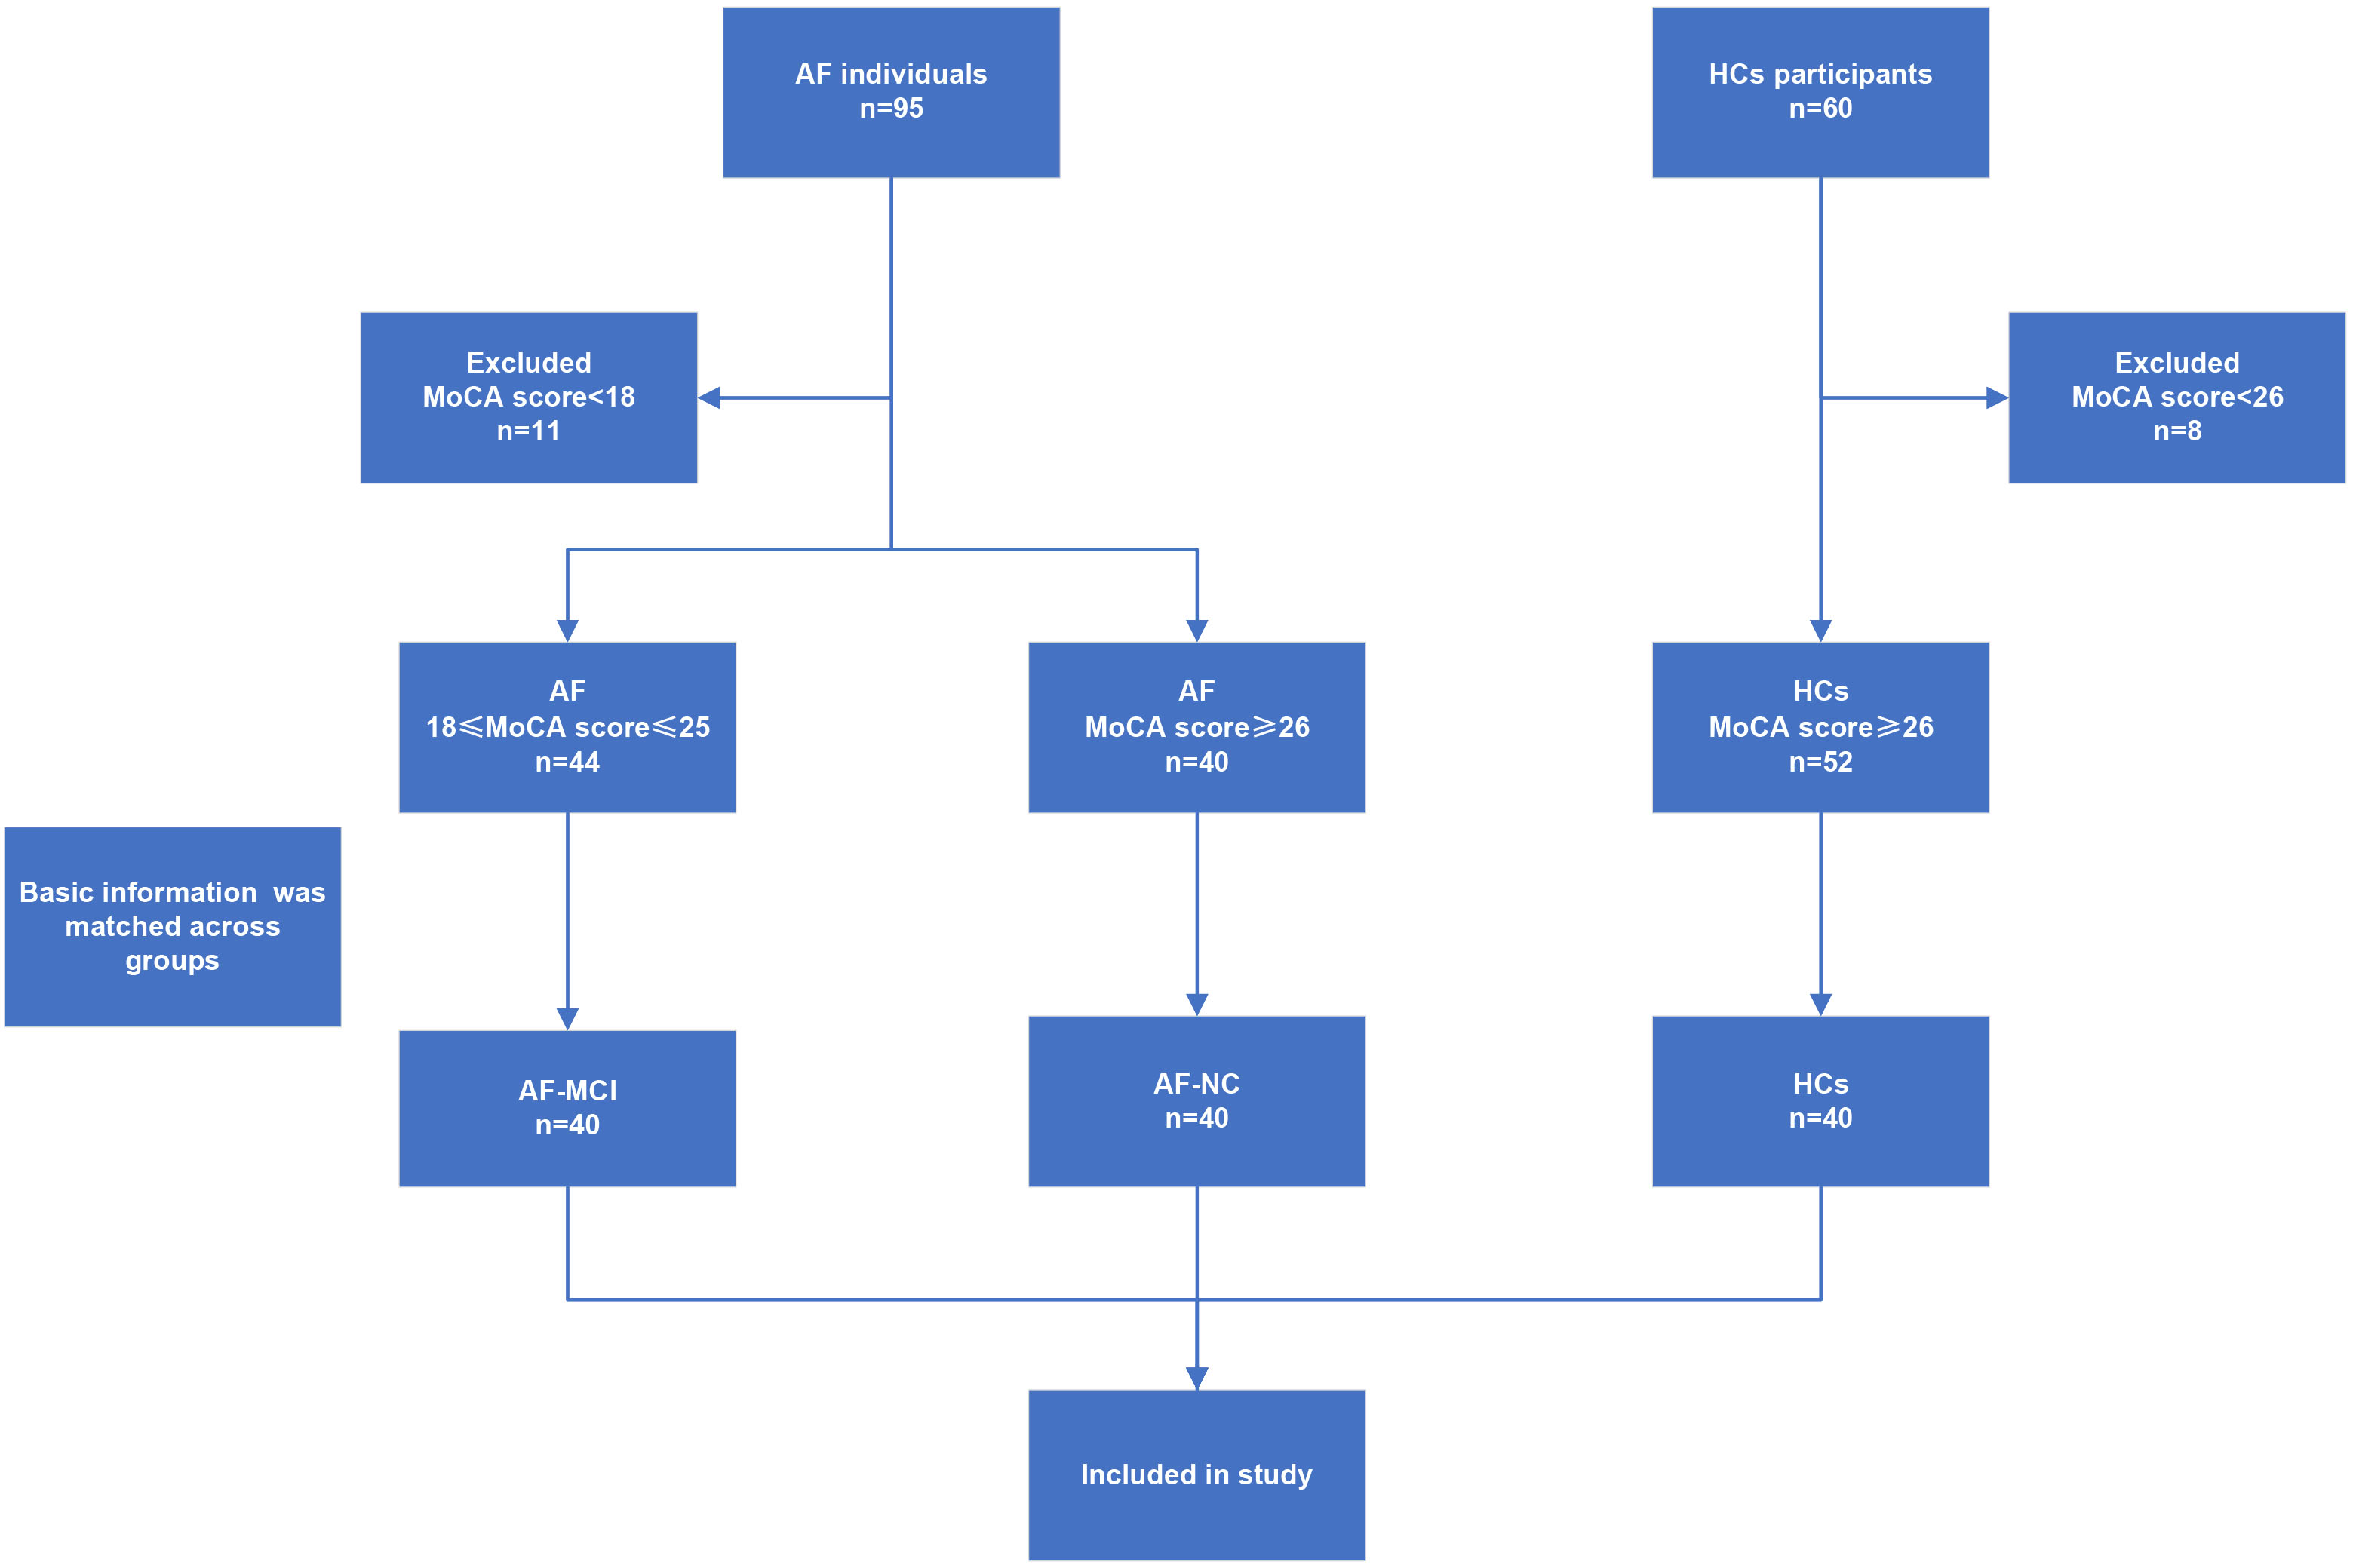 Fig. 1.
The flowchart shows the selection criteria for AF-MCI, AF-NC, and HCs in the study. AF, atrial fibrillation; HCs, healthy controls; MoCA, Montreal Cognitive Assessment; AF-MCI, stroke-free atrial fibrillation individuals with mild cognitive impairment; AF-NC, stroke-free AF individuals with normal cognitive function.
The HCs group consisted of healthy middle-aged and older adult volunteers who were recruited from the local community. These participants underwent the same clinical and imaging assessments as those in the AF group did. All individuals in the HCs group were free from AF and were matched with those in the AF group based on sex, age, body mass index (BMI), and years of education. The exclusion criteria for the AF group were also applied to the HCs group, and individuals whose MoCA score was less than 26 were excluded.
Building on prior research in AF, the study evaluated cognitive function using
both the Mini-Mental State Examination (MMSE) and the MoCA [16]. Stroke-free
individuals with AF who fulfilled the inclusion criteria were categorized into
two groups: AF-MCI and AF-NC. The MoCA, designed specifically for detecting MCI,
employs a cutoff score of 25/26, achieving a sensitivity between 80% and 100%
and a specificity ranging from 50% to 76% [17, 18]. Individuals with MoCA scores
between 18 and 25 were classified into the AF-MCI group, while those with scores
High-resolution 3D T1-weighted structural scans were captured using a 3 Tesla
scanner (Siemens Prisma, Erlangen, Bavaria, Germany). The scanning parameters
included: repetition time of 2530 ms, echo time of 2.98 ms, inversion time of
1100 ms, field of view measuring 256
High-resolution 3D T1-weighted images were preprocessed using the Computational Anatomy Toolbox (CAT12, https://www.neuro.uni-jena.de/cat), implemented in the Statistical Parametric Mapping software package (SPM12, https://www.fil.ion.ucl.ac.uk/spm), based on the open-source MATLAB R2022b platform (MathWorks, Inc., Natick, MA, USA). Preprocessing was performed in several steps, as follows: (1) Raw DICOM images were first converted into NIfTI format using MRIcroGL software (https://www.nitrc.org/projects/mricrogl/). (2) All converted images were visually inspected, and subjects with significant artifacts were excluded from further analysis. (3) Skull stripping and tissue segmentation were performed using tissue probability maps to extract GM images for each subject. To ensure high segmentation quality, both visual inspection and quantitative evaluation were applied. Manual assessment was conducted to exclude subjects with failed tissue segmentation. Additionally, image quality was quantitatively assessed using the metrics provided by CAT12, which generate an overall image quality rating based on a weighted combination of image noise, inhomogeneity, and resolution. Subjects with an image quality score lower than ‘B-’ were excluded. All participants achieved an image quality rating of at least ‘B-’ in CAT12; thus, no subjects were excluded due to image quality issues. (4) Following segmentation, images were aligned to Montreal Neurological Institute space through the Diffeomorphic Anatomical Registration via Exponentiated Lie Algebra (DARTEL) algorithm [19]. To compensate for the volume alterations introduced by normalization, the GM images were modulated. All the modulated GM images were resampled to a voxel size of 1.5 mm3. (5) Finally, to improve signal quality, the images were smoothed using an isotropic Gaussian filter with an 8 mm full width at half maximum. The total intracranial volume (TIV) was calculated for each subject by summing the segmented volume of GM, white matter, and cerebrospinal fluid.
Group differences in demographic variables were examined with SPSS 26.0 (IBM,
Armonk, NY, USA). Before the analyses were performed, normal distribution was
verified through the Shapiro–Wilk test, while equality of variances was examined
via Levene’s test. All the variables showed approximately normal distributions
and no significant violation of homogeneity of variance. Categorical factors such
as sex and medication use were examined using the chi-square (
To assess relationships between GM deficits and cognitive function in AF-MCI participants, partial correlation tests were applied to the VBM-derived regions (see Supplementary Table 1 for residual diagnostics). All analyses were adjusted for age, sex, years of education, BMI, and TIV. After applying false discovery rate correction, results with p values below 0.05 were considered statistically significant.
The study included 80 individuals with AF (40 AF-MCI and 40 AF-NC) and 40 HCs.
The demographic and clinical characteristics are displayed in Table 1. No
significant group differences were observed in age, sex, years of education, BMI,
or vascular risk factors (all p
| AF-MCI | AF-NC | HCs | p | LSD Posthoc | |||
| (n = 40) | (n = 40) | (n = 40) | AF-MCI vs AF-NC | AF-MCI vs HCs | AF-NC vs HCs | ||
| Age (years) | 53.55 |
53.50 |
52.10 |
0.789 | 0.983 | 0.545 | 0.559 |
| Sex (male/female) a | 24/16 | 24/16 | 21/19 | 0.736 | 1.000 | 0.499 | 0.499 |
| Years of education | 8.90 |
9.93 |
8.53 |
0.186 | 0.194 | 0.634 | 0.077 |
| BMI (kg/m2) | 24.33 |
24.22 |
23.24 |
0.116 | 0.851 | 0.060 | 0.089 |
| Smoking (Y/N) a | 11/29 | 13/27 | 9/31 | 0.606 | 0.626 | 0.606 | 0.317 |
| Hypertension (Y/N) a | 23/17 | 18/22 | 17/23 | 0.355 | 0.263 | 0.180 | 0.822 |
| Diabetes mellitus (Y/N) a | 23/17 | 16/24 | 17/23 | 0.237 | 0.117 | 0.180 | 0.820 |
| Dyslipidemia (Y/N) a | 14/26 | 17/23 | 11/29 | 0.372 | 0.491 | 0.469 | 0.160 |
| CHA2DS2-VASc score | 2.08 |
1.75 |
1.85 |
0.353 | 0.160 | 0.329 | 0.664 |
| Fazekas score | 1.23 |
1.30 |
1.18 |
0.708 | 0.607 | 0.757 | 0.412 |
| Medication (Y/N) b | 25/15 | 29/11 | 0.340 | ||||
| Mini-mental state examination | 26.45 |
27.65 |
27.28 |
0.003 | 0.020 | 0.286 | |
| Montreal cognitive assessment | 21.50 |
27.28 |
27.88 |
0.114 | |||
| Visuospatial/executive | 3.53 |
4.73 |
4.58 |
0.412 | |||
| Naming | 2.50 |
2.83 |
2.95 |
0.002 | 0.216 | ||
| Attention | 4.40 |
4.55 |
5.28 |
0.429 | |||
| Language | 2.15 |
2.88 |
2.80 |
0.477 | |||
| Abstraction | 1.73 |
1.88 |
1.85 |
0.248 | 0.120 | 0.194 | 0.794 |
| Memory | 3.28 |
4.60 |
4.68 |
0.703 | |||
| Orientation | 3.95 |
5.85 |
5.75 |
0.460 | |||
| TIV | 1413.08 |
1500.23 |
1483.49 |
0.010 | 0.004 | 0.020 | 0.577 |
LSD, Least Significant Difference test; BMI, body mass index; Y, yes; N, no; TIV, total intracranial volume.
Note: Unless otherwise noted, results are reported as mean
ap values reflecting differences across groups were derived from chi-square testing.
bp values were calculated using the chi-square test between AF-MCI and AF-NC.
Compared with the HCs group, the AF-MCI group exhibited significant GM volume reductions in multiple brain regions, including the right Inferior Temporal Gyrus (ITG), bilateral Parahippocampal Gyrus (PHG), bilateral Middle Temporal Gyrus (MTG), right Superior Temporal Pole (STP), right Cerebellum Crus 1 (Cerebellum_Crus1), bilateral Cerebellum Lobule 6 (Cerebellum_6), left Fusiform Gyrus (FFG), right Orbital Part of the Inferior Frontal Gyrus (IFGorb), and right Lingual Gyrus (LING) (Fig. 2, Table 2).
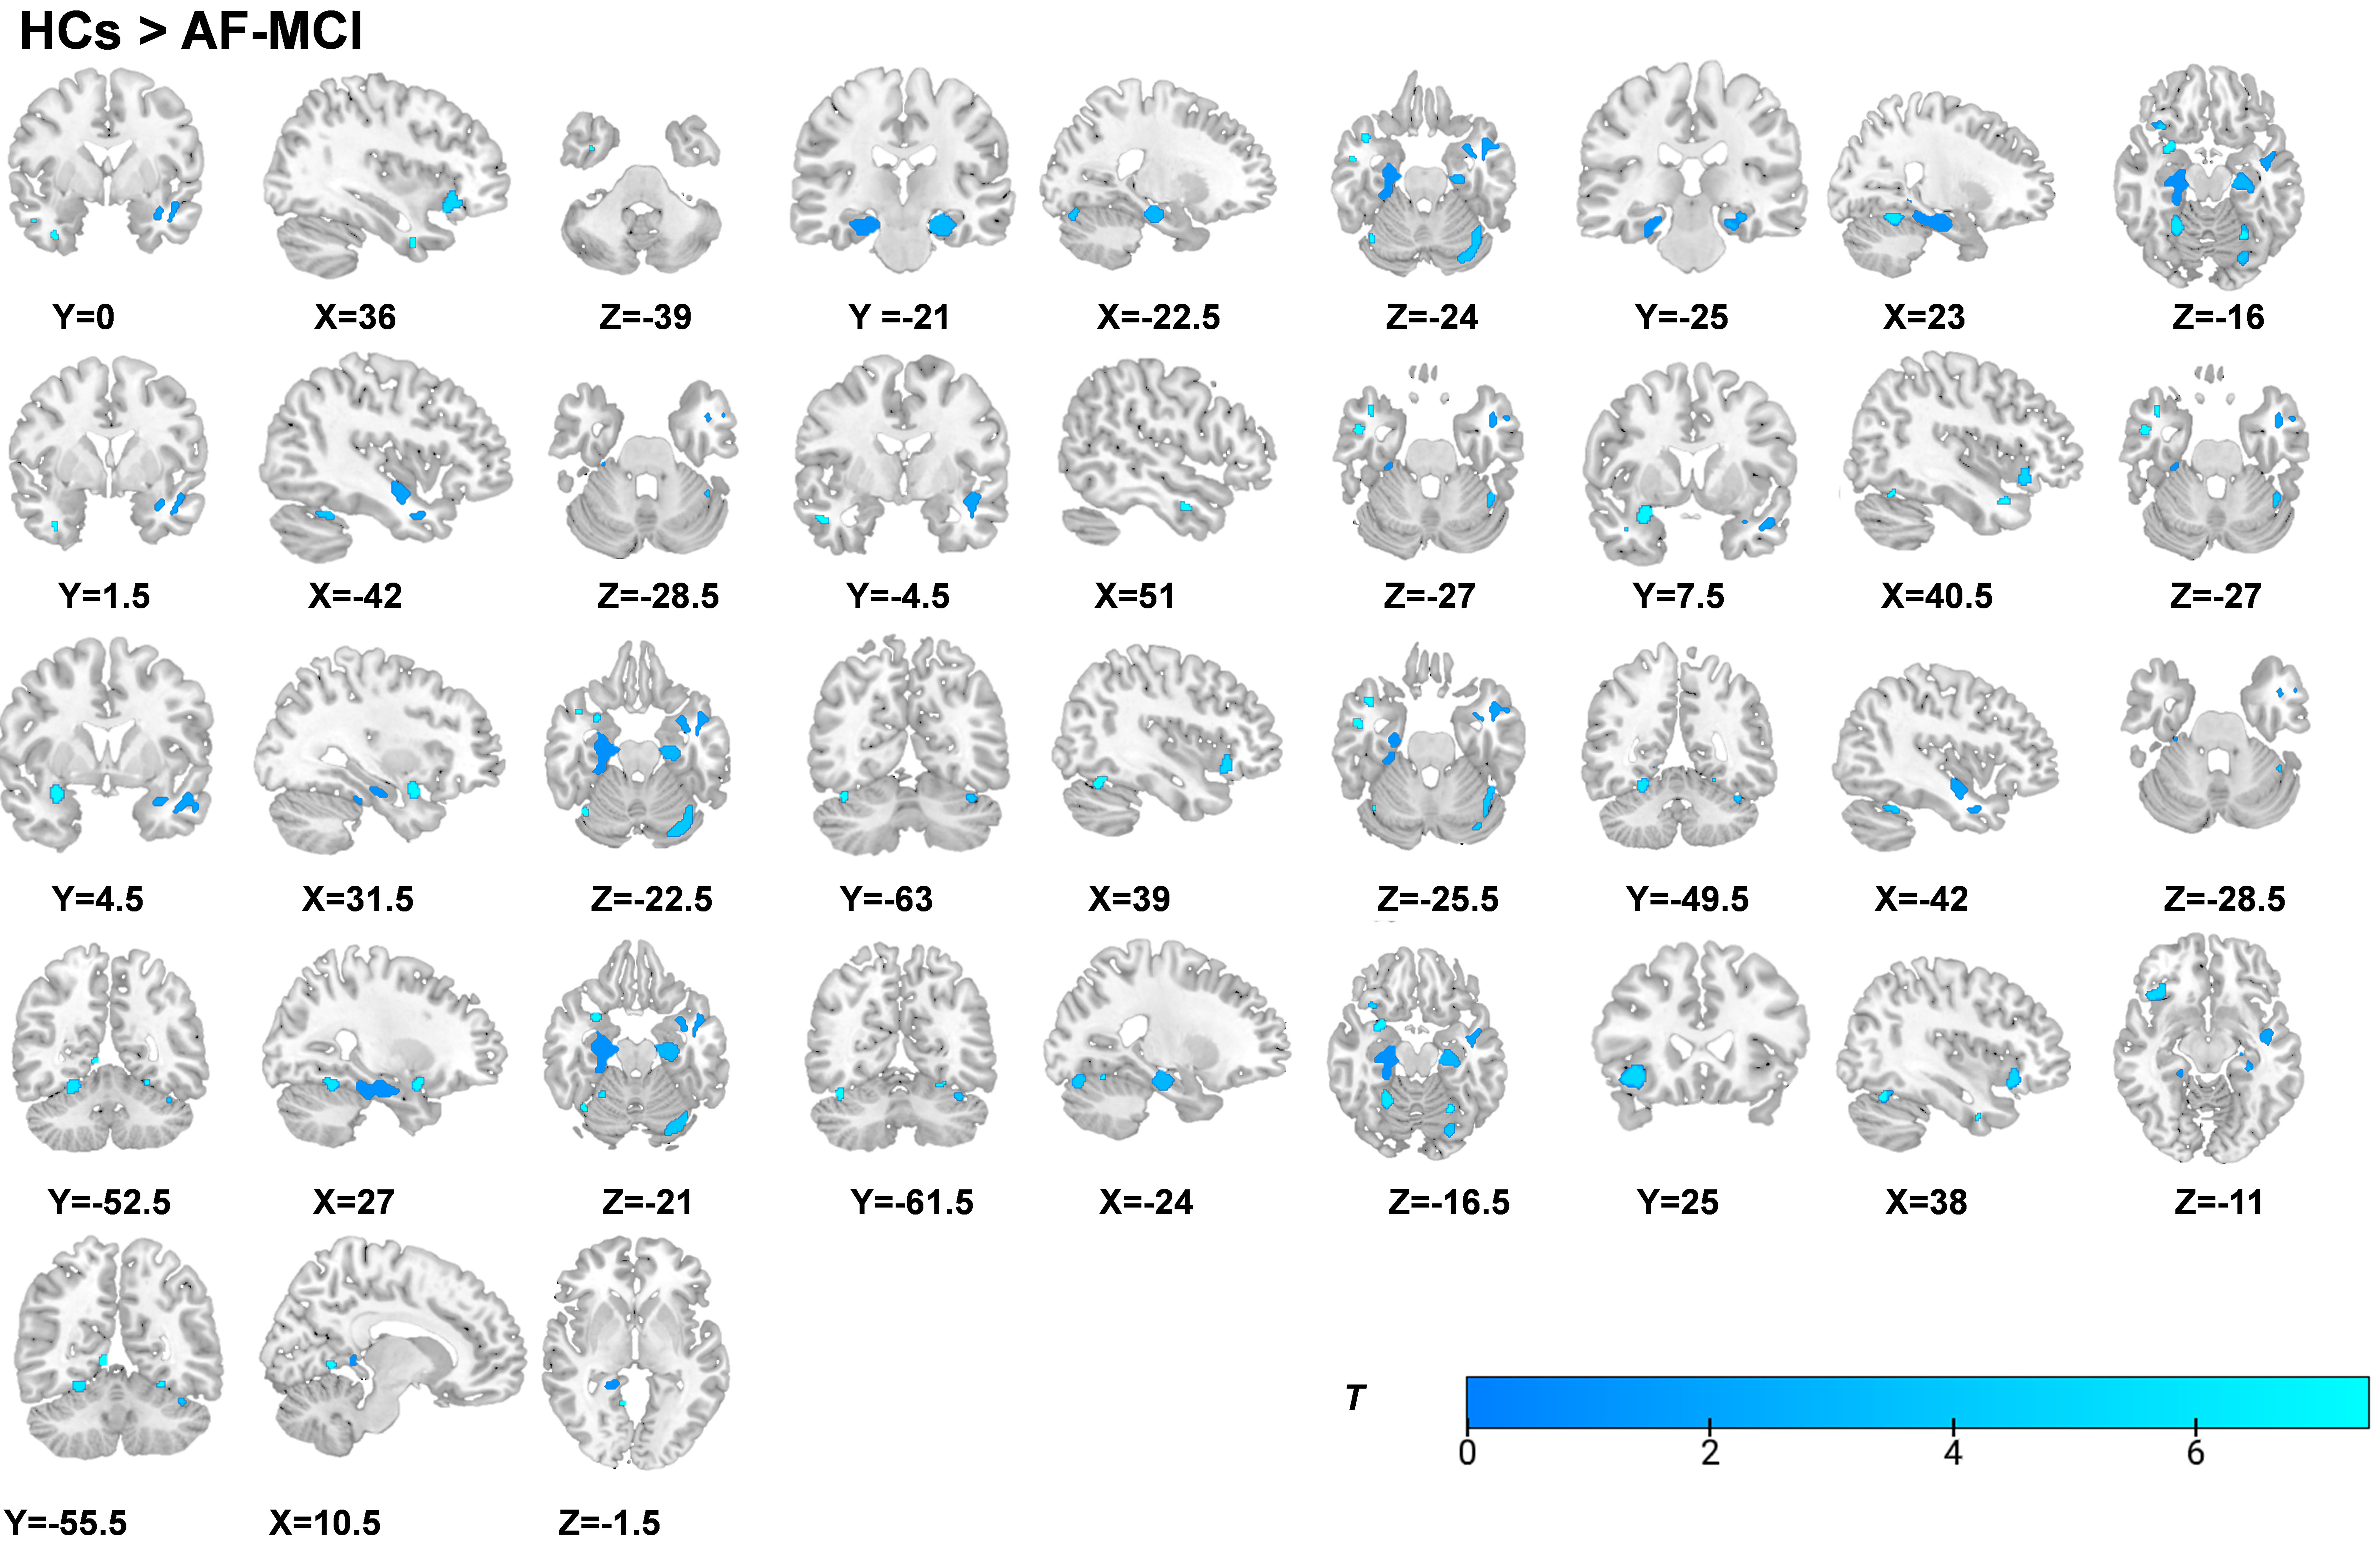 Fig. 2.
Statistical parametric maps overlaid on 3D T1-weighted MRI
images illustrate reduced gray matter volume in AF-MCI individuals relative to
HCs (p
| Location | Hemisphere | MNI coordinate | Voxels | T value | ||
| X | Y | Z | ||||
| HCs | ||||||
| Inferior Temporal Gyrus | R | 36.0 | 0.0 | –39.0 | 14 | 5.378 |
| ParaHippocampal | L | –22.5 | –21.0 | –24.0 | 458 | 5.367 |
| ParaHippocampal | R | 23.0 | –25.0 | –16.0 | 1315 | 6.508 |
| Middle Temporal Gyrus | L | –42.0 | 1.5 | –28.5 | 517 | 5.206 |
| Middle Temporal Gyrus | R | 51.0 | –4.5 | –27.0 | 31 | 5.395 |
| Superior Temporal Pole | R | 40.5 | 7.5 | –27.0 | 40 | 5.272 |
| Superior Temporal Pole | R | 31.5 | 4.5 | –22.5 | 128 | 5.194 |
| Cerebellum Crus 1 | R | 39.0 | –63.0 | –25.5 | 32 | 5.194 |
| Cerebellum Lobule 6 | L | –42.0 | –49.5 | –28.5 | 394 | 5.228 |
| Cerebellum Lobule 6 | R | 27.0 | –52.5 | –21.0 | 155 | 5.259 |
| Fusiform Gyrus | L | –24.0 | –61.5 | –16.5 | 40 | 5.199 |
| The Orbital Part of the Inferior Frontal Gyrus | R | 38.0 | 25.0 | –11.0 | 250 | 5.586 |
| Lingual Gyrus | R | 10.5 | –55.5 | –1.5 | 35 | 5.272 |
| HCs | ||||||
| Superior Temporal Pole | L | –31.5 | 9.0 | –24.0 | 15 | 5.245 |
| Superior Temporal Gyrus | L | –44.0 | –8.0 | –14.0 | 61 | 5.634 |
| Superior Frontal Gyrus | L | –21.0 | 54.0 | –1.5 | 11 | 5.376 |
| Superior Frontal Gyrus | R | 31.5 | 58.5 | 9.0 | 26 | 5.290 |
| Superior Frontal Gyrus | L | –21.0 | 54.0 | 18.0 | 201 | 5.371 |
| Medial Superior Frontal Gyrus | L | –3.0 | 43.5 | 22.5 | 38 | 5.235 |
| AF-NC | ||||||
| Parahippocampal Gyrus | L | –24.0 | –19.5 | –25.5 | 153 | 5.204 |
| Inferior Parietal Lobule | R | 33.0 | –40.0 | 50.0 | 15 | 5.454 |
MNI, Montreal Neurological Institute; L, left; R, right.
Relative to the HCs group, the AF-NC group showed significant GM volume reductions in the left STP, left Superior Temporal Gyrus (STG), bilateral Superior Frontal Gyrus (SFG), and left Medial Superior Frontal Gyrus (SFGmed) (Fig. 3, Table 2).
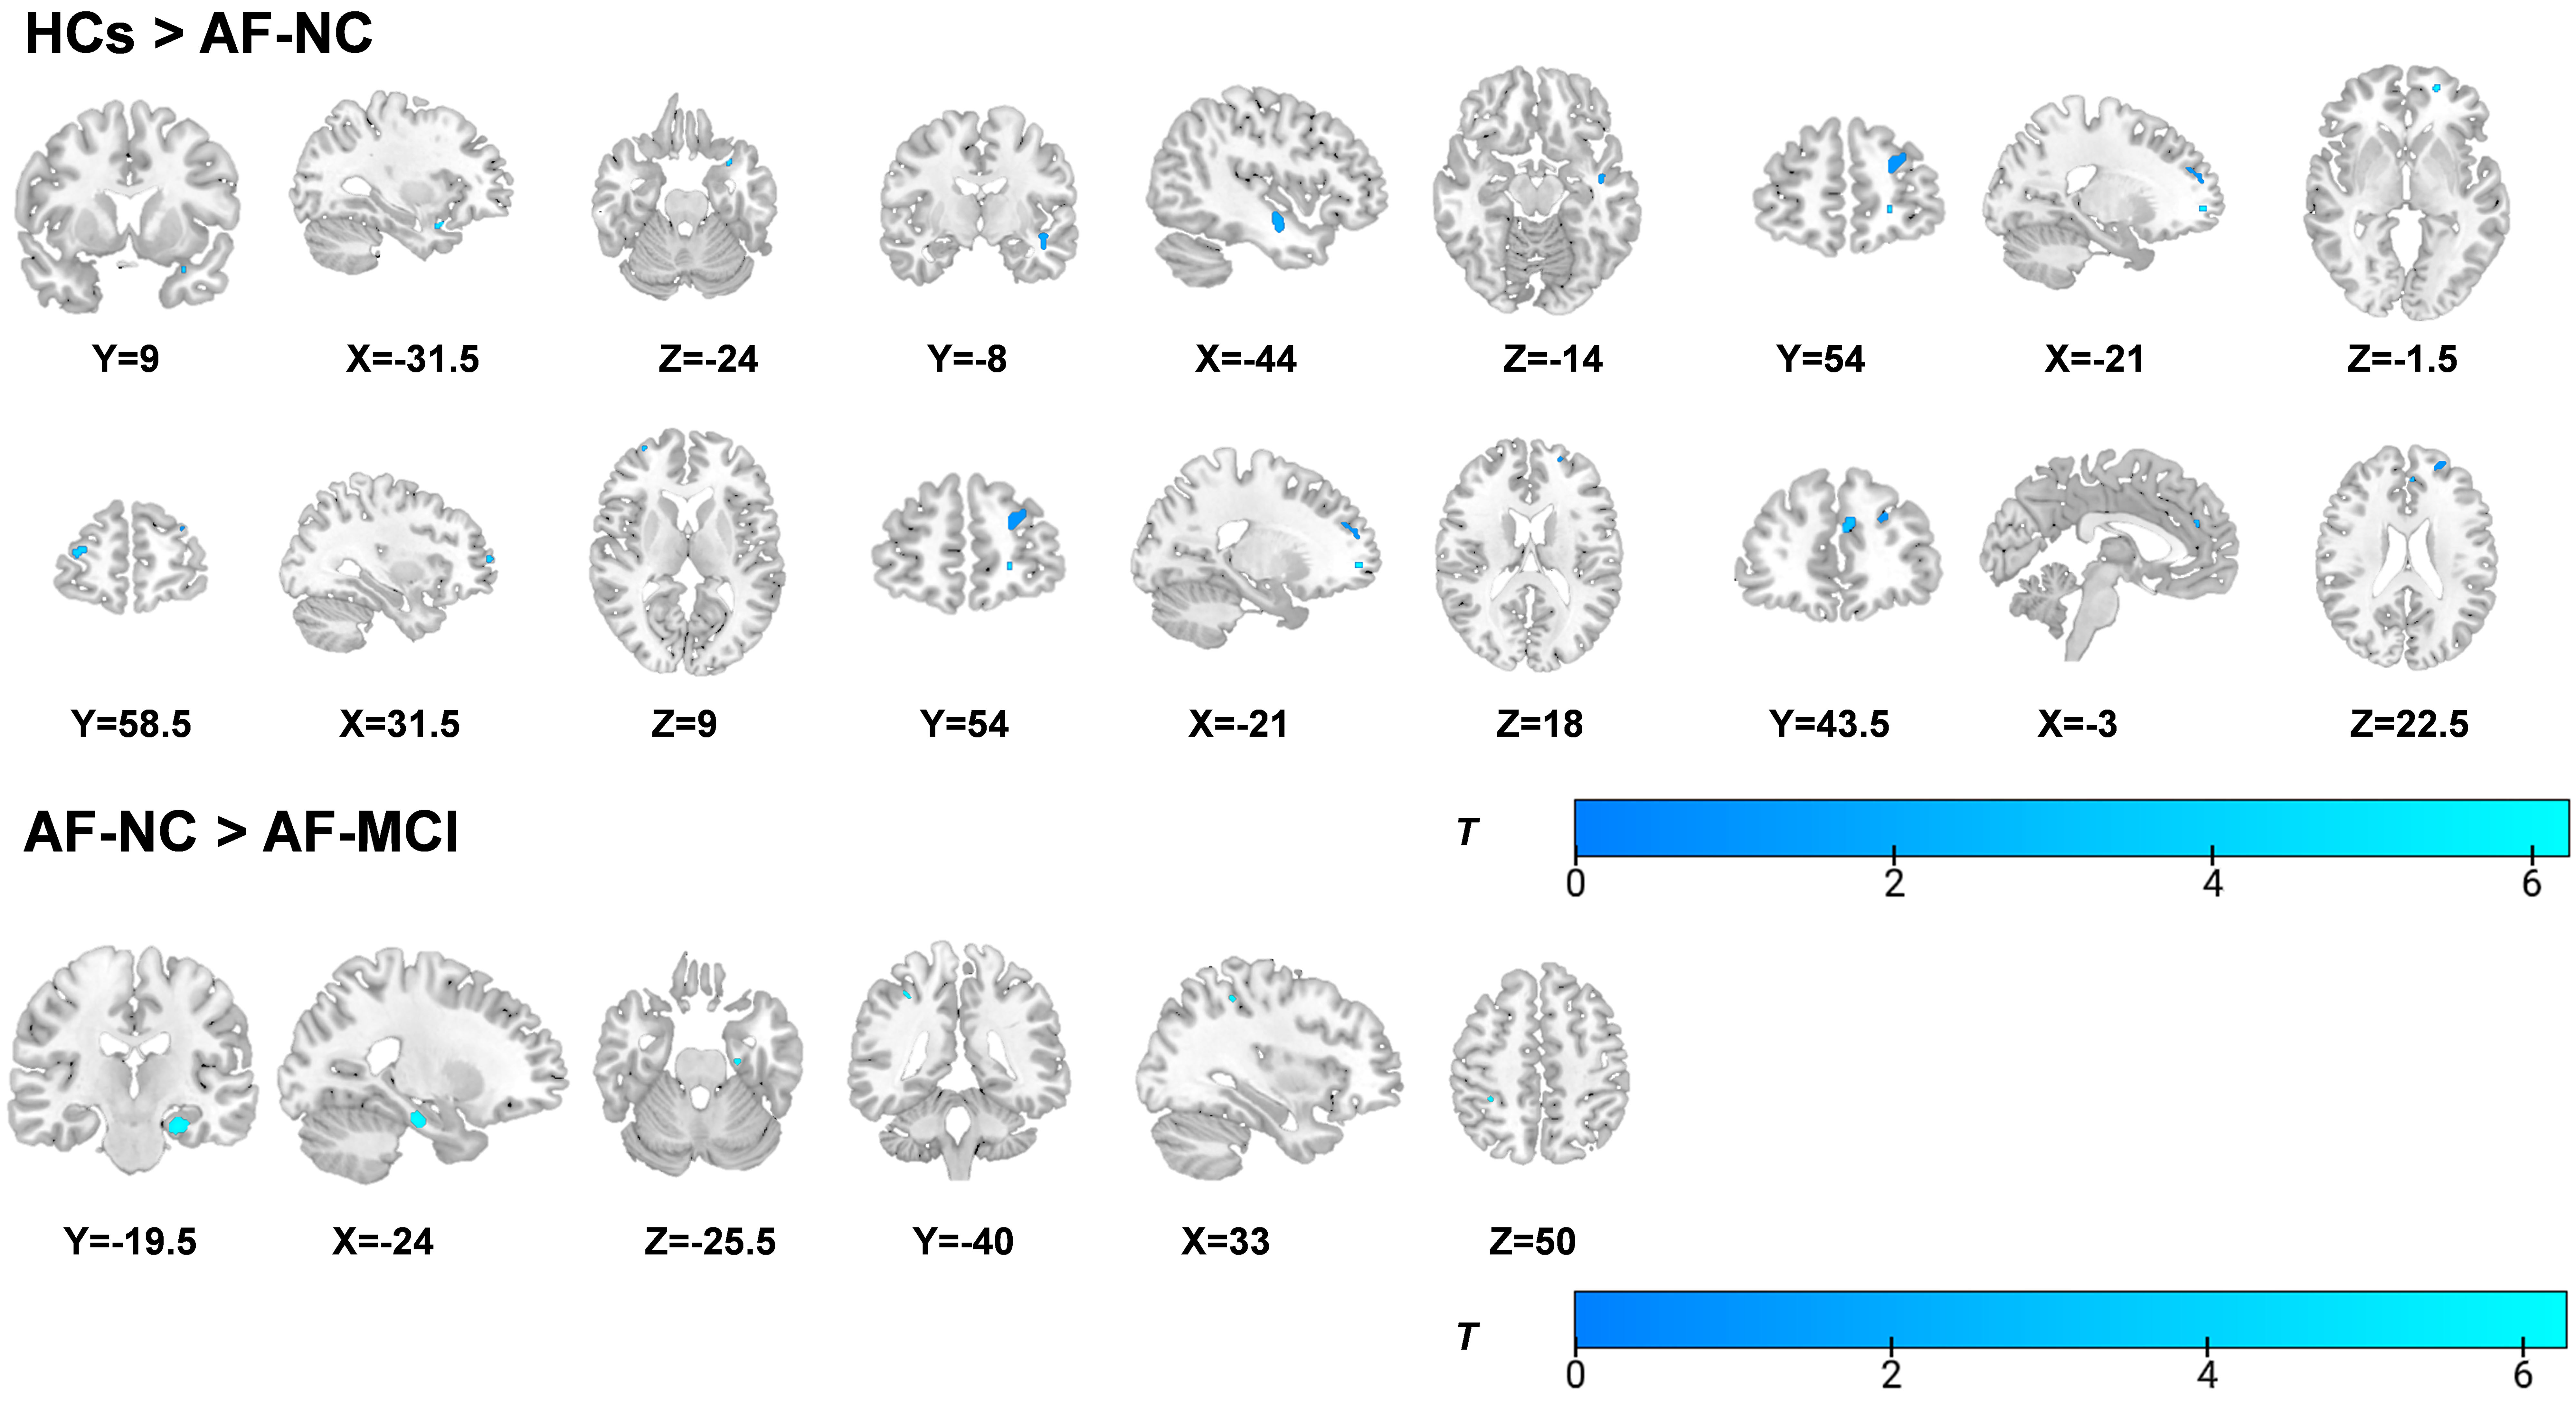 Fig. 3.
Statistical parametric maps overlaid on a 3D T1-weighted
template showing gray matter differences: HCs
The GM volumes of the left PHG, right STP, and right IFGorb were positively associated with MMSE scores (Fig. 4, Supplementary Table 2), whereas the GM volumes of the left PHG and right STP were positively correlated with MoCA scores (Fig. 5, Supplementary Table 2).
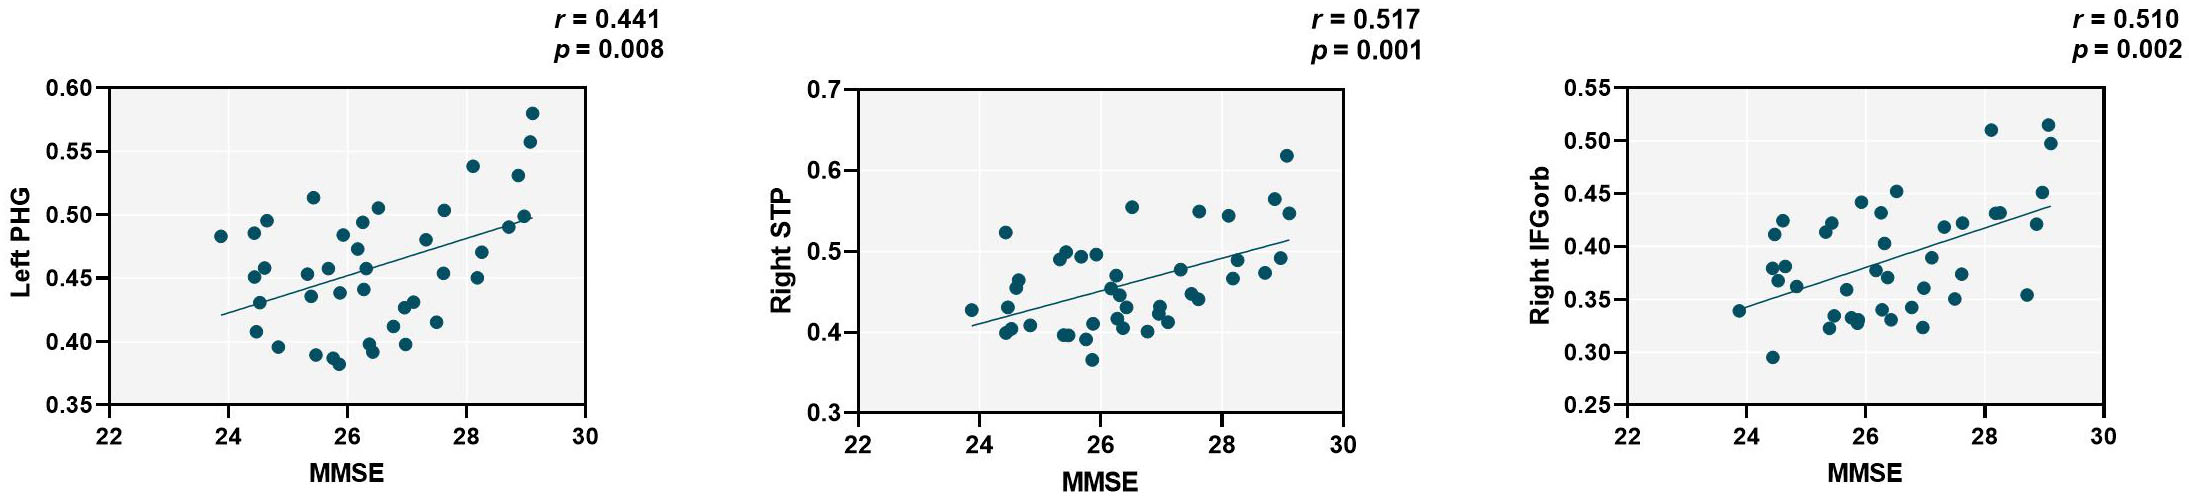 Fig. 4.
The GM volumes of the left PHG, right STP, and right IFGorb were positively correlated with MMSE scores (r = 0.441, p = 0.008, r = 0.517, p = 0.001, and r = 0.510, p = 0.002). The y-axis represents the GM volumes of the left PHG, right STP, and right IFGorb. The x-axis represents the standardized residuals of MMSE scores after regression with covariates including age, sex, years of education, BMI and TIV. PHG, Parahippocampal Gyrus; STP, Superior Temporal Pole; IFGorb, Orbital Part of the Inferior Frontal Gyrus; MMSE, Mini-Mental State Examination.
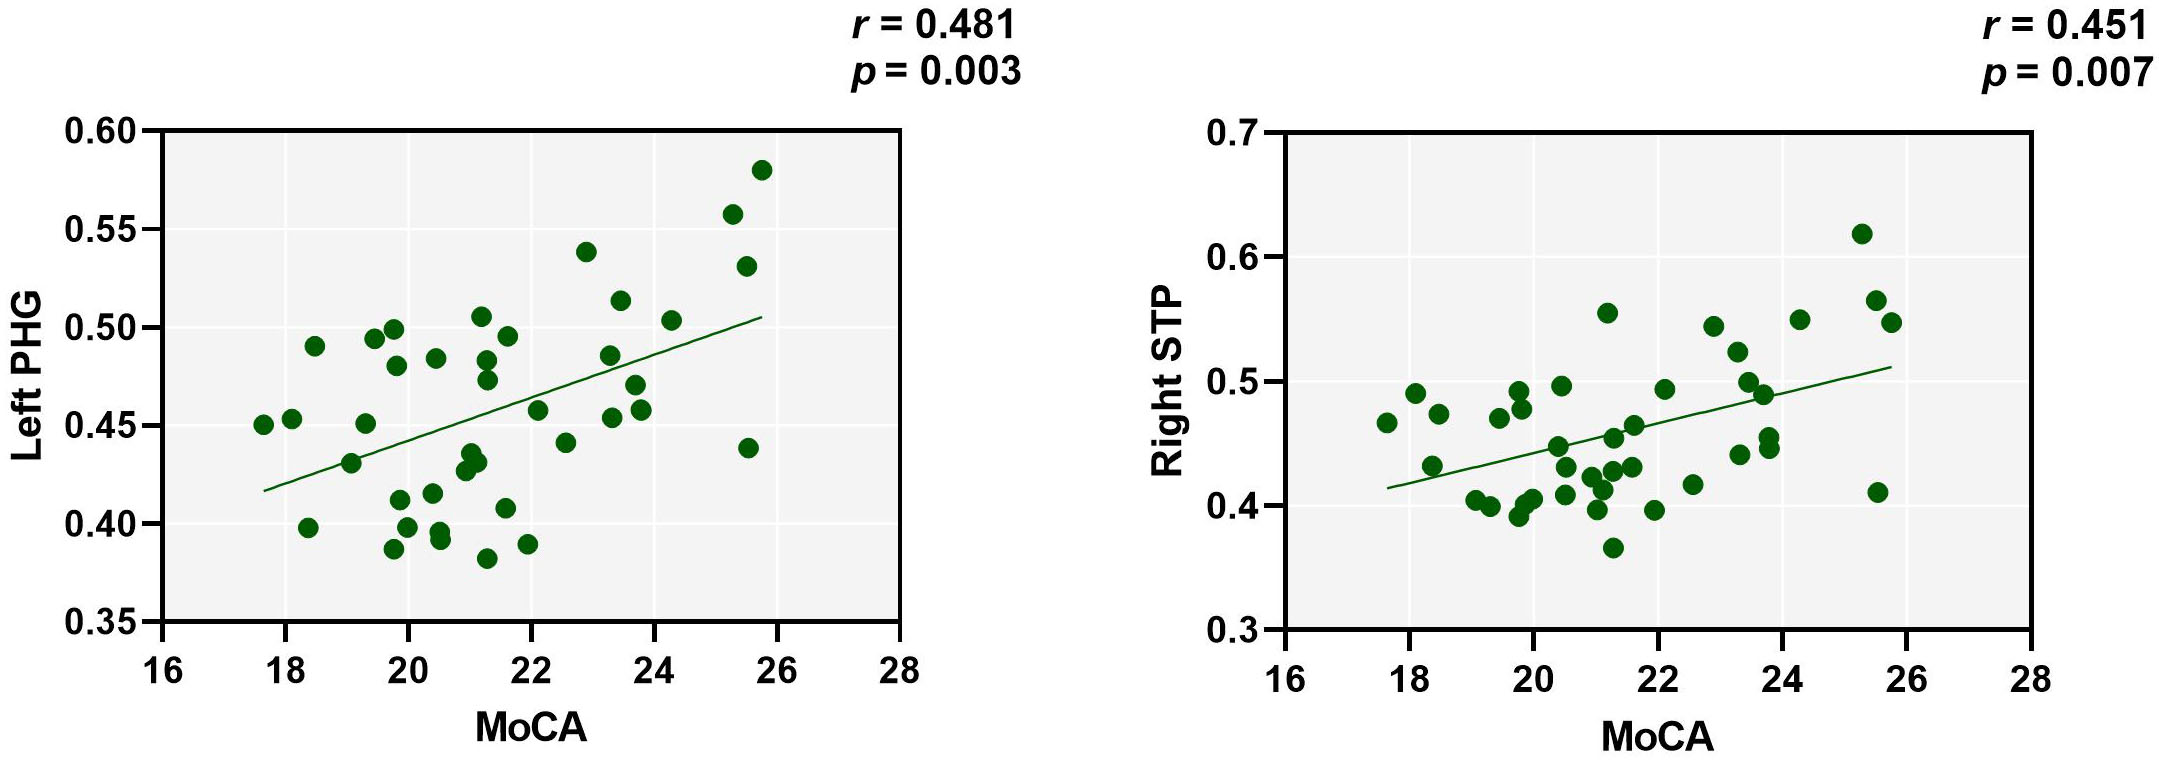 Fig. 5.
The GM volumes of the left PHG, and right STP were positively correlated with MoCA scores (r = 0.481, p = 0.003, and r = 0.451, p = 0.007). The y-axis represents the GM volumes of the left PHG, and right STP. The x-axis represents the standardized residuals of MoCA scores after regression with covariates including age, sex, years of education, BMI and TIV.
The findings of this study show that compared with AF-NC, AF-MCI is associated with impairments across multiple cognitive domains. Additionally, VBM was used to study alterations in GM volume in stroke-free AF individuals with different cognitive states. First, compared with HCs, stroke-free individuals with AF either with MCI or without MCI showed GM atrophy in multiple regions. Moreover, AF individuals with MCI not only exhibited GM atrophy but also had a more extensive distribution of atrophy than those without CI. These GM reductions occurred in the temporal lobe, cerebellum, and frontal lobe. In addition, the AF-MCI group had significant GM loss in the left PHG and right IPL compared with the AF-NC group. These findings suggest that these regions are key structural bases for cognitive decline in stroke-free AF individuals. Importantly, partial correlation analysis revealed that reduced GM volume in the left PHG, right STP, and right IFGorb was positively correlated with cognitive function. These results support the connection between brain structure and cognitive function.
Our findings showed that compared with HCs, AF-MCI individuals had worse cognitive performance in several areas, including global cognition, visuospatial/executive functions, naming, attention, language, memory, and orientation. Compared with AF-NC individuals, AF-MCI individuals showed significant impairments in all of the above domains except attention. Notably, in terms of abstract reasoning ability, no significant differences were observed among the three groups. This might be because the abstract reasoning ability of the study population remained relatively stable. Our results align with previous research conducted in individuals with MCI and diabetes. In conclusion, these results are consistent with the typical features of MCI, characterized by mild deficits in one or more cognitive domain [20]. Although MCI does not seriously affect daily activities, it may reduce AF individuals’ adherence to routine treatments and affect treatment decisions [21]. Thus, clinicians should pay attention to the cognitive functions of individuals with AF, especially through neuropsychological examinations for diagnosing MCI. In some assessments, the MoCA serves as a well-established screening method for MCI [17] and is widely applied to AD-related MCI [22], Parkinson’s disease-related MCI [23], and hypertension-related MCI [24] due to its high sensitivity and accuracy. Cognitive performance in this study was additionally evaluated using the MMSE; however, studies have shown that the MMSE has a ceiling effect, and its sensitivity and accuracy are lower than those of the MoCA. Notably, our findings indicated that even AF-NC individuals, considered cognitively normal, had attention deficits compared to HCs, suggesting that relying solely on clinical symptoms and cognitive scales may lead to inaccurate assessments of cognitive decline, highlighting the need for close monitoring of these individuals. Although there is currently no medication for MCI, controlling vascular risk factors and increasing physical and mental activities could be promising interventions for stroke-free AF individuals. Such approaches may improve individual quality of life and reduce the likelihood of adverse outcomes [25].
Compared to HCs, the AF-MCI group exhibited significant GM volume reductions across widespread brain regions, involving primarily the temporal lobe, frontal lobe, and cerebellum. This widespread atrophy pattern differs from the GM reductions observed in individuals with MCI [26]. A large prospective study found that individuals with MCI exhibited reduced GM volumes in the hippocampus (HIP), PHG, and FFG [26]. In our study, we also observed reduced GM volumes in the PHG and FFG; however, no reduction was found in the HIP. The HIP, as a higher-order center for memory, is significantly altered in both MCI and dementia populations [27, 28]. In addition, we found reduced GM volumes in the temporal lobe, frontal lobe, and cerebellum of AF-MCI individuals. This difference appears to be reasonable, as one study demonstrated that AF individuals showed GM volume reductions only in the temporal and frontal lobes [14]. The hypothesis that AF impairs cognition posits that vascular inflammatory changes in AF individuals alter cerebral blood flow and oxygenation, thereby leading to neurodegeneration [14]. That study attributed GM alterations to small vessel disease, which could explain the absence of changes in the hippocampus. Our findings are consistent with these results and further support the notion that AF-related GM reduction is largely influenced by small vessel disease, providing a plausible link between cardiac and brain pathology. In addition, the AF-NC group showed more restricted GM volume reductions, which were localized mainly in the temporal and frontal lobes. These more limited alterations may reflect early structural alterations in AF individuals without CI. Importantly, ANCOVA showed significant differences in total GM volume between the AF-NC and HCs groups. The findings indicate that these brain regions may experience considerable GM loss even before clinically significant MCI is observed in individuals with AF. If these individuals do not receive timely interventions, GM loss might worsen.
VBM analysis also showed widespread GM volume reductions in both the AF-MCI and AF-NC groups compared with the HCs group. The extent of GM impairment was notably greater in individuals in the AF-MCI group than in those in the AF-NC group. Specifically, reduced GM volume in individuals in the AF-MCI group was found in the bilateral PHG, bilateral MTG, right ITG, right STP, right Cerebellum_Crus1, bilateral Cerebellum_6, left FFG, right IFGorb, and right LING. In individuals in the AF-NC group, GM volume reductions involved the left STP, left STG, bilateral SFG, and left SFGmed. These affected regions are components of several key large-scale brain networks implicated in cognitive function. For example, the PHG and temporal pole are core nodes of the default mode network (DMN), which is critical for episodic memory and self-referential processing [29, 30]. Atrophy in these regions likely contributes to the memory and orientation deficits observed in individuals in the AF-MCI group. Frontal regions, including the SFG and IFGorb, are important hubs within the central executive network (CEN) and are responsible for executive functions such as working memory, cognitive control, and attention [31, 32]. GM loss here may underlie impairments in visuospatial/executive functions and attention. These findings suggest that AF affects the brain structure of core networks, thereby leading to CI. However, clear evidence supporting this hypothesis was not observed, and future studies with larger sample sizes may be needed to confirm it. In addition, cerebellar regions, which are increasingly recognized as integral to cognitive processing, form part of the cerebellar-cortical circuits involved in the coordination of cognitive and motor functions [33]. A reduction in cerebellar GM may exacerbate the decline in cognitive ability. Previous studies have indicated possible mechanisms of AF-induced cognitive decline, such as chronic brain hypoperfusion, cerebrovascular injury, and inflammation. Chronic ischemia can lead to neuronal dysfunction and death, and inflammation might intensify neurodegeneration through glial cell activation [34]. Similar to findings of dementia studies showing progressive brain atrophy [35], the gradual GM reductions in stroke-free individuals with AF might reflect degenerative changes in these brain regions, further affecting cognitive performance.
Previous studies on GM alterations in individuals with AF have shown inconsistent results. A smaller study linked AF to GM volume reductions in frontal regions and the cerebellum [13]. Another larger study found bilateral GM reductions in AF individuals in areas such as M1, S1, V1, and middle and inferior temporal gyri [14]. These two studies did not classify AF individuals according to cognitive function when examining GM changes. In our study, AF individuals were divided into two groups—those without MCI and those with MCI—to enable a more in-depth investigation of the neural mechanisms underlying AF-related cognitive decline. Despite these methodological differences, our findings are similar to those of previous studies. On the one hand, both our study and earlier work found reduced GM volumes in the temporal, frontal, and cerebellar regions of AF individuals, specifically in the MTG, ITG, SFG, and cerebellum. On the other hand, differences were observed in certain specific regions showing GM volume reduction, such as M1, S1, V1, and IPL. These discrepancies appear to be attributable to differences in sample size. Moreover, unlike the previous studies, our participants were of East Asian ethnicity, and ethnic differences have been reported to influence patterns of GM alterations [36]. Through subgroup analysis, we obtained several interesting findings. Compared with that in the AF-NC group, significant GM atrophy in the left PHG and right IPL in the AF-MCI group was observed. The IPL, as a hub of the CEN, is closely connected to the DMN and salience network, and is involved in many higher-order cognitive processes [37, 38]. A longitudinal study found that differential atrophy in the IPL may be closely related to amyloid and tangle pathology, and may accelerate the progression of MCI [39]. Compared with the AF-NC group, the AF-MCI group showed a significant reduction in the volume of the IPL, suggesting that atrophy in this region may indicate a neurodegenerative state [40]. These findings may provide a new diagnostic target for AF individuals who develop MCI. We also observed positive correlations between GM volume in the left PHG and cognitive score. The MoCA is highly sensitive for differentiating individuals with MCI from HCs and considered more sensitive than MMSE [41, 42]. Given that the GM volume of the PHG was positively correlated with both the MoCA and the MMSE scores, we speculate that the PHG plays an important role in AF individuals with MCI. The PHG, as a key node of the default mode network, is closely associated with visuospatial processing and episodic memory [43]. Compared with other brain regions, the PHG is particularly important in early AD pathology [44]. Similarly, the entorhinal cortex and its connecting pathways undergo degeneration in the early stages of Alzheimer’s disease, suggesting that medial temporal lobe structures (including the parahippocampal gyrus) may serve as sensitive imaging indicators for the early detection of cognitive decline [45]. In addition to reductions in GM volume, the PHG also shows significant alterations in functional imaging and diffusion tensor imaging [46, 47]. These structural and functional changes may be closely related to the finding that the number of neurofibrillary tangles and neurofilaments in the PHG are significantly lower in cognitively normal individuals than in individuals with MCI and/or AD [39]. Thus, atrophy of the PHG may indicate MCI and reflect cognitive severity in stroke-free individuals with AF.
Although our study was prospective, several limitations should be noted. First, despite controlling for cardiovascular risk factors through preliminary screening, we could not fully exclude the effects of AF comorbidities on GM-cognition relationships. Although TIV was statistically controlled for, residual confounding from global brain atrophy cannot be entirely excluded. Second, the MoCA and MMSE are simple screening tools, and future studies should include additional assessment tools. The use of a MoCA cutoff of 26 for HCs may have restricted variance in the control group, potentially inflating between-group contrasts. Future investigations with more inclusive sampling frameworks are needed to resolve this limitation. Third, due to the limited sample size, we did not consider other variables, such as AF subtype or medication use that might affect cognition. In addition, due to the challenges associated with recruiting a specific population and the high cost of neuroimaging examinations, the sample size of this study was relatively small, which represents a major limitation. These findings should be interpreted with caution and validated in future multicenter studies with larger samples. Finally, the study was a cross-sectional study and therefore cannot establish a causal relationship between structural changes and cognitive decline. Longitudinal studies are warranted to better elucidate the relationship between structural alterations and CI in AF individuals.
In summary, widespread GM atrophy was found in stroke-free AF individuals both with and without MCI. GM atrophy might become more common with the onset of MCI in individuals with AF. Structural brain alterations might underpin the transition from normal cognition to MCI in stroke-free individuals with AF. Understanding these structural alterations paves the way for targeted interventions to mitigate cognitive decline in stroke-free individuals with AF.
The data that support the findings of this study are available on request from the corresponding author. The data are not publicly available due to privacy or ethical restrictions.
HL, TL, LL, BC, YZ, SS, SY, CL, and XW had substantial contributions to the conception and design of the study, data acquisition, analysis, and interpretation. HL drafted the original manuscript. TL, CL, and XW contributed to review and editing. TL and XW contributed to visualization. HL and SS contributed software and resources. LL and BC contributed to methodology and formal analysis. HL, BC, YZ, and CL contributed to project administration and investigation. HL, CL, and XW contributed to funding acquisition. All authors contributed to editorial changes in the manuscript. All authors read and approved the final version of the manuscript. All authors have participated sufficiently in the work and agreed to be accountable for all aspects of the work.
This study was carried out with the approval of the Shandong Provincial Hospital Research Ethics Committee (SWYX: NO. 2023-110). The study was conducted in accordance with the Declaration of Helsinki. Informed consent was obtained from all participants.
We sincerely thank all data donors and all individuals (other than the authors) who contributed to this study.
National Natural Science Foundation of China, 82471978, 82271993.
The authors declare no conflict of interest.
Supplementary material associated with this article can be found, in the online version, at https://doi.org/10.31083/JIN43844.
References
Publisher’s Note: IMR Press stays neutral with regard to jurisdictional claims in published maps and institutional affiliations.