


1 Department of Neurology, Affiliated Hospital of Guangdong Medical University, 524001 Zhanjiang, Guangdong, China
2 Guangdong Key Laboratory of Age-Related Cardiac and Cerebral Diseases, Affiliated Hospital of Guangdong Medical University, 524001 Zhanjiang, Guangdong, China
3 Neurology & Neurosurgery Division, First Affiliated Hospital of Jinan University, 510630 Guangzhou, Guangdong, China
4 Clinical Research and Experimental Center, Affiliated Hospital of Guangdong Medical University, 524001 Zhanjiang, Guangdong, China
Abstract
The solute carrier (SLC) superfamily, which transports solutes across biological membranes, includes four members (SLC2A1, SLC6A1, SLC9A64, and SLC35A2) that have been linked to epilepsy. This study sought to examine the DNA methylation patterns near the promoters of these genes in temporal lobe epilepsy (TLE), as DNA methylation is a crucial epigenetic modification that can impact gene expression.
The study comprised 38 individuals with TLE and 38 healthy controls. Methylation experiments were performed using peripheral blood, while demethylation experiments were carried out using SH-SY5Y cells with the DNA methylation inhibitor decitabine.
A significant difference was observed in the DNA methylation rate of SLC6A1 between TLE patients and controls, with TLE patients showing a lower rate (4.81% vs. 5.77%, p = 0.0000), which remained significant even after Bonferroni correction (p = 0.0000). Based on the hypomethylated SLC6A1 in TLE, a predictive model was established that showed promise in distinguishing and calibrating TLE. In the TLE group, there were differences in DNA methylation rates of SLC6A1 between the young patients and the older controls (4.42% vs. 5.22%, p = 0.0004). A similar trend (p = 0.0436) was noted after adjusting for sex, age at onset, and drug response. In addition, the study found that DNA methylation had a silencing impact on the expression of the SLC6A1 gene in SH-SY5Y cells, which were treated with decitabine at a set dose gradient.
The evidence suggests that lower methylation of SLC6A1 may stimulate transcription in TLE, however, further investigation is necessary to confirm the exact mechanism.
Keywords
- DNA methylation
- epigenetic modification
- solute carriers
- temporal lobe epilepsy
- SLC6A1
Epilepsy, affecting around 70 million people, is a prevalent neurological disorder characterized by highly abnormal synchronous discharges of brain neurons [1, 2]. Despite the availability of anticonvulsants, nearly one-third of epilepsy patients remain resistant to treatment, with a significant number of them suffering from temporal lobe epilepsy (TLE) [3]. Hence, it still requires great effort to thoroughly explore the pathological mechanisms of TLE in order to identify novel drug targets that can improve seizure control.
The solute carrier (SLC) superfamily consists of over 400 members in humans, which are currently grouped into 65 families based on their sequence similarities and roles. This superfamily is involved in transporting a variety of solutes, including inorganic ions, amino acids, neurotransmitters, and drugs, across cell membranes, highlighting its importance in physiological, pathological, and pharmacological processes [4, 5]. Within this superfamily, 287 members play a role in brain function, with 71 genes linked to brain disorders in humans such as epilepsy and psychosis. Of these 71 genes, around 22% have been identified as connected to epilepsy. Any mutations or abnormalities in these genes have the potential to trigger epileptic seizures [6].
Epileptic encephalopathies are a collection of severe epilepsies with diverse
genetic causes, and several genes have been identified as either pathological or
potentially pathological due to de novo variants in their exons. Notably, four of
these genes—SLC2A1, SLC6A1, SLC9A64, and
SLC35A2—are part of the SLC superfamily [7]. In particular, SLC6A1
plays a role in the reuptake of inhibitory
While there are differences in certain aspects like age of onset, both epileptic encephalopathies and TLE are types of epilepsy and may share some genetic mechanisms [12]. In contrast to rare epileptic encephalopathies, which are typically associated with de novo DNA variants, TLE is a more widespread condition [13]. DNA methylation, an extensively existing epigenetic modification in the human genome, involves adding a methyl group to cytosines in cytosine-phosphate-guanine (CpG) island sequences near gene promoters. This process aids in chromosome stability and can lead to the suppression of specific genes [14, 15]. In addition, postnatal environmental factors have the potential to affect it and can be passed on to future generations [16]. Due to the intricate nature of epilepsy as a disorder influenced by both genetic and environmental factors, this research sought to examine the DNA methylation patterns near the promoters of specific genes (SLC2A1, SLC6A1, SLC9A64, and SLC35A2) in TLE. The objective is to offer fresh insights into the role of these SLCs in epileptic seizures from an epigenetic standpoint.
Before starting the study, approval was obtained from the Ethics Committee of the Affiliated Hospital of Guangdong Medical University in accordance with the Declaration of Helsinki (Grant No. YJYS2021025KT) for all research involving human participants. In diagnosing TLE, a combination of clinical symptoms (such as autonomic, psychic, and sensory disturbances), abnormal electroencephalography patterns (like focal spikes, sharp waves, or spike-and-wave complexes originating in the temporal lobes), and neuroimaging findings (such as mesial temporal sclerosis, tumors, vascular malformations, and other structural lesions in the temporal lobes) are typically considered.
A total of 76 human volunteers, consisting of 38 TLE patients and 38 healthy controls, were recruited from the Affiliated Hospital of Guangdong Medical University. All patients or their families/legal guardians were of Han Chinese descent and provided informed consent upon enrollment. Along with basic information like age and sex, specific details such as age at TLE onset and drug response were documented for the TLE patients during the field investigation. In 2010, the International League Against Epilepsy proposed a classification for drug-resistant epilepsy in patients with TLE [17]. Patients were categorized based on their response to drug treatments. Those who did not show significant improvement, had a reduction in seizure frequency of less than 60%, or experienced an increase in seizure frequency after one year of treatment with at least two suitable and tolerated medications were classified as drug-resistant. Patients who did not meet these criteria were considered drug-sensitive.
Firstly, the CpG islands surrounding the promoter regions of the four SLCs (SLC2A1, SLC6A1, SLC9A64, and SLC35A2) were assessed, ranging from –2 kb to 1 kb downstream of the first exon. The criteria included a length greater than 200 bp, a percentage of alleles C+G greater than 50%, and an observed/expected ratio exceeding 0.60. SLC2A1, SLC6A1, SLC9A64, and SLC35A2 each exhibited three, two, two, and one CpG islands, respectively, containing a total of 77, 38, 34, and 10 CpG sites within them. Polymerase chain reaction (PCR) primers were designed based on the DNA sequences of CpG islands (from Homo sapiens build CBI37/hg19) using Methylation Primer software 1.0 from Tiangen Biotech, Beijing. The primers were specifically designed for the multiplex amplification of bisulfite-converted DNA. A total of four, two, two, and one pair of primers were individually constructed to cover the DNA sequences of CpG islands in SLC2A1, SLC6A1, SLC9A64, and SLC35A2. The primer sequences can be found in Table 1.
| Gene | Primers (5′→3′) |
| SLC2A1_1 | F: TGGGYGAGTTTTTGGTTAGTGAGGT |
| R: AATTAACCAAAAAWAATAACRAACRCCTATAATCC | |
| SLC2A1_2 | F: AGGGGTGTGTGGGTAGGA |
| R: CCAACTTACCTTACAACCRAATACC | |
| SLC2A1_3 | F: GTTGGGGTTGGGGATATAGG |
| R: ACCAAACCRCCCACCTACA | |
| SLC2A1_4 | F: GTTTAGGATAGGTTGGGTTTTAGGT |
| R: AAACTCCCACTACRACTCTAACTCC | |
| SLC6A1_1 | F: GGGTGAGTTGYGTTGAGTTTAGG |
| R: CCRACCRCCCTTTCCTACCT | |
| SLC6A1_2 | F: AGTTGGTATTGGATTTTGTTGGAGT |
| R: TCAACCCAAACCCCRATATACTT | |
| SLC9A6_1 | F: GTGAGTTTTYGGGGAGTGGT |
| R: AACCCCTACCCAATCAAAAAC | |
| SLC9A6_2 | F: AAAAGGTGTGGAGAGGTAGATAAAATG |
| R: AACAAATTCCTCAACCCTTATCAAC | |
| SLC35A2 | F: ATTATTAGGTGTTTTATGGTTGGATTG |
| R: CTTATTTATCCTCACCTACTCTACTTTTATCTAC |
SLC, solute carrier; PCR, polymerase chain reaction.
Peripheral blood (3 mL) was collected from each participant, and 1 mL was used
to extract genomic DNA by an automatic nucleic acid extractor (Tiangen Biotech,
Beijing, China). The genomic DNA was then subjected to bisulfite treatment with
the EZ DNA Methylation-Gold kit (Zymo Research, Orange County, CA, USA), in
accordance with the manufacturer’s protocol, to transform the unmethylated allele
C to allele U. The bisulfite-treated genomic DNA was amplified with the optimized
panel of primer mixtures using a HotStarTaq polymerase kit (Takara, Tokyo,
Japan). Biotinylated primers were utilized in the construction of libraries, and
the resulting biotinylated products were subjected to paired-end sequencing (2
The identity of the SH-SY5Y cell line (Cellverse Bioscience Technology, Shanghai, China) was confirmed through short tandem repeat (STR) profiling by the manufacturer. PCR and electrophoresis were used to test for mycoplasma contamination, and four samples consistently yielded negative results in comparison to the positive controls. The SH-SY5Y cells were cultured with high-glucose Dulbecco’s modified Eagle’s medium (DMEM) containing 10% fetal bovine serum (FBS) in a culture flask and then transferred to two 6-well plates. Once the cells had attached to the wall and proliferated to 2/3 of the bottom plate area, the culture medium was removed. One well was designated as the blank control group, with medium that did not contain the DNA methylation inhibitor decitabine (InvivoChem, Libertyville, IL, USA). The remaining 2–6 wells were treated with a precast solution of decitabine and culture medium, resulting in decitabine concentrations of 25 µM/L, 50 µM/L, 75 µM/L, and 100 µM/L in each well. The plates were then placed in a constant temperature incubator for 48 hours. Afterwards, genomic DNA was extracted from cells in the first 6-well plate using the DNA extraction kit (Beyotime Biotechnology, Beijing, China) for bisulfite sequencing PCR, and total RNA was extracted from cells in the second 6-well plate using the RNA extraction kit (Beyotime Biotechnology, Beijing, China) for real-time quantitative PCR.
The DNA methylation data revealed that the methylation rates of the two CpG islands near the promoter of the SLC6A1 gene were 3.8% for the first island (SLC6A1_1) and 8.1% for the second island (SLC6A1_2) in healthy controls. This indicates that the second island was highly methylated compared to the first one. Hence, the selection of the second island was made in order to evaluate how DNA methylation impacts the expression of the SLC6A1 gene. In order to assess the level of DNA methylation, we amplified a 270-bp sequence that covers the highly methylated CpG island (Homo sapiens build CBI37/hg19, NM_001348250, 11034911..11035180) using the primers F 5′-GAAAGTYGGGGTTGGGAGAG-3′ and R 5′-CCCCRCAAATTATACTAAATTCTAC-3′ for bisulfite sequencing PCR.
The genomic DNA underwent bisulfite treatment utilizing the EZ DNA
Methylation-Gold kit (Zymo Research, Orange County, CA, USA) following the
manufacturer’s protocol. Subsequently, the bisulfite-treated genomic DNA was
amplified with a reaction mixture containing 1x HotStarTaq buffer, 2.0 mM
Mg2+, 0.2 mM dNTP, 0.2 µM of each primer, 1 U of HotStarTaq
polymerase (Takara, Tokyo, Japan), and 1 µL of template DNA. The
cycling program started with an initial step of heating the sample to 95
°C for 2 minutes. This was followed by a series of 11 cycles, where the
sample was heated to 94 °C for 20 seconds, then cooled to 62 °C
at a rate of 0.5 °C per cycle for 40 seconds, and maintained at 72
°C for 1 minute. Subsequently, there were 24 cycles of heating to 94
°C for 20 seconds, cooling to 56 °C for 30 seconds, and
maintaining the temperature at 72 °C for 1 minute. The program then
concluded with a final step of heating to 72 °C for 2 minutes before
cooling to 4 °C indefinitely. Finally, 0.5 U of Shrimp Alkaline Phosphatase (SAP) and 4 U of Exo I
were added to 8 µL of the PCR product. The mixture was incubated at
37 °C for 60 minutes, followed by incubation at 75 °C for 15
minutes. The purified products were then sequenced using the paired-end
sequencing protocol (2
The quantification of SLC6A1 mRNA levels was carried out through
real-time quantitative PCR, utilizing the primers F
5′-GTGGAAACAGTGCGACAACC-3′ and R 5′-GACGAATCCTGGAACATGC-3′. The
procedure included reverse transcription using the RevertAid First Strand cDNA
Synthesis Kit by Thermo Fisher Scientific (Waltham, MA, USA). The reaction
mixture underwent incubation at 42 °C for 1 hour, then was inactivated
at 70 °C for 5 minutes. Subsequently, the reaction was assembled in a
total volume of 20 µL, comprising 0.4 µL of cDNA, 10
µL of 2x SYBR Green Master Mix, 0.4 µL of each primer,
ROX Reference Dye (50
The count data were analyzed using either the chi-squared test or Fisher’s exact
test, while the measurement data were analyzed using Student’s t-test
and presented as the mean
A total of 38 TLE patients and 38 healthy individuals were included in this
case-control study. The TLE patients were stratified based on age and age at TLE
onset using a dichotomous classification method. Table 2 provides information on
sex, age, age at onset, and drug response. There were no significant differences
in sex or age between the TLE group and the control group (p
| TLE | Controls | p | ||
| Sex (male/female, n) | 18/20 | 19/19 | 0.8185 | |
| Age (mean |
32.08 |
33.42 |
0.6022 | |
| Young | 20.16 |
- | - | |
| Old | 44.00 |
- | - | |
| Age at onset (mean |
23.32 |
- | - | |
| Early-onset | 12.00 |
- | - | |
| Late-onset | 34.63 |
- | - | |
| Drug response (n) | 38 | - | - | |
| Sensitive cases | 24 | - | - | |
| Resistant cases | 14 | - | - | |
SEM, standard error of the mean; TLE, temporal lobe epilepsy.
The DNA methylation rate of SLC6A1 was found to be significantly lower in the TLE group compared to the control group. Conversely, the TLE group had significantly higher DNA methylation rates in SLC9A6 and SLC35A2 than the control group. Following the Bonferroni correction, only the DNA methylation rate of SLC6A1 remained different between the TLE group and the control group (Table 3). Based on the hypomethylated SLC6A1 in TLE, a predictive model was established that showed promise in distinguishing and calibrating TLE (Fig. 1), further supporting the involvement of SLC6A1 in TLE from an epigenetic perspective.
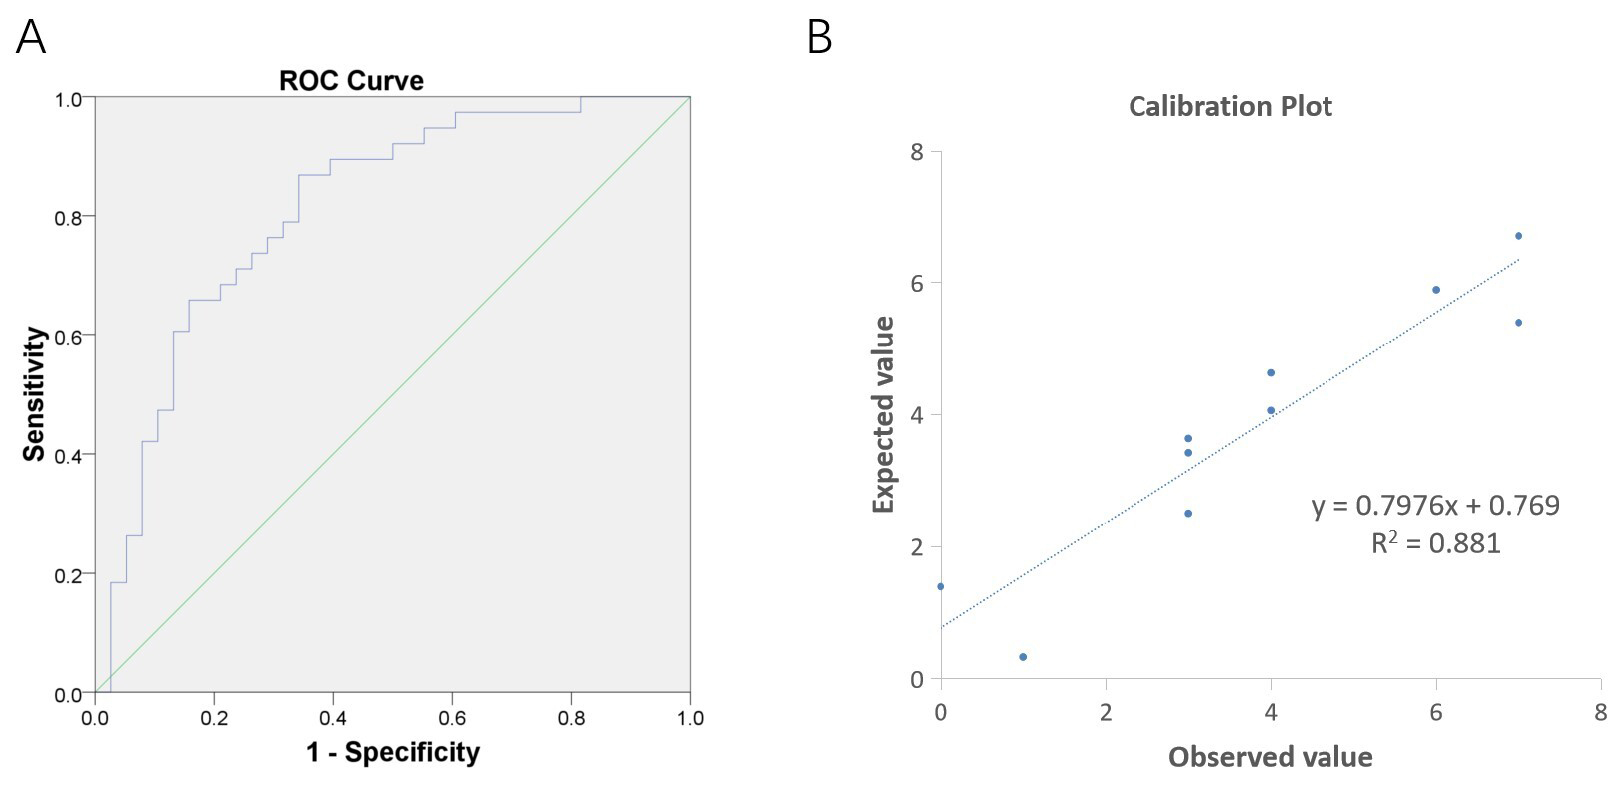 Fig. 1.
Predictive model based on hypomethylated SLC6A1 in TLE. (A) The area under the curve (AUC) of the receiver operating characteristic curve (ROC) was 0.8102 with a 95% confidence interval (CI: 0.7118–0.9087). This value is higher than the threshold of 0.7500, indicating a promising ability of the model to discriminate TLE patients. (B) The Hosmer-Lemeshow test yielded a p-value of 0.6096, exceeding the threshold of 0.0500. Additionally, the Calibration Plot displayed a linear relationship between predicted and actual values, indicating a well-calibrated predictive model.
| Genes | TLE cases | Controls | OR | p | p |
| (Mean |
(Mean |
(t test) | (Bonferroni) | ||
| SLC2A1 | 10.63 |
11.27 |
0.94 | 0.1149 | 0.4596 |
| SLC6A1 | 4.81 |
5.77 |
0.83 | 0.0000 | 0.0000 |
| SLC9A6 | 21.31 |
13.01 |
1.63 | 0.0271 | 0.1084 |
| SLC35A2 | 18.97 |
12.62 |
1.50 | 0.0303 | 0.1215 |
OR, odds ratio.
The study also examined TLE patients and discovered that the DNA methylation rates of SLC9A6 and SLC35A2 were notably lower in male patients than in female patients. Nonetheless, following adjustments for age, age at onset, and drug response, no remarkable distinction was detected. There was a notable difference in the DNA methylation rate of SLC6A1 between the young patients and the older controls, with the former showing lower levels. Additionally, the stratified analysis of age at onset and drug response revealed no difference in methylation rates. The stratified analysis for TLE patients is comprehensively outlined in Table 4.
| Genes | Methylation rate | Methylation rate | OR | pa | pb |
| (Mean |
(Mean | ||||
| Sex | male | female | |||
| SLC2A1 | 10.68 |
10.57 |
1.01 | 0.8580 | 0.3308 |
| SLC6A1 | 4.76 |
4.87 |
0.97 | 0.6490 | 0.9935 |
| SLC9A6 | 5.68 |
35.38 |
0.16 | 0.0000 | 0.9975 |
| SLC35A2 | 7.11 |
29.63 |
0.24 | 0.0000 | 0.9967 |
| Age | young | old | |||
| SLC2A1 | 10.51 |
10.74 |
0.98 | 0.7090 | 0.0552 |
| SLC6A1 | 4.42 |
5.22 |
0.85 | 0.0004 | 0.0436 |
| SLC9A6 | 21.11 |
21.50 |
0.98 | 0.9450 | 0.8391 |
| SLC35A2 | 18.47 |
19.46 |
0.95 | 0.8140 | 0.9980 |
| Age at onset | early-onset | late-onset | |||
| SLC2A1 | 10.71 |
10.54 |
1.02 | 0.7766 | 0.2260 |
| SLC6A1 | 4.57 |
5.07 |
0.90 | 0.0374 | 0.8881 |
| SLC9A6 | 23.79 |
18.83 |
1.26 | 0.3655 | 0.9984 |
| SLC35A2 | 20.24 |
17.70 |
1.14 | 0.5449 | 0.9982 |
| Drug response | drug-sensitive | drug-resistant | |||
| SLC2A1 | 10.76 |
10.33 |
1.04 | 0.4638 | 0.7241 |
| SLC6A1 | 4.81 |
4.80 |
1.00 | 0.8977 | 0.7957 |
| SLC9A6 | 24.52 |
16.89 |
1.45 | 0.2162 | 0.9983 |
| SLC35A2 | 20.41 |
17.17 |
1.19 | 0.5119 | 0.9982 |
Remark: pa values were calculated using Student’s t-test, and pb values were further adjusted for sex, age, age at onset, and drug response using binary logistic regression.
As mentioned above, the 270-bp sequence covering 17 CpG sites was employed to evaluate the silencing effect of DNA methylation on the expression of the SLC6A1 gene. Under incubation with decitabine, a DNA methylation inhibitor with a set dose gradient, no methylation was detected in eight of them, while the remaining nine had varying rates of DNA methylation. These rates displayed a decreasing trend with increasing concentrations of decitabine (Fig. 2A). Additionally, the relative levels of SLC6A1 mRNA showed a significant increasing trend with increasing concentrations of decitabine (Fig. 2B). The data presented here provides experimental proof for the role of DNA methylation in suppressing the transcription of the SLC6A1 gene through its promoter region.
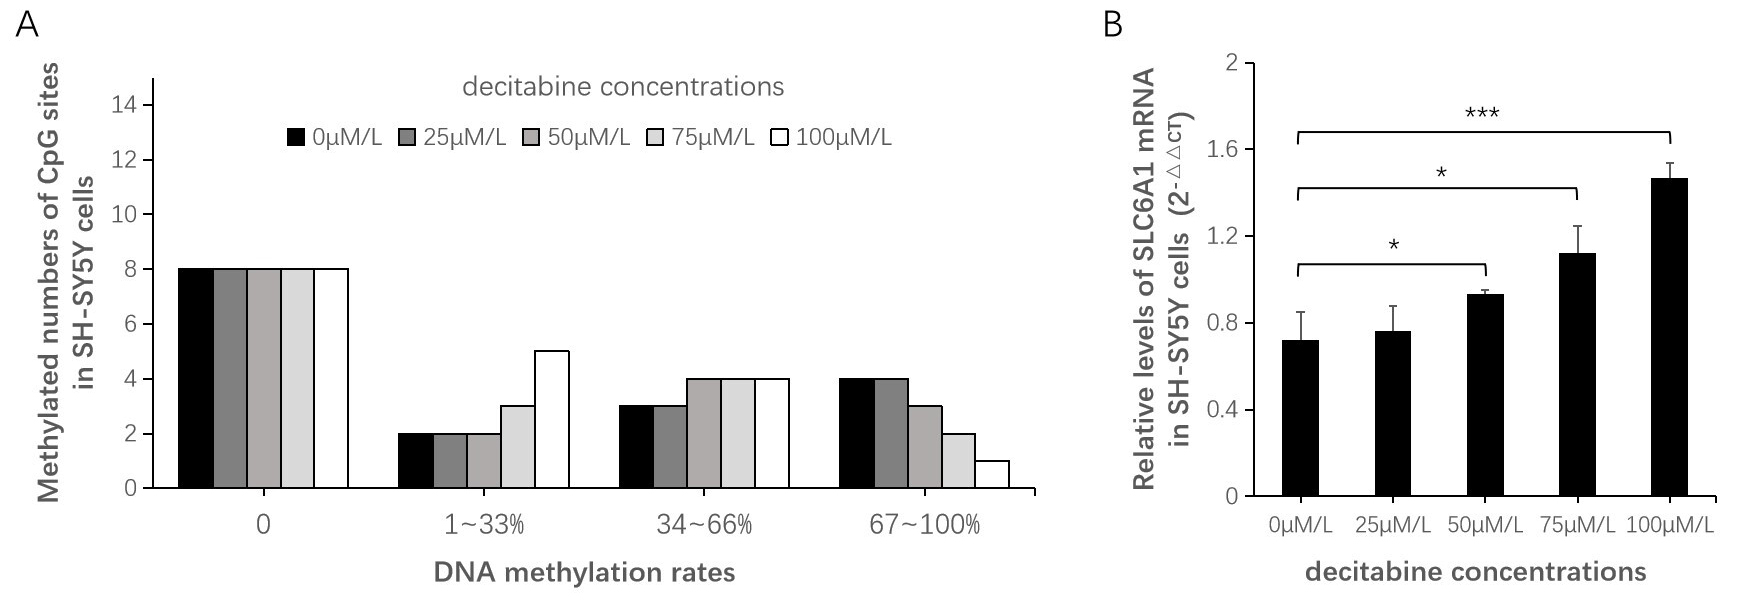 Fig. 2.
Silencing effect of DNA methylation on SLC6A1 gene
expression. (A) Among the 17 CpG sites, no methylation was detected in 8 of
them. Among the remaining sites, the numbers of 1–33% methylation show an
increasing trend with increasing concentration of decitabine, while the numbers
of 67–100% methylation show a decreasing trend with increasing concentration of
decitabine. (B) The relative levels of SLC6A1 mRNA showed a 1.29-fold
increase at 50 µM/L (p = 0.0496), a 1.56-fold increase at
75 µM/L (p = 0.0177), and a 2.03-fold increase at 100
µM/L (p = 0.0009) compared to the blank control group (0
µM/L). *p
Typically, GABA is quickly released into the synaptic cleft in response to an action potential and functions to inhibit the spread of excitation by binding to GABA receptors on the postsynaptic neurons. Afterwards, GABA needs to be transported into the presynaptic terminals or adjacent astrocytes. The SLC6A1 gene codes for GABA transporter 1 (GAT1), which plays a crucial role in transporting the inhibitory neurotransmitter GABA from the synaptic cleft back into presynaptic neurons [6, 8]. Currently, a plethora of genetic studies have observed epileptic seizures in patients carrying SLC6A1 mutations, and a significant number of patients met the diagnostic criteria for absence status epilepticus, myoclonic atonic epilepsy, and generalized epilepsy [8, 18, 19, 20, 21, 22, 23, 24].
In particular, seven exonic variants of the SLC6A1 gene were identified among 460 unrelated patients with epilepsy. These variants were found to reduce GABA transport activity using a GABA transport assay [8]. Reduced activity of GAT-1 function may lead to the biodegradation of GABA in the cleft, resulting in a decrease in the amount of intracellular GABA that returns from the synaptic cleft. This can lead to insufficient GABA available for release, which in turn can disrupt GABA-mediated inhibitory signaling and contribute to epilepsy [25, 26]. Interestingly, valproic acid is the most effective drug, and most patients carrying SLC6A1 mutations achieve seizure-free status [18], supporting its ability to replenish GABA in the brain.
On the other hand, GABA-mediated inhibitory signaling could be theoretically hampered, while GAT1 activity abnormally enhances. Postsynaptic neurons would be susceptible to excitatory stimulation because GABA released into the synaptic cleft is rapidly retrieved by GAT1. By enhancing GABA homeostasis through GAT1, betaine demonstrates promise as a neuromodulator for inhibitory pathways [27]. In our study, the DNA methylation rate of SLC6A1 significantly decreased in the TLE patients compared with the controls, and a predictive model was further constructed and showed promising ability to discriminate and calibrate TLE. Within the TLE group, the DNA methylation rate of SLC6A1 was significantly enhanced in older patients. Taken together, these results provide strong support for the role of SLC6A1 in TLE from an epigenetic perspective. Based on the biological effects of DNA methylation on inhibiting gene expression via transcriptional silencing [14, 15], the DNA methylation rate of SLC6A1 increases with age. This implies a certain compensation after TLE onset for recurrent seizures through inhibiting SLC6A1 expression and strengthening GABA-mediated inhibitory signaling. Therefore, we presume that SLC6A1 needs to maintain a moderate level for normal biological activities. Both an abnormal increase and loss of function may lead to the development and spread of epileptic seizures. The specific mechanism behind this remains to be explored in the future.
SLC9A6 is involved in controlling cell pH and volume by swapping intracellular hydrogen ions with extracellular sodium ions. When mutated, SLC9A6 typically leads to X-linked Christianson syndrome, which is characterized by behavioral abnormalities in affected males, such as drug-resistant epilepsy [28]. SLC35A2 is responsible for transporting uridine diphosphate galactose (UDP galactose) from the cytosol into Golgi vesicles to produce glycans. Mutations in SLC35A2 have been linked to brain disorders, including epilepsy-associated malformations of cortical development and Rett syndrome [29, 30, 31]. In the present study, no significant difference in DNA methylation rates of SLC9A6 and SLC35A2 was observed between TLE patients and healthy controls after accounting for age, age at onset, and drug response. This suggests that SLC9A6 and SLC35A2 may not play a role in modulating epileptic seizures through DNA methylation. On the other hand, SLC9A6 and SLC35A2 are encoded on the X chromosome, and their DNA methylation rates increased by 4–7 fold in female patients compared to male patients. This could be associated with the double copy number of the X chromosome in women compared to the single copy number in men [32].
It is important to note several limitations of this study. Firstly, the study concentrated solely on four specific SLCs, guided by previous evidence related to epileptic encephalopathies [7]. It remains uncertain whether DNA methylation of other members of the SLC superfamily contributes to TLE. Secondly, the study employed SH-SY5Y cells demethylated by decitabine to validate the silencing effect of DNA methylation on SLC6A1 gene expression. Nevertheless, the study did not assess the protein levels of these SLCs in peripheral blood because of their exclusive expression in neural tissues [33]. Consequently, the findings may not be relevant to brain pathologies of TLE. Additionally, all participants in the study were of Han Chinese descent. It is essential to approach generalizations about other ethnic populations, considering that DNA methylation can be affected by postnatal environmental influences and inherited by offspring.
This study is the first to show abnormal weakening in DNA methylation of the SLC6A1 gene in TLE. The predictive model displayed promising potential in accurately identifying and calibrating TLE. In individuals with TLE, the DNA methylation levels of SLC6A1 increased in older patients. Additionally, the inhibitory effect of DNA methylation on SLC6A1 gene expression was confirmed in SH-SY5Y cells by demethylation. The evidence suggests that lower methylation of SLC6A1 may stimulate transcription in TLE, however, further investigation is necessary to confirm the exact mechanism.
All data points generated or analyzed during this study are included in this article and there are no further underlying data necessary to reproduce the results.
HT, KL, and XZhou collaborated on the study design. ZW and YL collected blood samples. XZhang conducted biological experiments. HT analyzed the data and draft the manuscript. HT and XZhou secured funding for the project and reviewed the manuscript. All authors contributed to editorial changes in the manuscript. All authors read and approved the final manuscript. All authors have participated sufficiently in the work and agreed to be accountable for all aspects of the work.
Before starting the study, approval was obtained from the Ethics Committee of the Affiliated Hospital of Guangdong Medical University in accordance with the Declaration of Helsinki (Grant No. YJYS2021025KT) for all research involving human participants. All patients or their families/legal guardians were provided informed consent upon enrollment.
We appreciate Genesky Biotechnologies Inc., Shanghai, China, for assistance in the methylation experiments.
This study was funded by the Science and technology development project of Zhanjiang (Grant No. 2021A05051), the Medical Scientific Research Foundation of Guangdong Province of China (Grant No. A2022203), the Natural Science Foundation of Guangdong Province (Grant No. 2022A1515012615), and the Funds for High-Level Talents in the Affiliated Hospital of Guangdong Medical University (Grant No. GCC2023011).
The authors declare no conflict of interest.
References
Publisher’s Note: IMR Press stays neutral with regard to jurisdictional claims in published maps and institutional affiliations.