


1 Department of Radiology, The First Affiliated Hospital, Jiangxi Medical College, Nanchang University, 330006 Nanchang, Jiangxi, China
2 Neuroimaging Laboratory, Jiangxi Province Medical Imaging Research Institute, 330006 Nanchang, Jiangxi, China
3 Department of Pain, The First Affiliated Hospital, Jiangxi Medical College, Nanchang University, 330006 Nanchang, Jiangxi, China
†These authors contributed equally.
Abstract
Background: Shingles can cause long-term pain and negative emotions, along with changes in brain function. In this study, Granger Causality Analysis (GCA) was used to compare herpes zoster (HZ) and postherpetic neuralgia (PHN) differences in effective connections within the “pain matrix” between patients and healthy controls to further understand patterns of interaction between brain regions and explore the relationship between changes in effective connections and clinical features. Methods: Resting-state functional magnetic resonance imaging (fMRI) scans were performed on 55 HZ; 55 PHN; and 50 age-, sex- matched healthy controls (HCs). The brain regions associated with the pain matrix are used as the seeds of effective connectivity. GCA was used to analyze effective connections in brain regions that differed significantly between groups. Then the correlation between GCA values and clinical indicators was studied. Results: Compared with HC, GCA values between the thalamus and the amygdala, between the thalamus and the precentral gyrus, from the thalamus to the postcentral gyrus, and from the parahippocampal gyrus to the amygdala, anterior cingulate gyrus were significantly reduced in HZ patients. Compared with HC, GCA values between the insular and the postcentral gyrus, from the insular to the inferior parietal lobe, and from the postcentral gyrus to the amygdala were significantly reduced in PHN patients. Compared with HZ, GCA values between the inferior parietal lobe and the parahippocampal gyrus, between the inferior parietal lobe and the anterior cingulate gyrus, and from the anterior cingulate gyrus to the amygdala were significantly increased in PHN patients. The visual analogue scale (VAS) score of PHN patients was positively correlated with the GCA value from the central posterior lobe to the insula. Conclusions: PHN and HZ patients showed a broad reduction in effective connections, mainly reflected in abnormal pain pathway regulation, pain perception, negative emotion and memory production, providing new perspectives to understand the neuroimaging mechanisms of shingles.
Keywords
- postherpetic neuralgia
- herpes zoster
- pain matrix
- resting-state magnetic resonance
- effective connection
- granger causality analysis
Herpes zoster (HZ) is an infectious disease caused by the varicella-zoster virus (VZV), which first invades the human body and then lies dormant in the dorsal root ganglion and may be reactivated by weakened immunity or other factors, moving outward along nerve fibers to the skin, causing a rash and pain along the ganglia [1]. Postherpetic Neuralgia (PHN) is a chronic pain condition that occurs after shingles has healed, usually persists a month after the rash has subsided, and is also the most common complication of HZ [2]. In the process of PHN formation, VZV causes a central sensitization leading to peripheral nerve fiber destruction, nerve fiber regeneration and repair, and central projection fiber lesions, which are the main causes of pain [3]. In our country, the prevalences of HZ and PHN are 7.7% and 2.3%, respectively, with 29.8% of HZ patients further developing PHN [4], and the incidence of PHN increases with age [5]. Due to this unbearable pain and the increasing incidence, it can lead to a series of psychological problems that can have a serious negative impact on the physical and mental health of patients [6]. The mechanism of PHN is complex, which makes it impossible for existing drug therapies to completely solve the pain problem of patients [7]. Therefore, we need to further explore the neural mechanism of PHN to provide more clinical help.
Pain is often described as an unpleasant feeling accompanied by an uncomfortable emotional response [8]. Pain stimuli activate a wide range of cortical and subcortical regions, including the thalamus, insula, parahippocampal gyrus, amygdala, primary somatosensory cortex (SI), primary somatomotor cortex (M1), anterior cingulate gyrus, and inferior parietal lobe; together, these regions constitute the “pain matrix” [9, 10, 11]. Some scholars believe that these regions are not specifically and individually involved in the perception of pain, instead forming an interactive system in which the activity across regions changes to represent the inherent neural mechanisms of pain [8]. In recent decades, a growing number of neuroimaging studies have identified changes in brain function in patients with HZ and PHN [12, 13, 14, 15, 16, 17, 18, 19, 20, 21, 22, 23, 24], and these changes are primarily localized to the pain matrix described above. Patients with PHN have increased functional connections between the thalamus and S1 compared to healthy controls [12]; functional connections between the amygdala and posterior central gyrus and parietal lobe are reduced [25]; in addition, PHN and HZ patients have abnormal connections between the default network, frontoparietal network, and sensorimotor network [14]. Nonetheless, the interactions between these brain regions involved in the pain matrix have not been fully described, and the directionality of the previously observed functional connections is not known, so further identification of directional connections is needed to improve the understanding of the neural mechanisms of HZ and PHN.
Efficient Connectivity (EC) analysis reveals the direction of information transmission by measuring temporal differences in the sequence of activity in brain regions [26]. Granger causality analysis (GCA) is a special method used to study EC and can be used to deduce networks without prior knowledge based on hypothetical seed regions [27]. GCA is used to evaluate time series data of two variables to determine whether one variable can predict the future value of the other. In neuroscience, GCA is used to explore functional connectivity between different regions of the brain, especially when processing sensory stimuli such as pain. At present, some researchers are studying the directed functional connectivity of brain networks based on this method [28, 29, 30, 31], but few studies have applied GCA to the study of HZ.
In this study, we used GCA on resting-state functional magnetic resonance imaging (fMRI) data to identify effective connectivity patterns within the “pain matrix” in HZ and PHN, which will provide us with new insights into the mechanisms of HZ and PHN that can be revealed by neuroimaging. The purposes of this study are as follows: (1) to determine the difference between HZ and PHN patients and healthy controls in effective connections between the brain regions of the pain matrix to further understand the pattern of interactions between these brain regions and (2) to determine the relationship between the abnormal effective connection of the pain matrix and clinical features.
The clinical diagnosis of HZ and PHN was performed by two attending physicians
in the pain department in accordance with International Association for the Study
of Pain standards [32]. Inclusion criteria: (1) right-handed; (2) The HZ group
was marked by herpes, herpes did not subside within 2 weeks, and the pain score
All patients underwent a Visual analogue scale (VAS) score before MRI scan to assess the intensity of spontaneous pain, as well as the Hamilton Anxiety Scale (HAMA) and the Hamilton Depression Scale (HAMD) assessed the levels of anxiety and depression in all participants.
This study was conducted in accordance with the approved guidelines and the principles of the Declaration of Helsinki, and was approved by the Medical Research Ethics Committee and Institutional Review Committee of the First Affiliated Hospital of Nanchang University (Ethics No. 20200145). Participants were recruited at the Pain Department of the First Affiliated Hospital of Nanchang University, and each participant signed a written informed consent prior to participating in the study.
MRI data of all subjects were collected using a Siemens TIM Trio 3.0T (Erlangen,
Bavaria, Germany) scanner equipped with the Radiology Department of the First
Affiliated Hospital of Nanchang University in Nanchang, Jiangxi, China. rs-fMRI
data were collected by using gradient echo planar imaging (EPI) sequences
(repetition time (TR) = 2000 ms; echo time (TE) = 30 ms; flip angle =
90°; matrix = 64
All preprocessing steps were performed using the Data Processing Assistant for Resting-State fMRI (DPABI, http://www.rfmri.org/) and Statistical Parametric Mapping 12 (SPM12, http://www.fil.ion.ucl.ac.uk/spm) toolboxes for MATLAB 2018b (MathWorks, Inc., Natick, MA, USA). The following preprocessing steps were applied: (1) Convert original image files in Medical Standard for Digital Imaging and Communication (DICOM) format to Neuroimaging Informatics Technology Initiative (NIfTI) format; (2) Removal of the first 10 time points; (3) Slice timing, which means to adjust the time stamps of different layers of images collected at different time points to compensate for the time delay effect caused by the layer acquisition sequence in the scanning process; (4) Head motion correction, which is used to correct image deformations caused by small movements of the subject’s head during scanning, ensuring spatial consistency of the data; (5) Segmentation and registration: the T1-weighted structure image of the subject can be aligned with the functional image through linear transformation. The registered T1-weighted structure image is then divided into three parts: white matter, gray matter and cerebrospinal fluid. The segmented image needs to be spatially standardized. It is converted to the Montreal Neurological Institute (MNI) space using the Diffeomorphic Anatomical Registration Through Exponentiated Lie (DARTEL) algorithm [33]; (6) Spatial smoothing, Gaussian filters are applied to reduce noise in the image and enhance the signal, where the Full Width at Half Maximum (FWHM) is set to 6mm; (7) Filtering, retaining only the frequency component between 0.01 and 0.1 Hz, can remove both low-frequency physiological drift and device noise, and can exclude high-frequency physiological signals above 0.1 Hz, such as heartbeat and breathing noise; (8) De-trended linear drift removes any linear changes from the time series data; (9) Regression covariates, which remove variances associated with known noise sources from the fMRI signal, include head motion parameters in the Friston-24 model (which records small movements of the subject’s head during the scan), as well as effects from white matter (WM), cerebrospinal fluid (CSF), and global signals [34]. Finally, excluding subjects with head movement greater than 1.5 mm in the X, Y, and Z directions or any axial rotation greater than 1.5°, no subjects showed significant head movement and all magnetic resonance imaging (MRI) Data were included in subsequent analysis.
We selected the bilateral thalamus, insula, parahippocampal gyrus, amygdala, posterior central gyrus, anterior central gyrus, anterior cingulate gyrus and inferior parietal lobe as marked by the automated anatomical labeling (AAL) template in WFU_Pick Atlas_v3.0 software (https://www.nitrc.org/projects/wfu_pickatlas/) as the region of interest (ROI) for GCA analysis.
The calculation of ROI-wise GCA is based on the rest state hemodynamic Response Function toolbox in SPM12 (https://github.com/compneuro-da/rSHRf) [35, 36]. GCA can estimate the causal effect between each ROI. If the prediction of the future value of y can be improved by combining the past values of x and y rather than using only the past values of y, then x is called the Granger cause of y. Similarly, when the future value of x can be better predicted by combining the past values of y and x than by using only the past values of x, y is called the Granger cause of x. We first remove the global signal from the normalized function image to obtain a more stable residual Blood Oxygen Level-Dependent (BOLD) time series. In order to minimize hemodynamic response function (HRF) introduced hybrid effect, we use the hemodynamic response function to retrieve the resting state and deconvolution to extract specific HRF area and will observe the BOLD signal deconvolution for real neural signals, and then for outlier removal, the mean baseline deduction, and remove the task response mean and the mean time. Finally, the GCA values calculated by the toolbox are converted into normally distributed Z-scores for subsequent statistical analysis.
SPSS 26.0 (SPSS Inc., Chicago, IL, USA) software was used for statistical
analysis. The Shapiro-Wilk test is used to test the normality of continuous
variables. Mean
One-way ANOVA, with age and sex as covariates, was used to assess group-level GCA value differences. The Bonferroni correction was used for multiple comparisons, and the results of the post hoc comparisons were corrected by the false discovery rate (FDR). Effects were considered significant if the corresponding p values were less than 0.05.
The GCA values with significant inter-group differences were extracted for correlation analysis with clinical variables (VAS score, duration of disease, HAMA score and HAMD score), and age and gender were taken as covariables. First, the normal distribution of clinical variables was examined. If the data were normally distributed, the Pearson correlation coefficient was used to measure the linear correlation between the GCA value and each continuous clinical variable. If the data distribution does not satisfy the normal hypothesis, then the Spearman rank correlation coefficient is applied to evaluate the monotonic relationship between them. It is usually set to a p-value of less than 0.05, which ensures that our conclusions are statistically significant.
Detailed information are shown in Table 1. No significant group differences were observed in age and sex. There was no significant difference in VAS score between HZ group and PHN group. HAMA and HAMD scores in the patient group were significantly higher than those in the HC group, and those in the PHN group were significantly higher than those in the HZ group.
| HZ (n = 55) | PHN (n = 55) | HC (n = 50) | c2/U/F value | p value | |
| Age (years) | 63.65 |
64.49 |
61.66 |
1.687 | 0.188 |
| Sex (M/F) | 28/27 | 24/31 | 21/29 | 0.972 | 0.615 |
| VAS score | 6 (1) | 6 (1) | NA | –1.605 | 0.108 |
| Disease Duration (days) | 12 (10) | 61 (121)a | NA | –8.558 | |
| HAMA score | 17.84 |
25.09 |
5.78 |
123.69 | |
| HAMD score | 22.45 |
30.02 |
6.48 |
73.29 |
Data satisfying normal distribution were described as mean
Abbreviations: HC, healthy control; HZ, herpes zoster; PHN, postherpetic neuralgia; VAS, visual analog scale; HAMA, Hamilton Anxiety Scale; HAMD, Hamilton Depression Scale; ANOVA, analysis of variance; M, male; F, female.
Compared with HCs, HZ patients showed significantly reduced GCA values between
the left thalamus and the right amygdala, between the right thalamus and the
right precentral gyrus, from the right thalamus to the left amygdala and the left
postcentral gyrus, from the left precentral gyrus to the right thalamus, and from
the left parahippocampal gyrus to the left amygdala and the right anterior
cingulate gyrus (p
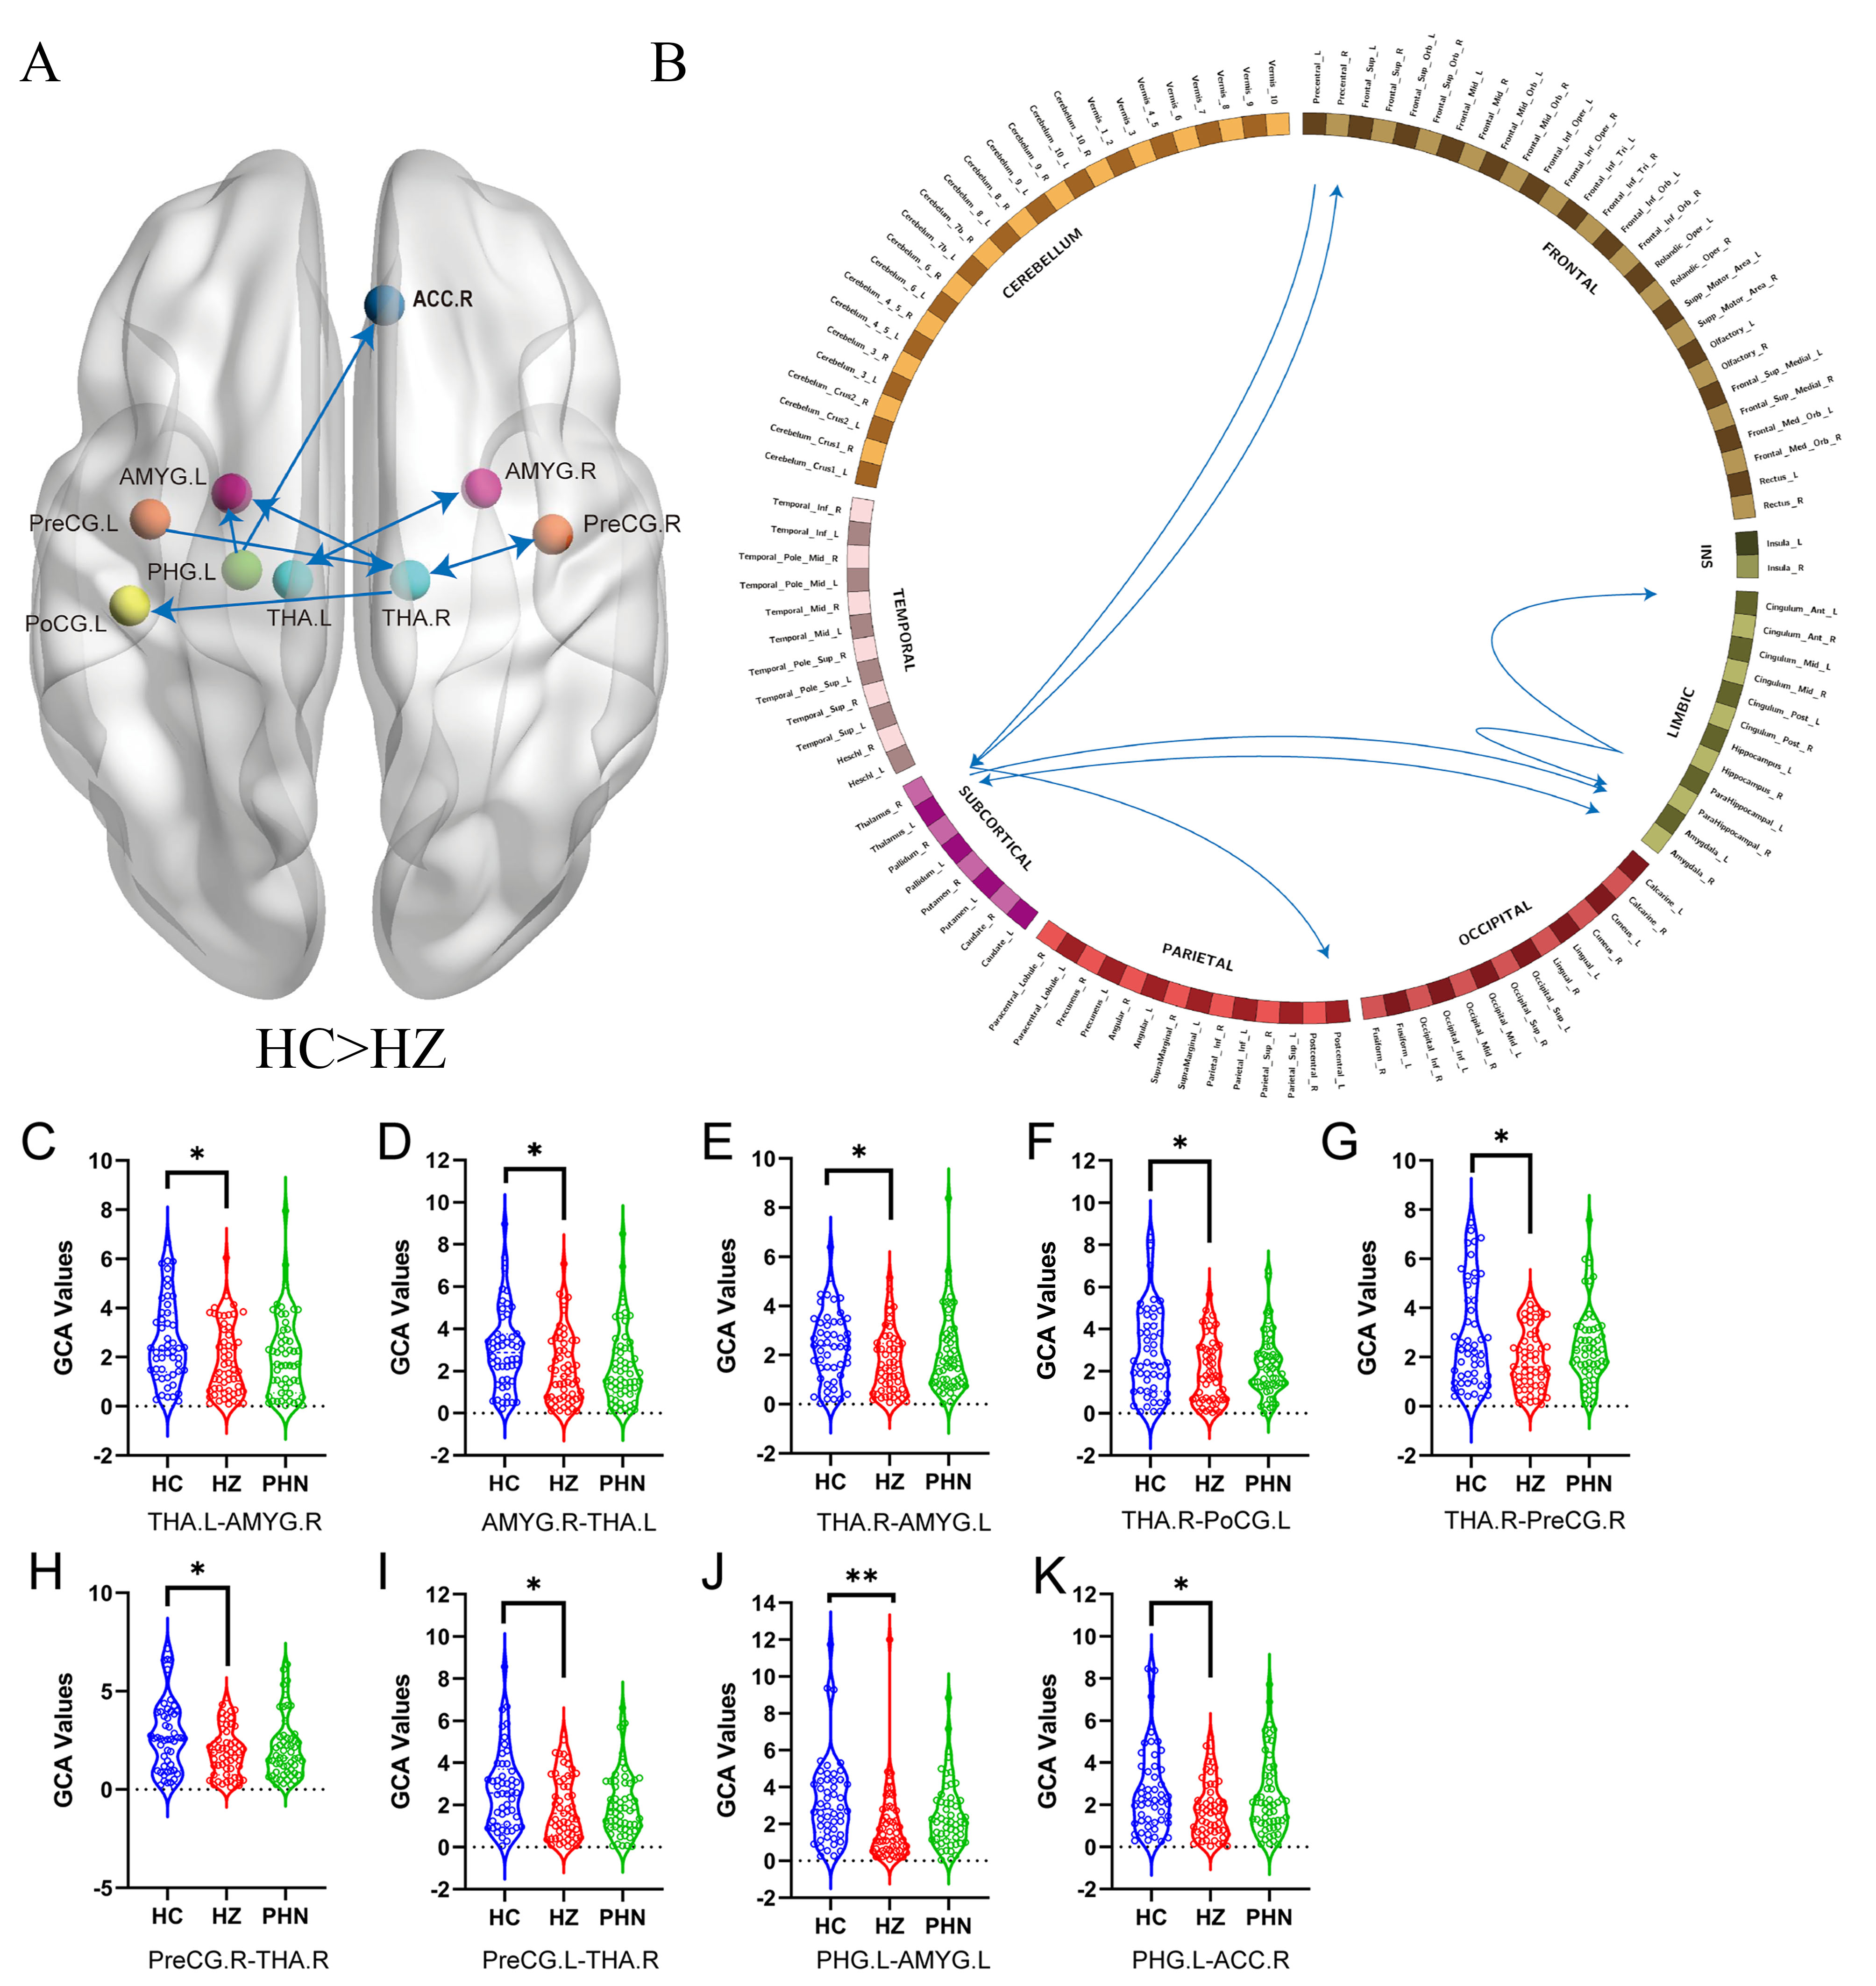 Fig. 1.
Schematic diagrams of effect
connections among the HZ and HC groups shown by GCA. (A,B) The blue line
indicates that the HZ group has fewer effective connections than the HC group.
(C–K) Violin diagrams showing the distribution of GCA values among the three
groups. * means p
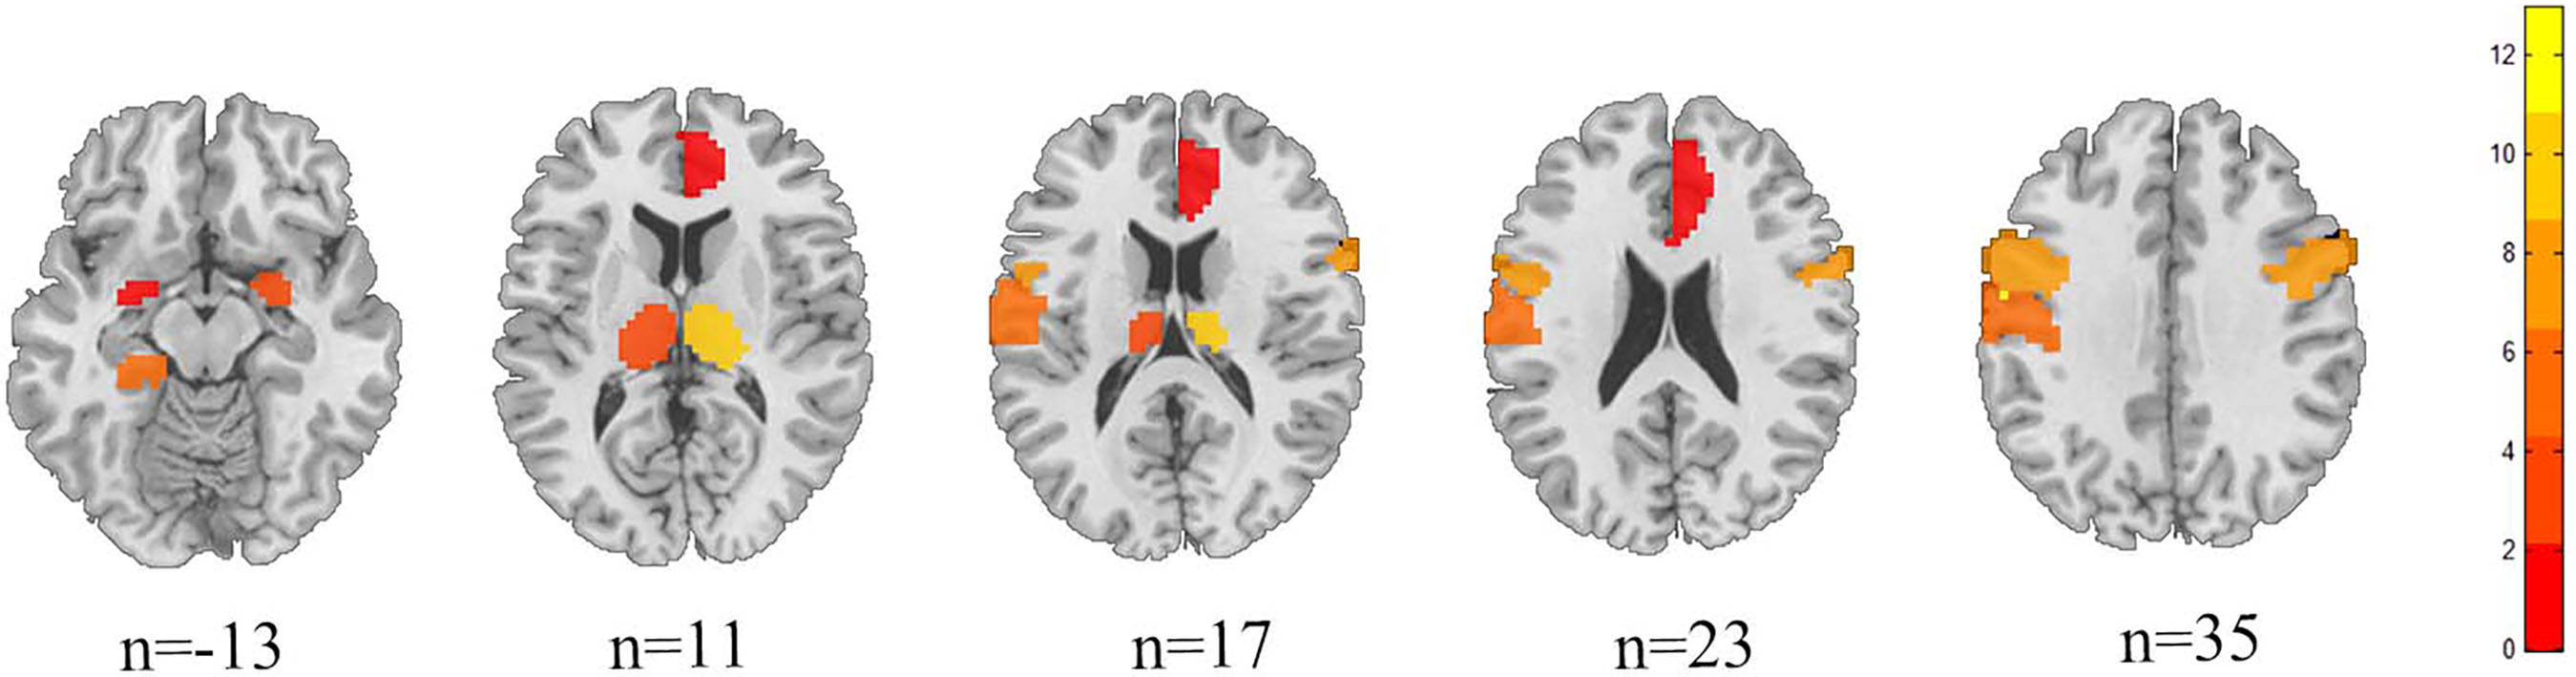 Fig. 2.
Structural anatomical map of the difference between HZ and HC brain regions.
Compared with HCs, PHN patients showed significantly reduced GCA values be-tween
the right insula and the right postcentral gyrus, from the right insula to the
left inferior parietal lobe, and from both sides of the postcentral gyrus to the
right amygdala (p
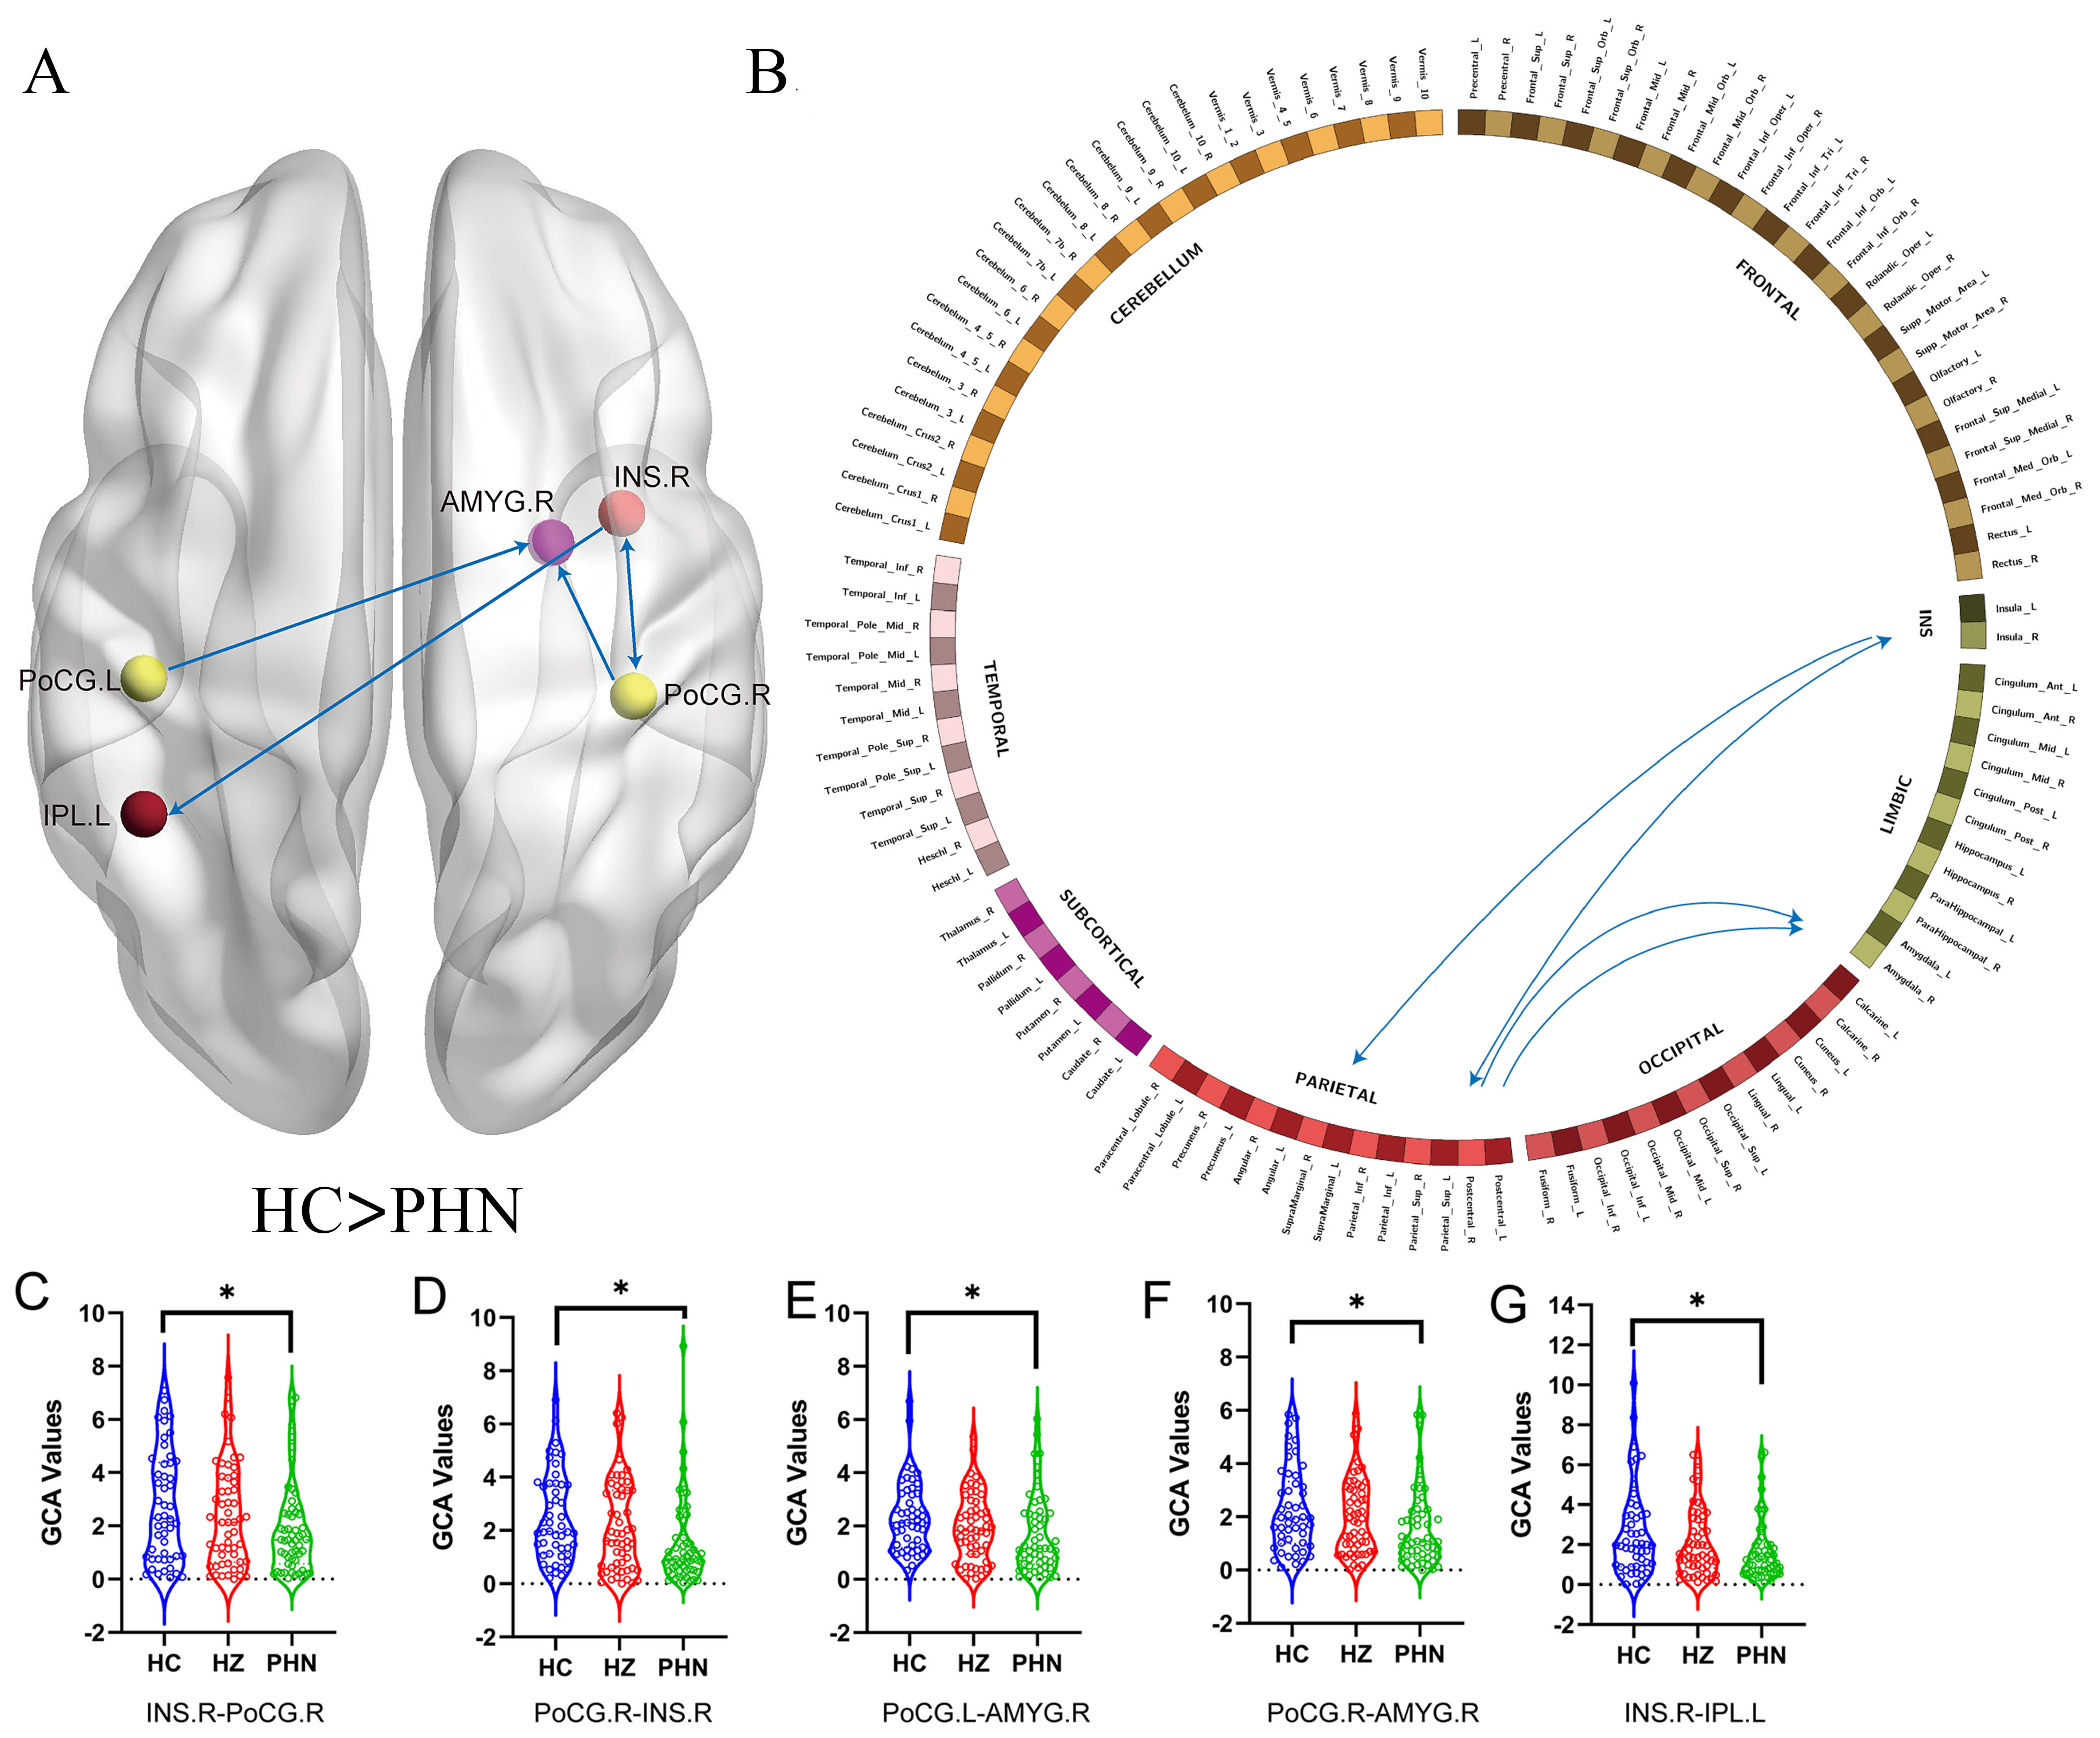 Fig. 3.
Schematic diagrams of effect connections among the HC and PHN
groups shown by GCA. (A,B) The blue line indicates that the PHN group has fewer
effective connections than the HC group. (C–G) Violin diagrams showing the
distribution of GCA values among the three groups. * means p
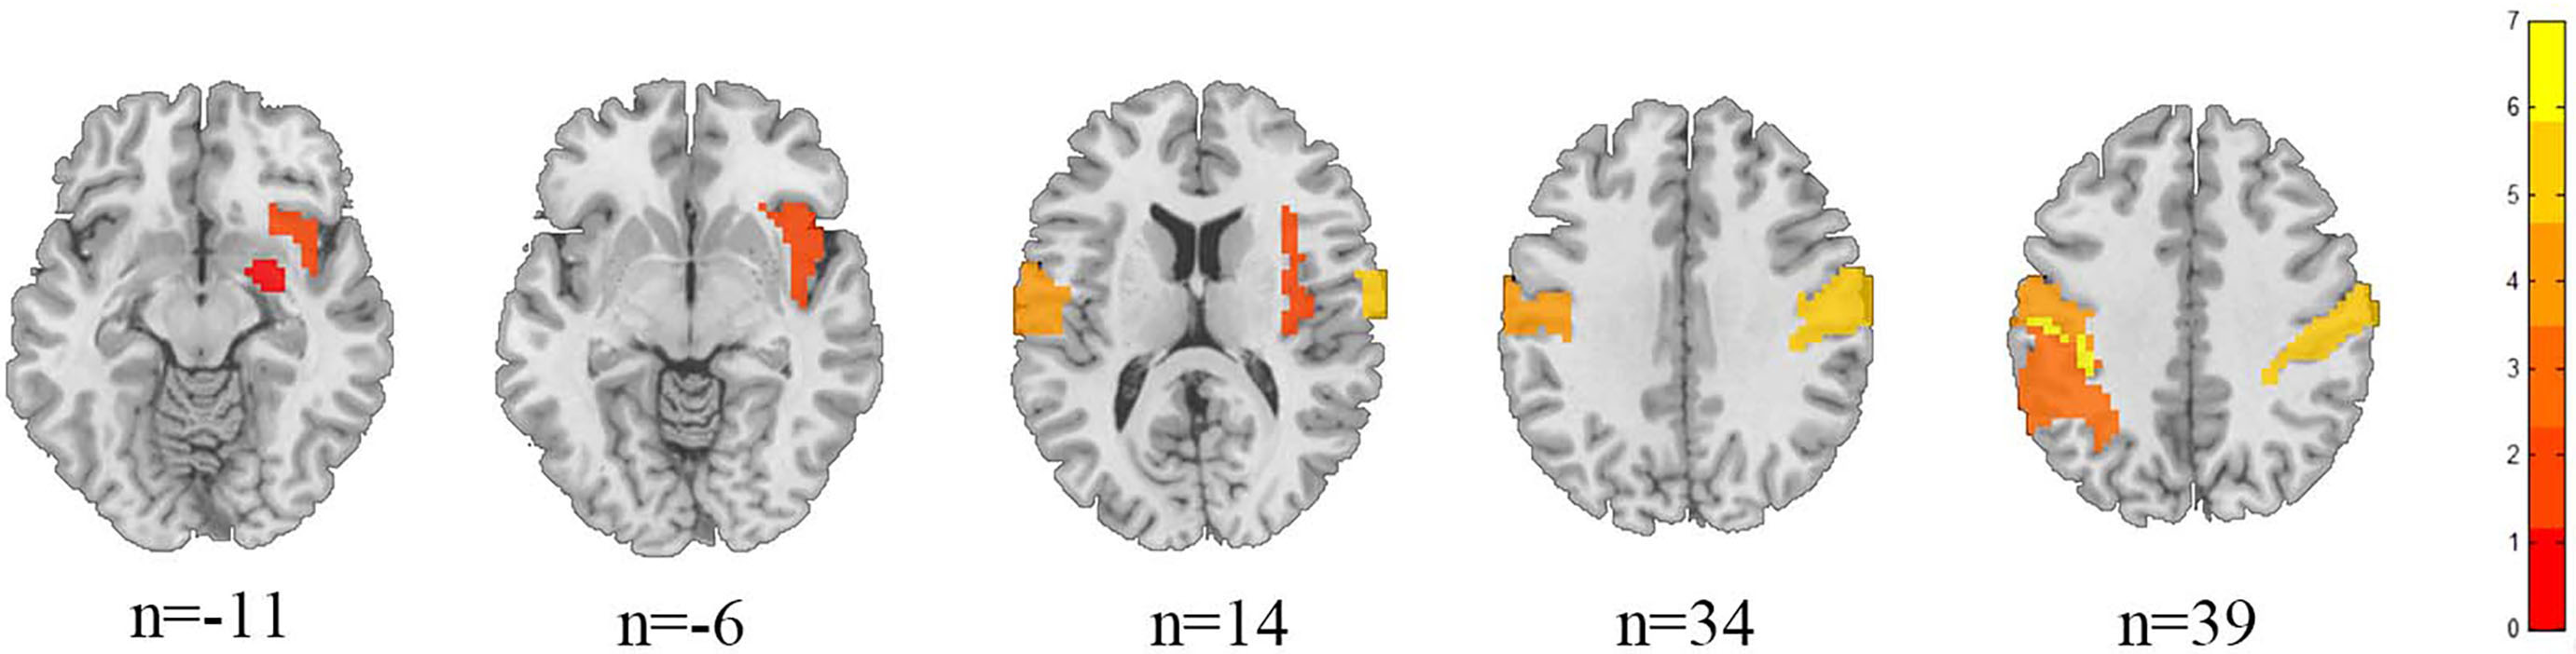 Fig. 4.
Structural anatomical map of the difference between PHN and HC brain regions.
Compared with HZ, PHN patients showed significantly increased GCA values
be-tween the right inferior parietal lobe and the left parahippocampal gyrus and
the right inferior parietal lobe and the right anterior cingulate gyrus, and from
the right anterior cingulate gyrus to the left amygdala (p
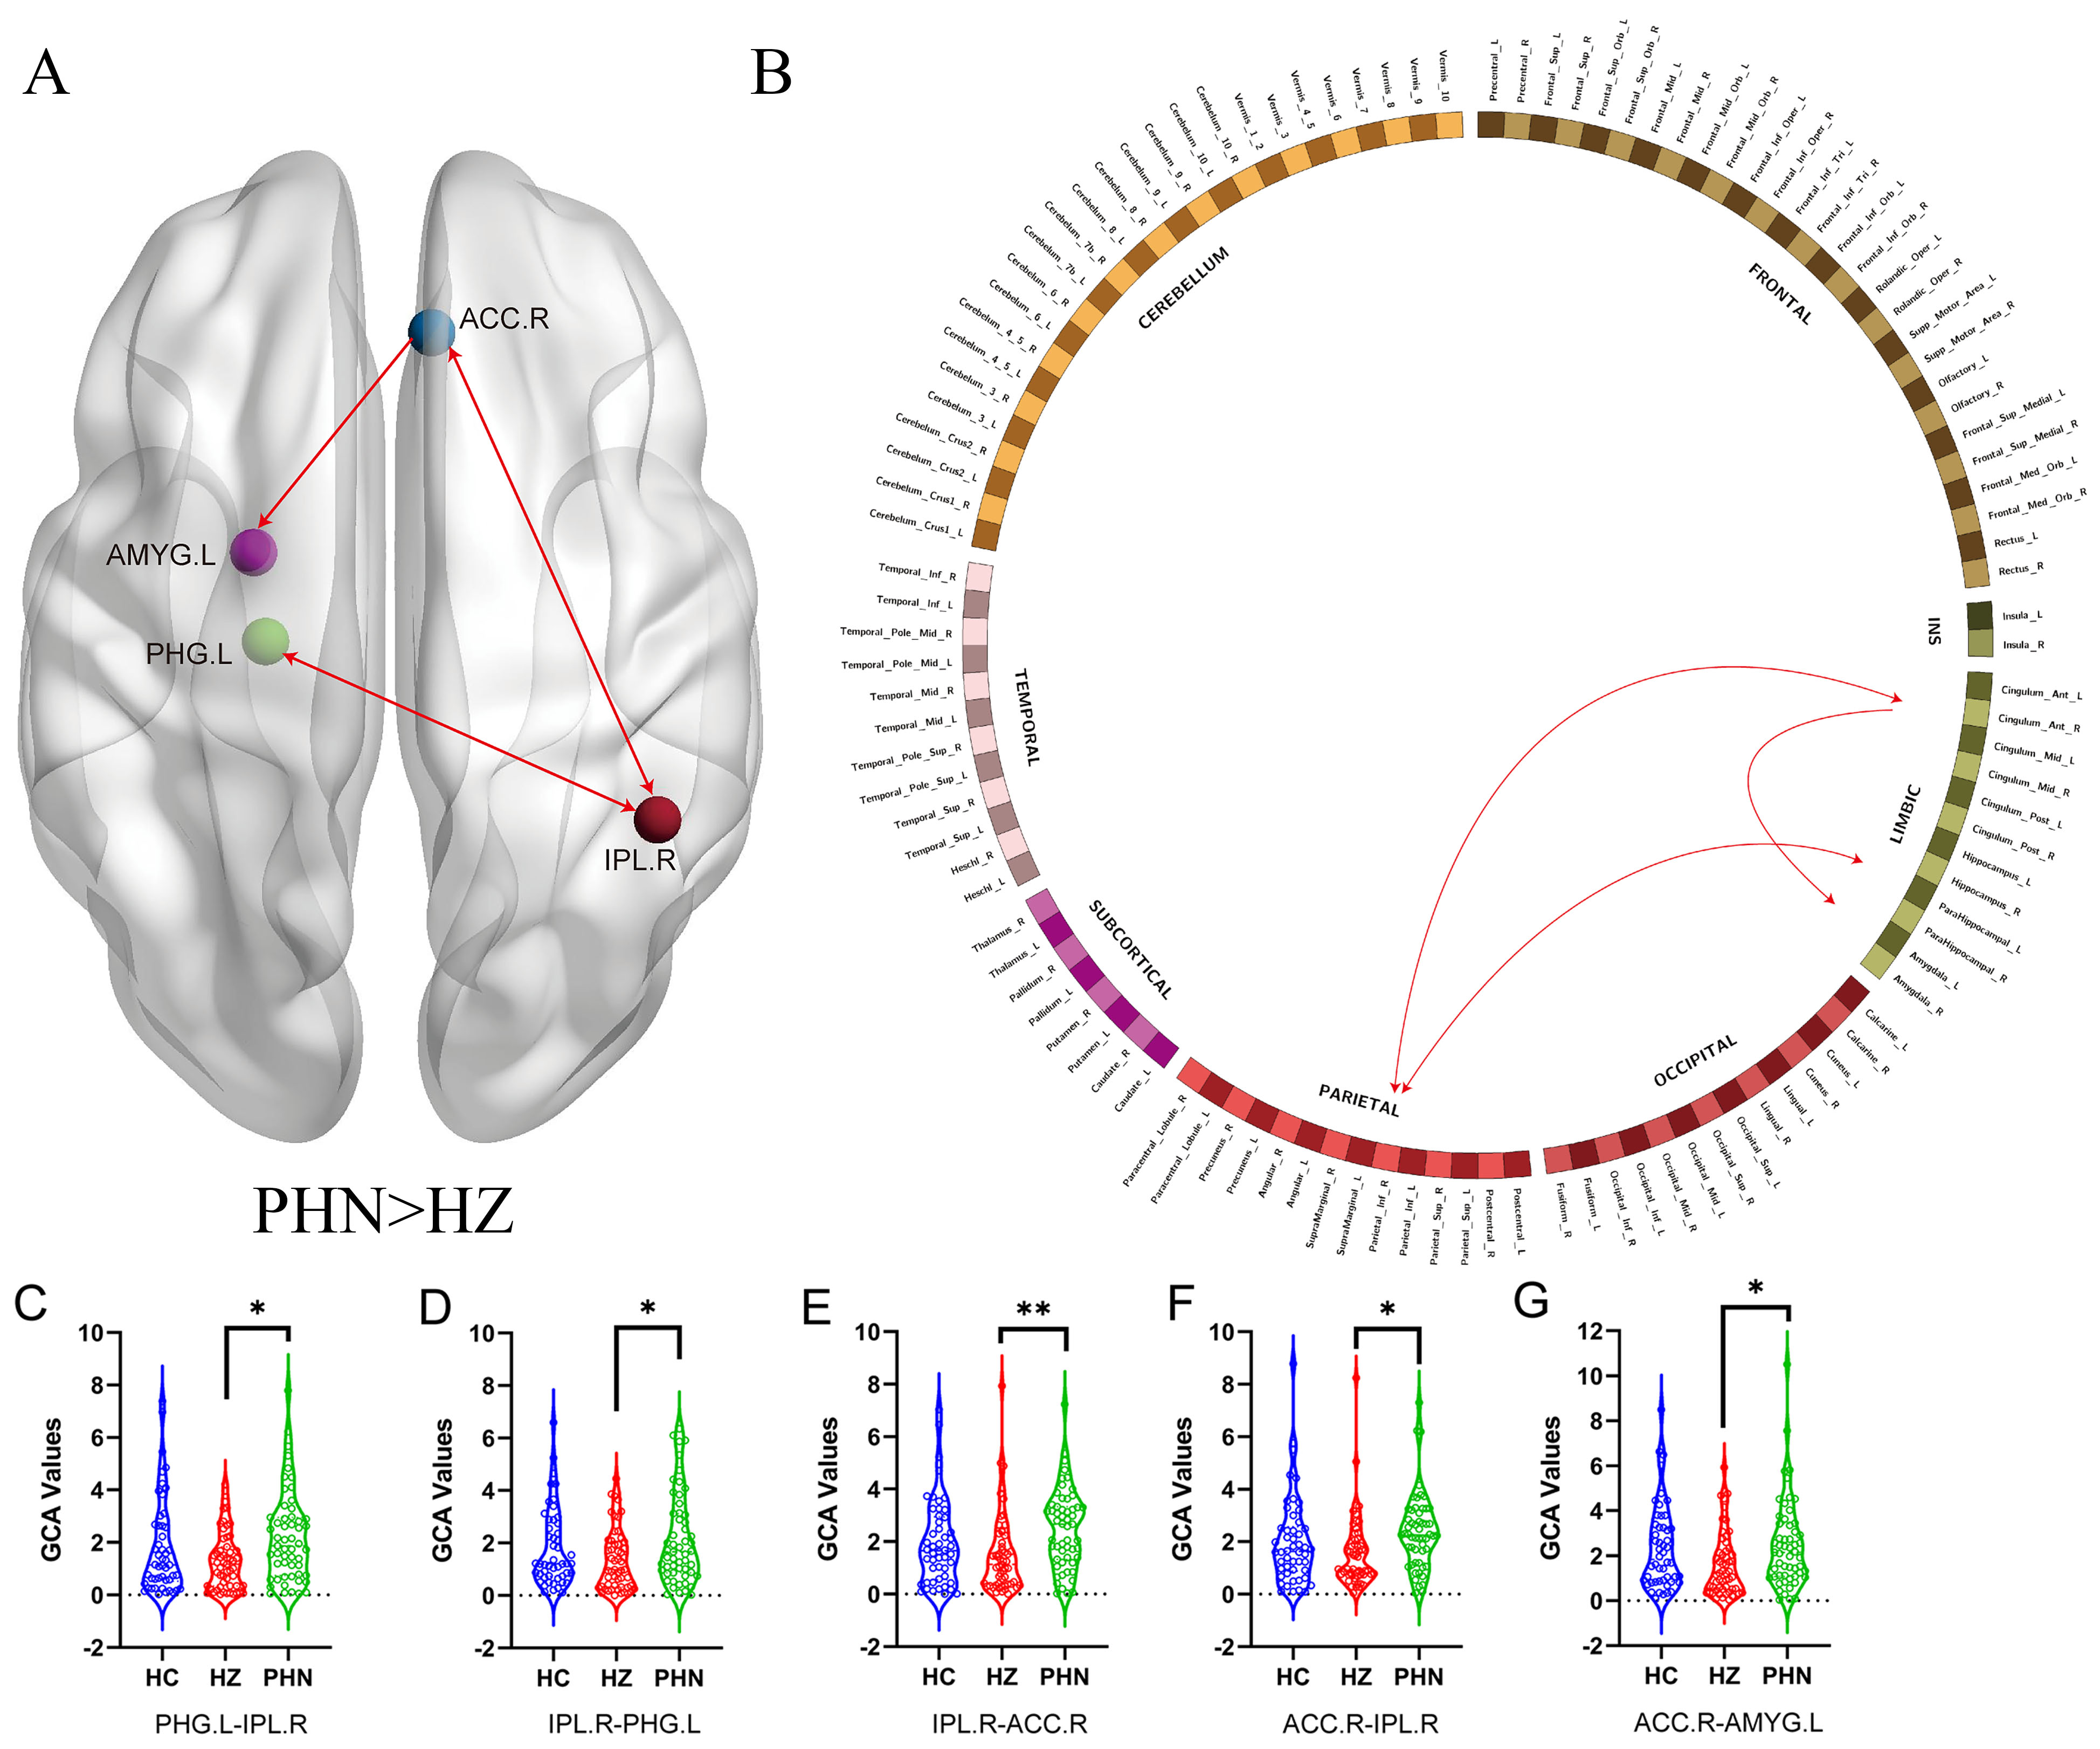 Fig. 5.
Schematic diagrams of effect connections among the PHN and HZ
groups shown by GCA. (A,B) The red line indicates that the PHN group has more
effective connections than the HZ group. (C–G) Violin diagrams showing the
distribution of GCA values among the three groups. * means p
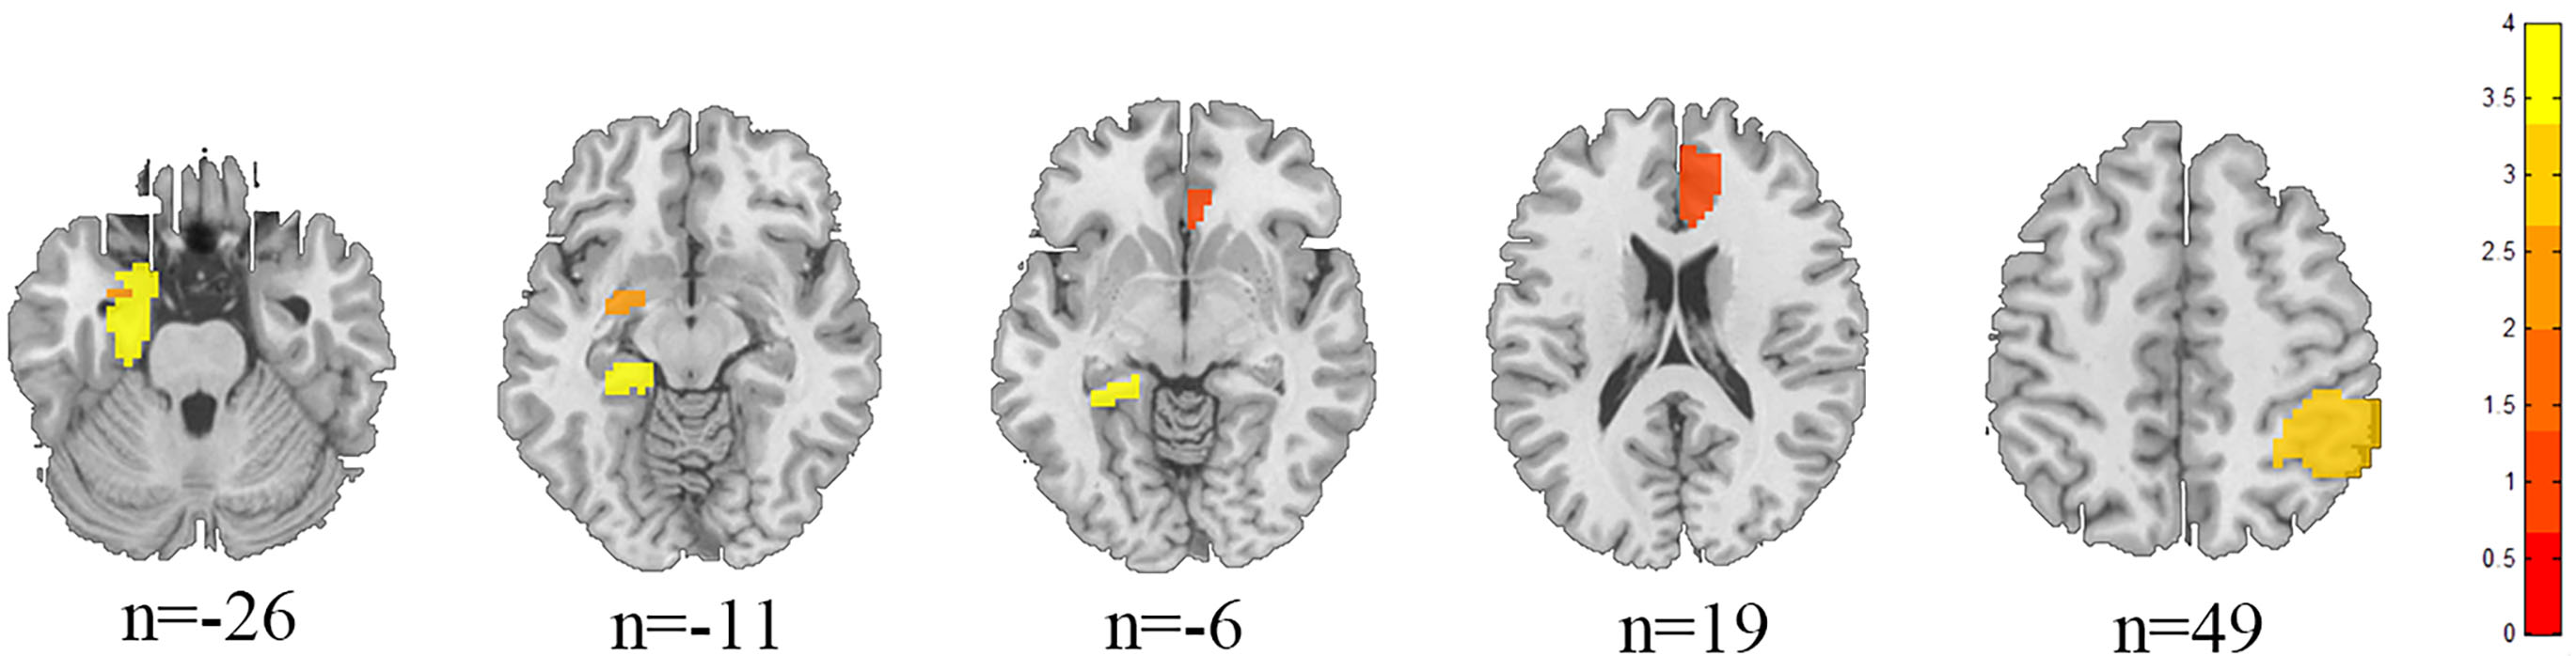 Fig. 6.
Structural anatomical map of the difference between HZ and PHN brain regions.
In HZ patients, the GCA values from the left parahippocampal gyrus to the right inferior parietal lobe (p = 0.03, r = –0.293), and from the right inferior parietal lobe to the left parahippocampal gyrus (p = 0.045, r = –0.271) were negatively correlated with the duration of disease. Additionally, the GCA values from the left thalamus to the right amygdala (p = 0.03, r = –0.293), from the right amygdala to the left thalamus (p = 0.041, r = –0.277), and from the right anterior cingulate gyrus to the right inferior parietal lobe (p = 0.044, r = –0.272) were negatively correlated with the VAS scores. Finally, the GCA values from the left precentral gyrus to the right thalamus were negatively correlated with HAMD scores (p = 0.020, r = –0.312). In PHN patients, the GCA values from the right postcentral gyrus to the right insula were positively correlated with the VAS scores (p = 0.017, r = 0.320) (Fig. 7).
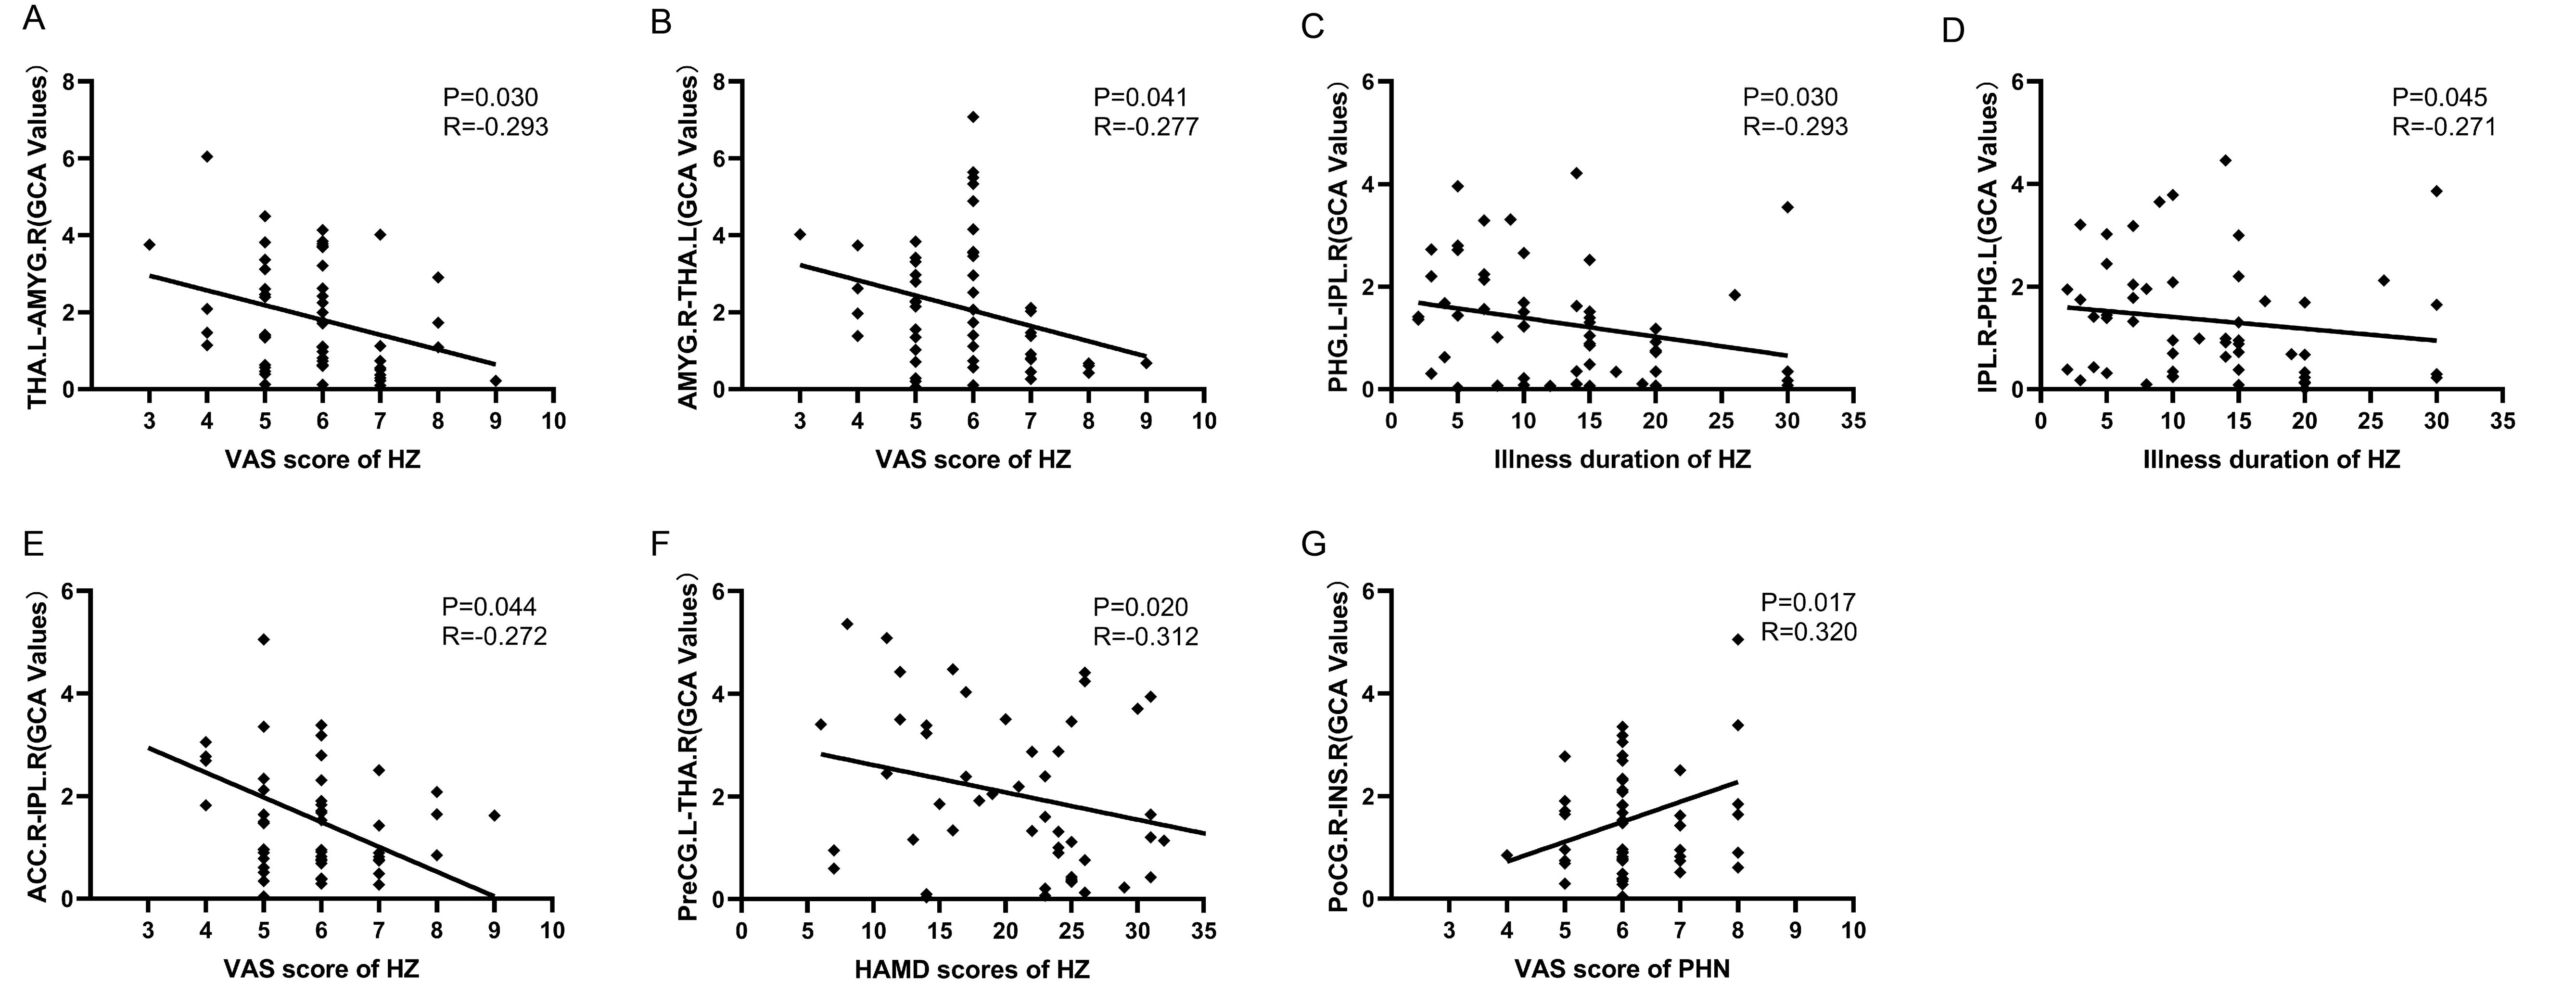 Fig. 7.
Correlation analysis between the diffusion properties and the clinical characteristics. (A–F) Show the results of the association analysis for patients with HZ. (G) Results of an association analysis showing patients with PHN.
We found that there are significant differences in effective connections between patients and HCs. Specifically, (1) compared with HCs, the effective connections between the thalamus and the amygdala and the thalamus and precentral gyrus, from the thalamus to the postcentral gyrus, and from the parahippocampal gyrus to the amygdala, anterior cingulate gyrus in HZ patients were significantly reduced; (2) compared with HCs, the effective connections between the insula and the postcentral gyrus, from the insular to the inferior parietal lobe, and from the postcentral gyrus to the amygdala in HZ patients were significantly reduced; and (3) compared with HZ, the effective connections between the inferior parietal lobe and the parahippocampal gyrus and the inferior parietal lobe and the anterior cingulate gyrus, and from the anterior cingulate gyrus to the amygdala were significantly increased.
The thalamus plays a central role in the processing of pain signals, integrating pain information and regulating pain stimuli, and it also influences the excitation state of the cerebral cortex [7]. The thalamus plays a crucial role in the upward transmission of pain signals, acting as a key neural hub responsible for transmitting hurtful information from the body’s endings to areas of the brain involved in processing pain [33]. The primary somatosensory cortex (S1) is a key brain region for processing pain, and the posterior central gyrus is one of the core nodes of S1; it receives fiber information from motor neurons in the spinal cord and medulla oblongata [34]. Our study found that patients with HZ had reduced effective connections from the thalamus to the posterior central gyrus, suggesting an abnormality in the ascending pain pathway that causes abnormal pain manifestations. The anterior central gyrus, as a part of the primary motor cortex (M1), is mainly involved in motor execution [35]. The thalamocortical circuit plays a key role in the pathophysiology of chronic pain, and previous studies have shown that individuals with chronic pain experience thalamocortical dysrhythmia [36] and motor control dysfunction [37]. M1 projects to the medial thalamus, which is an important site for the input of ascending sensations related to pain-aversion components to the limbic cortex [38]. Studies have found that the M1-medial thalamic pathway specifically inhibits negative emotions in neuropathic pain [39]. In this study, we found that the effective connection of the central pregyrus thalamus was reduced, and was negatively correlated with HAMD. We have reason to believe that this decreased inhibitory ability may aggravate depressive mood.
The amygdala plays a central role in the formation of emotions, the perception of emotion-related pain, and the regulation of pain. Along with two other major parts of the limbic system, the parahippocampal gyrus and the cingulate gyrus, it is involved in processing emotional information and influencing behavior [40]. The amygdala receives and integrates multimodal information from the cortex, putamen, and other regions, and outputs it downstream to participate in the control of emotional responses [41]. The medial thalamus is associated with the emotional and affective components of pain and plays a crucial role in the limbic circuit, which primarily connects regions in the limbic cortex [42]. Our data showed a reduction in the effective connection between the amygdala and thalamus in patients with HZ, representing a weakened ability to control descending inhibition and creating a vicious cycle that exacerbates the experience of pain and unpleasant emotional responses [43, 44]; this interpretation is also supported by the finding that GCA values between brain regions are negatively correlated with pain severity. The anterior cingulate gyrus plays a central role in the regulation of pain perception and is a key area that receives various inputs related to processing painful stimuli [45, 46]. The parahippocampal gyrus plays an important role in integrating an individual’s emotional experiences and the memories associated with those emotions [47]. One study found that the parahippocampal gyrus is particularly active when people try to suppress negative emotions [48], whcih helps us process and reduce negative memories associated with the feeling of pain. In short, the parahippocampal gyrus may help us mentally “turn off” those memory switches that cause discomfort. In this study, the reduction in effective connections from the parahippocampal gyrus to the amygdala and the anterior cingulate gyrus in HZ patients indicated weakening of inhibitory ability, which may lead to an increase in negative emotions.
The insula plays a prominent role in integrating multidimensional information about pain [49]. The inferior parietal lobe, as an important part of the default mode network, is involved in cognitive pain perception and emotional processing [50]. Long-term exposure to painful stimulation (i.e., pain endurance) may cause insular dysfunction, with functional connections between the insula and cortical areas being widely reduced, suggesting that inhibitory functions may be a possible pathogenic mechanism that is active during prolonged low back pain [51]. Pain endurance also disrupts functional connections between the cortical and insular regions of the default mode network [52, 53]. For example, a previous study showed that the functional connections between the insula and the subparietal lobules in patients with low back pain are reduced [54], indicating that pain disrupted various cognitive processes. The limited resource theory assumes that cognition and pain compete for limited information processing resources [55], and information input needs to be prioritised. If nociceptive input is significantly increased, cognitive processing will be inhibited; conversely, higher cognitive load may enhance distraction from pain. This study also found that the effective connection from insula to subparietal lobule was reduced in PHN patients. We have reason to believe that the reduced information inflow from insula to subparietal lobule may indicate that pain interferes with various cognitive processes mediated by cognitive control mechanisms to reduce pain perception [56]. However, this study has not assessed the patients’ cognitive scale. This cannot be objectively assessed clinically at this time.
There is an interprojection between the posterior insula and the somatosensory cortex, and the insular cortex interacts with N-methyl-D-aspartate receptors (NMDARs) and is involved in descending pain regulation system circuits that play an anti-injury role [57]. It has been shown that electrical stimulation of the insula can reduce pain in rats with chronic neuralgia by recruiting NMDARs [58]. Our study showed that patients with PHN have reduced effective connections between the insula and the posterior central gyrus, which may lead to disruption of the descending pain regulatory system, thus altering the way pain is perceived and promoting pain generation and persistence. Meanwhile, the GCA values from the postcentral gyrus to the insula were positively correlated with the degree of pain, which may indicate a compensatory or regulatory mechanism of its own. Patients with PHN had reduced effective connections from the precentral gyrus to the amygdala, which is consistent with the findings of previous studies [59] and provides further directional information, suggesting that the production of negative emotions in patients may be related to impaired pain perception information transmission.
During pain processing, activity in the amygdala is closely related to activity in the anterior cingulate gyrus [60, 61], and their interaction may be important for the emotional processing of pain stimuli. Our study showed that patients with PHN had increased effective connections from the anterior cingulate gyrus to the amygdala and inferior parietal lobe; relatedly, previous studies have shown that overactivity in the anterior cingulate gyrus is associated with pain-induced depressive behavior [62]. Activation of the anterior cingular–basolateral amygdala (BLA) circuit induces both reward depreciation and depression [63]. Allergic inflammation enhances neuronal activity and functional connections in the anterior cingulate gyrus–BLA circuit and correlates with anxiety levels [64]. Our study also confirmed this idea, suggesting that the anterior cingulate gyrus may enhance activation of the amygdala during pain processing, thereby causing symptoms such as anxiety and depression. Moreover, the effective bidirectional connection between the inferior parietal lobe and the anterior cingulate gyrus was increased, indicating that the processing of negative emotions and pain information reinforce each other, which may be related to the comorbidities between pain and negative emotions.
The parahippocampal gyrus is an important part of the brain that plays a crucial role in how we form and recall emotional memories. When we experience pain, the parahippocampal gyrus is particularly active in the processing of memories associated with negative emotions, which may lead us to remember unpleasant experiences more easily [65]. We found enhanced effective connections between the inferior parietal lobe and the parahippocampal gyrus in PHN patients, suggesting that unpleasant sensations may promote the formation of negative memories that further exacerbate pain. However, the GCA values between the inferior parietal lobe and the parahippocampal gyrus and the anterior cingulate gyrus were negatively correlated with the duration of illness and the degree of pain. This correlation may be related to central restructuring; that is, with the progression of the course of the disease and the increase in the intensity of pain, certain brain regions will self-regulate and appropriately reduce information transmission. The mechanism underlying this type of change is still unclear and needs further study. It has been shown that PHN model rats exhibit different FC patterns than control rats on day 7 and day 14, that is, there is a shift from the brain area processing sensory information to the area processing emotion and motivation [66], which may be the key to the transition from acute pain to chronic pain. Our study findings also confirmed this idea.
First, the selection of ROIs was mainly based on the literature, with these regions being frequently reported to be associated with pain; however, there are some pain-related brain regions that were not included as ROIs, which may limit the search for effective connection changes. Second, there are hemodynamic confounding factors in GCA, which may lead to displacement distortion, resulting in wrong causal relationship. The physiological model combined with effective connection can more truly reflect the neural activity of human brain and improve the interpretability of effective connection network, which is one of the research directions for future clinical application development. Third, this study was cross-sectional. In future, longitudinal studies could track changes in information transmission between pain-related brain regions. Fourth, the potential influence of therapeutic drugs on outcomes was difficult to rule out.
In this study, compared with HCs, both PHN and HZ patients showed extensive reductions in effective connections within the pain matrix, indicating extensive impairments in information transmission between pain-related brain regions, leading to various clinical manifestations, such as pain and depression. Compared with the HZ patients, the effective connections of the PHN patients were increased, which was also reflected in the mutual reinforcement of pain perception and negative emotions. The changes in the connections between these brain regions may be key to the progression of HZ to PHN, explaining the internal mechanism of long-term pain and providing new perspectives to better understand the physiological mechanisms of PHN.
The datasets used and/or analysed during the current study are available from the corresponding author on reasonable request.
HL, LG and JJ designed the research study. HL, LG, JX, ZL and YX performed the research. WZ, HK and SH provided help and advice on the fMRI Scan. HL analyzed the data. All authors contributed to editorial changes in the manuscript. All authors read and approved the final manuscript. All authors have participated sufficiently in the work and agreed to be accountable for all aspects of the work.
All procedures in this study were carried out in accordance with the Declaration of Helsinki and approved by the Ethics Committee of the First Affiliated Hospital of Nanchang University (No. 20200145). All participants understood the study protocol and written consent was obtained prior to data collection.
Thanks to everyone involved in this study except the authors.
This study was supported by the National Key Research and Development Program of China (2022YFC3602202), the National Natural Science Foundation of China (Grant No.81960313), the Clinical Research Center For Medical Imaging In Jiangxi Province (No.20223BCG74001) and the Key research and development plans of Jiangxi Provincial Department of Science and Technology (Grant No. S2020ZPYFB2343).
The authors declare no conflict of interest.
References
Publisher’s Note: IMR Press stays neutral with regard to jurisdictional claims in published maps and institutional affiliations.