


 , Joong-Sun Kim 3,*
1 Herbal Medicine Resources Research Center, Korea Institute of Oriental Medicine, 58245 Naju, Republic of Korea
2 Division of Radiation Biomedical Research, Korea Institute of Radiological & Medical Sciences, 01812 Seoul, Republic of Korea
3 Departments of Veterinary Anatomy and Animal Behavior, College of Veterinary Medicine and BK21 FOUR Program, Chonnam National University, 61186 Gwangju, Republic of Korea
4 KM Data Division, Korea Institute of Oriental Medicine, 34054 Daejeon, Republic of Korea
†These authors contributed equally.
Abstract
Background: DNA methylation forms 5-methylcytosine and its regulation in the hippocampus is critical for learning and memory. Indeed, dysregulation of DNA methylation is associated with neurological diseases. Alzheimer’s disease (AD) is the predominant of dementia and a neurodegenerative disorder. Methods: We examined the learning and memory function in 3- and 9-month-old wild-type and 5xfamiliar Alzheimer’s disease (5xFAD) transgenic mice by performing the object recognition memory and Y-maze tests, and identified the hippocampal amyloid beta burden. To investigate the epigenetically regulated genes involved in the development or neuropathology of AD, we performed genome-wide DNA methylation sequencing and RNA sequencing analyses in the hippocampus of 9-month-old wild-type and 5xFAD tg mice. To validate the genes inversely regulated by epigenetics, we confirmed their methylation status and mRNA levels. Results: At 9 months of age, 5xFAD tg mice showed significant cognitive impairment and amyloid-beta plaques in the hippocampus. DNA methylation sequencing identified a total of 13,777 differentially methylated regions, including 4484 of hyper- and 9293 of hypomethylated regions, that are associated with several gene ontology (GO) terms including ‘nervous system development’ and ‘axon guidance’. In RNA sequencing analysis, we confirmed a total of 101 differentially expressed genes, including 52 up- and 49 downregulated genes, associated with GO functions such as ‘positive regulation of synaptic transmission, glutamatergic’ and ‘actin filament organization’. Through further integrated analysis of DNA methylation and RNA sequencing, three epigenetically regulated genes were selected: thymus cell antigen 1, theta (Thy1), myosin VI (Myo6), and filamin A-interacting protein 1-like (Filip1l). The methylation level of Thy1 decreased and its mRNA levels increased, whereas that of Myo6 and Filip1l increased and their mRNA levels decreased. The common functions of these three genes may be associated with the neural cytoskeleton and synaptic plasticity. Conclusions: We suggest that the candidate genes epigenetically play a role in AD-associated neuropathology (i.e., amyloid-beta plaques) and memory deficit by influencing neural structure and synaptic plasticity. Furthermore, counteracting dysregulated epigenetic changes may delay or ameliorate AD onset or symptoms.
Keywords
- 5xFAD
- DNA methylation
- gene expression
- Alzheimer
- epigenetics
DNA methylation, a process in which a methyl group is added to the C5 position of cytosine, thereby forming 5-methylcytosine [1], controls gene expression by attracting proteins that suppress gene transcription or preventing the attachment of transcription factors [1]. During development, the DNA methylation pattern in the genome undergoes changes via dynamic processes, including de novo DNA methylation and demethylation. After development, differentiated cells acquire persistent and distinct DNA methylation patterns that regulate the transcription of specific genes in each tissue [2]. However, the patterns of DNA methylation can change following development, a process possibly influenced by cellular activity or the microenvironment [3]. In the central nervous system, particularly in the hippocampus, precise control of DNA methylation is crucial for normal learning and memory function. DNA methylation changes due to congenital mutations or acquired environmental factors can lead to various psychiatric and neurological disorders, often causing mental impairment [4].
Alzheimer’s disease (AD) is the most prevalent neurodegenerative disorder with
symptoms such as deterioration in memory, cognitive, and executive abilities, as
well as alterations in personality [5]. The primary pathological features of AD
are the accumulation of amyloid beta (A
In this study, we investigated the integrated analysis of global DNA methylation and gene expression in the hippocampi of 5xfamiliar Alzheimer’s disease (5xFAD) transgenic mice and explored the role of epigenetically regulated genes in the development and neuropathology of AD.
The animals in this study were cared for and maintained according to protocols authorized by the Institutional Animal Care and Use Committee of Chonnam National University (CNU IACUC-YB-2023-49). Research involving animals was conducted in accordance with the guidelines outlined in the Guide for the Care and Use of Laboratory Animals issued by the US National Institutes of Health.
We utilized 3- and 9-month-old male 5xFAD tg mice models with AD-like
manifestations through the production of transgenes containing mutations in
amyloid precursor protein (APP, the Swedish, Florida, and London AD mutations) and presenilin 1 (PS-1,
M146L and L286V mutations) under the control of the thymus cell antigen 1 (Thy1) promoter. The
model mice exhibited elevated A
The novel object recognition test (NORT) was conducted to evaluate the cognitive abilities of the mice in terms
of learning and memory. The test protocol was conducted as previously described
[16]. Briefly, mice (n = 7 per group except for the 3-month-old wild-type mice of
n = 9) were acclimated to an open acrylic chamber measuring 45
The Y-maze test was employed to quantify working and reference memories by observing spontaneous alternation behaviors. The test was conducted as previously described [17]. Briefly, the activity of mice (n = 7 per group except for 3-month-old wild-type mice of n = 9) was recorded for 8 min and subsequently evaluated using a computer tool (Viewer3; BIOSERVE GmbH). Alternation behavior was defined as the successive entry of three separate arms into overlapping triplet sets. The spontaneous alternation percentage (SAP) was determined by dividing the number of alternations by the total number of arm entries minus two, and multiplying the result by 100.
Immunohistochemical staining was performed as previously described [18]. Briefly, the brain tissues (n = 6 per group) were preserved in a solution containing 4% paraformaldehyde, embedded in paraffin, and cut into 5 µm thick sections. Sections were immunostained using the Vectastain Elite ABC kit (Vector Laboratories Inc., Burlingame, CA, USA), according to the manufacturer’s instructions. For antigen retrieval, sections were immersed in citrate buffer solution (pH 6.0) and boiled for 30 min. To perform immunoperoxidase labeling, the activity of the naturally occurring peroxidase enzyme was inhibited by treating the sample with a solution containing 0.3% hydrogen peroxide in absolute methanol for 15 min.
To perform immunohistochemistry for A
Initially, three samples per group were processed for the microarray analysis, but a decrease in the total number of detected transcripts and an abnormal distribution in the Principal Component Analysis were observed for one of mice included in the wild-type group (data not shown). Thus, we decided to exclude the data derived from this specific subject in order to improve the quality and reliability of the downstream analysis. Consequently, the hippocampal tissues of 9-month-old wild-type (n = 2) and 5xFAD tg (n = 3) mice were subjected to microarray analysis. A flowchart of methylation sequencing (methyl-seq) and RNA sequencing (RNA-seq) for identifying the target genes involved in AD development and pathology is shown in Fig. 1.
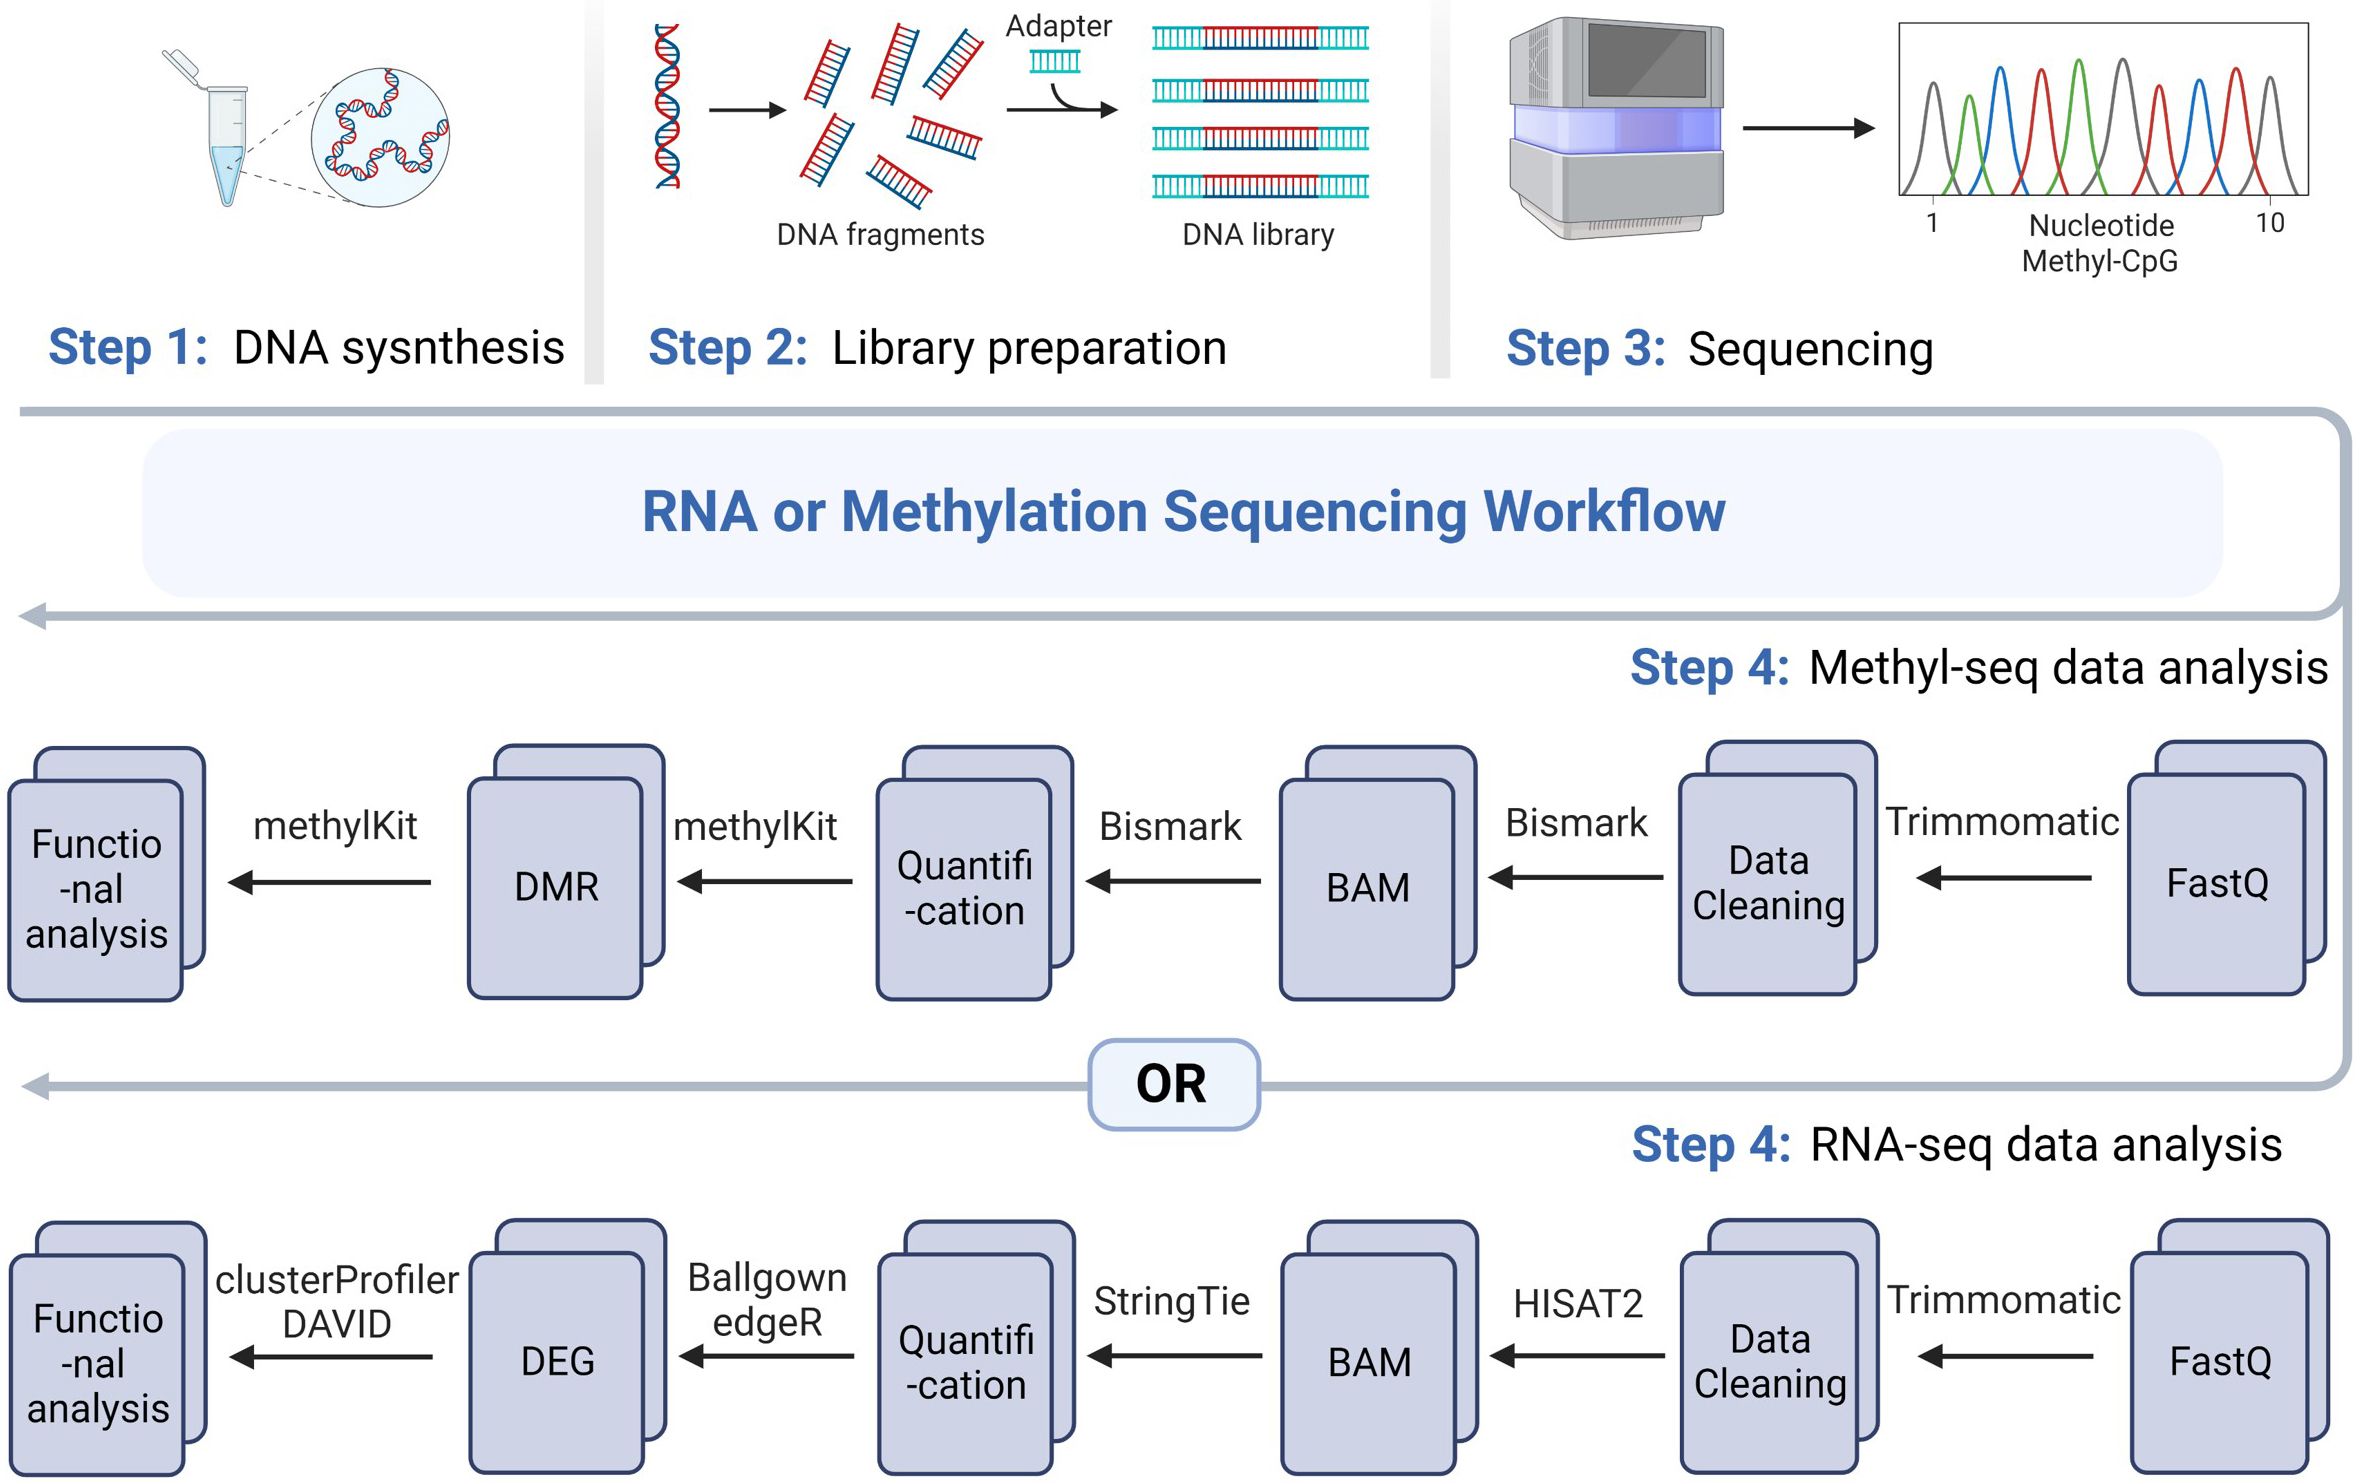 Fig. 1.
Workflow scheme of microarray analysis. Step 1: DNA synthesis; Step 2: library preparation; Step 3: methyl-seq or RNA-seq; Step 4: analysis of sequencing data. BAM, binary alignment map; DMR, differentially methylated region; DEG, differentially expressed gene; DAVID, Database for Annotation, Visualization, and Integrated Discovery; methyl-seq, methylation sequencing; RNA-seq, RNA sequencing; CpG, cytosine-phosphorothioate-guanine; HISAT2, Hierarchical Indexing for Spliced Alignment of Transcripts 2.
DNA libraries were produced according to the SureSelect XT Methyl-Seq Target Enrichment System protocol (Agilent Technologies, Inc., Santa Clara, CA, USA) and sequenced using the Illumina NovaSeq 6000 platform (Illumina, Inc., San Diego, CA, USA) to yield 100 bp paired-end reads. After sequencing, the reads were trimmed to eliminate adapters and low-quality reads using Trimmomatic (version 0.36; Usadel, Aachen, Germany) to improve paired-end mapping. The reads were mapped to bisulfite and aligned to the Mus musculus genome (mm10) using Bismark (v. 0.17.0; Babraham Bioinformatics, Cambridge, UK) [19]. Methyl-seq data were analyzed, and differentially methylated regions (DMRs) were identified using the methylKit R package (v. 1.6.0, http://code.google.com/p/methylkit) [20].
A window size of 1000 bp and a step size of 500 bp were employed. Significant
regions were defined as those containing
RNA extraction was performed using a mirVana™ miRNA isolation kit
(cat. no. AM1561; Thermo Fisher Scientific, Inc., Waltham, MA, USA). RNA-seq
libraries were generated using the TruSeq Stranded Total RNA Library Prep Kit
with Ribo-Zero Human/Mouse/Rat (Cat. no. RS-122-2203; Illumina, Inc.) and
sequenced using the NovaSeq 6000 system (Illumina, Inc.) with 100 bp paired-end
reads. The initial FastQ reads were trimmed using Trimmomatic (v.0.36) to
eliminate adapters and poor-quality reads [23]. The remaining high-quality
sequence reads were aligned to the Mus musculus genome (mm10) using HISAT2
(v.2.1.0; Johns Hopkins University, Baltimore, MD, USA) [24] and StringTie (v.1.3.4; Johns Hopkins University, Baltimore, MD, USA)
[25]. Gene expression was quantified using the BallGown R package (version 2.6.0, http://bioconductor.riken.jp/packages/3.1/bioc/html/ballgown.html)
[26]. The edgeR program (v.3.16.5, https://bioconductor.org/packages/edgeR) [27] was used to identify differentially
expressed genes (DEGs) between the wild-type and 5xFAD tg mouse groups based on
the negative binomial distribution of RNA-seq data. Candidate DEGs were selected
using a filter based on log2(FC)
To identify genes that underwent changes in RNA expression levels due to DNA
methylation (i.e., a negative relationship between RNA expression and DNA
methylation), the expression levels were measured using the Pearson correlation
coefficient. A correlation was considered significant at p-value of
To determine methylation levels from the result of methylation mapping, BS-seeker2 (v.2.1.2, https://guoweilong.github.io/BS_Seeker2/index.html) was used; the methylation levels were calculated at single-base resolution. To compare the methylation profiles on cytosine-phosphorothioate-guanine (CpG) sites among all groups, the values of only CpG sites were selected (n = 2 per group). The bisulfite primers used in this study are listed in Table 1.
| Gene | Primer sequence (5 |
Product size (bp) | |
| Thy1 | FWD | ATTATTTAATGAGGATGAGGGTT | 339 |
| RVS | ACTCTCCCTTAATAAACTAAA | ||
| Rbbp7 | FWD | TAGGTTTGTGGGTTGTTGTT | 277 |
| RVS | CACACCTTATCTATTCTTTCCTTTTA | ||
| Akap2 | FWD | TAGTTAGAGGGATAAAGAAGA | 253 |
| RVS | ACACCTAAAAAAAAACTCTACAC | ||
| Myo6 | FWD | GGTTGTTAAAAATAGAGGTTGTTTAGTG | 333 |
| RVS | CAACAACCATAAAAATCATAATCAC | ||
| Filip1l | FWD | ATTTTTTTTGGTTATTTGGTGGG | 400 |
| RVS | CTCTCTTTCTTTAAATACTT | ||
Abbreviations: Thy1, thymus cell antigen 1, theta; Rbbp7, retinoblastoma binding protein 7; Akap2, A-kinase anchoring protein 2; Myo6, myosin VI; Filip1l, filamin A interacting protein 1-like; FWD, forward; RVS, reverse.
Real-time reverse transcription polymerase chain reaction (RT-PCR) was performed using a StepOne Real-Time PCR System (Applied Biosystems,
Foster City, CA, USA) and PowerUpTM 2X SYBRTM Green Master Mix (Applied
Biosystems). The Ct values of genes were matched to those of the housekeeping
gene glyceraldehyde-3-phosphate dehydrogenase (GAPDH), and the relative
gene expression was determined using the
2
| Gene | Primer sequence (5 |
Product size (bp) | |
| Thy1 | FWD | TCTCCCTCCATGCATACCAC | 143 |
| RVS | GACTGATATCCTGCCTCCCC | ||
| Myo6 | FWD | GCGCTTGTATGTGACCTCTG | 178 |
| RVS | GGGAAGGGTTGGAGATGACA | ||
| Filip1l | FWD | AGACCACTCCCTTCTGCAAA | 194 |
| RVS | CTGCTGCTTCCGTTTGAACT | ||
| GAPDH | FWD | CAAGAAGGTGGTGAAGCAGG | 110 |
| RVS | AGGTGGAAGAGTGGGAGTTG | ||
Abbreviations: Thy1, thymus cell antigen 1, theta; Myo6, myosin VI; Filip1l, filamin A interacting protein 1-like; GAPDH, glyceraldehyde-3-phosphate dehydrogenase; FWD, forward; RVS, reverse; qRT-PCR, quantitative real-time reverse transcription polymerase chain reaction.
Data were analyzed using a two-tailed t-test and are reported as the mean value
We employed 3- and 9-month-old wild-type and 5xFAD tg mice to investigate AD-like cognitive impairment and histopathological changes in the hippocampus (Fig. 2). Fig. 2a shows illustrative images of animal movements in the NORT behavioral task used to examine the learning and memory functions. There was no significant difference in the percentage of visits to the new object between 3-month-old wild-type and 5xFAD tg mice, whereas 9-month-old 5xFAD tg mice showed a significantly decreased visits to the new object compared with 9-month-old wild-type mice in the NORT test session (Fig. 2b). Another behavioral task, the Y-maze test, was used to assess working and reference memories. Similar to the results of NORT, no significant change was observed in spontaneous alternation behavior in the Y-maze test at 3 months, except for a slight decrease in SAP in 3-month-old 5xFAD tg mice (Fig. 2c). However, SAP levels were lower at 9-months in 5xFAD tg mice than in that of wild-type mice.
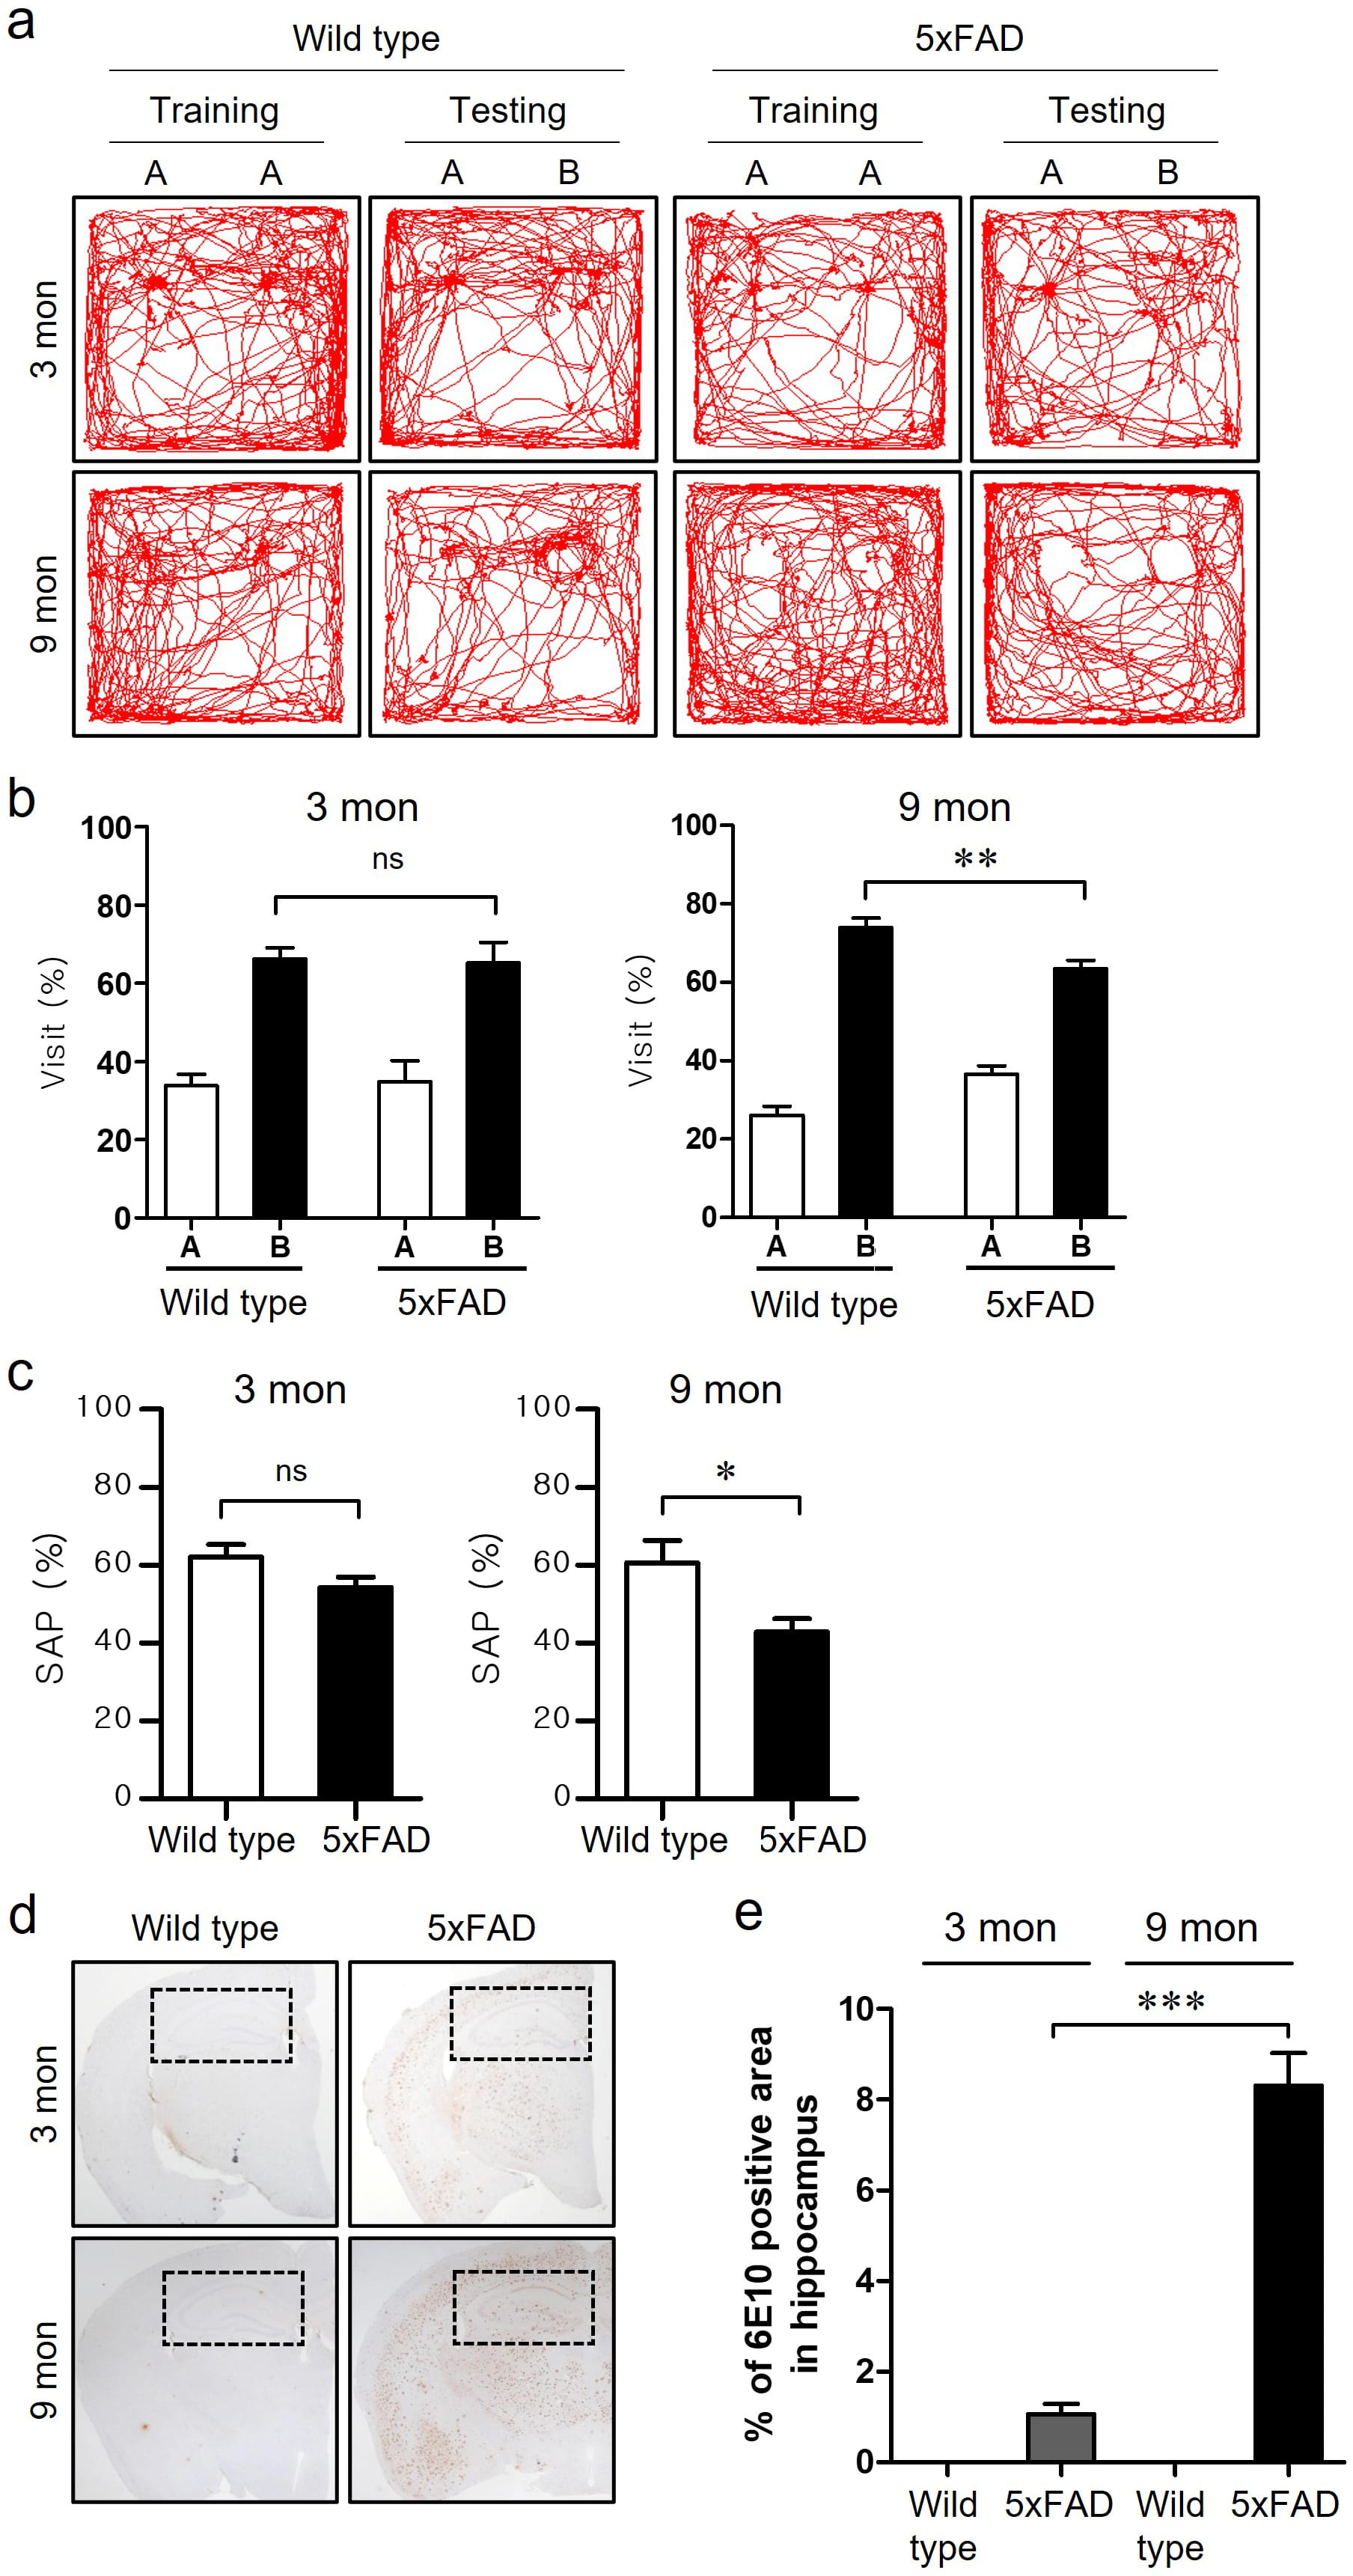 Fig. 2.
Cognitive deficits and A
To confirm A
We performed DNA methyl-seq analysis in the hippocampi of 9-month-old wild-type and 5xFAD tg mice. As shown in the heatmap, a total of 13,777 DMRs were identified, including 4484 hypermethylated and 9293 hypomethylated regions (Fig. 3a). The number of hypomethylated regions was more than twice that of the hypermethylated regions, consistent with the fact that global DNA methylation is reduced in the brains of patients with AD [29]. Nevertheless, the proportion of functional gene regions, including promoters and exons, was higher in the hypermethylated regions of 5xFAD tg mice (48% of hypermethylated regions and 23% of hypomethylated regions) (Fig. 3b). The distribution of DMR in genes was also analyzed, namely CpG island (CpGi), shore (short distance [0–2 kb] from CpGi), and other. A total of 18% and 16% of the hypermethylated regions and 1% and 12% of the hypomethylated regions were located in the CpGi and shore, respectively.
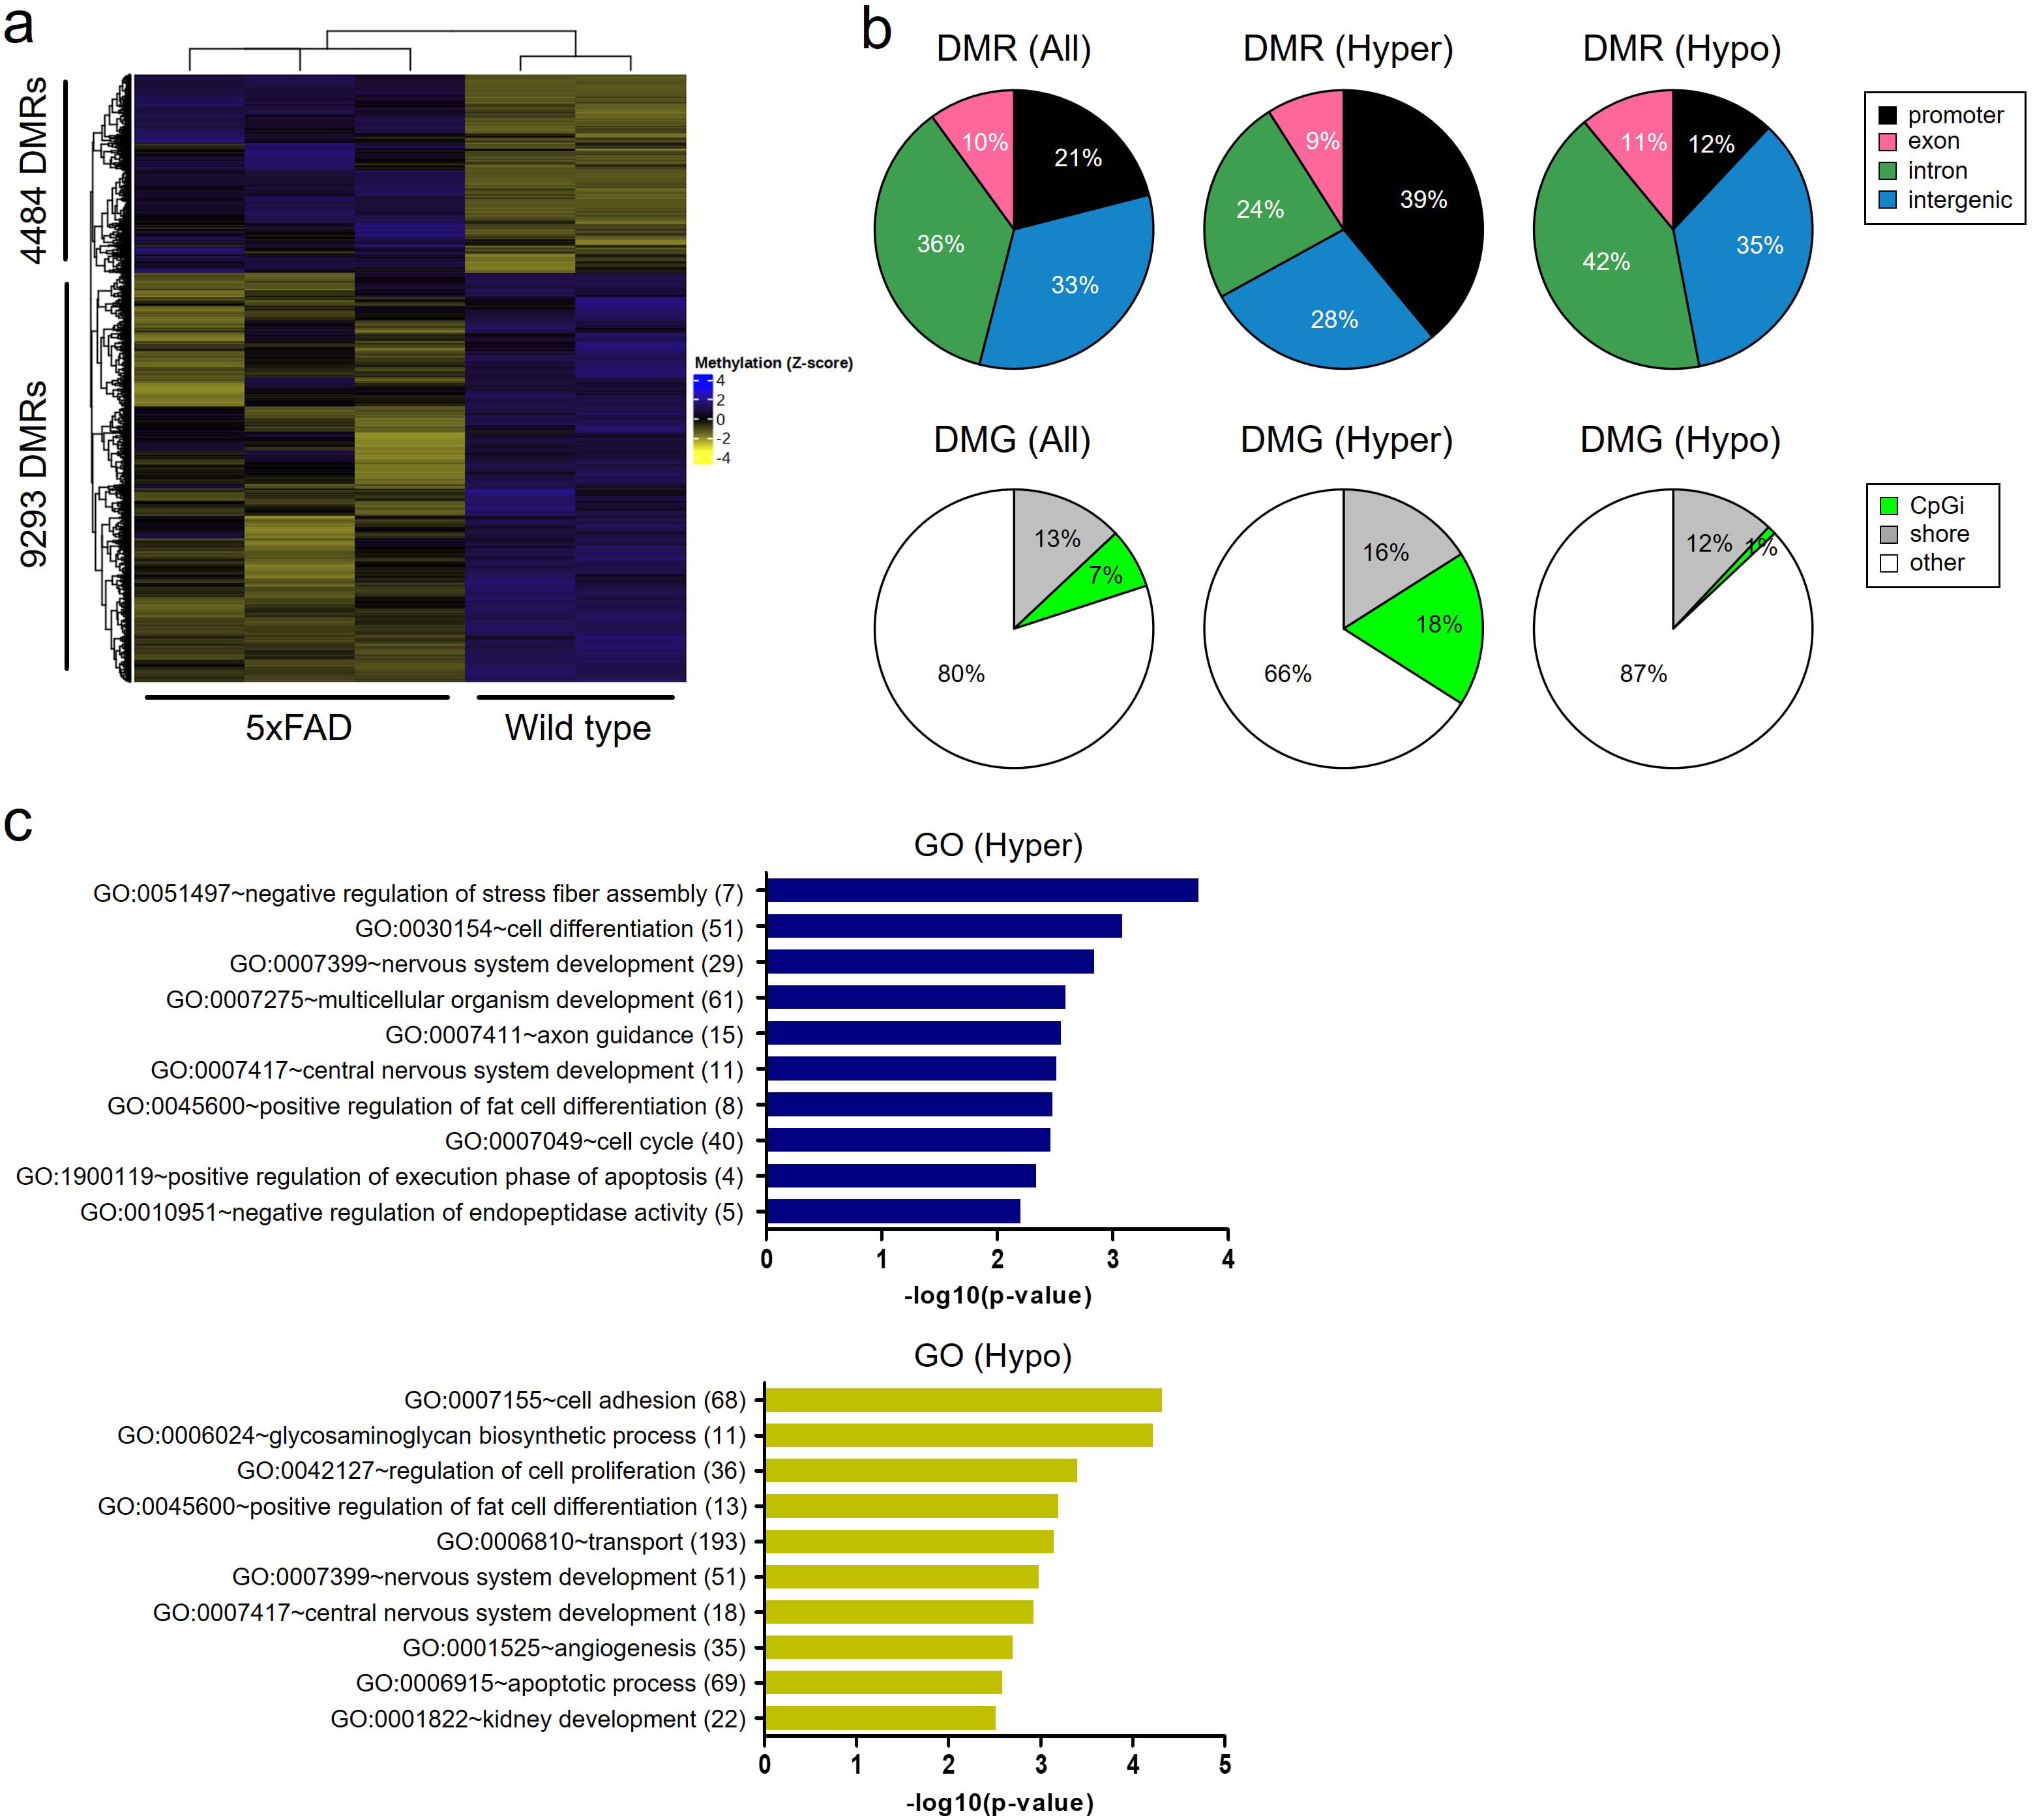 Fig. 3.
Global DNA methyl-seq analysis in the hippocampi of wild-type and 5xFAD tg mice. (a) Heatmap showing DNA hypermethylated regions of 4484 and hypomethylated regions of 9293 in the hippocampi of 5xFAD tg mouse. (b) Venn diagrams showing the distribution of hyper- or hypomethylation in genes. (c) Bar graphs showing the top 10 GO biological processes associated hyper- and hypo-methylated genes. The number aside the GO term represents the number of DMGs related with the GO. 5xFAD, 5xfamiliar Alzheimer’s disease; DMR, differentially methylated region; DMG, differentially methylated gene; hyper, hypermethylation; hypo, hypomethylation; CpGi, CpG island; GO, gene ontology.
GO enrichment analysis of the DMR-associated genes was performed (Fig. 3c). Top 10 GO biological processes (BP) related to DNA hypermethylation included ‘negative regulation of stress fiber assembly’, ‘cell differentiation’, ‘nervous system development’, ‘multicellular organism development’, ‘axon guidance’, ‘central nervous system development’, ‘positive regulation of fat cell differentiation’, ‘cell cycle’, ‘positive regulation of execution phase of apoptosis’, and ‘negative regulation of endopeptidase activity’. Top 10 BP of GO terms associated with DNA hypomethylation included ‘cell adhesion’, ‘glycosaminoglycan biosynthetic processes’, ‘regulation of cell proliferation’, ‘positive regulation of fat cell differentiation’, ‘transport’, ‘nervous system development’, ‘central nervous system development’, ‘angiogenesis’, ‘apoptotic processes’ and ‘kidney development’.
To examine changes in gene expression in the hippocampal tissue of 5xFAD tg mice, we performed RNA-seq analysis. We identified 101 DEGs between 9-month-old wild-type and 5xFAD tg mice (Fig. 4). DEGs, including 52 upregulated and 49 downregulated genes, are shown as a dot distribution map with log (FC) and log (p-value) (Fig. 4a), and a heatmap (Fig. 4b).
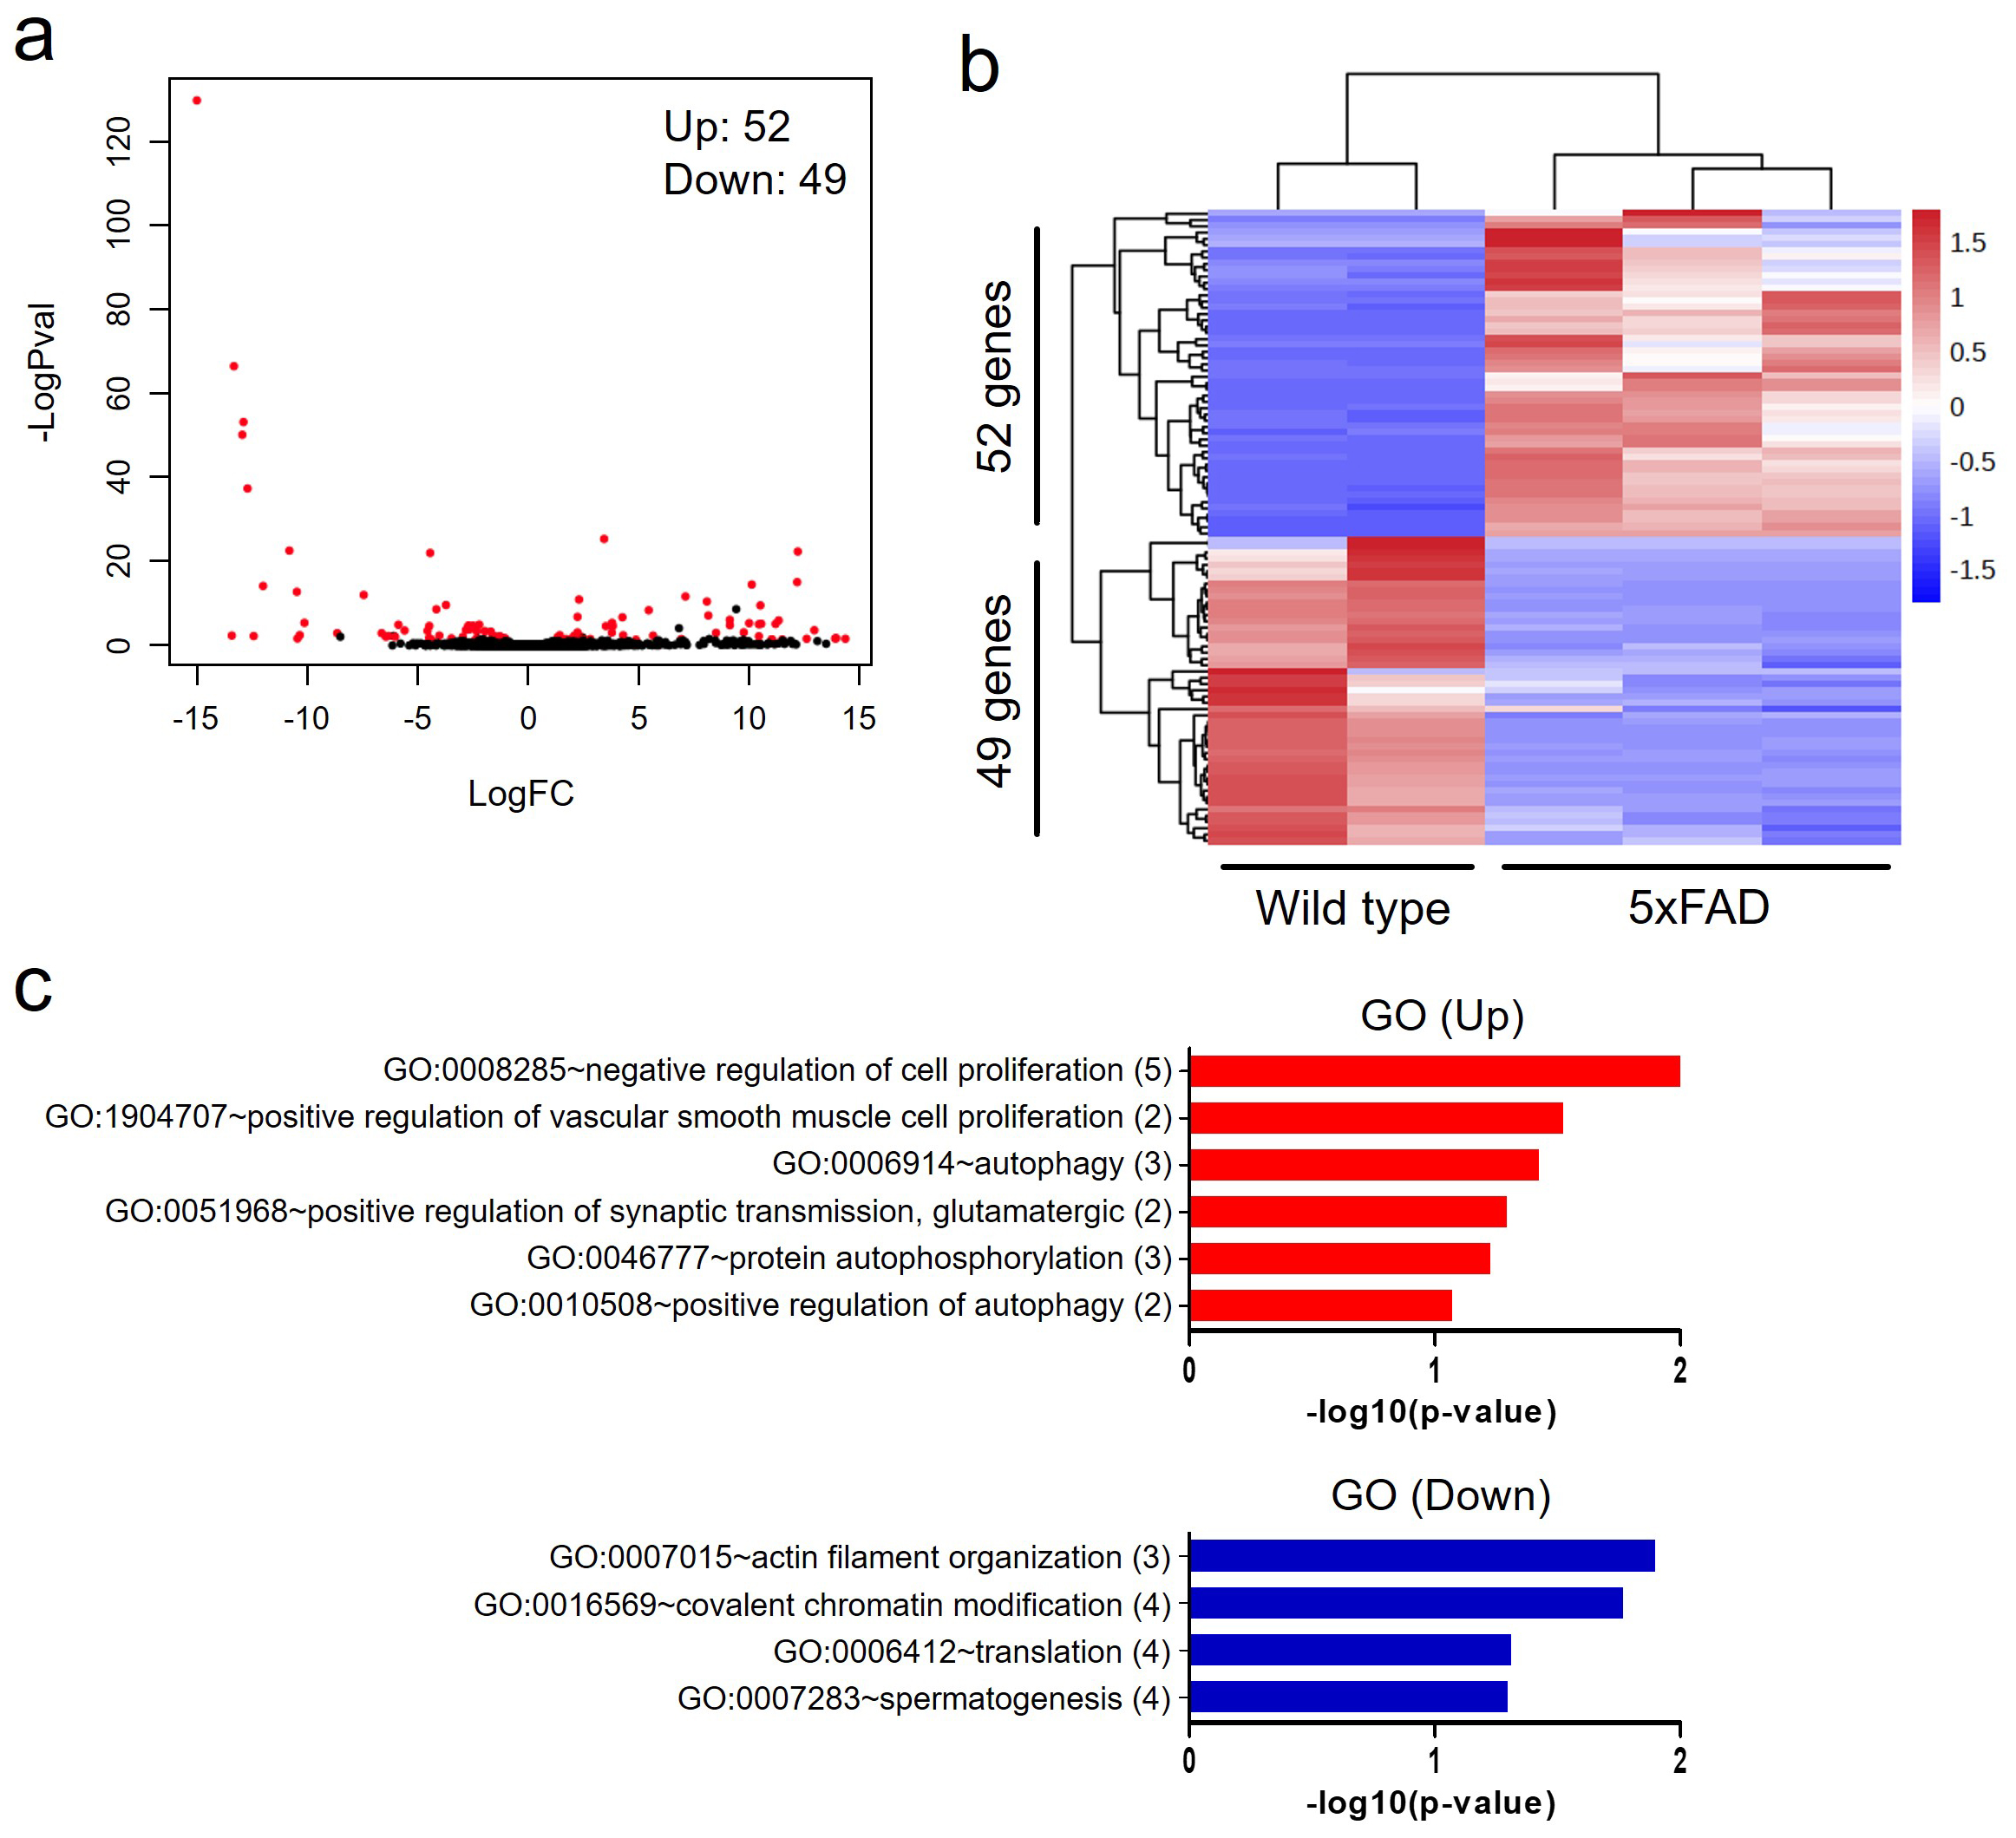 Fig. 4.
Gene expression profiles in the hippocampus of wild-type and 5xFAD tg mice. (a) Scatter plot showing the correlation between the fold change in RNA expression and p-value. (b) Heatmap showing 52 upregulated and 49 downregulated genes in the hippocampi of 5xFAD tg mouse. (c) Bar graphs showing GO biological processes associated up- and down-regulated genes. The number aside the GO term represents the number of DEGs related with the GO. 5xFAD, 5xfamiliar Alzheimer’s disease; FC, fold change; GO, gene ontology; DEGs, differentially expressed genes.
GO term analysis of DEGs was conducted (Fig. 4c). BP related to upregulated genes in 5xFAD tg mouse involved ‘negative regulation of cell proliferation’, ‘positive regulation of vascular smooth muscle cell proliferation’, ‘autophagy’, ‘positive regulation of synaptic transmission, glutamatergic’, ‘protein autophosphorylation’, and ‘positive regulation of autophagy’. BP functions associated with downregulated genes include ‘actin filament organization’, ‘covalent chromatin modification’, ‘translation’ and ‘spermatogenesis’.
Based on our criteria, we identified five candidate genes related to AD development and pathology from a combined analysis of methyl- and RNA-seq data: thymus cell antigen 1, theta (Thy1), retinoblastoma binding protein 7 (Rbbp7), A-kinase anchoring protein 2 (Akap2), myosin VI (Myo6), and filamin A-interacting protein 1-like (Filip1l). In the combined analysis of microarray data, DNAs encoding Thy1 and Rbbp7 were hypomethylated, and RNA levels were increased in the hippocampus of 5xFAD tg mice compared with those of wild-type mice. Additionally, DNAs encoding Akap2, Myo6, and Filip1l were hypermethylated, and RNA levels were decreased in 5xFAD tg mice. The Pearson correlation coefficient was only detected for Thy1, Myo6, and Filip1l (Table 3). The DMRs of Myo6 and Filip1l are located in intron 1, and those of Rbbp7 and Akap2 are positioned in intron 2 of each respective gene, while that of Thy1 is confirmed to exon 4.
| Gene | Accession No. | Methylation difference | DMR position | logFC | PCC | p-value | |
| Hypo-methylation | Thy1 | NM_009382.3 | –28.5167 | Exon 4 | 2.2867 | –0.9813 | 0.0031 |
| Rbbp7 | NM_009031.3 | –28.5537 | Intron 2 | 2.2171 | –0.7379 | 0.1546 | |
| Hyper-methylation | Akap2 | NM_001035533.2 | 11.7189 | Intron 2 | –2.7173 | –0.7850 | 0.1157 |
| Myo6 | NM_001039546.2 | 15.7071 | Intron 1 | –4.5868 | –0.9313 | 0.0214 | |
| Filip1l | NM_001040397.4 | 37.6347 | Intron 1 | –4.4075 | –0.9046 | 0.0349 |
Abbreviations: Thy1, thymus cell antigen 1, theta; Rbbp7, retinoblastoma binding protein 7; Akap2, A-kinase anchoring protein 2; Myo6, myosin VI; Filip1l, filamin A interacting protein 1-like; DMR, differentially methylated regions; FC, fold change; PCC, Pearson correlation coefficient.
To validate the microarray data, we confirmed the DNA methylation status and mRNA levels of candidate genes in the hippocampi of 9-month-old wild-type and 5xFAD tg mice (Fig. 5). In terms of DNA methylation status, the methylation of genes, including Rbbp7, Myo6, and Filip1l, was significantly increased in 5xFAD tg mice, while no significant change in the methylation level of Akap2 was observed, although the tendency was slightly increased in 5xFAD tg mice (Fig. 5a). The DNA methylation level of Thy1 significantly decreased in 5xFAD tg mice. Except for the genes showing no significant methylation change (Akap2) and those that did not coincide with the methyl-seq data (Rbbp7), we performed qRT-PCR to confirm the mRNA levels of the other three genes (Thy1, Myo6, and Filip1l) in the hippocampi of wild-type and 5xFAD tg mice. The mRNA level of Thy1 was increased, while Myo6 and Filip1l were decreased in inverse accordance with their DNA methylation status, although the differences were not significant (Fig. 5b). Lastly, we summarized the gold standard dataset in Table 4.
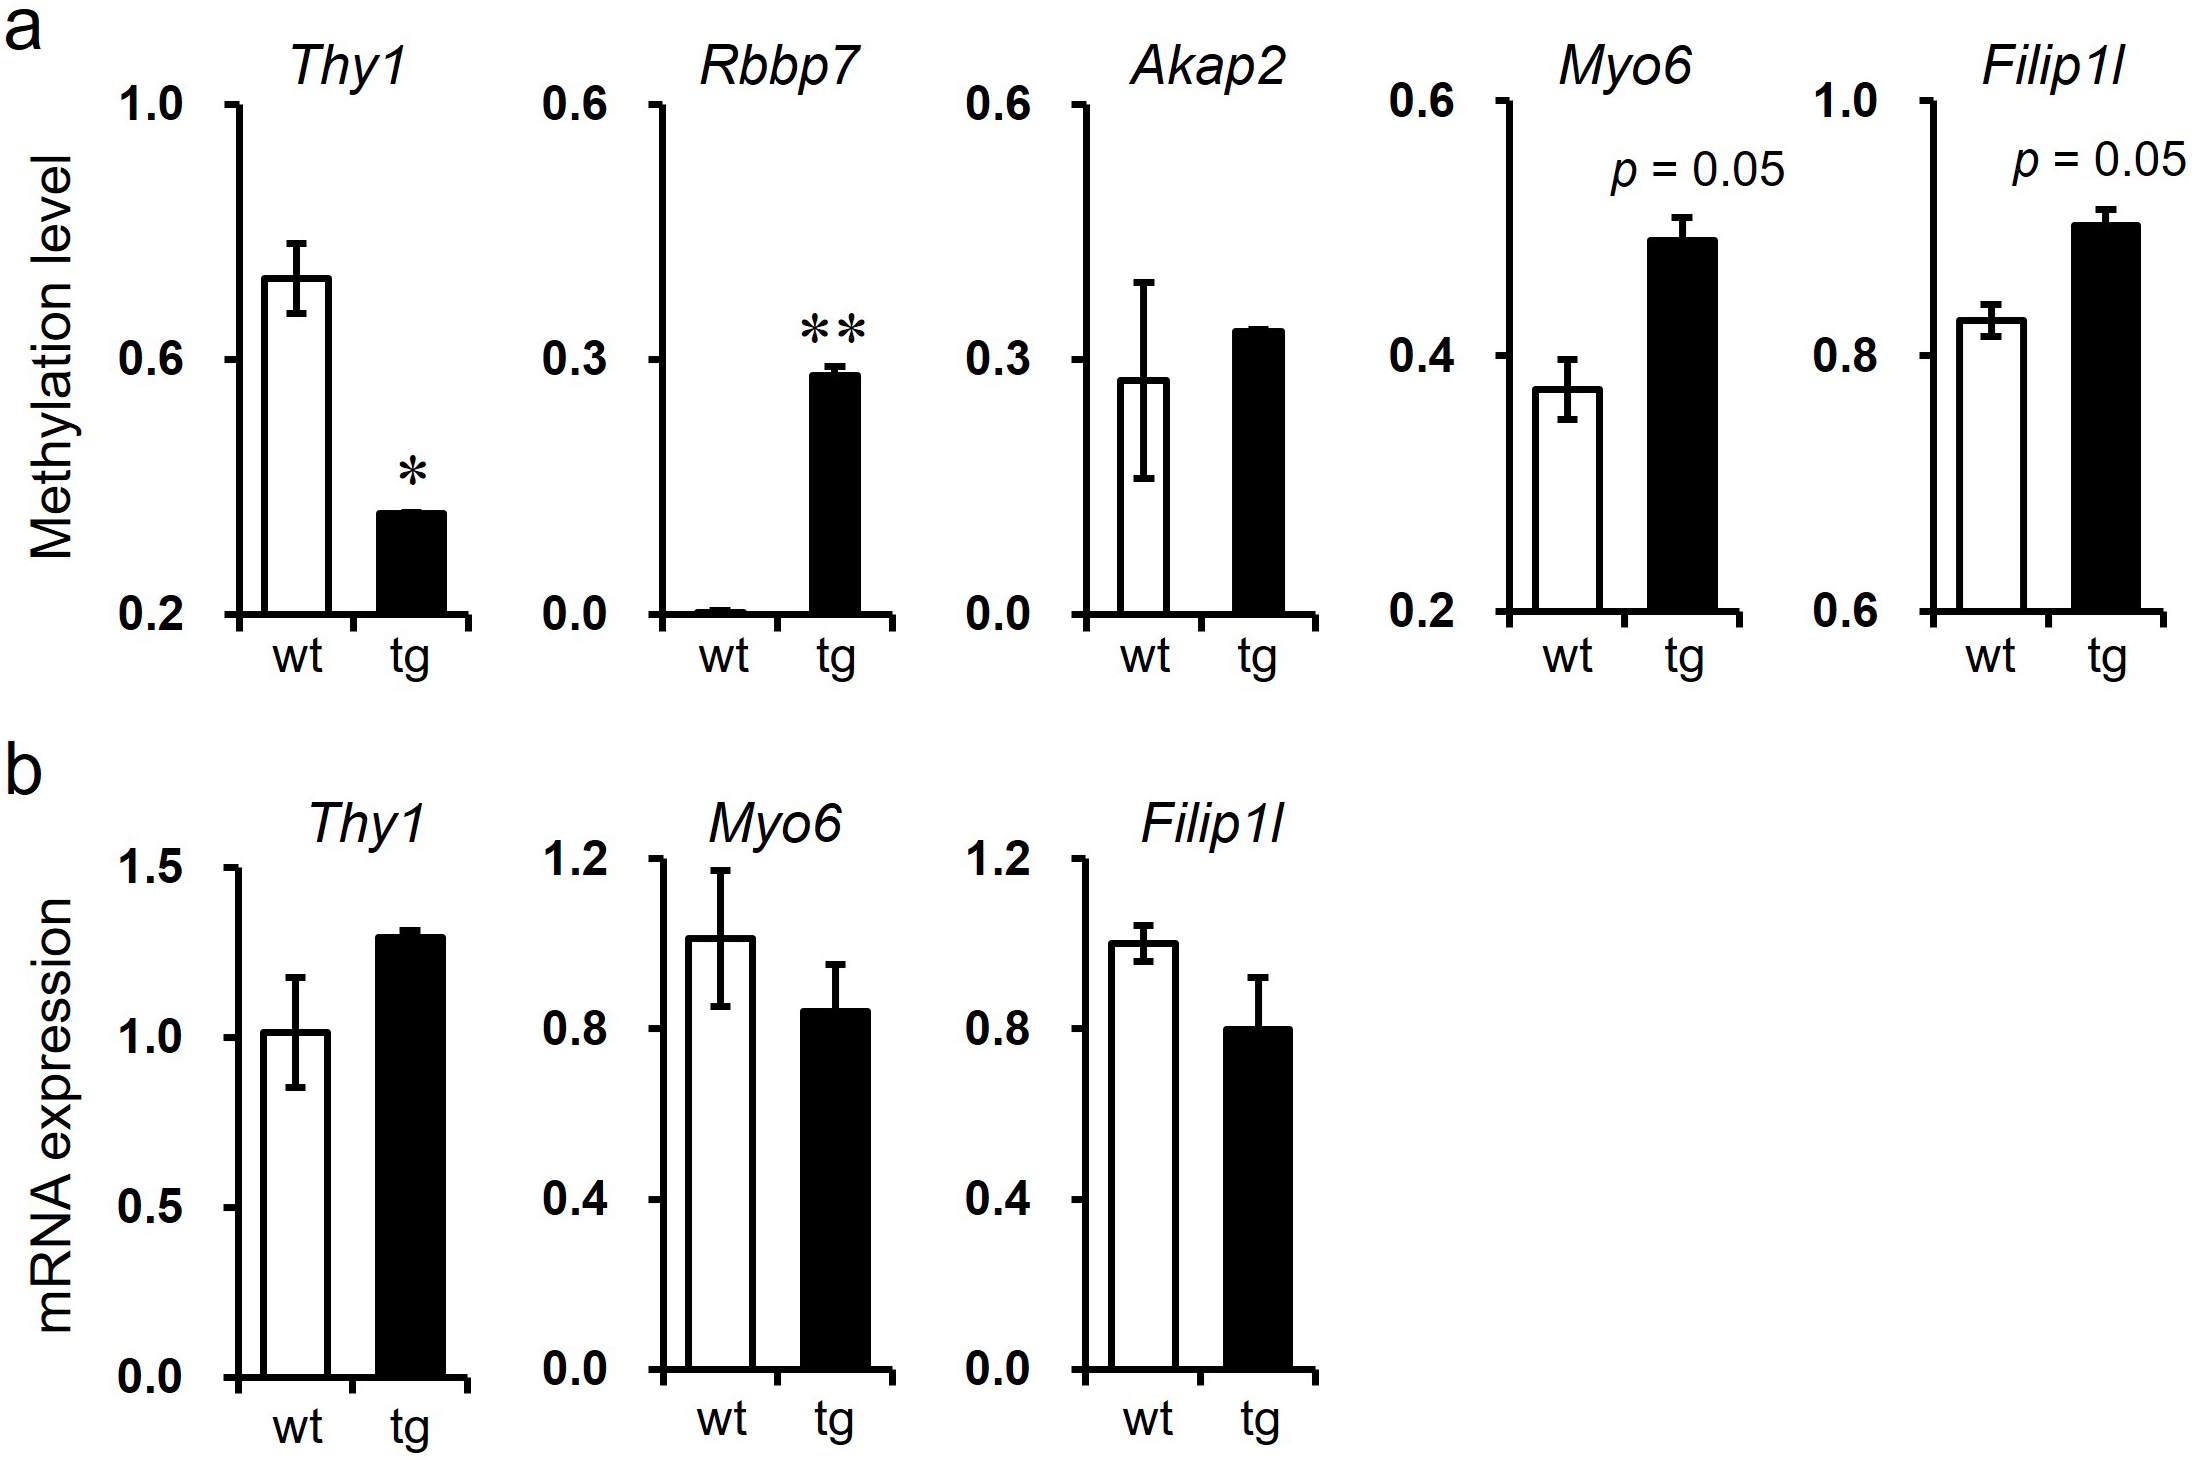 Fig. 5.
Validation of candidate genes deduced from combined analysis of
DNA methyl- and RNA-seq data in the hippocampi of wild-type and 5xFAD tg mice.
(a) Methylation status of Thy1, Rbbp7, Akap2, Myo6, and
Filip1l. (b) mRNA levels of Thy1, Myo6, and Filip1l.
*p
| Gold standard | No. | Gene |
| Hyper-methylated DNA regions | 4484 | - |
| Hypo-methylated DNA regions | 9293 | - |
| Up-regulated genes | 52 | - |
| Down-regulated genes | 49 | - |
| Inversly expressed intersection genes | 5 | Thy1, Rbbp7, Akap2, Myo6, Filip1l |
| Validated genes in tissues | 3 | Thy1, Myo6, Filip1l |
Abbreviations: Thy1, thymus cell antigen 1, theta; Rbbp7, retinoblastoma binding protein 7; Akap2, A-kinase anchoring protein 2; Myo6, myosin VI; Filip1l, filamin A interacting protein 1-like.
In this study, we performed an in-depth combined analysis of DNA methylation and
gene expression in the hippocampal tissues of 5xFAD tg mice, a mouse model of AD.
Cognitive impairment, including working and reference memory, was detected in
9-month-old, but not in 3-month-old, 5xFAD tg mice, and the age-dependent memory
deficits are similar to the behavioral phenotypes reported in other studies using
the Morris water maze and contextual fear conditioning paradigms [30, 31].
Furthermore, A
Given that acquired environmental factor or aging influences the development of
neurological illnesses, previous studies have employed epigenome-wide association
studies to identify changes in DNA methylation linked to the characteristics of
diseases [32, 33]. Over the past few decades, the significance of epigenetic
pathways in the development of neurological disorders has been increasingly
recognized [32]. AD, marked by a gradual deterioration in cognitive function and
neuronal death, is the most prevalent of the late-onset neurodegenerative
diseases [34]. Increasing evidence emphasizes the involvement of epigenetic
variation in AD development since gene mutations account for only approximately
5% of all patients with AD [35]. Aging is the primary risk factor for the
development of AD; recent studies have indicated that both aging and AD are
linked to significant alterations in the epigenetic control of gene expression,
particularly DNA methylation [36, 37]. DNA methylation analysis has been
conducted in several AD mouse models. Cong et al. [38] investigated
genome-wide CpG methylation in the cortex of 11-month-old APP/PS1 mice, showing
that 2346 CpG sites involving 485 genes could be critically associated with AD. The study suggested that epigenetic alternation of the gene for
transforming growth factor beta 1 (TGF-
The second DNA methylation-regulated gene confirmed in this study was Myo6, which was hypermethylated; its mRNA levels decreased in the hippocampus of 5xFAD tg mice. Myo6, unlike other myosins, exhibits atypical retrograde movement toward the minus point of actin filaments [47] and is abundantly expressed in the brain, particularly at synapses [48]. Osterweil et al. [48] discovered that the hippocampi of mice lacking Myo6 showed notable impairments in stimulation-induced endocytosis of the alpha-amino-3-hydroxy-5-methyl-4-isoxazole propionic acid receptor (AMPAR, a glutamate receptor). Furthermore, the phosphorylation of Myo6, which is associated with mitochondrial recruitment and presynaptic filament anchoring, is involved in energy supply and calcium removal in the presynaptic region during intense synaptic activity [49]. Deficits in this process induce local energy depletion and intracellular calcium overloading. Consequently, deficiency in Myo6 expression levels or function leads to unusual dendritic spines, synapse reduction, impairment of synaptic efficacy, long-term depression, and astrogliosis [48], all of which are characteristics of hippocampal lesions in patients with AD [50]. Therefore, we propose that epigenetic downregulation of Myo6 expression can affect synaptic plasticity, which is associated with pathological lesions and impaired learning and memory in AD.
The last methylation-affected gene investigated in this study was
Filip1l, whose DNA was hypermethylated, and mRNA level was decreased in
5xFAD tg mice. To date, Filip1l has been studied in the field of cancer and
reported to be associated with epithelial-mesenchymal transition,
chemoresistance, and extracellular matrix migration in cancer cells [51]. Filip1l
is highly similar to Filip1, with ~50% amino acid similarity
[52, 53]. The intracellular location and functions of Filip1l are similar to
those of Filip1, suggesting that Filip1l can be a Filip1 family protein that
binds to filamin A and induces the degradation of filamin A, an actin-binding
protein [53]. Therefore, Filip1l may exert its actions via the inhibition of
filamin A. Filamin A modulates the rearrangement of the actin cytoskeleton by
interacting with integrins, transmembrane receptor complexes, and secondary
messengers [54]. Mutations in filamin A generally lead to aberrant neuronal
migration and connective and vascular tissue abnormalities [55]. Followed by
senile A
The DMRs of the candidate genes are located inside the gene body. Methylation of promoter or control regions located outside of the transcribed sequences (e.g., enhancer and insulator) is increasingly being recognized as functionally significant in inverse gene expression [57]. The roles of DNA methylation in gene body have been disregarded, but some recent studies have emphasized its importance. A whole-genome study has shown that exons are more highly methylated than introns, and changes in the degree of methylation occur at the exon–intron border, possibly suggesting a role for methylation in the regulation of splicing [58]. Shukla et al. [59] has suggested that binding of the transcription repressor CCCTC-binding factor (CTCF), which can be regulated by DNA methylation, could stop the progression of RNA polymerase II and, since this would affect splicing, this might provide evidence regarding the connection between DNA methylation and splicing. Furthermore, Anastasiadi et al. [60] clearly demonstrated the important, preserved role of methylation at the level of the first intron, and its inverse correlation with gene expression irrespectively of tissue and species. These observations suggest a previously uncharacterized role for DNA methylation of gene body at the transcriptional level, resulting in changes in mRNA and protein expression via alternative splicing. However, further studies are needed to collect additional evidence for a direct correlation between DNA methylation and the expression of the candidate genes presented in this study.
Although we described three new candidate genes unknown to date through a
combined analysis of DNA methylation and RNA-seq, the sequence analyses were
performed on a small-scale, which is a limitation of the present study. Moreover,
it remains unclear whether the confirmed epigenetic alterations are causal
factors or are consequences of AD-like symptoms in 5xFAD mice. Several
epigenetically regulated genes, including ABCA7, ANK1,
APP, BACE1, BIN1, CDH23, DIP2A,
DUSP22, homeobox, MAPT, PSEN2,
RHBDF2, RPL13, SERPINF1, SERPINF2,
SLC24A4, and SORL1, have been verified so far to be linked to
AD neuropathology, including A
Our study identified three epigenetically regulated genes associated with the neural cytoskeleton and synaptic plasticity in AD neuropathology through a combined analysis of DNA methyl- and RNA-seq in the hippocampus of wild-type and 5xFAD tg mice. DNA methylation may have a significant impact on the preservation of normal hippocampal functions, such as learning and memory [66], hence alterations in DNA methylation could be linked to the disease activity, progression, and clinical prognosis of AD [32]. Therefore, although no treatment based on DNA methylation has been developed yet, counteracting epigenetic changes may facilitate the development of new therapeutic interventions to delay or ameliorate the symptoms of AD.
The datasets used and/or analyzed during the current study are available from the corresponding author on reasonable request.
Conceived and designed the experiments: CK and JSK. Performed the experiments: SL and HJL. Analyzed the data: JMC, BJ, JK and CM. Wrote the paper: SL, HJL and JSK. All authors contributed to editorial changes in the manuscript. All authors read and approved the final manuscript. All authors have participated sufficiently in the work and agreed to be accountable for all aspects of the work.
The protocols in this study were authorized by the Institutional Animal Care and Use Committee of the Chonnam National University (CNU IACUC-YB-2023-49) and the animals were cared for in accordance with The National Institutes of Health Guide for the Care and Use of Laboratory Animals.
Not applicable.
This work was supported by the Application Development of Standardized Herbal Resources from the Korea Institute of Oriental Medicine (KSN1822320), and Regional Innovation Strategy through the National Research Foundation of Korea funded by the Ministry of Education (2021RIS-002).
The authors declare no conflict of interest. Changjong Moon is serving as one of the Editorial Board members/Guest editors of this journal. We declare that Changjong Moon had no involvement in the peer review of this article and has no access to information regarding its peer review. Full responsibility for the editorial process for this article was delegated to Gernot Riedel.
References
Publisher’s Note: IMR Press stays neutral with regard to jurisdictional claims in published maps and institutional affiliations.