


1 Department of Artificial Intelligence, Yonsei University, 03722 Seoul, Republic of Korea
2 Department of Computer Science, Yonsei University, 03722 Seoul, Republic of Korea
Abstract
Background: Autism spectrum disorder (ASD) is a neurodevelopmental disorder exhibiting heterogeneous characteristics in patients, including variability in developmental progression and distinct neuroanatomical features influenced by sex and age. Recent advances in deep learning models based on functional connectivity (FC) graphs have produced promising results, but they have focused on generalized global activation patterns and failed to capture specialized regional characteristics and accurately assess disease indications. Methods: To overcome these limitations, we propose a novel deep learning method that models FC with multi-head attention, which enables simultaneous modeling of the intricate and variable patterns of brain connectivity associated with ASD, effectively extracting abnormal patterns of brain connectivity. The proposed method not only identifies region-specific correlations but also emphasizes connections at specific, transient time points from diverse perspectives. The extracted FC is transformed into a graph, assigning weighted labels to the edges to reflect the degree of correlation, which is then processed using a graph neural network capable of handling edge labels. Results: Experiments on the autism brain imaging data exchange (ABIDE) I and II datasets, which include a heterogeneous cohort, showed superior performance over the state-of-the-art methods, improving accuracy by up to 3.7%p. The incorporation of multi-head attention in FC analysis markedly improved the distinction between typical brains and those affected by ASD. Additionally, the ablation study validated diverse brain characteristics in ASD patients across different ages and sexes, offering insightful interpretations. Conclusion: These results emphasize the effectiveness of the method in enhancing diagnostic accuracy and its potential in advancing neurological research for ASD diagnosis.
Keywords
- autism spectrum disorder
- dynamic functional connectivity
- graph neural network
- multi-head attention
Autism spectrum disorder (ASD) presents a unique challenge in neurodevelopmental diagnostics due to its heterogeneous manifestations [1, 2, 3]. It is characterized by a spectrum of symptoms impacting communication, social interaction, and behavior. Key neurodevelopmental changes in ASD include structural brain changes and developmental changes, which can differ by sex.
Structural brain changes, including variations in the hippocampus, amygdala, cerebellum, and cortex, are notable in ASD. For instance, an enlarged hippocampus in children and adolescents, and differing amygdala sizes impacting emotional processing are common [4, 5]. Moreover, alterations in the cortex thickness and cerebellum tissue underscore the complexity of ASD’s neural basis [6, 7]. Developmental changes in ASD are characterized by early brain overgrowth, followed by potential premature brain shrinkage. Excessive cerebrospinal fluid and enlarged head circumference in early development are also observed [8, 9, 10]. There are structural brain differences between males and females with ASD and, alongside variations in the amygdala, further complicate the subject’s neural profile [7, 11, 12].
To overcome these challenges, extensive research has been conducted based on neuroimaging techniques such as functional magnetic resonance imaging (fMRI) with deep learning to interpret and extract patterns from the brain’s complex features [13, 14]. On the other hand, an approach based on functional connectivity (FC) has emerged, which aims to provide further insight into the brain’s functional relationships [15, 16, 17]. Typically, FC-based methods utilize the brain’s regional differences by designating each region as a biomarker and measuring the correlations between regions based on their temporal attributes. The graphs created by connecting each region according to these measured correlations explicitly represent the brain’s spatial relationships, proving useful in various disease diagnoses when analyzed with tools such as graph neural networks (GNNs) [18].
However, many previous methods have focused solely on structural features or fail to consider the heterogeneous external characteristics of the data, leading to reduced efficiency in diagnosing ASD and overlooking the transient and localized features of the disorder [19, 20]. Some symptoms may manifest in concentrated forms within specific timeframes and localized regions [21, 22, 23]. For instance, seizure disorders might exhibit changes in brain activity only at distinct, fleeting moments, triggered by external or internal stimuli [24, 25]. In other words, these methods fail to capture the temporal and spatial specificity essential for accurately representing and diagnosing ASD manifestations.
To cope with the challenges of capturing the transient and localized characteristics of ASD that are heterogeneous among ASD patients, we propose a novel deep learning method designed to model FC with multi-head attention. This model aims to extract transient and localized FC while simultaneously learning the structural and temporal features in fMRI images through the attention mechanism. Unlike conventional methods, the model not only identifies region-specific correlations across the overall spectrum but also highlights the connections at specific, transient time points. Understanding the nuanced characteristics of ASD necessitates an approach that can capture the unique traits of each patient, as well as the intricate temporal and spatial dynamics of their condition. By employing multi-head attention in our analysis of ASD, we enhance our ability to capture the unique and complex traits of each patient, including their temporal and spatial dynamics.
This method allows for the simultaneous processing of diverse ASD characteristics, improving the detection of subtle patterns and offering deeper insights into the disorder. Multi-head attention thus plays a crucial role in facilitating more accurate and personalized diagnoses, marking a significant step forward in ASD research. After this extraction process, the FC is transformed into a graph. While traditional FC-based methods for ASD prediction typically represent this FC as a binary adjacency matrix, the method assigns weighted labels to the graph edges, reflecting the degree of correlation. To effectively process the graph with added edge information, the proposed method employs a GNN capable of handling edge labels to embed the FC and perform disease diagnosis. Due to its design to capture heterogeneous patterns, the proposed multi-head attention-based FC model is particularly adept at addressing the distinct neurodevelopmental changes characteristic of ASD’s heterogeneity.
To validate the effectiveness of the proposed method, we conduct experiments using the autism brainimaging data exchange (ABIDE) I and II datasets. We will show that this novel method significantly enhances the ability to differentiate between healthy brains and those affected by diseases in FC analysis experiments, aiming at ASD classification. Additionally, by categorizing patients according to age and sex as specified in the data, we will verify the observed heterogeneity in the brain imaging results of the patients. Furthermore, we will reaffirm that the proposed method achieves superior performance in datasets exhibiting this heterogeneity.
An ensemble of convolutional neural networks (CNNs), encompassing architectures such as ResNet and Inception V3, has demonstrated proficiency in extracting spatial features from brain images, a critical factor in deciphering spatial conditions [26, 27, 28]. Such models have not only achieved high accuracy but also facilitated the analysis of both structural and functional brain aspects [29]. Studies that combine spatial features using convolutional neural networks and temporal features using recurrent neural networks have been validated for effectively capturing the brain’s intricate spatio-temporal characteristics, which demonstrate superior performance in various disease diagnoses [30, 31, 32]. CNN and long short-term memory (LSTM) networks have been extensively used in brain disease diagnosis, particularly leveraging their capability to process spatio-temporal data effectively [33]. CNNs excel in extracting spatial features from complex datasets, such as fMRI images, by identifying patterns and structures within the brain. Meanwhile, LSTMs contribute by analyzing temporal dynamics, which is crucial for understanding how brain activities evolve over time. This synergy allows for a comprehensive analysis of brain function and structure, leading to more accurate diagnosis and prognosis of various neurological conditions [34].
FC analysis has emerged as a fundamental tool in brain research, playing a critical role in identifying biomarkers for a wide range of neurological and mental diseases [35, 36, 37]. Traditional FC-based methods are particularly instrumental in mapping the brain’s neural network [35]. They do so by creating graphs where nodes represent regions of interest (ROIs), specific areas within the brain that are of relevance to the study or disease in question [37]. The edges in these graphs symbolize the functional connections between these regions, essentially capturing the communication pathways or networks within the brain.
Moreover, the application of graph-based methods in fMRI analysis has significantly advanced understanding of the brain’s structure and functionality [38, 39, 40, 41]. These graph-based approaches provide a more comprehensive view of the interconnectedness of brain regions, going beyond traditional imaging techniques [38, 42]. By examining the intricate network of connections, researchers can uncover patterns and associations that may not be immediately apparent through standard imaging analysis. This level of analysis is particularly valuable in the study of complex brain disorders, where multiple regions of the brain may be affected simultaneously. Table 1 (Ref. [29, 30, 31, 32, 39, 41, 43, 44, 45]) summarizes the trends in the latest ASD-related foundational methods, including a classification and description of each method.
| Author | Feature | Method | Description |
| El-Gazzar A. et al. [30] (2019) | Spatio-Temporal | 3D-CNN-LSTM | To overcome the challenges of extracting patterns from high-dimensional data with significant cardinality, the method uses 3D CNN and LSTM networks. |
| Eslami T. et al. [31] (2019) | Spatio-Temporal | ASD-DiagNet | To mitigate diagnostic limitations of behavior analysis through autoencoders combined with classifiers or sparse autoencoders. |
| Anirudh R. and Thiagarajan JJ. [39] (2019) | Graph Neural Network | Bootstrapping ensemble of graph convolutional neural networks (GCNs) | To address the challenges by integrating socio-cultural traits and brain activity patterns, a bootstrapped GCN reduces dependency on specific graph constructions, enhancing model robustness and offering improvements over existing graph-based neural networks even in the presence of noisy graphs. |
| Ahmed M.R. et al. [29] (2020) | Spatio | CNN Ensemble | This strategy combats data complexity and heterogeneity by deploying ensemble classifiers that learn from generative models in a post-learning phase. |
| Almuqhim F. and Saeed F. [32] (2021) | Spatio-Temporal | ASD-SAEnet | To overcome the limitations of current clinical ASD diagnoses reliant on behavioral observations, ASD-SAENet utilizes a sparse autoencoder for feature optimization and classification. |
| Park K. et al. [41] (2021) | Spatio-Temporal | ResNet-LSTM with self-attention | To overcome the complexity of diagnosing ASD, the method leverages attention and convolutional recurrent neural networks to analyze dynamic connectivity between specific brain regions. |
| Kang, L. et al. [44] (2023) | Spatio-Temporal | Multi-view ensemble learning | To address inter-site heterogeneity in multi-site fMRI data, the authors utilized a multi-view ensemble learning network, demonstrating strong generalization capabilities. |
| Li W. et al. [43] (2022) | Spatio-Temporal | Self-supervised ensemble | This method addresses the issue of considering non-adjacent regions in CNNs by utilizing Vision Transformers. |
| Sotero R.C. et al. [45] (2023) | Feature Selection Algorithm | R-walk | Using a random walks technique for feature extraction and selection from resting-state fMRI data, this method demonstrates effectiveness in simplifying data and enhancing model performance. |
ASD, Autism spectrum disorder; CNN, convolutional neural network; fMRI, functional magnetic resonance imaging; LSTM, long short-term memory.
Fig. 1 illustrates the proposed model that uses a residual convolutional
bidirectional LSTM with a multi-head attention mechanism to extract spatial and
temporal features. In the preprocessing phase (Fig. 1a), 4D fMRI images are
segmented into 3D blocks at each time interval
 Fig. 1.
Overview of the proposed method. (a–c) Steps in the pre-training of attention based spatio-temporal features. (d,e) Steps in the proposed brain network graph generation. (f) The final step to diagnosing the brain disorder with graph classifications. ROI, region of interest; FC, functional connectivity; DMN, Default Mode Network; DLPFC, Dorsolateral Prefrontal Cortex; LOC, Lateral Occipital Complex; IPS, Intraparietal Sulcus; ACC, Anterior Cingulate Cortex; STS, Superior Temporal Sulcus; TPJ, Temporoparietal Junction; PCC, Posterior Cingulate Cortex; L, Left; R, Right.
Subsequently, in phase (Fig. 1d), the model explicitly maps the dynamic (temporal) FC correlations of the input image sequence to regions of the brain using features extracted from the attention mechanism in phase (Fig. 1c). This mapping is utilized in phase (Fig. 1e) to create a graph, where the FCs are treated as the adjacency matrix of the graph, the brain regions as nodes, and the edges represent the degree of correlation. The constructed graph is utilized for ASD diagnosis using a GNN. We employ a GNN capable of processing edge labels to utilize the correlations of FC more effectively.
CNNs are widely utilized in analyzing fMRI imaging data for autism diagnosis. Typically, CNNs employ convolutional filters to detect structural features within magnetic resonance imaging (MRI) scans to classify whether the patient has the disease or not. However, this approach often falls short in capturing the unique spatial differences inherent to individual patients. To overcome this limitation, we use an enhanced residual convolutional neural network. This network is designed with a more extensive and deeper architecture compared with traditional CNNs, enabling it to discern spatial variances more effectively between regions, which vary significantly among patients. We have defined spatial features not in 2-d space but in 3-d voxel space, hence we utilize a 3D ResNet structure.
We have devised a specific residual operation, denoted as
The key innovation in the proposed method lies in the incorporation of a
residual connection that maintains the gradient
This feature is particularly critical in addressing the issue of gradient vanishing, a common challenge in deep neural networks. It not only mitigates the gradient vanishing issue but also ensures minimal loss of dynamic FC inherent in convolutional networks. Simultaneously, it maximizes the extraction and analysis of spatial variations.
The spatial features of the brain extracted through the residual network are fed into a BiLSTM-based multi-head attention mechanism for mapping time series attributes. One of the primary objectives of the proposed method is to extract and enhance transient brain features appearing in fMRI images, which is why we employ an attention-based mechanism to map these time series attributes. We use multi-head attention instead of single head attention because the latter is often insufficient to fully extract the dependencies between temporal features in the complex spatial context of the brain. Multi-head attention allows us to model these dependencies more effectively.
When considering the features
Here,
where
Finally, the output representation
This process is repeated independently
Park et al. [41] demonstrated that the extraction of spatio-temporal features while preserving the integrity of dynamic connectivity significantly enhances accuracy. Nevertheless, a more direct method to learn the dynamic connectivity across 39 brain regions could offer further improvements. As depicted in Fig. 1e, the method leverages the spatio-temporal model as a foundational, pre-trained model. We transform the output of the intermediate layer, which consists of time-series spatial feature maps, into a connectivity matrix that delineates the relationships between 39 distinct brain regions. Subsequently, this spatio-temporal feature map is merged with a connectivity adjacency matrix, incorporating attention weights between regions. The GNN is then employed to explicitly learn and articulate the connection information among these 39 brain regions.
Upon processing the fMRI data through the LSTM network, enhanced with an
attention mechanism, the output consists of a series of feature representations,
symbolized as
The connectivity matrix, denoted as
Here,
This method leads to the creation of a comprehensive connectivity matrix
Next, we interpret the connectivity matrix
This labeling method allows us to transform the continuous brain connectivity data into a format suitable for GNN analysis.
In the proposed method, we translate the fMRI-derived connectivity matrix
Given the graph
Here,
where
Through successive ECC layers, the graph is embedded into a high-dimensional space that captures not only the features of individual brain regions but also the complex connectivity patterns among them. This embedded representation is then used for classification tasks, such as identifying ASD. The ECC’s ability to condition on edge labels enables the model to adaptively learn different patterns of brain connectivity, crucial for accurate disease diagnosis.
The final classification is performed by feeding the embedded graph representation through a series of fully connected layers, culminating in a softmax layer for disease categorization:
where
The experimental setup was conducted using a Nvidia DGX station (Nvidia, Santa Clara, CA, United States) equipped with 2560 Nvidia tensor cores, running on an Ubuntu desktop Linux OS. The hardware included four Tesla V100 GPUs (64 GB each) and 256 GB of LRDIMM DDR4 memory. For the software environment, we utilized Ubuntu with Python 3.x (https://www.python.org/) and TensorFlow version 2.3 (https://www.tensorflow.org/). Additionally, various Python libraries (https://pypi.org/) such as Scikit-learn, Nilearn, Nibabel, Monai, and Networkx were utilized for the experiments.
We employed the preprocessed ABIDE I and II datasets [44], accessible through a web-based platform. We preprocessed the dataset using the Configurable Pipeline for the Analysis of Connectomes (C-PAC) as our preprocessing pipeline. This version of the preprocessing steps includes slice timing and motion correction, intensity normalization (4D global mean = 1000), nuisance signal regression, band-pass filtering (0.01–0.1 Hz), and registration to the 3 mm Montreal Neurological Institute (MNI) standard template. The fMRI volumes were down sampled to 4 mm in the MNI space. During the training phase, the data was augmented through intensity normalization, random Gaussian noise injection, and affine transformations, along with sequence sampling. During inference, a sliding window inference technique was employed, where the model made predictions for a continuous sequence of 10 frames (window size of 10) from user data using a sliding window approach. Soft voting was then conducted using the model’s predictions across the sliding window to aggregate the final prediction results. Table 2 shows the data collection institutions for ABIDE I and II, along with the distributions of ASD/normal and male/female, and the minimum and maximum ages.
| ABIDE I | ABIDE II | ||||||||||||
| Site | Count | Min age (y) | Max age (y) | Site | Count | Min age (y) | Max age (y) | ||||||
| ASD | Control | Male | Female | ASD | Control | Male | Female | ||||||
| CALTECH | 19 | 19 | 30 | 8 | 17.0 | 56.2 | BNI | 29 | 29 | 58 | 0 | 18.0 | 64.0 |
| CMU | 14 | 13 | 21 | 6 | 19.0 | 40.0 | EMC | 27 | 27 | 44 | 10 | 6.2 | 10.7 |
| KKI | 22 | 33 | 42 | 13 | 8.07 | 12.77 | ETH | 13 | 24 | 37 | 0 | 13.8 | 30.7 |
| LEUVEN_1 | 14 | 15 | 29 | 0 | 18.0 | 32.0 | GU | 51 | 55 | 71 | 35 | 8.1 | 13.9 |
| LEUVEN_2 | 15 | 20 | 27 | 8 | 12.1 | 16.9 | IP | 22 | 34 | 26 | 30 | 6.1 | 46.6 |
| MAX_MUN | 24 | 33 | 50 | 7 | 7.0 | 58.0 | IU | 20 | 20 | 31 | 9 | 17.0 | 54.0 |
| NYU | 79 | 105 | 147 | 37 | 6.47 | 39.1 | KKI | 56 | 155 | 140 | 71 | 8.0 | 13.0 |
| OHSU | 13 | 15 | 28 | 0 | 8.0 | 15.23 | KUL | 28 | 0 | 28 | 0 | 18.0 | 35.0 |
| OLIN | 20 | 16 | 31 | 5 | 10.0 | 24.0 | NYU_1 | 48 | 30 | 71 | 7 | 5.2 | 34.8 |
| PITT | 30 | 27 | 49 | 8 | 9.33 | 35.2 | NYU_2 | 27 | 0 | 24 | 3 | 5.1 | 8.8 |
| SBL | 15 | 15 | 30 | 0 | 20.0 | 64.0 | OHSU | 37 | 56 | 57 | 36 | 7.0 | 15.0 |
| SDSU | 14 | 22 | 29 | 7 | 8.6 | 17.1 | OILH | 24 | 35 | 40 | 19 | 18.0 | 31.0 |
| STANFORD | 20 | 20 | 32 | 8 | 7.5 | 12.9 | SDSU_1 | 33 | 25 | 49 | 9 | 7.4 | 18.0 |
| TRINITY | 24 | 25 | 49 | 0 | 12.0 | 25.9 | SDSU_2 | 21 | 21 | 38 | 4 | 8.4 | 13.2 |
| UCLA_1 | 49 | 33 | 71 | 11 | 8.4 | 17.9 | TCD | 21 | 21 | 42 | 0 | 10.0 | 20.0 |
| UCLA_2 | 13 | 14 | 25 | 2 | 9.79 | 16.47 | UCD | 18 | 14 | 24 | 8 | 12.0 | 17.8 |
| UM_1 | 55 | 55 | 84 | 26 | 8.2 | 19.2 | UCLA | 16 | 16 | 26 | 6 | 7.8 | 15.0 |
| UM_2 | 13 | 22 | 33 | 2 | 12.8 | 28.8 | USM | 17 | 16 | 28 | 5 | 9.1 | 38.9 |
| USM | 58 | 43 | 101 | 0 | 8.8 | 90 | U_MIA | 13 | 15 | 22 | 6 | 7.1 | 14.3 |
| YALE | 28 | 28 | 40 | 16 | 7.0 | 17.8 | |||||||
ABIDE, Autism Brain Imaging Data Exchange.
Given the variability in the size and length of each fMRI image, we standardized
all images to a uniform size of 24
| Dataset | Type | Configure | ||
| Train | Valid | Test | ||
| ABIDE I | ASD | 421 | 47 | 52 |
| Control | 449 | 50 | 55 | |
| ABIDE II | ASD | 422 | 47 | 52 |
| Control | 481 | 53 | 59 | |
| Operation | Time | In | Out | Kernel | Stride | Padding | BatchNorm | Dropout | Activation |
| Distributed | Channels | Channels | (Layer) | ||||||
| Input: 10 | |||||||||
| Input stem | True | 1 | 32 | 3 |
2 |
1 |
True | 0.3 | ReLU |
| Layer 1 | True | 32 | 64 | 3 |
1 |
1 |
True | 0.3 | ReLU |
| Layer 2 | True | 64 | 128 | 3 |
1 |
1 |
True | 0.3 | ReLU |
| Max pooling | True | 128 | 128 | 2 |
2 |
X | X | X | X |
| Layer 3 | True | 128 | 256 | 3 |
1 |
1 |
True | 0.3 | ReLU |
| Layer 4 | True | 256 | 512 | 3 |
1 |
1 |
True | 0.3 | ReLU |
| Global | True | - | - | 3 |
- | - | - | - | - |
| Average Pooling | |||||||||
| Bi-Directional | True | 512 | 1024 | 2 | - | - | - | X | ReLU |
| LSTM | |||||||||
| Multi-head | - | 1024 | 1024 | 8 | - | - | - | X | ReLU |
| Attention | |||||||||
| Fully | - | 1024 | 256 | - | - | - | True | 0.5 | ReLU |
| Connected 1 | |||||||||
| Fully | - | 256 | 2 | - | - | - | - | 0.3 | Softmax |
| Connected 2 | |||||||||
| Optimizer | Adam (lr = 0.0001, weight decay = 0.0005) | ||||||||
| Batch size | 128 | ||||||||
| Epochs | 1000 epochs (early stopping 20) | ||||||||
| Lr scheduler | StepLR (step_size = 50, gamma = 0.5) | ||||||||
| Total Params: 20,236,146 | |||||||||
ReLU, Rectified Linear Unit.
The results of the 10-fold cross-validation experiments in ABIDE I and II demonstrated the superiority of the proposed method. As shown in Fig. 2 and Table 5 (Ref. [29, 30, 31, 32, 41, 44, 45, 46, 47]) when compared with the graph-based approach Covariance FC with GCN, the method exhibited a performance improvement of approximately 3.7%p in the ABIDE I dataset and about 2.1%p in the ABIDE II dataset. This performance difference is attributed to two main reasons. Firstly, the use of covariance in FC for graph construction in traditional methods may not sufficiently capture the neurological characteristics of the brain. The proposed method, applying multi-head attention, diversifies perspectives in extracting correlations, thereby enhancing the ability to identify and emphasize heterogeneous data features from fMRI data. Secondly, unlike GCN which uses only node features as input, the method benefits from the Edge conditioned layer that models the correlations between nodes, leading to more effective embedding of the constructed FC and subsequently improved performance (detailed in section 4.3). Due to these characteristics, the proposed method outperformed existing 3D CNN neural network-based approaches that achieved state-of-the-art (SOTA) results through additional parameters or enhanced learning algorithms.
 Fig. 2.
Box plot of accuracy on the ABIDE I and II datasets. ABIDE, autism brainimaging data exchange.
| Task (dataset) | Method | Accuracy |
| ABIDE I | Bootstrapping ensemble of GCNNs [47] | 68.46 |
| ASD-DiagNet [31] | 76.22 | |
| Multi-view ensemble learning [44] | 74.16 | |
| ASD-SAEnet [32] | 77.13 | |
| R-walk [45] | 73.45 | |
| CNN Ensemble [29] | 83.67 | |
| 3D-CNN-LSTM [30] | 84.65 | |
| ResNet-LSTM with self-attention [41] | 86.74 | |
| Covariance FC with GCN | 87.66 | |
| Self-supervised ensemble [46] | 94.13 | |
| Proposed Method | 97.88 | |
| ABIDE II | Multi-view ensemble learning [44] | 73.75 |
| ASD-SAEnet [32] | 74.81 | |
| R-walk [45] | 75.99 | |
| CNN Ensemble [29] | 81.48 | |
| 3D-CNN-LSTM [30] | 82.38 | |
| ResNet-LSTM with self-attention [41] | 82.39 | |
| Covariance FC with GCN | 86.94 | |
| Self-supervised ensemble [46] | 93.23 | |
| Proposed Method | 95.35 |
The receiver operating characteristic (ROC) curves of the five models are shown in Fig. 3. In contrast to alternative network models, our proposed model demonstrates a more balanced trade-off between accuracy and recall rates. Additionally, the aria under the ROC curve (AUC) index of our model surpasses that of the others, affirming its capacity to capture the intrinsic features of the data. This underscores the superior generalization ability of our model.
 Fig. 3.
ROC curves on the ABIDE I and II datasets. ROC, receiver operating characteristic; FP, False Positive; TP, True Positive.
Fig. 4 illustrates the brain regions activated as identified through the proposed method’s model internal attention values, based on the presence or absence of various diseases, age, and sex derived from data and additional analyses. Notably, in the activation maps of Fig. 4a–c, where ASD is present, each map shows different regional activations, highlighting that the areas highlighted by the proposed method vary with age and sex. Furthermore, the activation maps of Fig. 4c,d for similar age groups and the same sex show generally similar patterns of highlighted regions, despite the presence or absence of disease. This underlines the necessity for models diagnosing ASD to capture not only specific regions and times of brain activity but to also comprehend the extent of each disease present in the dataset and the unique characteristics of each patient. In essence, this disorder exhibits heterogeneity based on disease progression, sex, and age, indicating that various complex external factors must be considered in diagnosing ASD. Based on our analysis of Fig. 4 and the detailed observations of brain region activations through the proposed method’s attention values, it becomes evident that our approach excels at extracting the nuanced characteristics of ASD and its variability across different ages and sexes. This proficiency is particularly crucial given the heterogeneity of ASD, which manifests distinctly in each individual based on a complex interplay of factors including disease progression, age, and sex.
 Fig. 4.
Brain ROI activations depend on the presence or absence of disease, age, and sex. (a–c) represent brain scans of patients with ASD, while (d,e) depict brain scans of controls. The blue boxes denote common features visible in both individuals with the disease and those without it, while the red boxes indicate the level of activation varying according to age, gender, and disease status of each patient and control. ROI, represent regions of interest; M, male; F, female.
Fig. 5 illustrates the analysis of the correlation matrix extracted by the proposed method. As observed in this correlation matrix, the time-series features extracted from ASD patients and processed through the attention mechanism closely connect various regions of the brain, reflecting their interdependencies and enabling effective prediction of ASD. In contrast, in a normal brain, the attention mechanism does not establish as strong connections between regions, indicating that the model fails to identify significant characteristics that could highlight connections across different brain areas. This distinction highlights the strength of the proposed method, which leverages attention-based feature extraction, graph transformation, and a GNN. These steps enhance the differentiation of disease-specific features, thereby improving the accuracy of disease diagnosis. The method’s effectiveness is rooted in its ability to accentuate the contrast between the neurobiological patterns of ASD and those of a typical brain, illustrating the nuanced complexities captured by the proposed method. The integration of the attention mechanism with graph-based analyses provides a more comprehensive understanding of brain connectivity patterns, crucial for discerning the subtle yet significant differences in neurological conditions. This advanced methodology demonstrates a significant stride in enhancing diagnostic precision through sophisticated analysis of fMRI data.
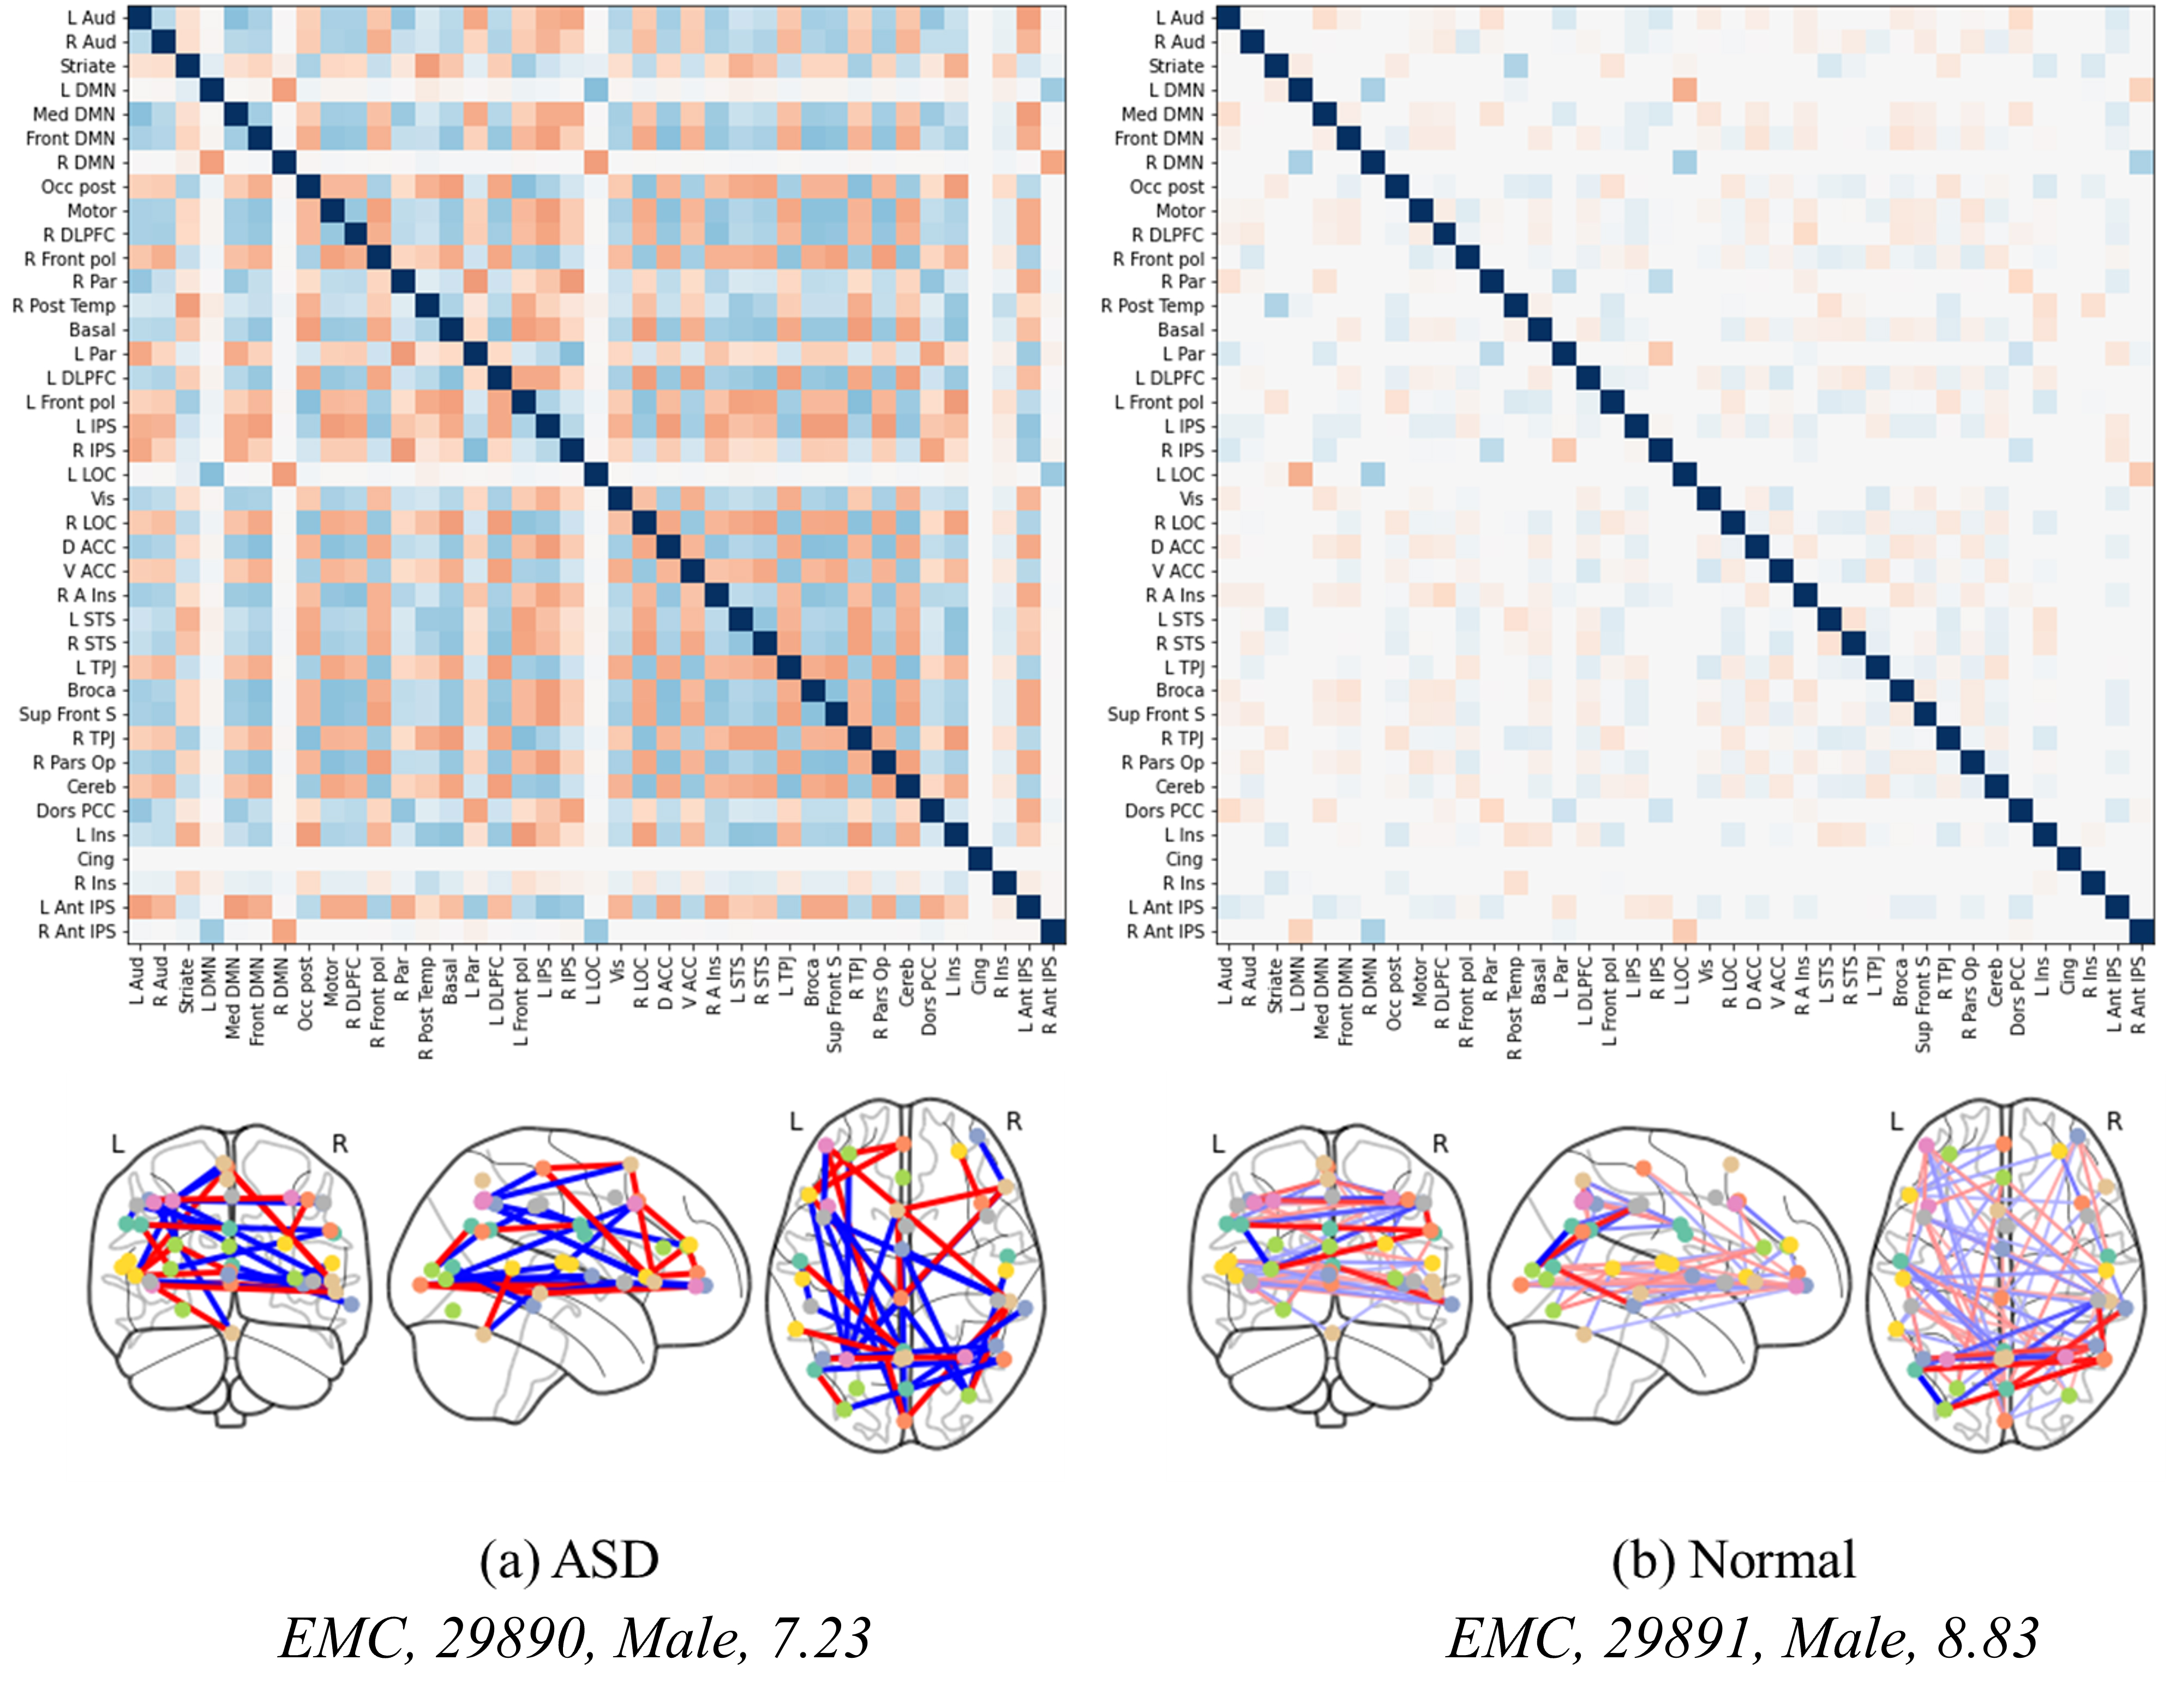 Fig. 5.
Correlation matrices and brain regional connectivity graphs in ASD and normal brains. (a,b) show the level of brain activation between normal individuals and patients of similar age groups.
Fig. 6 depicts FC overlaid on brain images to analyze differences based on the presence of disease, as well as sex and age. Below each image, details such as the collection site, subject ID, sex, age, and disease status are documented. This allows for a detailed examination of patterns in ASD across different age groups, as observed in the differences between images Fig. 6a,b. This not only suggests that FC characteristics in ASD can vary with age and between individuals but also highlights the importance of deep learning models in capturing these individual variations. Furthermore, a comparison between images Fig. 6a,c demonstrates sex-based variations in brain characteristics. For instance, the posterior region of the left hemisphere is almost inactive in image Fig. 6c compared with Fig. 6a, highlighting the diversity in brain activation patterns in ASD. The differences among images Fig. 6a–d, where no similar patterns are observed, underscore the necessity of the proposed model. Additionally, the similarities observed in images Fig. 6d–f, regardless of the presence or absence of disease, present a unique challenge. Considering that d represents ASD while Fig. 6e,f are from healthy brains, distinguishing these subtle differences becomes a primary function of the model. Therefore, the effectiveness of our proposed method, which employs enhanced FC with multi-head attention and an edge label-based GNN, is validated by its superior performance.
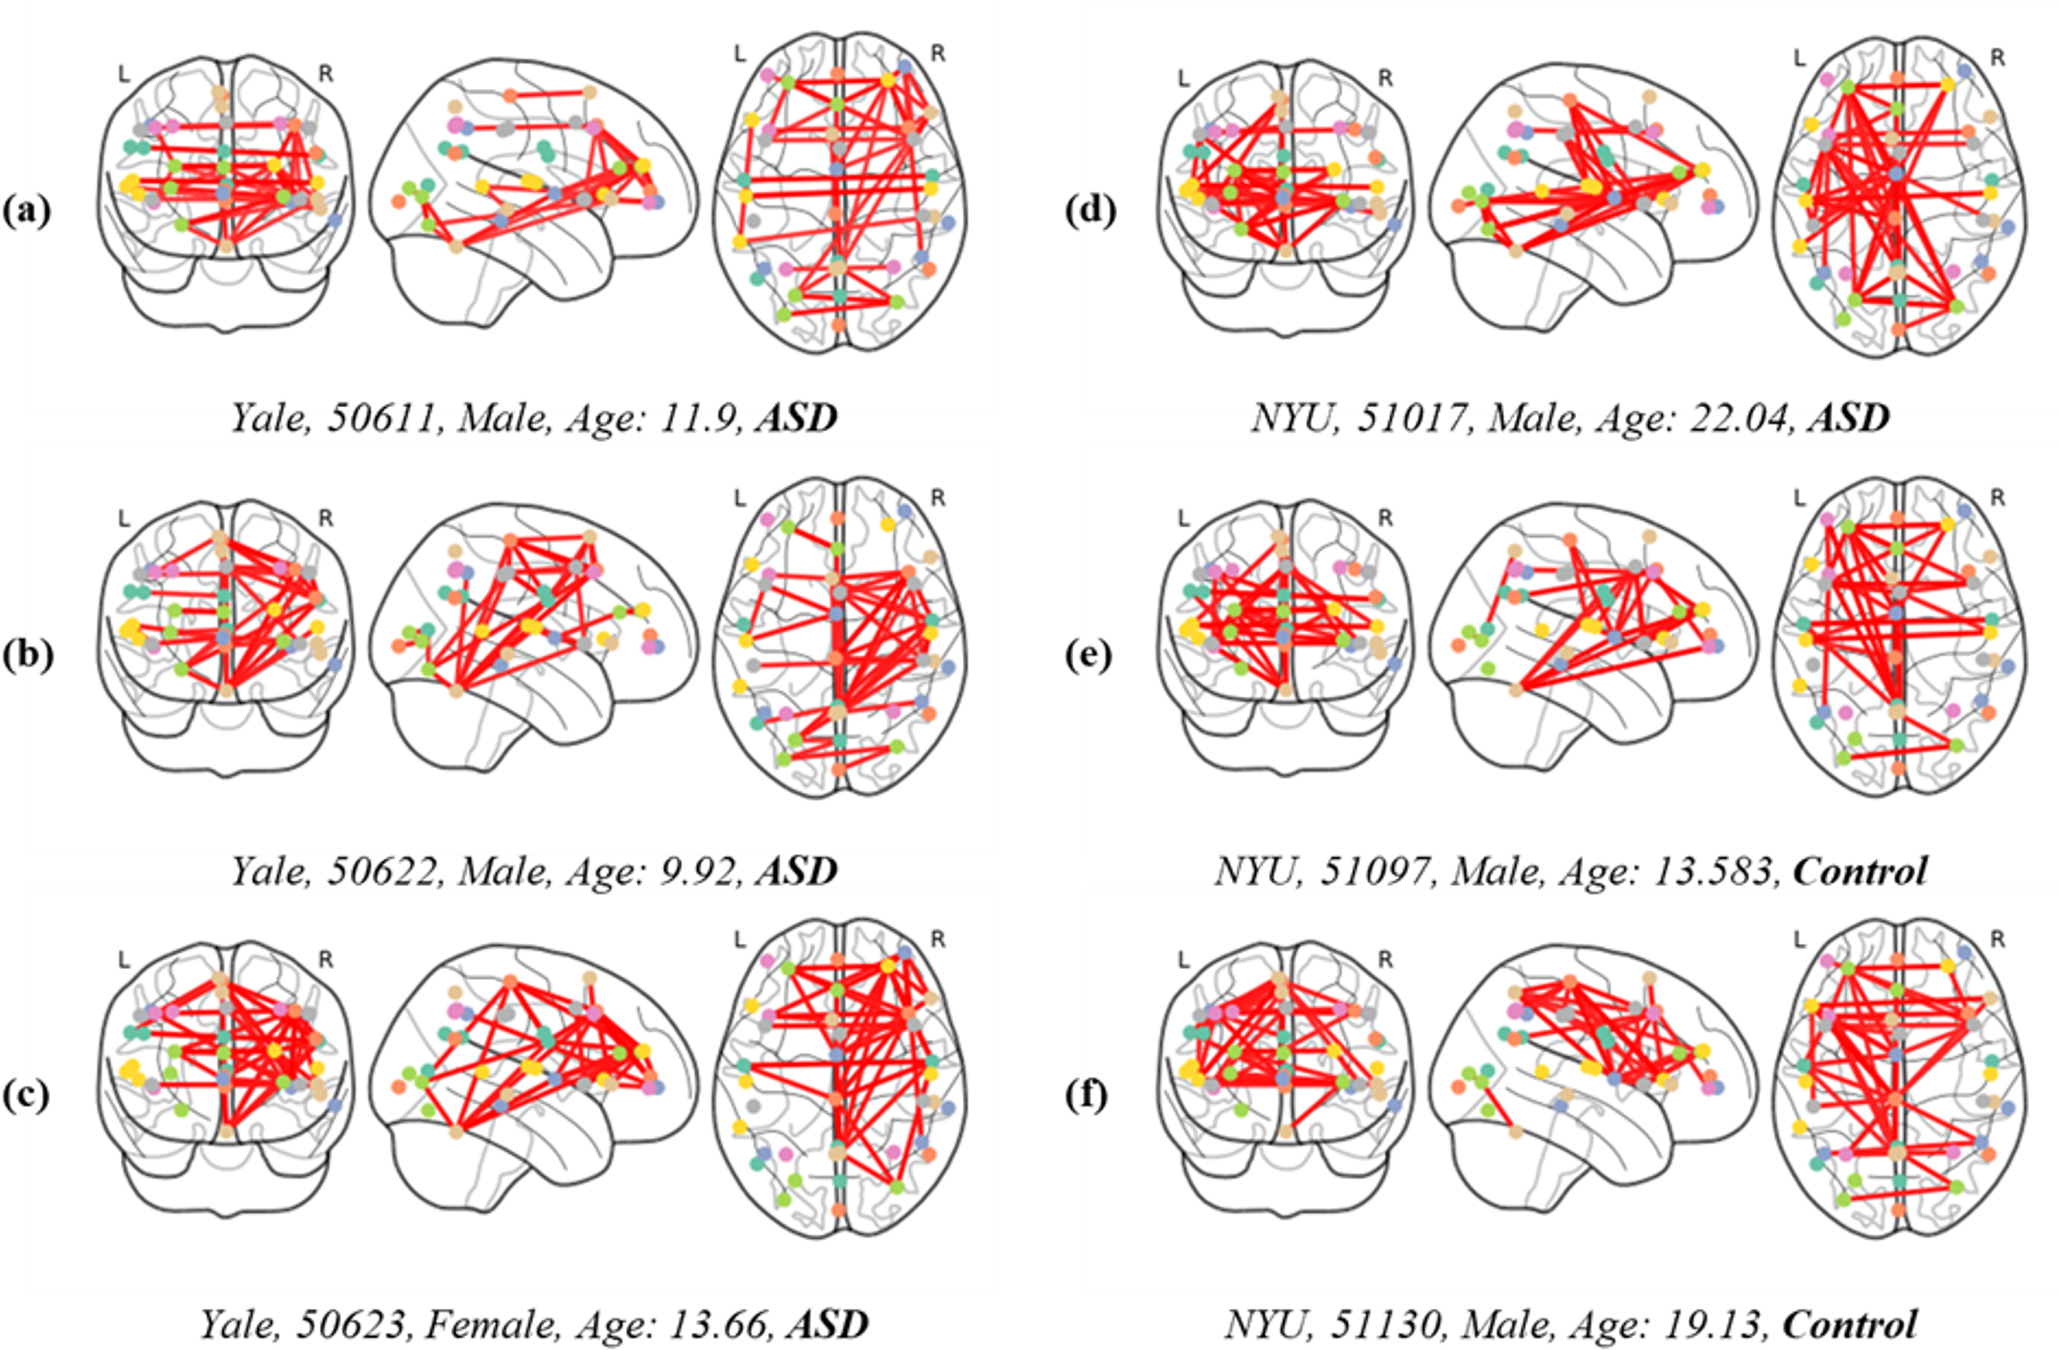 Fig. 6.
FC displayed over brain images, categorized by the presence or absence of disease, and differentiated by sex and age (measured in years). Subgraphs (a–f) represent the interconnectivity between brain regions of both patients and control individuals.
Table 6 shows the statistical significance of various methods in comparison with
the proposed method across a range of experimental settings. Each row represents
a different method, while the columns delineate the p-values obtained through
Wilcoxon tests and their corresponding false discovery rate (FDR)-corrected
values. These metrics serve as indicators of the likelihood that the observed
differences between the proposed method and its counterparts are due to chance.
Upon examining the table, it is evident that the p-values associated with the
proposed method consistently exhibit a substantial disparity compared with other
techniques. For instance, the p-values for CNN Ensemble, Covariance FC with GCN,
ASD-SAEnet, Vision-Transformer, 3D-CNN-LSTM, ASD-DiagNet, Contrastive CNN, and
CNN-LSTM-GCN are 3.5
| Method | p-value (Wilcoxon) | Corrected p-value (FDR) |
| **CNN Ensemble | 3.5 |
2.8 |
| **Covariance FC with GCN | 6.58 |
2.6 |
| **ASD-SAEnet | 2.2 |
5.9 |
| **Vision-Transformer | 1.3 |
52.6 |
| **3D-CNN-LSTM | 3.4 |
5.4 |
| **ASD-DiagNet | 4.1 |
5.4 |
| *Contrastive CNN | 1.1 |
1.3 |
| CNN-LSTM-GCN | 8.4 |
8.4 |
*p
Our experimental analysis confirms that the proposed method significantly outperforms existing models in detecting ASD, showcasing its potential to improve early diagnosis and contribute to personalized healthcare strategies. The attention-based feature extraction mechanism effectively identifies the most relevant features across diverse patient profiles, illustrating a deep understanding of the disorder’s complexity. This capability is a testament to the model’s design, which integrates advanced machine learning techniques to navigate the intricate patterns of brain activity unique to ASD.
In conclusion, the proposed method introduces a more complex yet significantly more effective approach to ASD diagnosis. Despite the increase in complexity, this method marks a substantial advancement by offering unparalleled precision in understanding and diagnosing the disorder. Its sophisticated use of advanced techniques, including but not limited to multi-head attention, allows for the precise extraction of features from brain activation maps, enhancing diagnostic accuracy and our understanding of ASD. This method’s ability to navigate the disorder’s complexities provides clear advantages, including the potential for more accurate diagnoses, the development of personalized treatment plans, and the facilitation of further research into ASD. By leveraging these advanced techniques, the proposed method sets a new standard for ASD diagnosis, promising improved outcomes for individuals with ASD and paving the way for more effective, personalized care.
Although our method has shown promising results in effectively extracting brain networks and has undergone rigorous performance and qualitative evaluations for disease identification, we acknowledge the existence of multiple challenges that impede our progress towards a truly comprehensive diagnostic tool. In practical scenarios, it is highly unlikely to encounter situations where only a single disease needs detection. This reality encourages us towards the ambitious goal of developing a universal diagnostic model that can seamlessly transition between diagnosing various neurological conditions, such as Alzheimer’s disease, attention deficit/hyperactivity disorder (ADHD), and beyond.
However, a significant hurdle that currently limits our research is the focused nature of existing studies on particular diseases. This specificity necessitates a unique preprocessing routine for each disease dataset, complicating the development of a universal model. The need for a simplified and standardized preprocessing procedure cannot be overstated, as it would significantly facilitate the adaptation of models to handle diverse datasets efficiently.
Moreover, the advent of transformer-based feature extractors, renowned for their efficacy in numerous fields, particularly due to their strengths in transfer learning, presents an opportunity for innovation in fMRI data analysis. These models’ ability to adapt and learn from vast amounts of data could revolutionize how we approach fMRI data, making them an excellent candidate for future research. Nonetheless, developing a transformer-based model that caters specifically to the unique characteristics of fMRI data, such as its high dimensionality and the subtle nature of signal variations indicative of different neurological conditions, poses an additional layer of complexity. Such a model would need to not only extract relevant features from the fMRI data effectively but also be capable of doing so in a way that is computationally feasible and clinically relevant.
To evolve into a universal model that is adaptable to various downstream tasks derived from fMRI data, we must also consider the integration of multimodal data sources, including genetic information, clinical assessments, and behavioral data. This integration would undoubtedly enhance the model’s diagnostic capabilities but also introduces the challenge of managing and analyzing heterogeneous data types.
In this paper, we present a significant advancement in understanding and diagnosing neurological conditions, using advanced neural network techniques applied to fMRI data. The proposed method, which incorporates attention-based feature extraction, graph transformation, and GNNs, has demonstrated superior accuracy in identifying ASD and differentiating it from normal (neurotypical) brain patterns. The SOTA models achieve 94.13% and 93.23% accuracy on the ABIDE I and II datasets, whereas our proposed method has achieved 97.88% and 95.35% accuracy on the same datasets. Thus, we achieved an accuracy increase of up to 3.7%p over other SOTAs, outperforming the latest model methods. Our proposed method has not only enhanced the accuracy of ASD diagnosis but also provides deeper insights into the underlying neurobiological mechanisms.
Future research will focus on developing brain feature extraction methods using contrastive learning. Although the proposed method is effective, it is essential that the feature extraction process is enhanced, especially for identifying patterns in continuous images. The goal is to synergistically integrate feature extraction with graph learning, aiming for more refined and accurate neural network models for use in neurological diagnostics.
ASD, Autism spectrum disorder; FC, functional connectivity; SOTA, state-of-the-art; CNNs, convolutional neural networks; ROIs, represent regions of interests; GNN, graph neural network; LSTM, long short-term memory; GCN, graph convolutional neural networks; ROC, receiver operating characteristic; AUC, area under the ROC curve; ADHD, attention deficit/hyperactivity disorder.
The datasets used in this study can be found in the ABIDE repository (http://preprocessed-connectomes-project.org/abide/).
HJM and SBC designed the research study, and wrote the manuscripts. HJM conducted the implementation of the method and analyzed the results. SBC guided the overall research including the implementation and the analysis. Both authors contributed to editorial changes in the manuscript. Both authors read and approved the final manuscript. Both authors have participated sufficiently in the work and agreed to be accountable for all aspects of the work.
Not applicable.
Sung-Bae Cho appreciates the Yonsei Fellow Program funded by Lee Youn Jae and Air Force Defense Research Sciences Program funded by Air Force Office of Scientific Research.
This work was supported by IITP grant funded by the Korean government (MSIT) (No. RS-2020–II201361, Artificial Intelligence Graduate School Program (Yonsei University); No. RS-2022–0–II220113, Developing a Sustainable Collaborative Multi-modal Lifelong Learning Framework) and ETRI grant funded by the Korean government (24ZB1100, Core Technology Research for Self-Improving Integrated Artificial Intelligence System).
The authors declare no conflict of interest.
References
Publisher’s Note: IMR Press stays neutral with regard to jurisdictional claims in published maps and institutional affiliations.