


1 Clinical and Experimental Therapeutics, College of Pharmacy, University of Georgia, Augusta, GA 30912, USA
2 Culver Vision Discovery Institute, Augusta University, Augusta, GA 30912, USA
3 Vascular Biology Center, Augusta University, Augusta, GA 30912, USA
4 Research Division, Charlie Norwood VA Medical Center, Augusta, GA 30904, USA
Abstract
Background: Multiple Sclerosis (MS) is a debilitating neurological disease affecting the central nervous system and significantly impacting patients’ quality of life. MS is known as an autoimmune disease affecting the white matter. The disease involves inflammation, demyelination, and neurodegeneration, causing irreversible disabilities. Current treatments for MS target the inflammatory phase, with limited effects on long-term disability. While neuronal damage significantly contributes to MS pathology, mechanisms of neurodegeneration are not well studied. Methods: This study evaluated neurodegenerative changes in the retina during disease progression, using data collected from an experimental MS model (Experimental Autoimmune Encephalomyelitis, EAE). Utilizing Hematoxylin and Eosin-stained retinal sections and assessment using Optical Coherence Tomography (OCT), the study investigated the neurodegenerative changes, such as loss of cells in the retinal ganglion cell layer (GCL) and retinal thinning in the retina of the EAE model and the control groups. Results: Our results showed a significant reduction in the number of cells in the GCL of the EAE retina at two different time points studied, suggesting loss of neurons compared to the control group. Thickness measurements showed a reduction in the total retina and inner retinal layer thicknesses in the EAE retina compared to the controls. Our results indicate evidence of neurodegenerative changes in the retina of the experimental model of MS. No significant differences were observed between the percent losses of cells between the two time points studied. The pattern of cell loss suggests that neurodegeneration occurs at an earlier stage of disease progression. Conclusions: Overall, the retina is an excellent model to investigate neurodegeneration in MS, and possibly, loss of cells in the GCL could be used as an early indicator of neurodegeneration in MS and to identify novel therapeutic agents to treat the disease.
Keywords
- multiple sclerosis
- retina
- neurodegeneration
- ganglion cell layer
- retinal thinning
Multiple Sclerosis (MS) is a highly disabling neurological disease that affects the central nervous system [1]. MS affects over 2.5 million people worldwide, with a higher incidence in females [2]. MS patients experience various disabilities, including vision problems, memory loss, cognitive deficits, and movement disorders [3]. Symptoms of MS are variable and unpredictable and may persist and worsen in some patients. The clinical symptoms include unilateral optic neuritis presented by blurred vision with associated pain, the appearance of focal sensory disturbances such as limb paresthesia, abdominal or chest banding, presence of partial myelitis shown by an impaired sensation of extremity and torso, weakness or brainstem syndromes such as intranuclear ophthalmoplegia, vertigo, hearing loss, facial sensory disturbance [4]. The appearance of new symptoms or the return of old symptoms (in the absence of fever or infections), developing acutely or subacutely, with a duration of at least 24 hours, are called relapses. The disease significantly influences a patient’s quality of life through motor impairment, vision changes, cognitive decline, depression, anxiety, etc. [5, 6, 7, 8]. Women have about three times increased likelihood of developing MS, and the initial symptoms typically occur between 20 and 50 years of age. The prevalence of MS varies by location and generally increases the further one travels from the equator in either hemisphere [2]. While the exact cause of MS is not completely known, it is triggered by etiological factors in individuals genetically predisposed and exposed to environmental factors [9]. Factors such as lifestyle, metabolism, reduced vitamin D levels, UV radiation, viral infections, and smoking may contribute to the development and outcomes of MS [4, 10].
MS is a multifactorial disease involving inflammation, demyelination, and neuronal and axonal damage-causing patients to develop irreversible neurological disabilities [11]. The lesions of MS are represented by multifocal demyelinating areas distributed in the central nervous system (CNS), characterized by inflammatory infiltrates. They are initially observed in the pons, spinal cord, and periventricular region but can be seen in any area of the CNS. Other common areas of MS lesions include the brainstem, the cerebellum, and the cortical and juxtacortical regions [12]. Degeneration of demyelinated axons is a major cause of irreversible neurological disability in MS [13]. The axonal loss is less evident during the early stages and increases as the disease progresses [12]. When myelin is lost, the ability of the axon to conduct electrical signals is compromised, resulting in slower nervous conduction and functional impairment in the affected area, contributing to long-term disability and disease progression [12]. While progressive neurodegeneration is evident in MS, current therapies focus on inflammation and have limited effects on the long-term disability of MS patients [14]. Retina, a part of the CNS known as the “window to the brain”, is considered an exemplary model for studying mechanisms of neuronal damage. Like the brain, the retina is composed of multiple cell types, including neurons, immune cells, supporting glia, and endothelial cells [15]. Investigations from MS patients and experimental models have shown that retinal ganglion cells degenerate during the progression of MS [16, 17, 18]. Retinal optical coherence tomography (OCT) is increasingly used in MS clinical trials as an outcome measure in developing novel neuroprotective and potential remyelinating therapies [19, 20]. Experimental Autoimmune Encephalomyelitis (EAE) is an extensively used rodent experimental model to study MS and is established in our laboratory [21, 22]. The EAE model and MS show several similarities; EAE induces symptoms such as inflammation, demyelination, axonal loss, and gliosis, which are the common pathological characteristics of MS [23, 24]. Degeneration of Retinal Ganglion Cells (RGC) evaluated by RGC markers has been reported in different stages of EAE progression [25, 26, 27]. Retinal thinning is another characteristic of the EAE retina [28, 29]. However, no study has investigated if the number of cells in ganglion cell layer (GCL) could be an indicator of neurodegeneration in the EAE retina. Utilizing age-matched EAE and control mice, the present study evaluated the cell loss on the GCL and thinning of retinal layers at two different time points of EAE and investigated whether the cell loss in the retinal ganglion cell layer is an indicator of neurodegeneration in MS.
All the procedures performed on animals in this study complied with the Association for Research in Vision and Ophthalmology (ARVO) statement for the use of Animals in Ophthalmic and Vision Research. Wild type (WT) mice (12–13 weeks old female, C57BL/6J background) used in this study were obtained from Jackson Laboratory (Bar Harbor, ME, USA). The study protocols used were approved by the Institutional Animal Care and Use Committee of Augusta University, Augusta, GA, USA (2016-0823). Measures were taken to minimize the pain and suffering of the animals during experimental procedures. EAE induction was performed using the EAE induction kit (Hooke laboratories, Lawrence, MA, USA), following the manufacturer’s instructions and our published methods [21, 22, 26]. Disease progression was evaluated daily in a blinded fashion by assessing the clinical signs per the conventional grading system: 0, no disease; 1, complete loss of tail tonicity; 2, partial hind limb paralysis (uneven gate of hind limb); 3, complete hind limb paralysis; 4, complete hind and forelimb paralysis; and 5, moribund or dead [21, 26]. Mice showing signs of paralysis were provided with soft food, and those exhibiting paralysis on all four limbs and/or showing a weight loss of more than 15% were removed from the study and sacrificed. Mice were deeply anesthetized by using an overdose of ketamine/xylazine cocktail, and eyeballs were collected for analysis.
These procedures were performed according to the methods established in our laboratory [26]. The eyeballs were fixed overnight in 4% paraformaldehyde (at 4 °C), washed in Phosphate Buffered Saline (PBS, Cat# BP2944100, Thermo Fisher Scientific, Waltham, MA, USA), and cryoprotected in 30% sucrose (4 °C for 48 h). Eyeballs were carefully embedded in an OCT medium (Tissue-Tek®, Tokyo, Japan), snap-frozen, and stored at –80 °C until processed. Cryostat sections (10 µm) were prepared (histology core, Augusta University, Augusta, GA, USA) and stored at –80 °C until used. The hematoxylin and eosin (H&E) staining of retinal sections was performed at Augusta University’s histology core. Images were acquired using a Zeiss AxioPlan 2 microscope (Carl Zeiss, Thornwood, NY, USA).
Using the NIH ImageJ program (Version 1.53 k, NIH, Bethesda, MD, USA), the number of cells in the retinal ganglion cell layer (GCL) was calculated. Images were opened using the ImageJ software, duplicated, and converted to 8-bit format. Using the “point tool” option, the number of cells with clear nuclei in the GCL was marked. For each image, the marking was performed from the optic nerve head to the periphery. Using the “Analyze Particles” function of the software, the software highlights the marks placed by the point tool and counts them. A minimum of 3 images per retina (20 µm apart) were used, and alternate wings were used for consecutive sections. The number of cells (from the optic nerve to the periphery) was multiplied twice to get the total number of cells per GCL per the retinal section.
The thickness of different retinal layers was extracted from the images collected using Spectral Domain Optical Coherence Tomography (SD-OCT, Bioptigen Envisu R2200, Morrisville, NC, USA; a specialized equipment to perform non-invasive retinal imaging on live mice, available at the Augusta University Vision core), following 30 and 60 days post-induction. The thickness of the total retina and each retinal layer were measured and collected by SD-OCT and were extracted in a blinded fashion [21].
T-test (two-tailed) was administered using GraphPad Prism 9 (GraphPad
Software Inc., La Jolla, CA, USA). Data are presented as mean
In this study, animals were maintained until 30 or 60 days post-induction. EAE
progression was evaluated by clinical scores as described [21, 26]. The results
are presented in Fig. 1. Similar to our previous reports, the initial signs of
paralysis were observed around day 10. The average clinical score of the 30-day
group study was 3.57
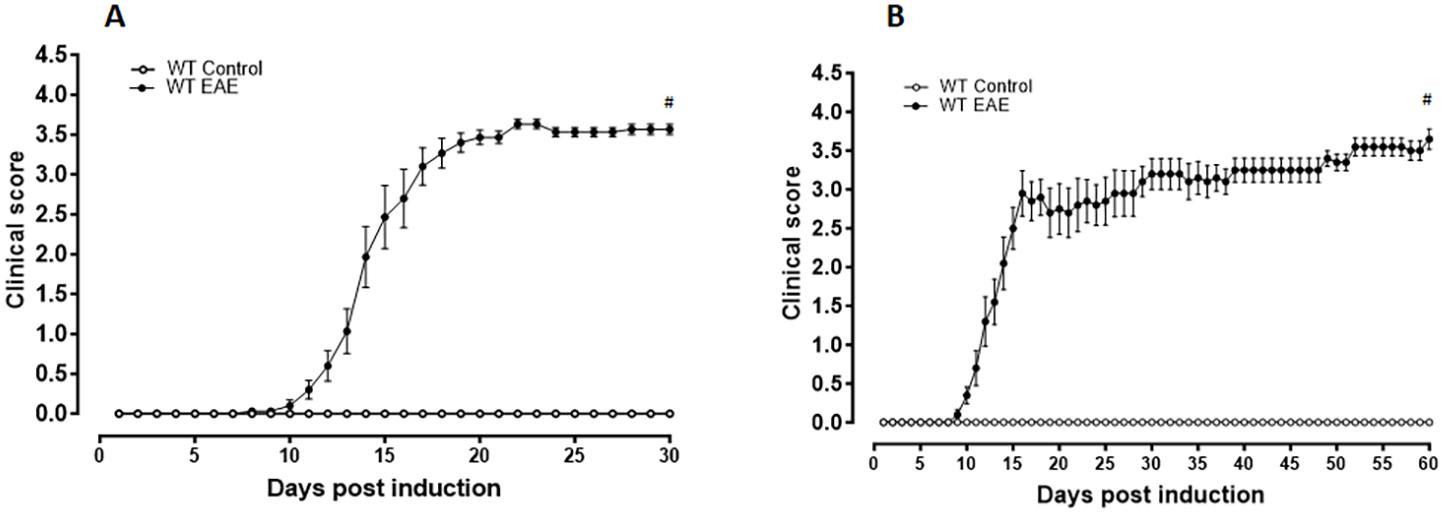 Fig. 1.
Clinical scores of the mice. Animals were evaluated every day,
and the clinical scores were recorded according to a 0–5 scale until 30 days (A)
or 60 days (B) following EAE induction. The mice in the vehicle-treated
EAE group showed progressively increasing clinical scores starting at day 9
post-induction. N varied from 10–15 per group, #p
The number of cells in GCL per retinal section was calculated for both control
and EAE groups at the two time points (30 days and 60 days post-induction)
studied. As depicted in Fig. 2, following 30 day EAE, there was a decrease in the
number of cells in the GCL of the EAE retina, compared to those in the control
groups. Quantification studies demonstrated the reduction is statistically
significant in the EAE group compared to the control (p
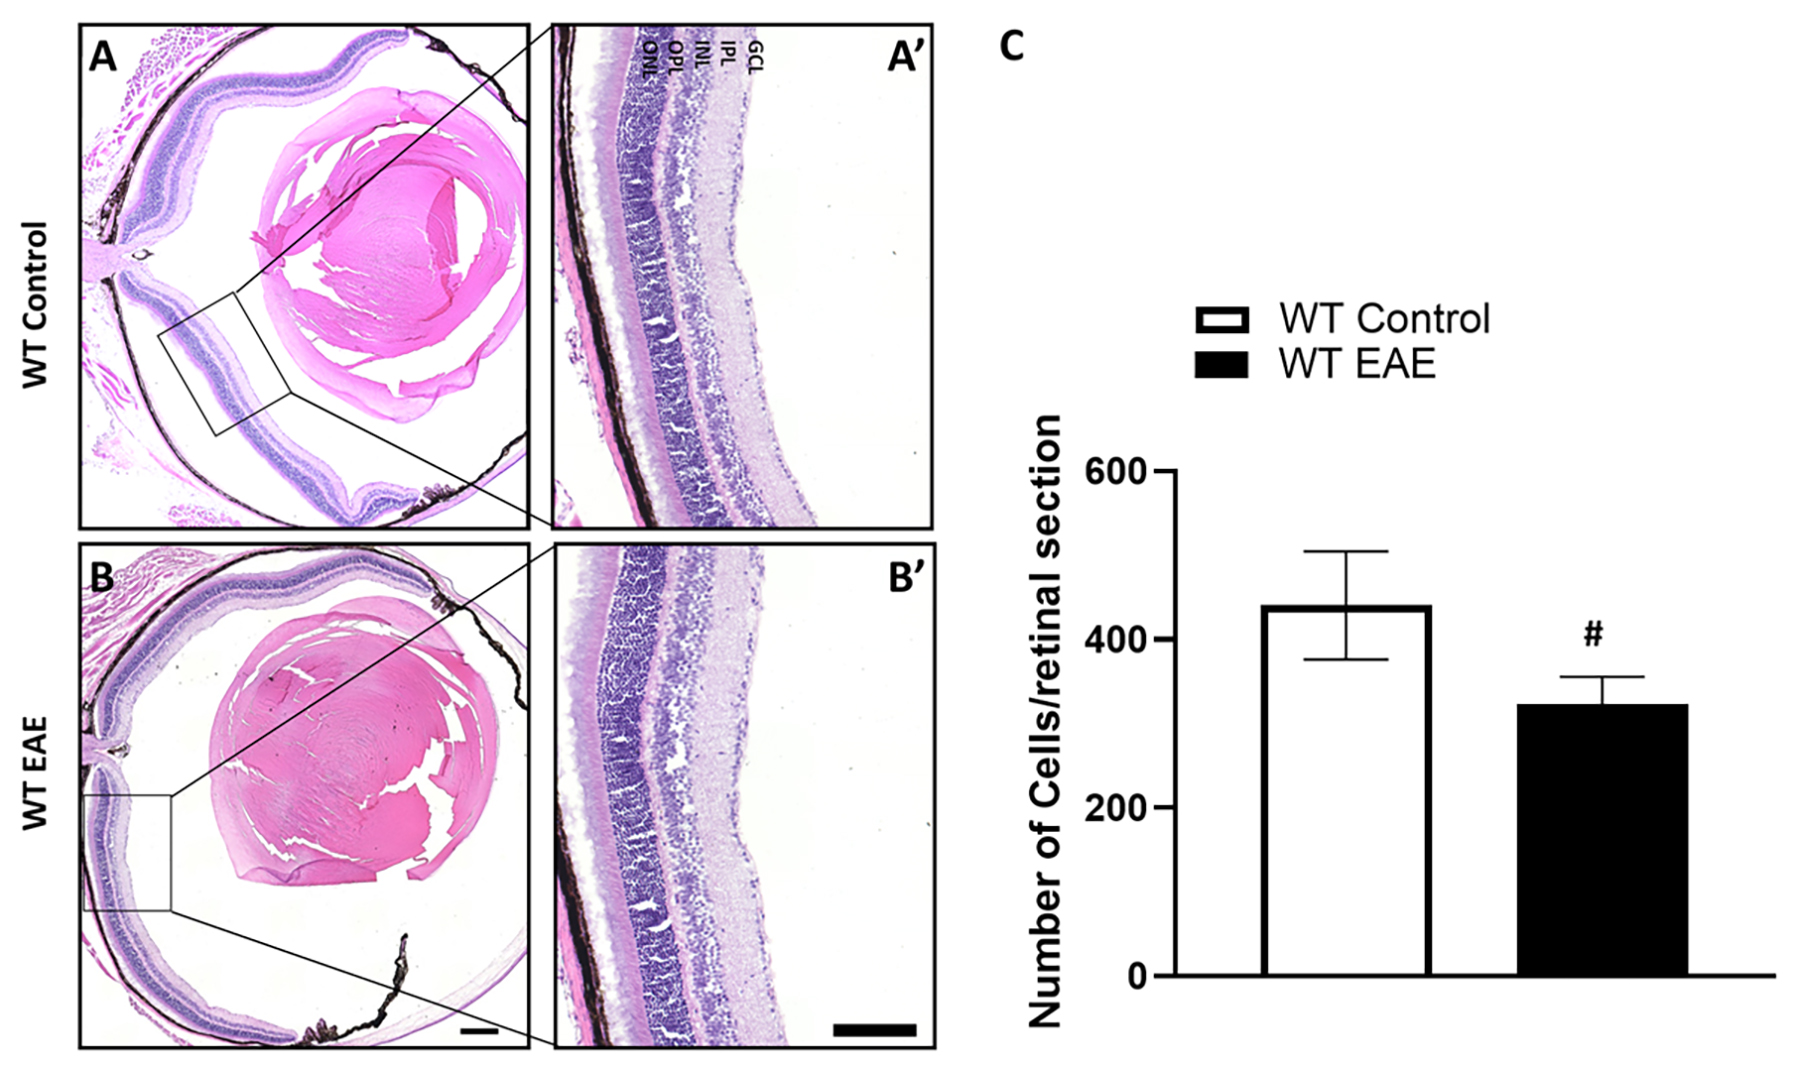 Fig. 2.
Loss of cells in the GCL of EAE retina following 30 days
post-induction. Representative images of control and EAE retina sections used
for cell counting (A,B) and enlarged areas (A’,B’) show a loss of cells in the
ganglion cell layer of the EAE retina compared to the control. Scale bar 500
µm in (B), and 250 µm in (B’). GCL, ganglion cell
layer; IPL, inner plexiform layer; INL, inner nuclear layer; OPL, outer plexiform
layer; ONL, outer nuclear layer. (C) Analysis of cell counts in control and EAE
retinas show a significant decrease in the EAE group following 30 days
post-treatment. Data presented as mean
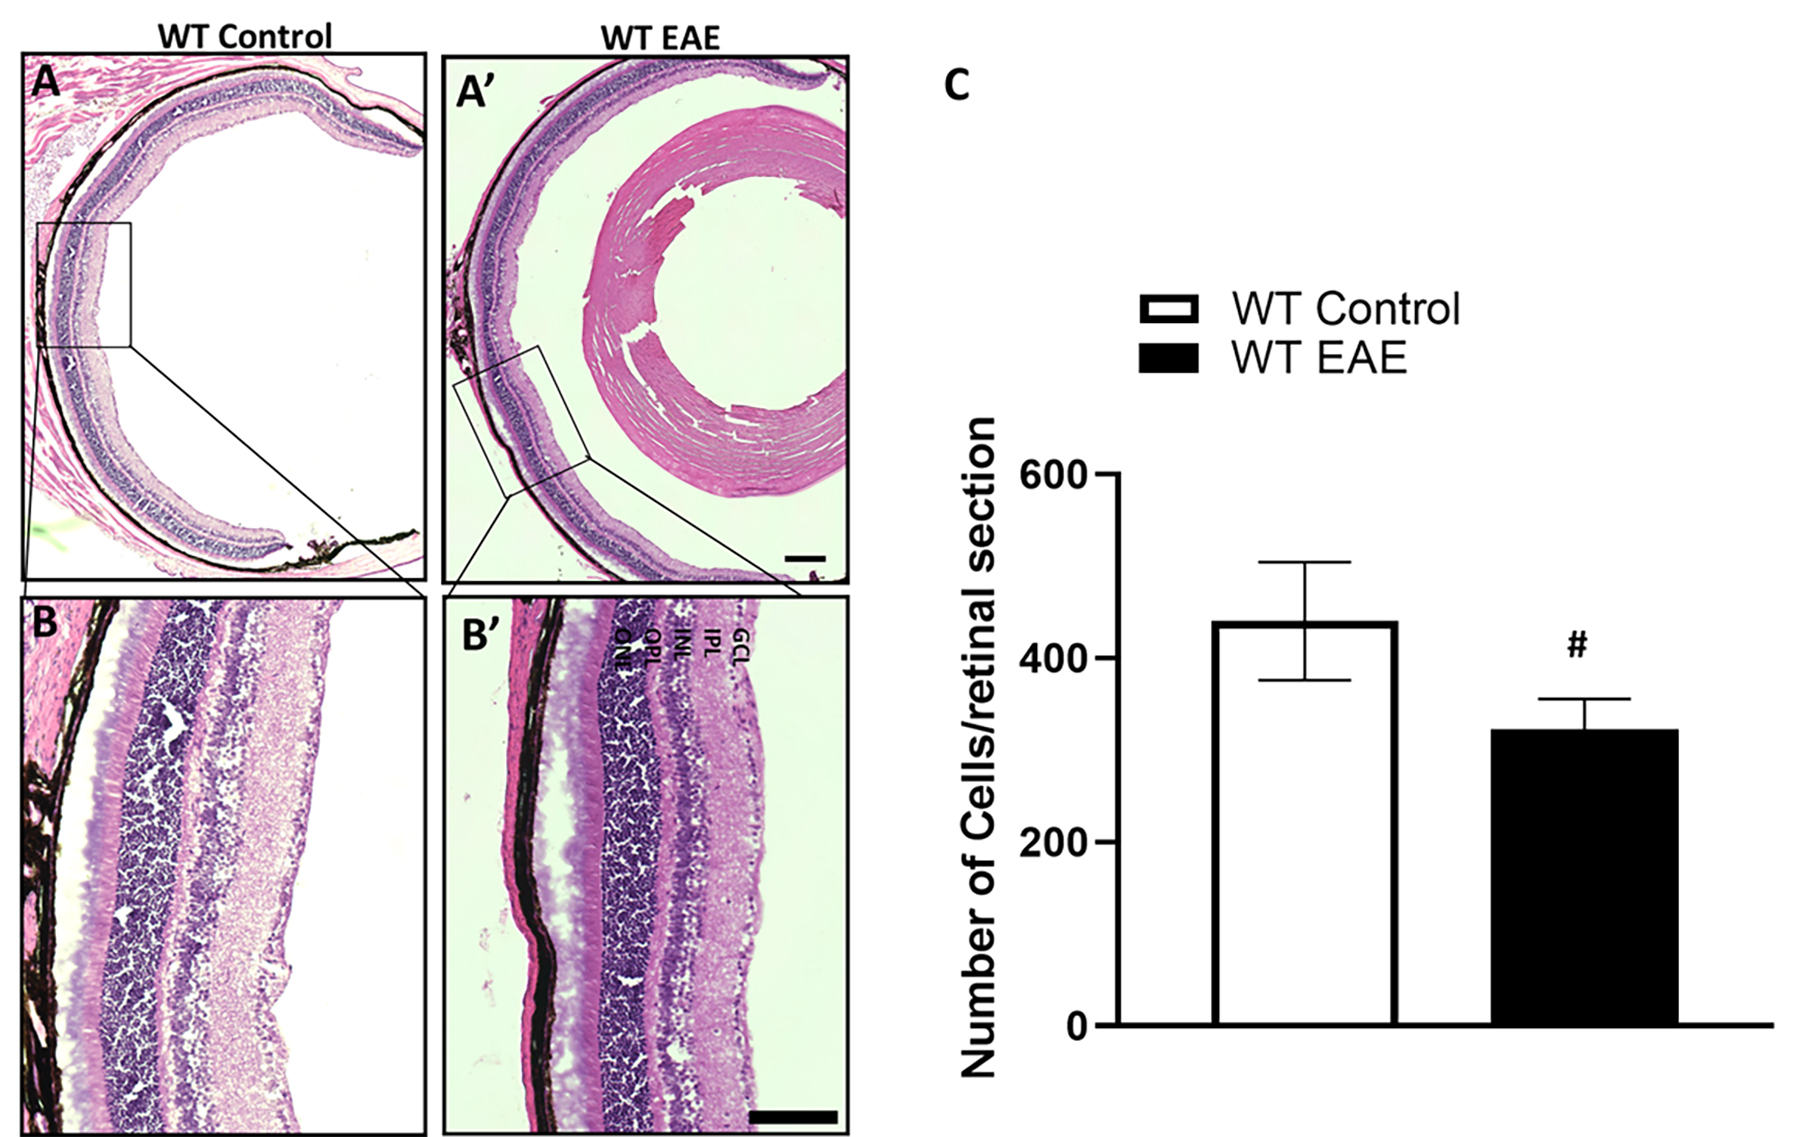 Fig. 3.
Loss of cells in the GCL of EAE retina following 60 days
post-induction. Representative images of control and EAE retina (60 days
post-induction) sections used for cell counting (A,B). Enlarged areas (A’,B’)
show cells in the ganglion cell layer. Scale bar 500 µm in (B), and
250 µm in (B’). GCL, ganglion cell layer; IPL, inner plexiform
layer; INL, inner nuclear layer; OPL, outer plexiform layer; ONL, outer nuclear
layer. (C) Analysis of cell counts in control and EAE retinas show a significant
decrease in the EAE group following 60 days post-treatment. Data presented as
mean
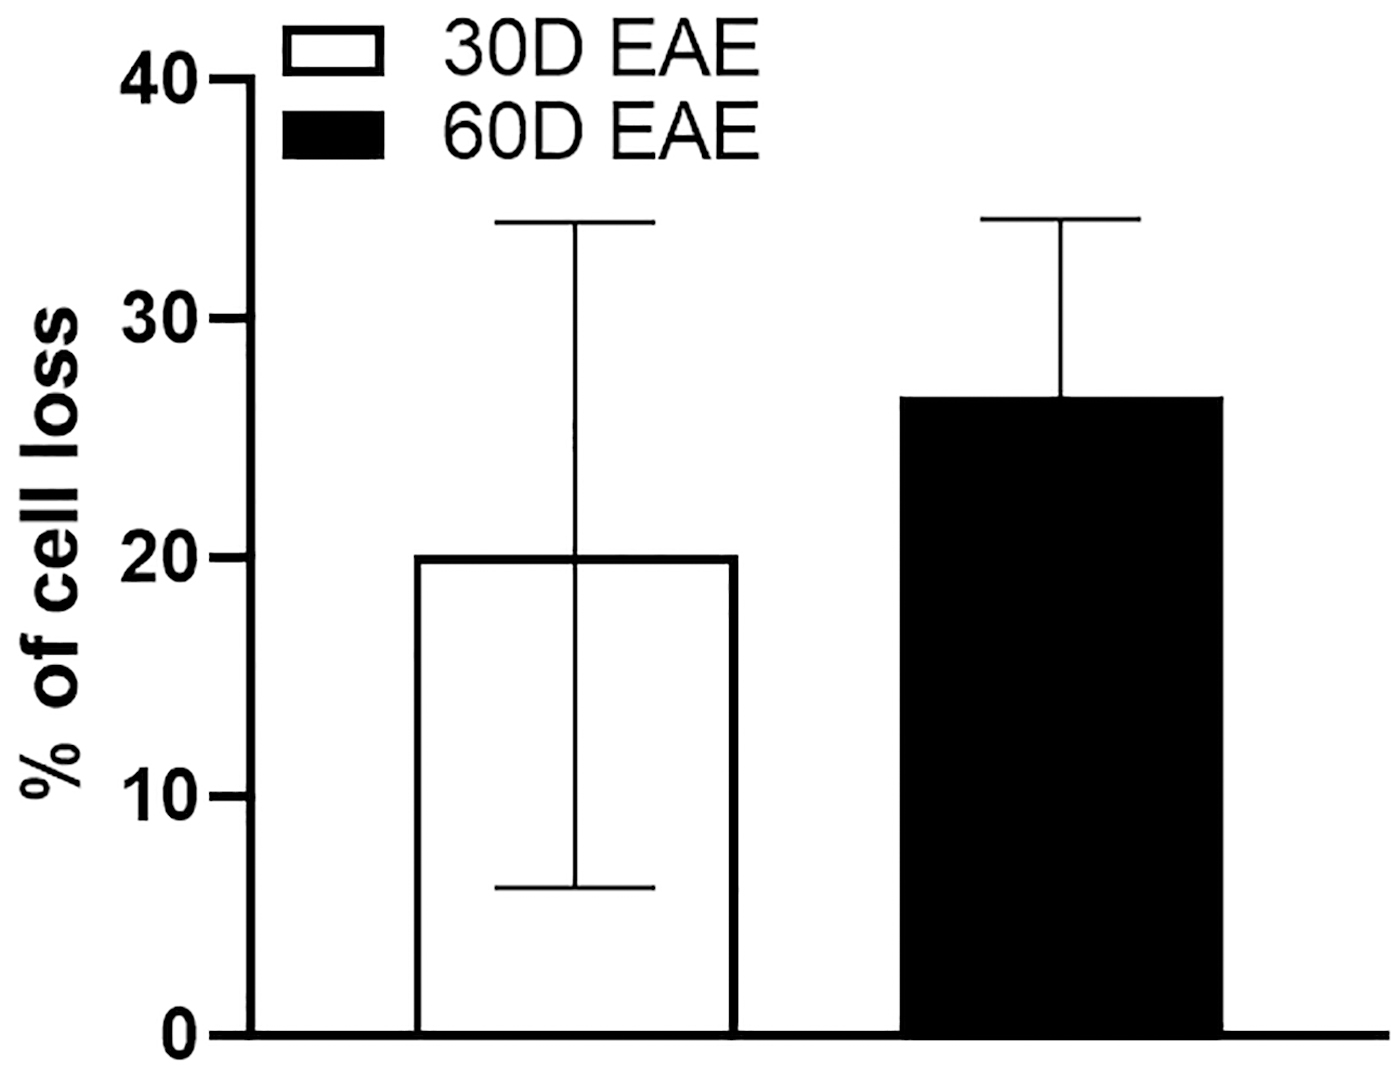 Fig. 4.
Comparison of cell loss in GCL of the EAE retina following 30
and 60 days post-induction. Bar graph showing the percentage loss of cells in
EAE retinas at 30 and 60 days compared to their respective control groups.
Results presented as mean
We next investigated the changes in retinal layer thickness. Fig. 5 shows the
difference in retinal and individual layer thicknesses between the EAE and
control groups at two time points. Analyses of the thickness measurements showed
a reduction in total thickness in the EAE retina (Fig. 5) at both time points
studied. As presented in Fig. 5, following 30-day EAE, there was a significant
reduction in total retinal thickness in the EAE mice compared to the control
group. Further, there was a significant decrease in the retinal nerve fiber layer
(RNFL) and inner nuclear layer (INL) layer in EAE retina (p
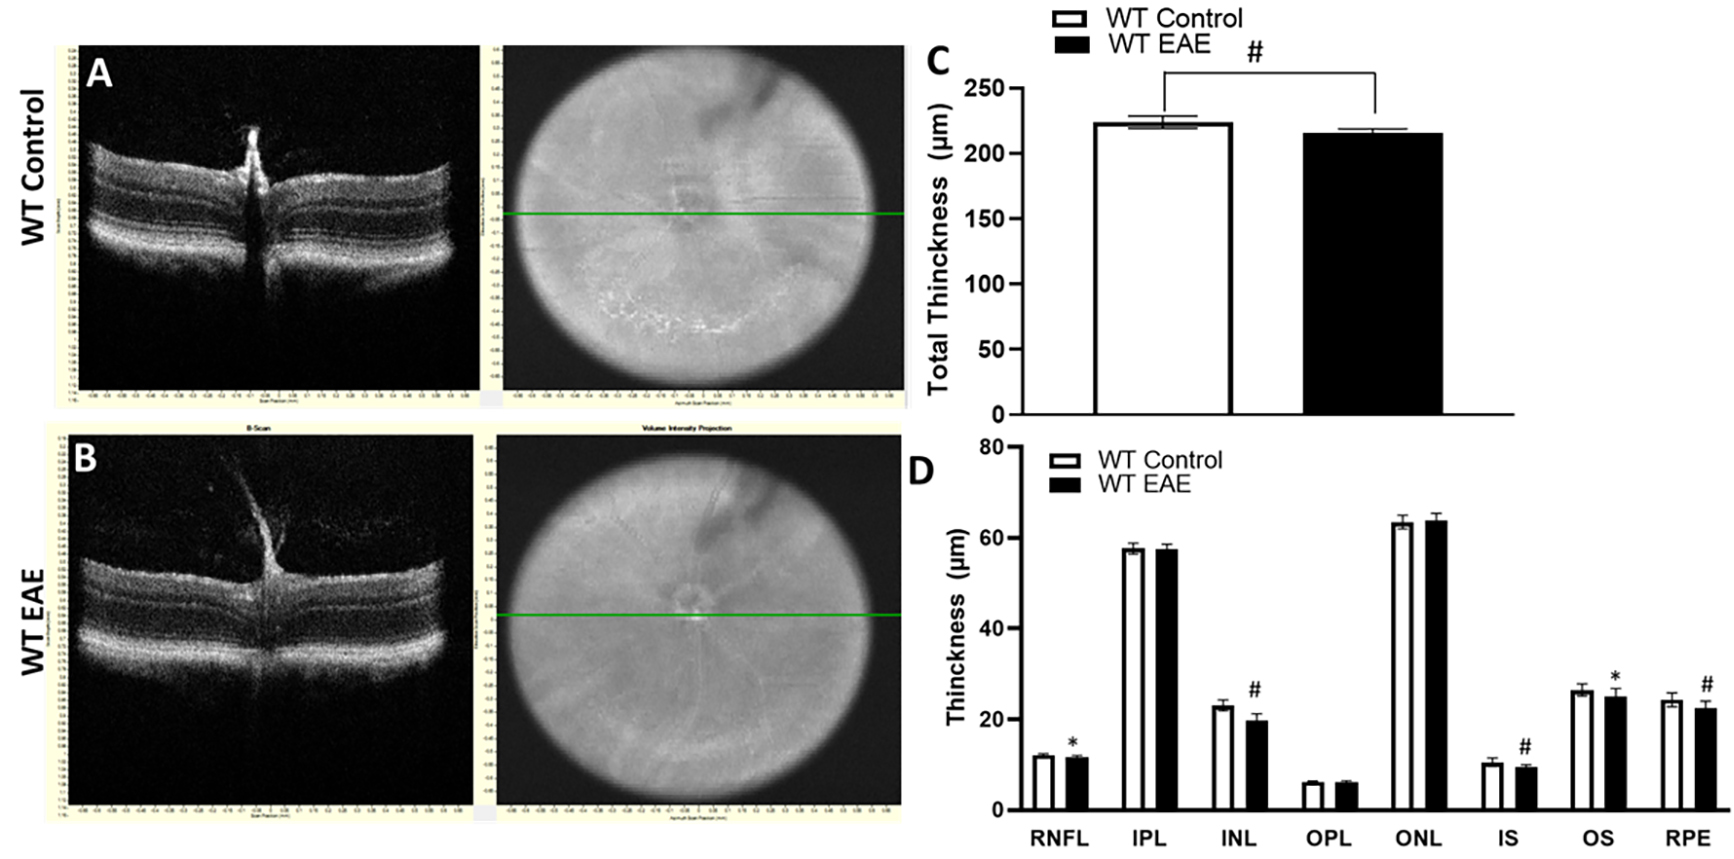 Fig. 5.
Changes in the thickness of retinal layers in EAE mice following 30 days post-induction. (A,B) Representative SD-OCT B-scan
images of from control and EAE mice at 30 days post induction. (C,D) Quantitative
analysis showing changes in the thickness of total retina and different retinal
layers in WT EAE compared to WT controls. Results are presented as mean
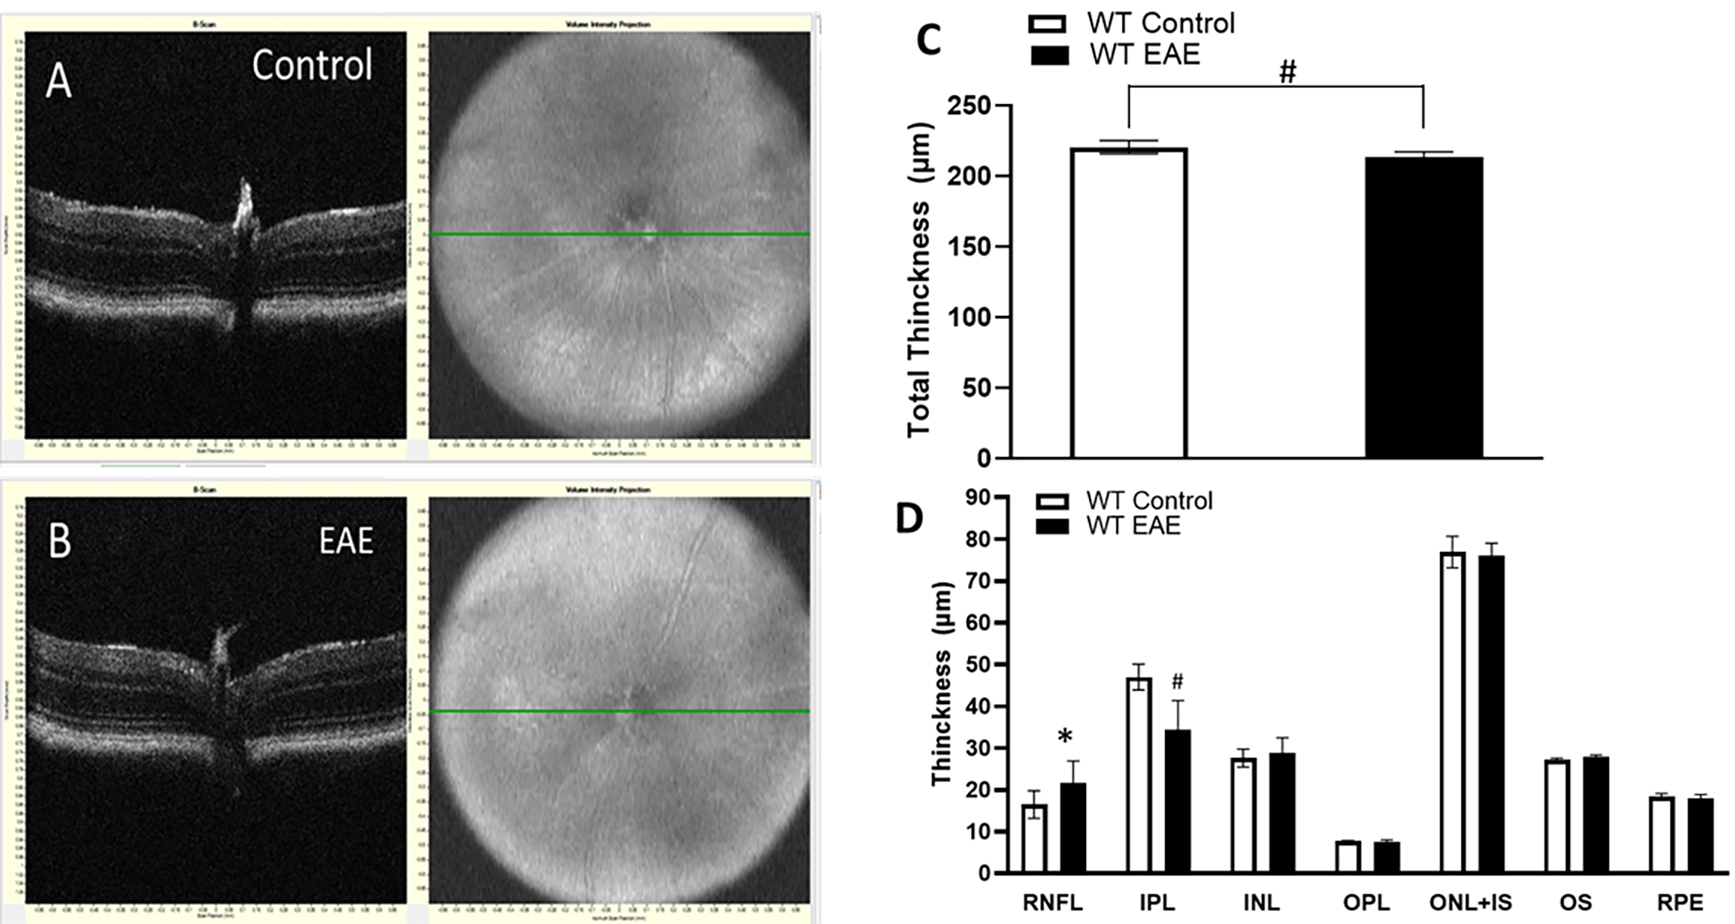 Fig. 6.
Changes in the thickness of retinal layers in EAE mice
following 60 days post-induction. (A,B) Representative SD-OCT B-scan images from
control and EAEmice following 60 days post-induction. (C,D) Quantitative analysis
showing changes in the thickness of the total retina and different retinal layers
in WT EAE compared to WT controls. Results are presented as mean
The present study investigated neurodegenerative changes in the retina using a well-established experimental model of MS. The EAE experimental model shares many similarities with MS pathogenesis, such as inflammation, demyelination, and degeneration of neurons and their axons [12, 30]. While the loss of Retinal Ganglion Cells (RGCs) is well demonstrated in EAE, the possibility of the cell loss on GCL being used as an early indicator of neurodegeneration is not determined yet. The present study investigated the loss of cells in the GCL of the EAE retina at two different time points and compared it to changes in retinal thinning studied by SD-OCT analysis. Our results show that there is significant cell loss in the GCL (compared to their respective controls) at both time points studied. However, the difference in cell loss between the two time points in the EAE retina was not significant, suggesting that neuronal loss in GCL is early and could be an indicator of neurodegeneration in MS.
A major goal of MS research is to reduce the disability progression in patients. While the currently available treatments help manage the symptoms and reduce relapses, they may not be sufficient enough to prevent the long-term disability resulting from demyelination and axonal damages. Different pathogenic mechanisms could be associated with demyelination and axonal damage in MS, including immune cell activation, astrogliosis, altered release of cytokines and reactive oxygen species, and mitochondrial dysfunction [31, 32]. While inflammation and neuronal damage exist in all stages of the disease, the underlying mechanisms of neurodegeneration are not completely understood. Various theories exist in the field to explain the cause of neurodegeneration. One such theory is that MS-associated tissue damage is driven by inflammatory changes, indicating that the inflammation is a cause of neuronal damage. Another existing theory is that inflammation in MS is secondary to neurodegeneration, suggesting that neurodegeneration could be the primary and leading event in MS. A third theory states that neurodegeneration and inflammation are independent events in MS pathology [33]. These mechanisms could be presented in combination as a result of multiple molecular events, and hence, future therapies that consider a combination of neuroprotective and anti-inflammatory approaches are promising. Understanding how early neuronal damage occurs in MS will provide valuable information toward this goal.
RGCs are neurons that connect the retinal input to the visual processing centers in the central nervous system. Loss of RGCs is demonstrated in MS patient samples and in EAE retinas [21, 25, 26, 34, 35]. In the present study, we observed the loss of cells in the GCL at both 30 days and 60 days post-EAE induction. Studies from our lab have previously shown the degeneration of RGCs following 30 and 60 days of post EAE [21, 26]. The neuronal loss observed suggests that the loss of cells in the GCL is an indication of neurodegenerative changes in MS. While there was significant cell loss in the GCL of the EAE retina at both 30 and 60 days, the percent cell loss between the two time points was not significant. This data suggests that the neuronal damage is an early event in the EAE retina. In the current study, we have not investigated the number of cells before 30 days. It would be very helpful to study at earlier time points when the disease symptoms begin (around 10 days post-induction) and when the disease score reaches the peak (around day16–18 post-induction) and determine if there is a correlation between clinical scores and loss of cells in GCL. However, since the degeneration of neurons is a slow and progressive process, the early changes may not be evident at these time points. Studies using therapeutic interventions will further provide useful information in this study.
In this study, there was a significant decrease in the thickness of the total retina, RNFL, and INL following 30 days of EAE. Similar results were reported by other laboratories [29, 36, 37]. These results further support the early neurodegeneration in EAE. Retinal thinning results confirm the loss of neurons in the retina. However, following 60 days of EAE, while the retinal thinning continued, a significant reduction was observed in IPL, and the thickness of RFNL and INL was observed to increase. The reduction in IPL suggests the loss of synapses resulting from the degeneration of neurons in GCL and INL. RGCs connect to the interneurons located in the inner nuclear layer through their synapses. These synaptic connections are localized at the inner plexiform layer. The increased thickness in RNFL and INL could result from the inflammation followed by neuronal death in these layers. The decrease in the thickness of the RNFL at 30-day EAE supports the results from the cell counts as the RNFL includes the ganglion cell layer, which contains the RGCs. In contrast, there was a significant increase in the thickness of the RNFL at the later stage of EAE, but this may be due to the increased inflammation and presence of inflammatory cells.
In the future, this study can be furthered by performing a neuroprotection
approach employing targets and inhibitors using specific neuronal markers and
cell death. Utilizing the same mouse model of MS, a previous study from our
laboratory investigated EAE-induced retinal ganglion cell loss and inflammation
of the optic nerve following a 30-day treatment period [26]. Our results
indicated a significant loss of RGCs following 30 days of EAE induction. This was
accompanied by reduced synaptophysin (a pre-synaptic marker) level and decreased
visual acuity in EAE mice. Studies using inflammatory markers demonstrated an
upregulation in microglia/macrophages in the optic nerves of EAE mice. While
oxidative stress is known as a major mediator of MS pathology, our data indicated
elevated levels of conjugated acrolein in the EAE retina. Our results showed that
treatment with N,N
Preclinical studies are essential for understanding the disease pathogenesis and molecular mechanisms, thus developing new therapies for MS. Neurodegeneration is considered an early event happening in MS. Our results indicate evidence of early neurodegenerative changes in the retina of the experimental model of MS. Counting the number of cells on the retinal ganglion cell layer is suggested as a measure of neurodegeneration, and this can be used for testing the effect of drugs for MS in preclinical studies. Our results support the need for early intervention approaches in MS patients focusing on neuroprotection. Further studies should be conducted to understand how early neurodegenerative changes are occurring in MS.
Data sharing is not applicable as no data were generated or analyzed.
SPN designed the research study. NS and FL performed the research, prepared figures, and analyzed the data. NS and SPN wrote the manuscript. All authors contributed to editorial changes in the manuscript. All authors read and approved the final manuscript. All authors have participated sufficiently in the work and agreed to be accountable for all aspects of the work.
The study protocols used were approved by the Institutional Animal Care and Use Committee of Augusta University, Augusta, GA, USA (2016-0823).
The authors thank the histology core at Augusta University for their excellent technical support in preparing retinal sections. This work has been accomplished partially using the resources and facilities at the Charlie Norwood VA Medical Center, Augusta, GA, USA, and a core grant from the NIH/NEI to the Augusta University Vision Discovery Institute (P30EY031631). The funders had no role in the study design, data collection, analysis, and decision to publish the data. The contents of the manuscript do not represent the views of the Department of Veteran Affairs or the United States Government.
This research was funded by the University of Georgia College of Pharmacy Intramural funds.
The authors declare no conflict of interest.
References
Publisher’s Note: IMR Press stays neutral with regard to jurisdictional claims in published maps and institutional affiliations.