1. Introduction
Subjective cognitive decline (SCD) is often one of the earliest symptoms of
Alzheimer’s disease (AD) [1, 2], in which individuals report experiencing
cognitive decline but still achieve normal results in objective
neuropsychological assessments [3]. Increasingly recognized as a crucial early
sign of the pathological processes underlying AD, this condition underscores the
importance of early detection and intervention strategies to potentially alter
the disease’s trajectory.
In the context of genetic influences on AD, Apolipoprotein E4
(APOE4) has been identified as a significant risk factor
[4]. Its impact, especially on individuals with SCD, has become a focal point of
recent research [5]. Studies indicate that the APOE4 allele
might accelerate cognitive decline in these individuals [6], yet the intricate
mechanisms underlying these effects, particularly in the context of structural
brain networks, remain unclear. This study aims to delve into the influence of
APOE4 on SCD, building on the findings of Lee et
al. [7], who observed specific changes in the fractional anisotropy (FA) values
in certain brain regions of SCD individuals carrying the
APOE4 allele.
Diffusion-tensor imaging (DTI) is instrumental in this research, offering a
window into the microstructural integrity of brain tissues by analyzing water
molecule diffusion patterns. DTI’s role in AD studies has been pivotal,
particularly in detecting early microstructural neuronal changes that precede
more significant atrophic developments [8, 9]. Extensive quantitative DTI studies
have reported various findings in individuals with SCD, ranging from significant
alterations in FA and mean diffusivity (MD) in critical brain regions like the
hippocampus and entorhinal cortex to contradictory results showing no statistical
differences in dispersion parameters [10, 11, 12, 13, 14, 15, 16].
However, these studies primarily focused on quantifying DTI parameter
differences without a broader investigation into the structural network. Building
on the work of Shu et al. [17], who reported changes in global and local
efficiency in the structural networks of SCD individuals, and Yan et al.
[18], who found reduced efficiency and increased shortest path length in certain
brain regions, our study aims to further investigate these aspects. Specifically,
we seek to understand the potential impact of the APOE4
allele on the structural network of individuals with SCD.
To achieve this, we analyzed data from 36 individuals without SCD and
APOE4 (healthy control, HC group) and 54 individuals with
SCD from the Alzheimer’s Disease Neuroimaging Initiative (ADNI) database,
including 21 individuals with SCD carrying APOE4
(APOE4+ group) and 33 individuals with SCD but without
APOE4 (APOE4- group). The study employs an
FA-based deterministic fiber tracking method and graph theory analysis to explore
the white matter structural network and its characteristics across these groups,
focusing on discerning the role of the APOE4 allele in
modulating structural network attributes in SCD.
2. Methods
2.1 Study Subjects
All raw data used in this study were from the ADNI. The ADNI is
a multi-center study originated by Michael W. Weiner in 2004 for the early
detection, tracking, treatment, and prevention of AD. The baseline data,
neuropsychological assessment, cerebrospinal fluid biomarkers, APOE genotyping
information, and Magnetic Resonance Imaging (MRI) data were collected for each
study subject. The ADNI passed a review by the Institutional Review Board (IRB),
and all subjects provided written informed consent and unified inclusion criteria
(https://adni.loni.usc.edu/). We obtained the approval of our local ethics review
committee (Dongguan Eighth People’s Hospital medical ethics committee
AF/SC-15/01.0) before the analysis began. To investigate the impact of
APOE4, this study enrolled 36 individuals in the HC group. Additionally, 21 individuals in the APOE4+ group,
characterized by carrying at least one 4 allele (i.e.,
4/4, 4/3), and 33 individuals in
the APOE4- group, comprising those with other alleles (i.e.,
2/2, 2/3,
3/3), were included. Individuals with
2/4 were excluded due to the potential for confounding
effects [19]. Including the HC group as a control provides a baseline for clearer
observation of the role of APOE4 alleles in SCD.
The following diagnostic criteria [3] were used for individuals with SCD: (1)
the patient complained of memory deterioration, without memory decline or
impairment as indicated by the caregiver; (2) Mini-Mental State Examination
(MMSE) score: 24 to 30; and (3) Clinical Dementia Rating Scale (CDR) score: 0.
The inclusion criteria for the HC group were as follows: (1) no memory decline or
impairment indicated by the individuals or caregivers; and (2) normal MMSE and
CDR scores, with identical score criteria to individuals with SCD. The
demographic characteristics and neuropsychological data included sex, age,
education level, and MMSE. The cerebrospinal fluid (CSF) biomarkers included
total tau (t-tau), phosphorylated tau (p-tau), and
-amyloid protein 1–42 (A). The cerebrospinal fluid
data were available for all subjects.
2.2 Image Acquisition and Preprocessing
Both structural MRI and DTI data were available in all included subjects. The
subjects were scanned by a 3.0 T MRI (Prisma_fit, Siemens, Munich, Germany) scanner. Structural MRI images were obtained by 3D
Magnetization-Prepared Rapid Gradient-Echo (MPRAGE) T1 weighted sequence and the
following scanning parameters: acquisition plane: sagittal; acquisition type: 3D;
coil: posterior-anterior (PA); field strength: 3.0 T; flip angle: 9.0 degrees;
matrix X: 240.0 pixels; matrix Y: 256.0 pixels; matrix Z: 176.0; pixel spacing X:
1.1 mm; pixel spacing Y: 1.1 mm; pulse sequence: gradient recovery/inversion
recovery (GR/IR); slice thickness: 1.2 mm; echo time (TE): 3.0 ms; inversion time
(TI): 900.0 ms; repetition time (TR): 2300.0 ms; weighting: T1. DTI image data
were obtained by echo-planar imaging (EPI) sequence and the following scanning
parameters: acquisition type: 2D; field strength: 3.0 T; flip angle; 90.0
degrees; gradient directions: 54.0; matrix X: 1044.0 pixels; matrix Y: 1044.0
pixels; matrix Z: 55.0; 7 b = 0 s/mm + 48 b = 1000 s/mm = 55 volumes,
7 images with b = 0 s/mm and 48 gradient directions with b = 1000
s/mm; pixel size X: 2.0 mm; pixel size Y: 2.0 mm; pulse sequence: echo
planar (EP); slices: 80; slice thickness: 2.0 mm; TE: 56.0 ms; TR: 7200.0 ms.
The preprocessing of DTI data included (1) converting DICOM files into NIfTI
images; (2) using the bet command of FMRIB Software Library (FSL) to estimate the brain mask; (3)
correcting for eddy current and motion artifact by using the flirt command of FSL
to correct the eddy current induced distortion of diffusion weighted images (DWI)
and simple head-motion during scanning by registering the DWI to the b0 image of
first acquisition with an affine transformation, and then, according to the
resultant affine transformations, rotating the gradient direction of each DWI
volume [20]; (4) estimating diffusion tensor and calculating FA by applying the
dtifit command of FSL to calculate diffusion tensor
metrics by solving the Stejskal and Tanner equation [21], including FA; and (5)
normalizing target and smooth by calling the fnirt command of FSL to match the FA
images of native space to the FA template in the Montreal Neurological Institute
(MNI) space, using 6 mm for smoothing. PANDA software (Pipeline for Analysing
Brain Diffusion Images, Beijing Normal University,
http://www.nitrc.org/projects/panda/) [22] was used for preprocessing based on
FMRIB Software Library (FSL 4.1.0, University of Oxford,
https://www.fmrib.ox.ac.uk/fsl/).
2.3 Construction and Analysis of Brain Network
2.3.1 Define Network Nodes
We used the PANDA toolkit (https://www.nitrc.org/projects/panda/) to track white matter fibers in the DTI data with the
fiber assignment by continuous tracking (FACT) algorithm and stipulated that the
tracking would stop when the turned angle was greater than 45 degrees and FA was
less than 0.2 [23]. The anatomical automatic labeling (AAL) 90 atlas [24] was
selected as the brain region template. The whole brain was divided into 90 brain
regions, each as a node of the brain network, and the edge of the brain network
referred to the white matter fiber bundles connected between these nodes. In this
process, the T1-weighted images of individuals were registered to standard space
through non-linear registration using the PANDA toolkit, and the inverse
transformation T was obtained. T was then applied to the selected
atlas to obtain 90 brain regions based on the AAL 90 atlas. Finally, the brain
network with these 90 brain regions as nodes was obtained.
2.3.2 Defining the Edge of the Network
We defined the network edges by a threshold of the fiber bundles. By empirically
setting the threshold for the number of fiber connections (FN) between any two
nodes to 3, we retain only those connections observed in at least 80% of the
participants, which not only reduces false positive connections due to the
limitations of deterministic fiber tracking but also aids in identifying the
largest connected component within the network [25]. The FN and mean FA values of
the connected fibers between two regions were defined as the weights of the
network edges for the weighted networks. For an unweighted network, the edge of
the network was defined as either 1, meaning the number of fiber bundles between
two nodes exceeds a specified threshold and, hence, there is a connection between
the two nodes, or 0, meaning the number of fiber bundles between two nodes is
lower than the specified threshold and, hence, there is no connection between the
two nodes. Deterministic fiber tracking generates three matrices: fiber number,
average length, and average FA.
2.3.3 Topological Properties
Using the FA matrix obtained by PANDA software based on FSL, the topological
properties were calculated by MATLAB-based GRETNA software (The Graph-theoretical
Network Analysis Toolkit, https://www.nitrc.org). The whole-brain network
characteristics were as follows: small-worldness (), global efficiency (Eg),
local efficiency (Eloc), shortest path length (Lp), clustering coefficient (Cp),
normalized Lp (), normalized Cp (), and assortativity. The
intracerebral node characteristics were as follows: nodal local efficiency, nodal
Cp, degree centrality, and betweenness centrality. For the definitions of
topological properties and computations, refer to [26] and the
Supplementary Material.
2.4 Statistical Analysis
SPSS 20.0 software (IBM Corporation, Chicago, IL, USA) was used for
the statistical analysis of demographic data and clinical characteristics. For
continuous variables, one-way analysis of variance (ANOVA) was used first, and
Bonferroni multiple comparison correction was then performed for significantly
different variables. For binary variables, the chi-squared test was conducted,
and Dunn multiple comparison correction was performed for significantly different
variables, and p-values 0.05 were considered statistically
significant. For network properties, the statistical analysis was performed by a
one-way ANOVA F test and two-sample t-test in the Global and Nodal
Metric Comparison module of GRETNA software [27], among the three groups with age
and A as covariates. First, ANOVA was used for the three
groups of data, and then the significant results were analyzed by a two-sample
t-test. The threshold was set to p 0.05. Multiple
comparison correction (Benjamini-Hochberg procedure) was performed.
3. Results
3.1 Demographic Data
The demographic and clinical characteristics of all study subjects are provided
in Table 1, presented as means standard deviation (SD). No significant
difference was observed among the three groups for sex, education level, MMSE,
t-tau, or p-tau. Compared to the APOE4- group (71.98
4.86 years) and HC group (75.03 6.06 years), age was significantly lower
in the APOE4+ group (70.88 5.27 years, p = 0.012).
In CSF biomarkers, the APOE4+ group (1079.09 419.28 pg/mL,
p = 0.012) had lower A than APOE4- group
(1384.98 353.23 pg/mL) and HC group (1338.20 371.46 pg/mL). The
values of A and age, which exhibited significant differences,
were incorporated as covariates.
Table 1.Participant demographics and clinical profiles.
|
HC group (n = 36) |
APOEε4- group (n = 33) |
APOEε4+ group (n = 21) |
F/ |
p-value |
| Age (years) |
75.03 6.06 |
71.98 4.86 |
70.88 5.27 |
4.619 |
0.012 |
| Gender (F/M) |
15/21 |
20/13 |
13/8 |
0.400 |
0.527 |
| Education |
16.72 2.42 |
16.27 2.90 |
16.86 2.15 |
0.419 |
0.659 |
| MMSE |
28.89 1.39 |
28.94 1.14 |
29.00 1.30 |
0.050 |
0.951 |
| A (pg/mL) |
1338.20 371.46 |
1384.98 353.23 |
1079.09 419.28 |
4.630 |
0.012 |
| t-tau (pg/mL) |
221.33 86.64 |
213.90 71.97 |
262.22 107.69 |
2.158 |
0.122 |
| p-tau (pg/mL) |
19.89 8.94 |
18.89 6.76 |
24.63 11.80 |
2.818 |
0.065 |
F, female; M, male; MMSE, Mini Mental State Examination; t-tau, total tau;
p-tau, phosphorylated tau; A,
-amyloid protein 1–42. Data are presented as the mean SD.
p 0.05 indicates a significant difference between the groups.
F value was obtained using the analysis of variance test.
value was obtained using the test. HC,
healthy control; APOE4, Apolipoprotein E4; SD, standard
deviation.
3.2 Whole-Brain Network Characteristics
The was manifested in the network in all three groups (Table 2). The Cp in the
APOE4+ (0.2446 0.4104) and APOE4- groups (0.2502
0.4174) was significantly lower than that in the HC group (0.2758
0.4047) (Fig. 1A; p = 0.008). However, there were no significant
differences in Lp, , , or
among the three groups (Fig. 2). The APOE4+
(0.2835 0.5600) and APOE4- groups (0.2934 0.5499) had
considerably lower Eloc than the HC group (0.3272 0.5306) (Fig. 1B;
p = 0.006). There were no differences among the groups in Eg, hierarchy,
assortativity, or synchronization (Fig. 3).
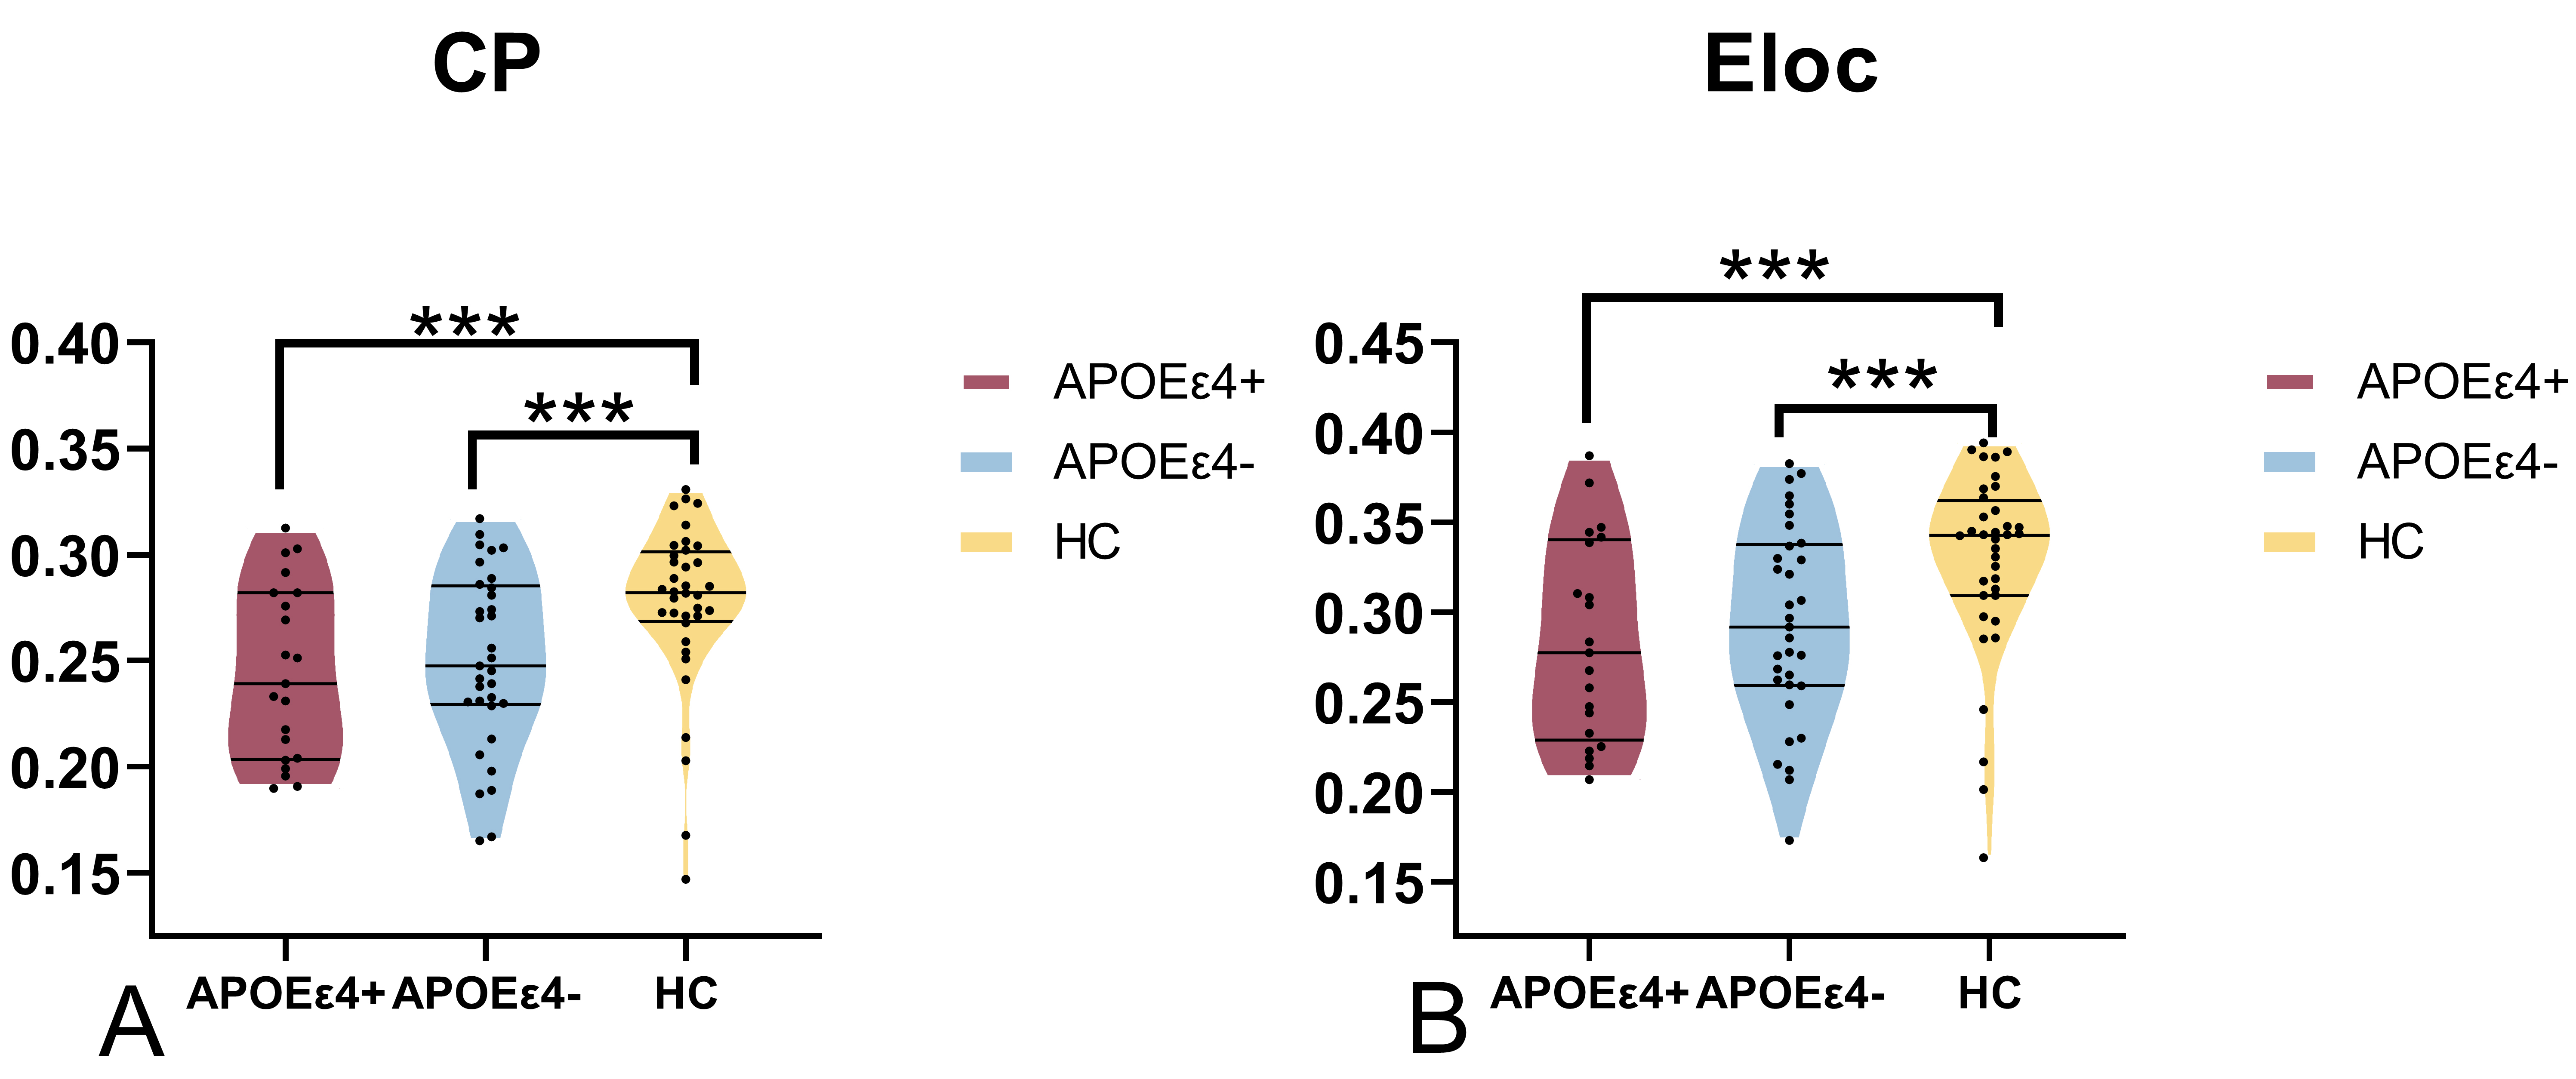 Fig. 1.
Significant differences in Cp and Eloc between groups. (A) The
clustering coefficient (Cp) was significantly decreased in the APOE4-
and APOE4+ groups compared the HC group (p 0.05). (B)
The local efficiency (Eloc) was significantly decreased in the APOE4-
and APOE4+ groups compared to the HC group (p 0.05). The
“***” symbol denotes statistical significance.
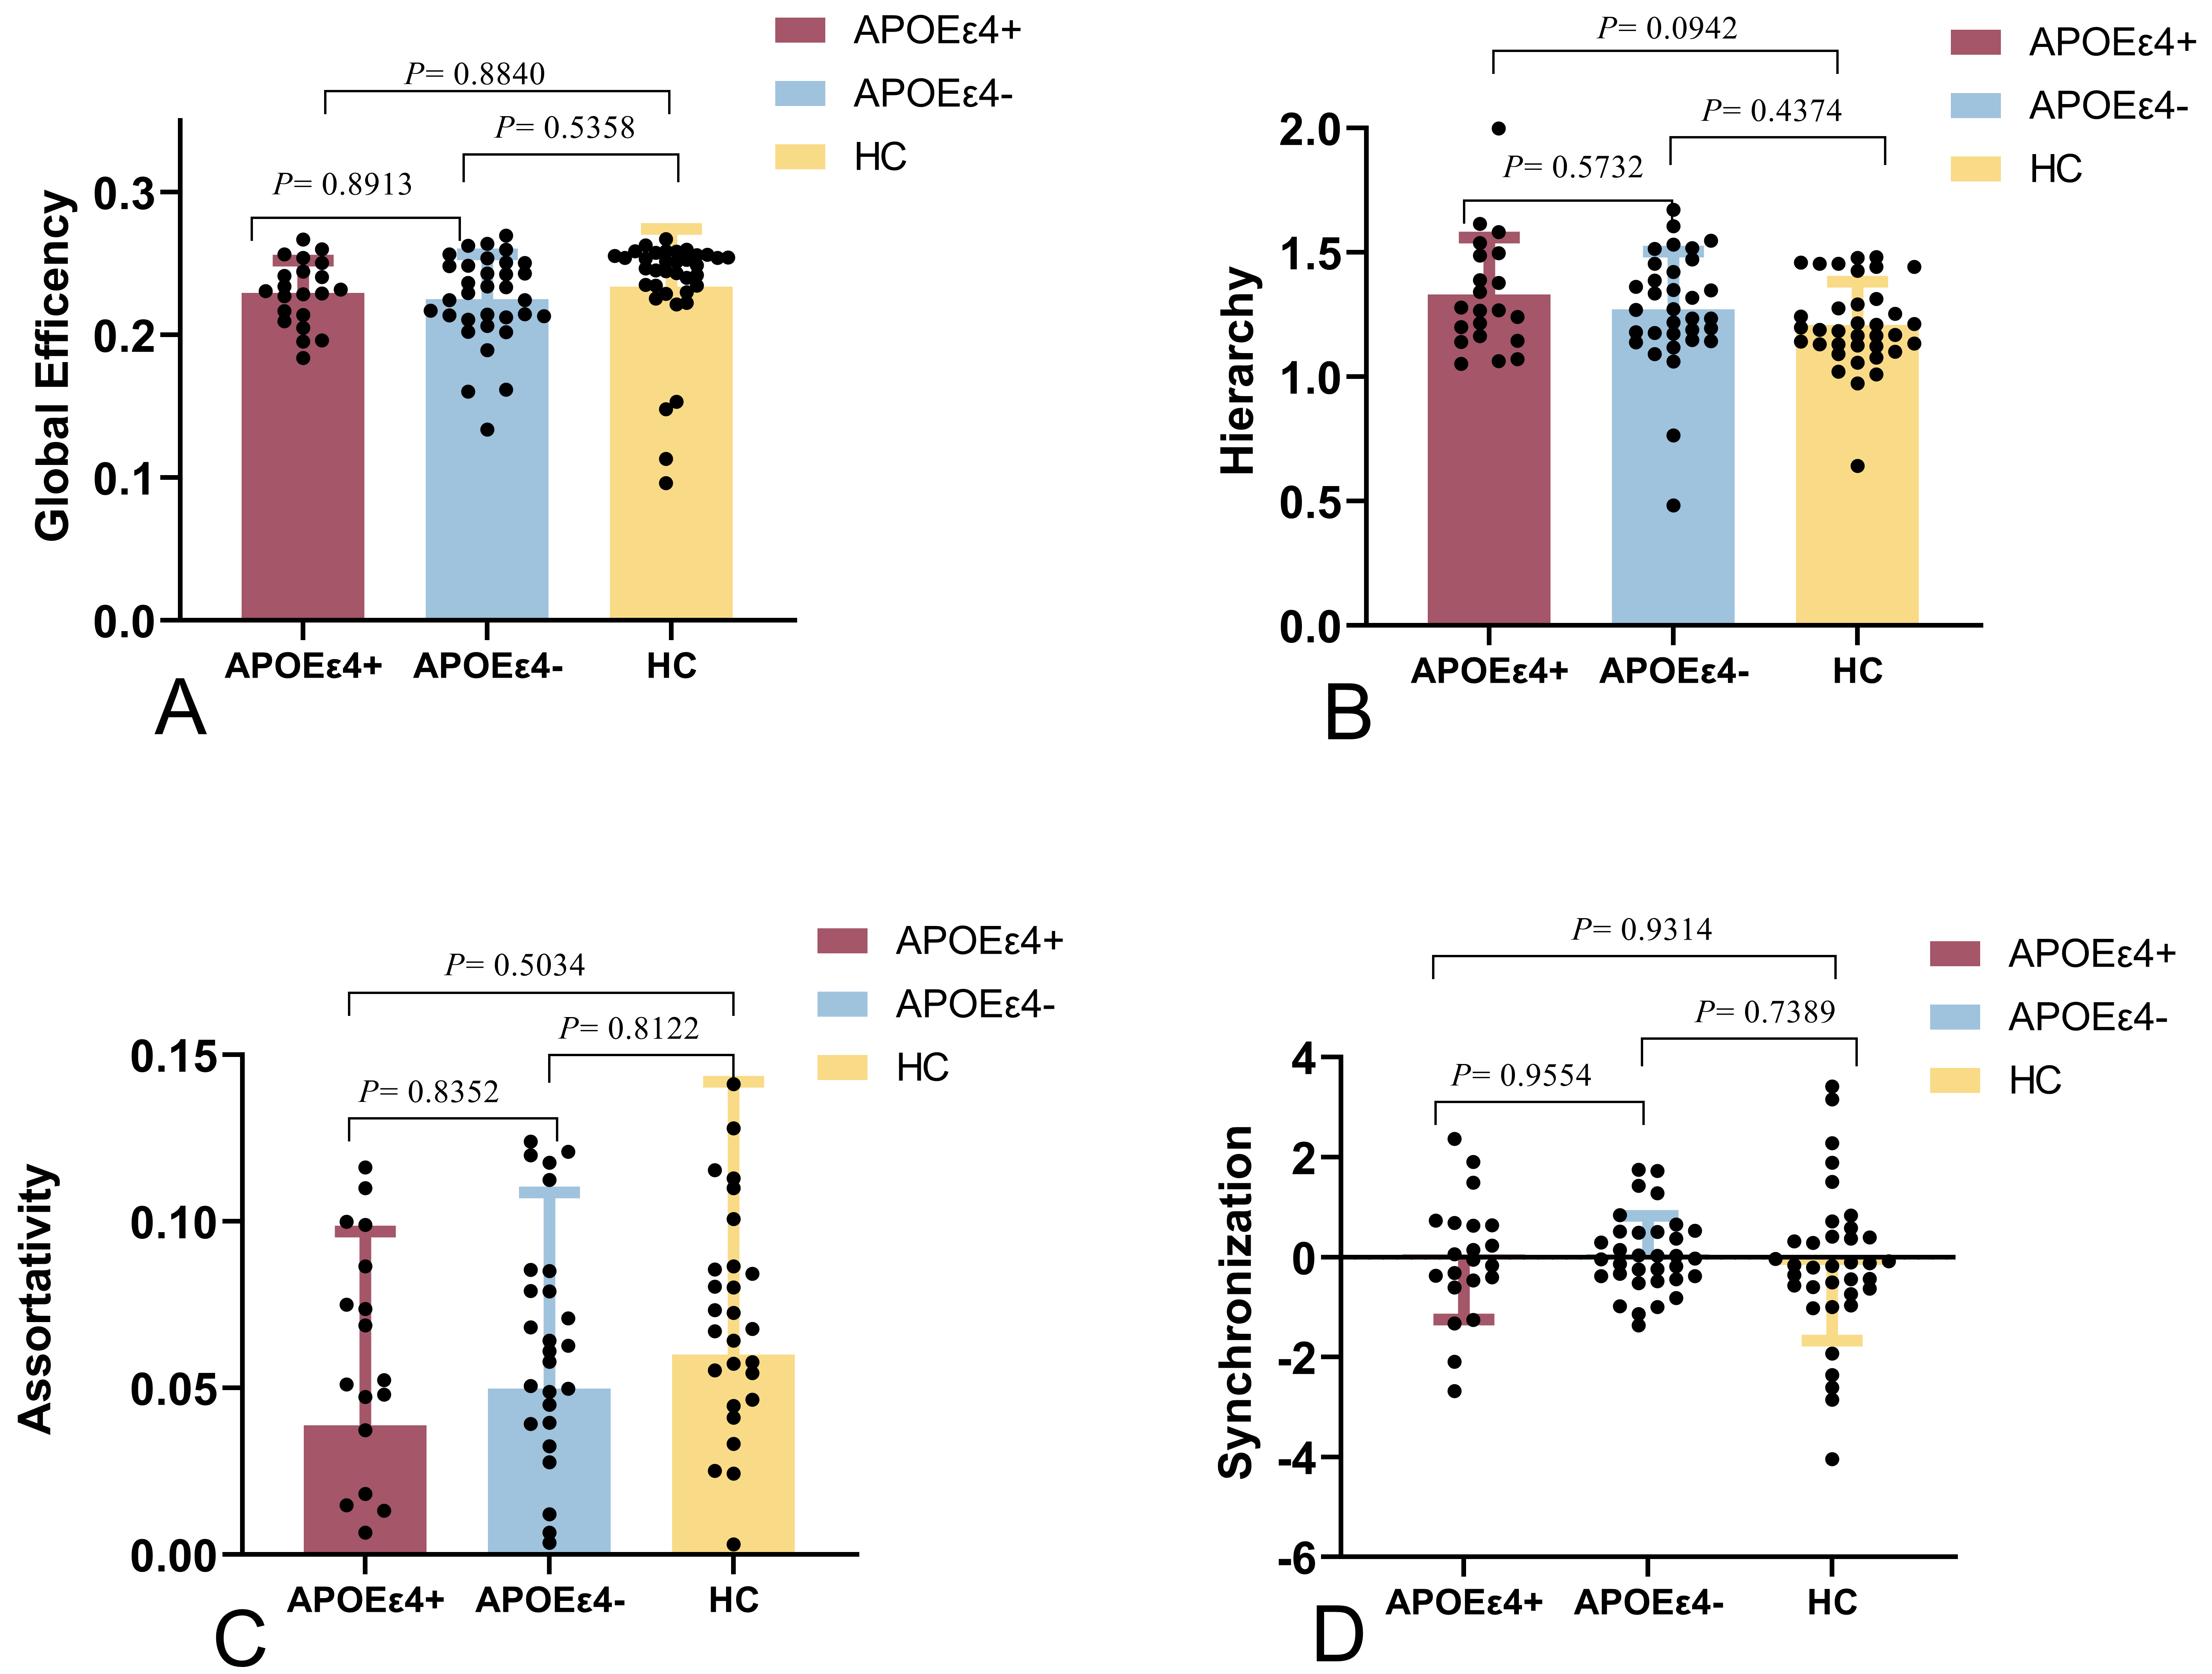 Fig. 2.
The global metrics of the brain connectome between the
APOE4+, APOE4-, and HC groups. There were no significant
differences among the three groups. (A) The global efficiencies of the
APOE4- and APOE4+ groups were not significantly different
compared to that of the HC group (p ˃ 0.05). (B) The hierarchies of the
APOE4- and APOE4+ groups were not significantly different
compared to that of the HC group (p ˃ 0.05). (C) The assortativity
values of the APOE4- and APOE4+ groups were not
significantly different compared to that of the HC group (p ˃ 0.05). (D)
The synchronization results of the APOE4- and APOE4+
groups were not significantly different compared to that of the HC group
(p ˃ 0.05).
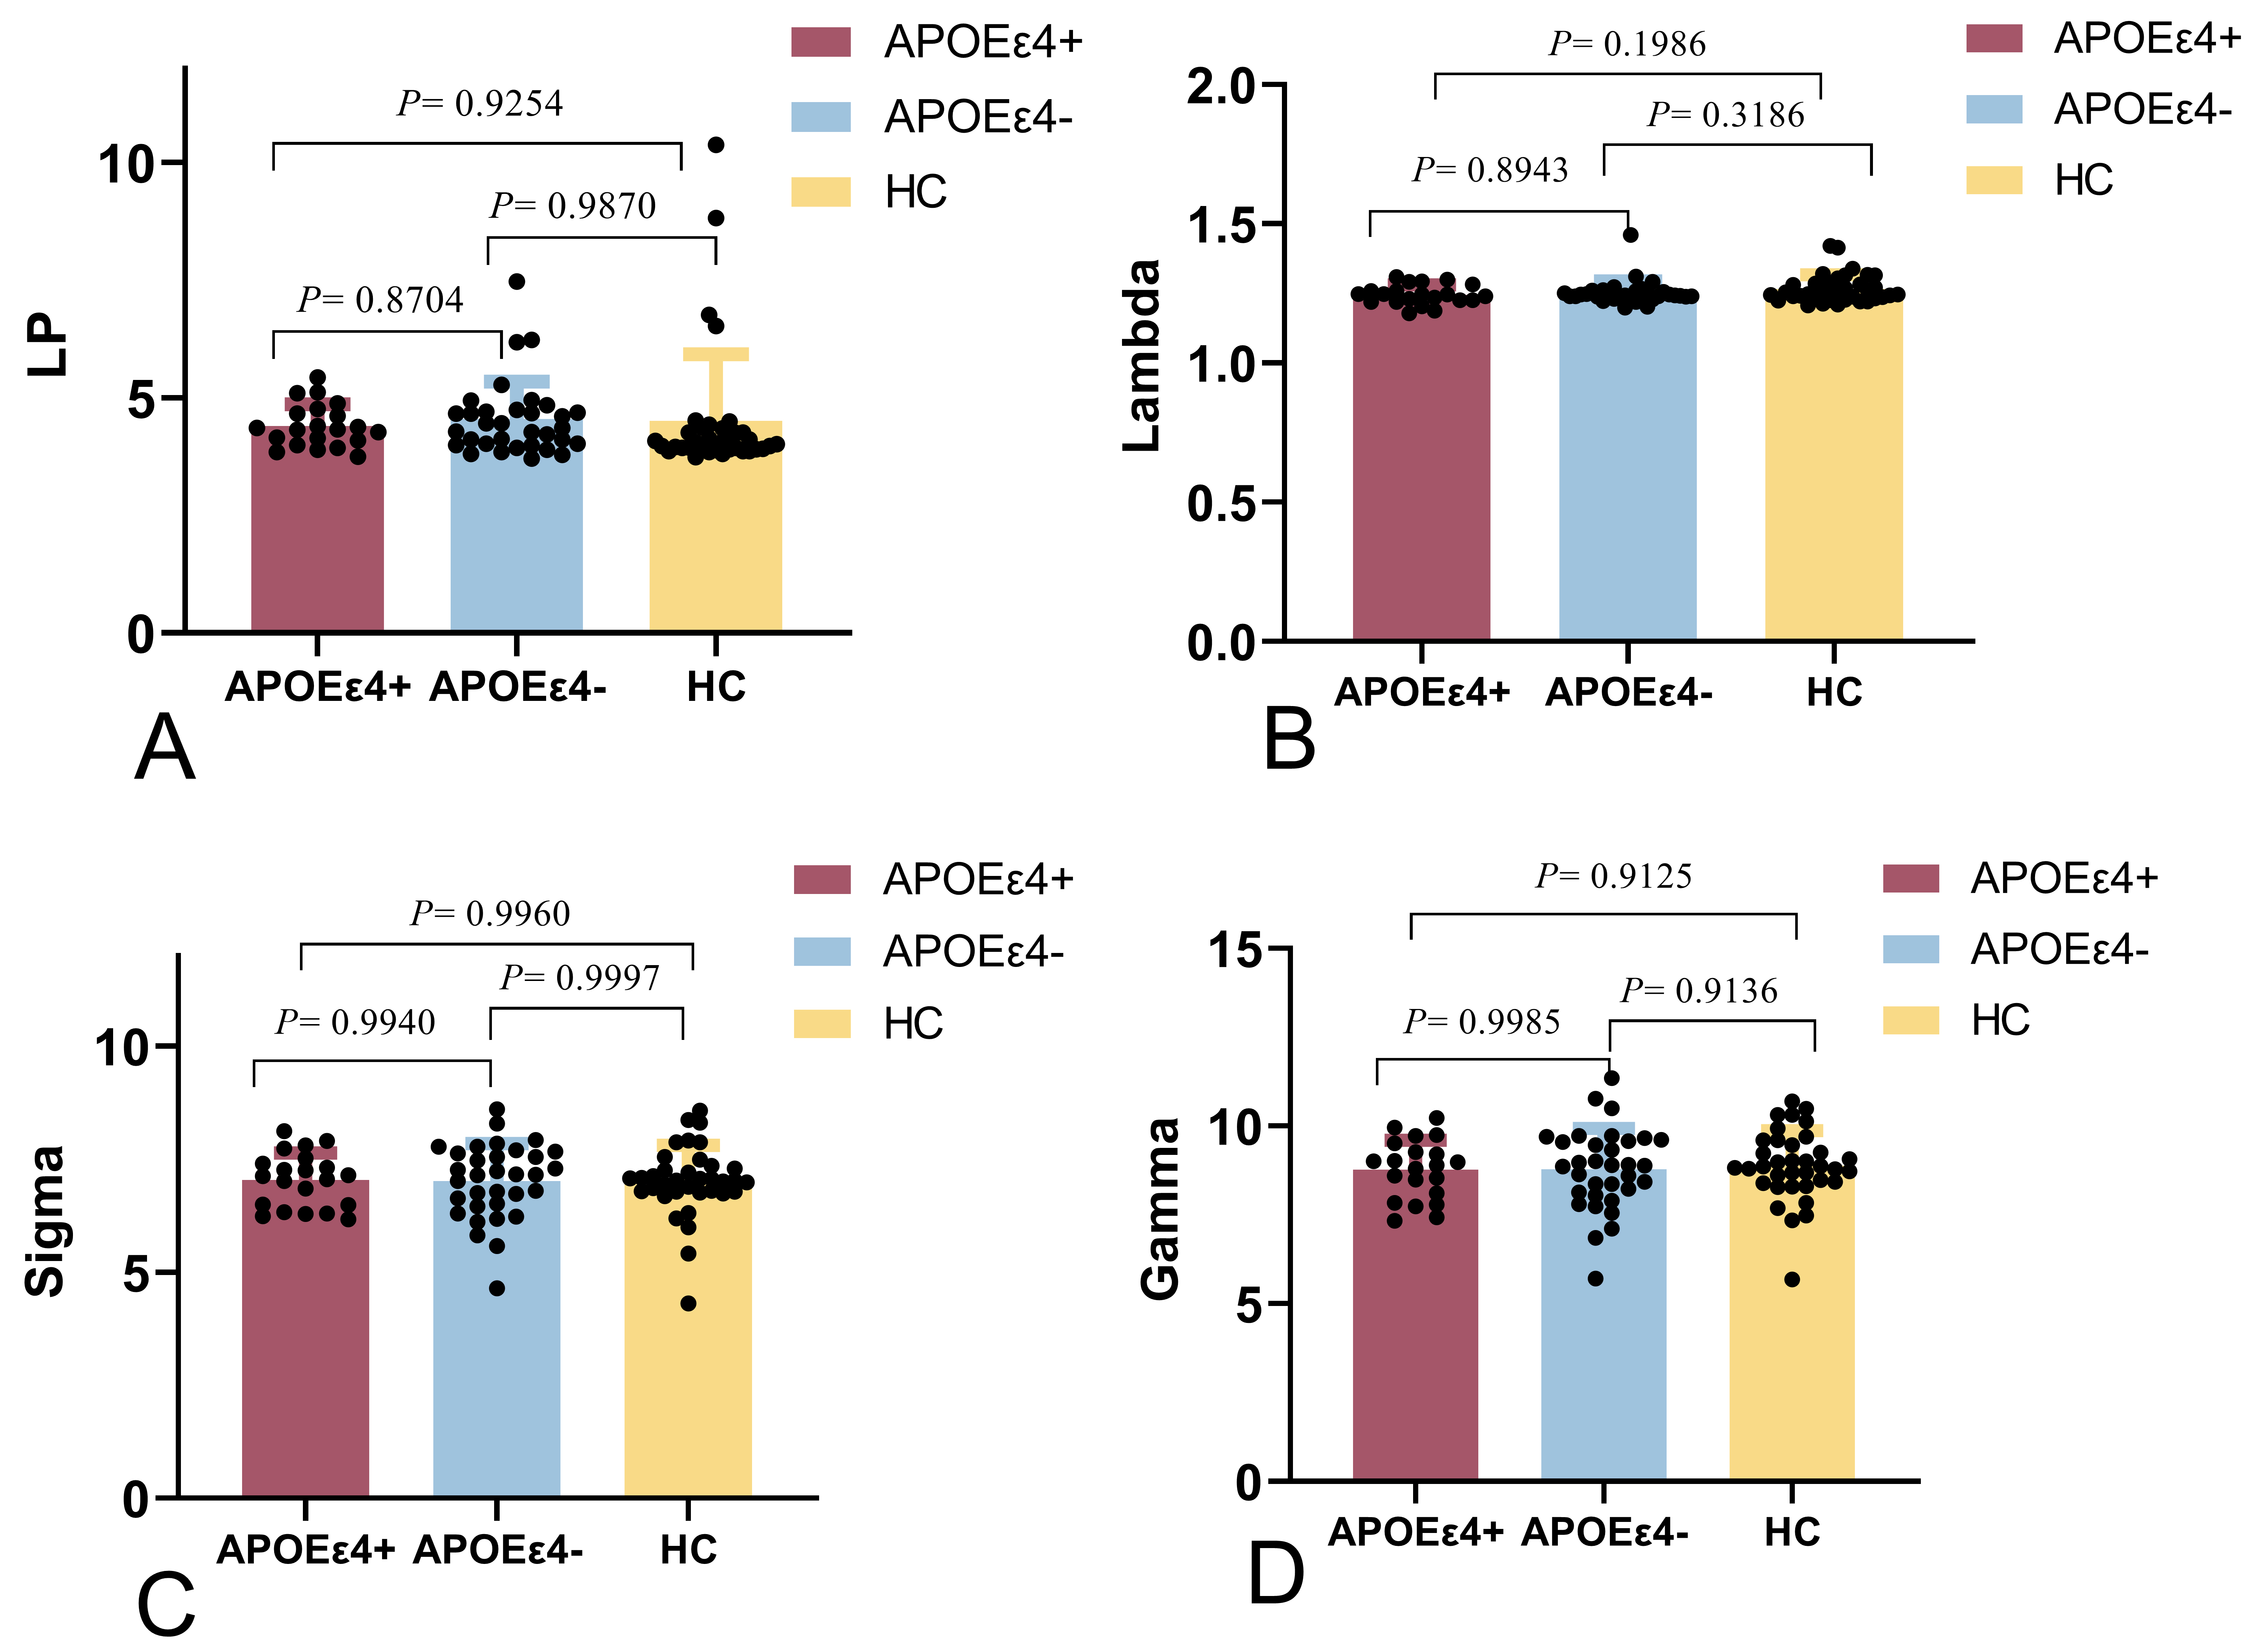 Fig. 3.
Small-world parameters of the global cerebral between the
APOE4+, APOE4-, and HC groups. There were no significant
differences among the three groups. (A) The shortest path lengths (Lp) of the
APOE4- and APOE4+ groups were not significantly different
compared to that of the HC group (p ˃ 0.05). (B) The normalized
characteristic path lengths () of the APOE4- and
APOE4+ groups were not significantly different compared to that of
the HC group (p ˃ 0.05). (C) The small-worldness () values of
the APOE4- and APOE4+ groups were not significantly
different compared to that of the HC group (p ˃ 0.05). (D) The normal
clustering coefficients () of the APOE4- and
APOE4+ groups were not significantly different compared to that of
the HC group (p ˃ 0.05).
Table 2.The differences in the global metrics of WM structural
networks.
| Global properties |
HC group |
APOEε4- group |
APOEε4+ group |
F value |
p value |
Intergroup comparison |
| Cp |
0.2758 0.4047 |
0.2502 0.4174 |
0.2446 0.4104 |
5.052 |
0.008 |
HCAPOEε4−/APOEε4+ |
| Lp |
4.5099 1.4157 |
4.5486 0.7962 |
4.4024 0.4560 |
0.129 |
0.879 |
|
|
1.2664 0.5060 |
1.2507 0.4336 |
1.2450 0.3537 |
1.822 |
0.168 |
|
|
8.8858 0.9843 |
8.7868 1.1409 |
8.7722 0.8334 |
0.116 |
0.890 |
|
|
7.0242 0.7864 |
7.0197 0.8265 |
7.0420 0.5994 |
0.006 |
0.994 |
|
| Eg |
0.2338 0.4057 |
0.2251 0.3147 |
0.2294 0.2273 |
0.572 |
0.567 |
|
| Eloc |
0.3272 0.5306 |
0.2934 0.5499 |
0.2835 0.5600 |
5.386 |
0.006 |
HCAPOEε4−/APOEε4+ |
| Hierarchy |
1.2084 0.1751 |
1.2711 0.2335 |
1.3305 0.2299 |
2.294 |
0.107 |
|
| Assortativity |
−0.1592 1.5122 |
0.0861 0.9705 |
−0.0394 1.2086 |
0.323 |
0.725 |
|
| Synchronization |
−0.1592 1.5122 |
0.0582 0.7723 |
−0.0394 1.2086 |
0.277 |
0.759 |
|
WM, white matter; Cp, clustering coefficient; Lp, shortest path length;
, normalized characteristic path length; , normal clustering
coefficients; , small-worldness; Eg, global efficiency; Eloc, local
efficiency; ANOVA, analysis of variance. Group comparisons conducted using ANOVA (F values from variance
analysis) and significant outcomes analyzed via two-sample t-tests.
Benjamini-Hochberg procedure correction applied for multiple comparisons.
Pairwise comparisons: HCAPOE4-/APOE4+ (e.g.,
HCAPOE4-, Cp: t = 2.582, p = 0.012; Eloc: t = 2.599,
p = 0.011; HCAPOE4+, Cp: t = 2.793, p = 0.007;
Eloc: t = 2.944, p = 0.005). Data presented as mean SD.
*p 0.05 denotes significant group differences.
3.3 Intracerebral Node Characteristics
When comparing the node characteristics in the structural networks of the
APOE4+ and APOE4- groups with the HC group, the node Cp
and the node Eloc in the left cuneate lobe were reduced in the APOE4+
group and increased in the APOE4- group. Moreover, the node Cp and
node Eloc in the right cuneate lobe were increased in both the APOE4+
and APOE4- groups, with a more significant increase in the
APOE4- group. The node Cp and node Eloc in the left supplementary
motor area and the left paracentral lobule were increased in both the
APOE4+ and APOE4- groups, with a more significant
increase in the APOE4+ group (p 0.05; Table 3). The
centrality in bilateral cuneate lobes was increased in the APOE4+
group and reduced in the APOE4- group. The centrality in the right
gyrus rectus, the right intraorbital superior frontal gyrus, the left paracentral
lobule, the right supramarginal gyrus, and the right superior temporal gyrus was
increased in the APOE4+ and APOE4- groups, with a more
significant increase in the APOE4- group. Furthermore, the centrality
in the left middle temporal gyrus was increased in the APOE4+ and
APOE4- groups, with a more significant increase in the
APOE4+ group (p 0.05; Table 4). The betweenness
centrality in the bilateral cuneate lobes, the right gyrus rectus, and the right
superior occipital gyrus was increased in the APOE4+ group and
reduced in the APOE4- group. Moreover, the betweenness centrality in
the right middle occipital gyrus was reduced in both the APOE4+ and
APOE4- groups, with a more significant reduction in the
APOE4- group. The betweenness centrality in the right caudate nucleus
and right lingual gyrus was increased in both the APOE4+ and
APOE4- groups, with a more significant increase in the
APOE4- group (p 0.05; Table 5). The statistically
significant nodes are shown in Fig. 4.
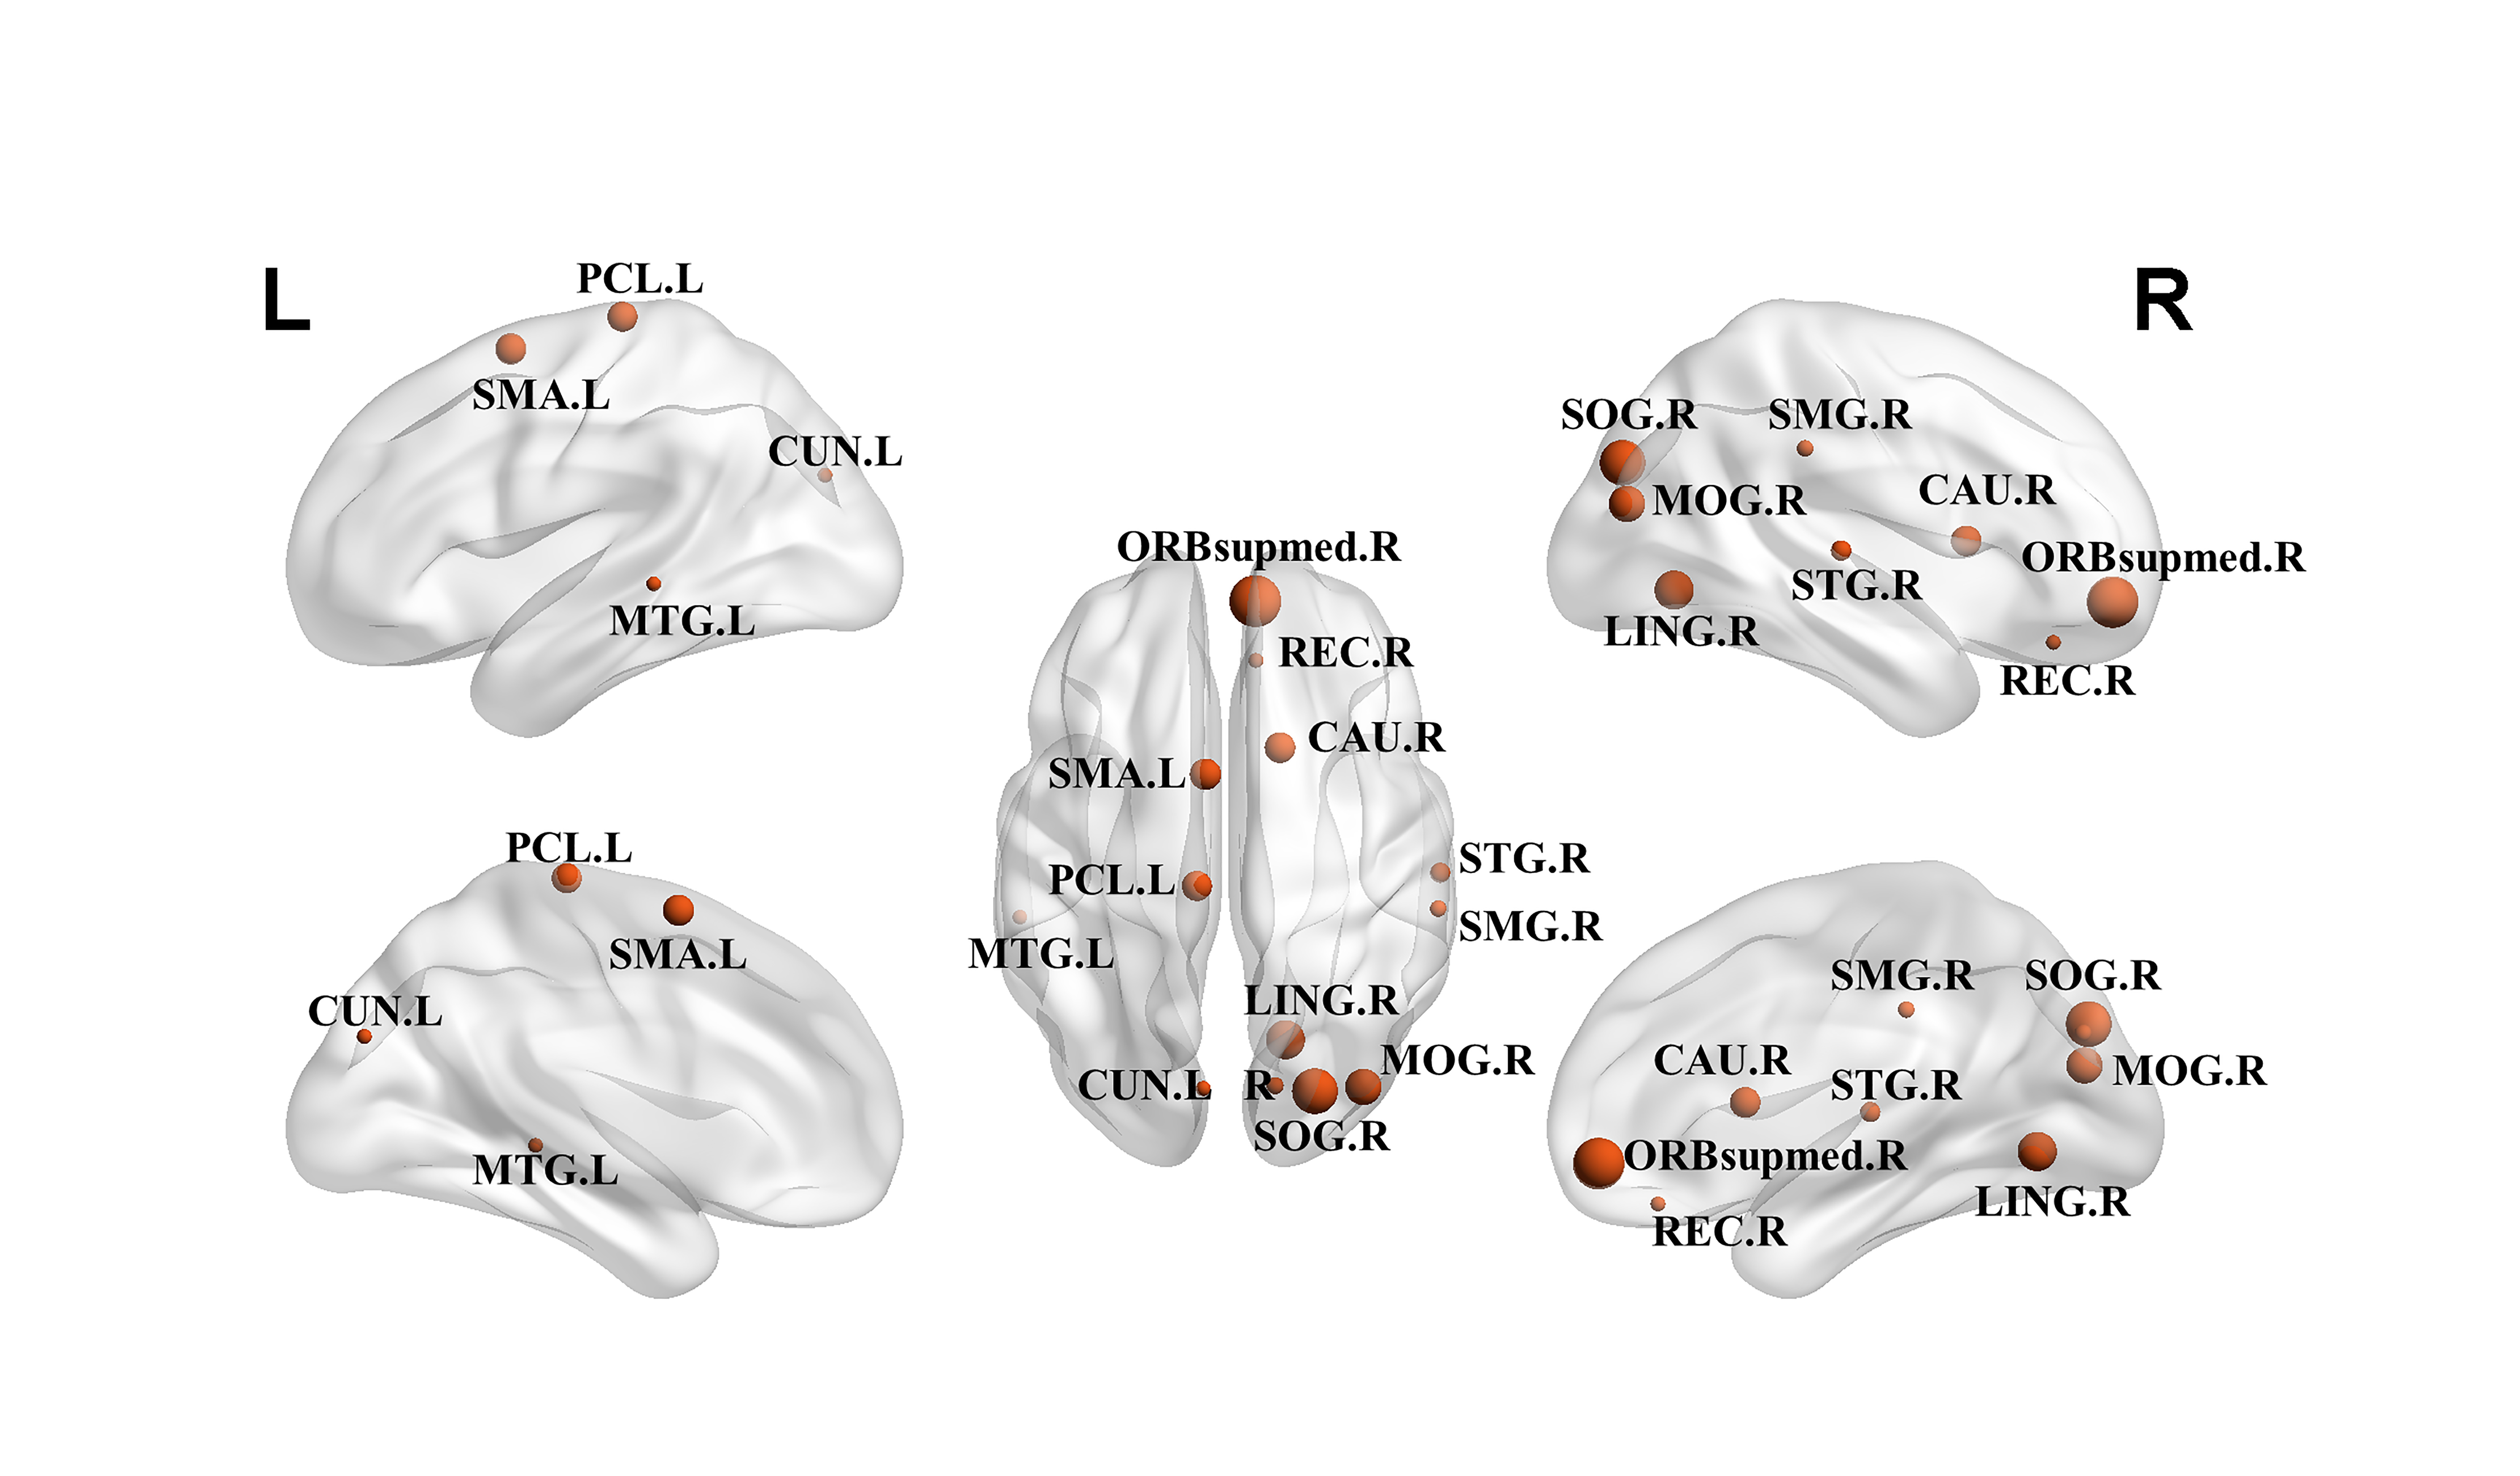 Fig. 4.
Predominant nodes with significant differences in nodes graph
metrics. Abbreviations: SMA.L, Supp_Motor_Area_L, Supplementary motor area,
left; REC.R, Rectus_R, Gyrus rectus, right; ORBsupmed.R, Frontal_Mid_Orb_R,
Superior frontal gyrus, medial orbital, right; CUN.L, Cuneus_L, Cuneus, left;
CUN.R, Cuneus_R, Cuneus, right; SOG.R, Occipital_Sup_R, Superior occipital
gyrus, right; MOG.R, Occipital_Mid_R, Middle occipital gyrus, right; SMG.R,
SupraMarginal_R, Supramarginal gyrus, right; LING.R, Lingual_R, Lingual gyrus,
right; PCL.L, Paracentral_Lobule_L, Paracentral lobule, left; CAU.R,
Caudate_R, Caudate nucleus, right; STG.R, Temporal_Sup_R, Superior temporal
gyrus, right; MTG.L, Temporal_Mid_L, Middle temporal gyrus, left.
Table 3.Brain regions with significant differences in nodal metrics.
| AAL number |
Corresponding brain regions |
Anatomical classification |
Cp |
Eloc |
| p |
F |
p |
F |
| 45 |
Cuneus_L |
Occipital |
0.0019 |
6.7654 |
0.0007 |
7.9227 |
| 46 |
Cuneus_R |
Occipital |
0.0090 |
4.9944 |
0.0030 |
6.2405 |
| 19 |
Supp_Motor_Area_L |
Frontal |
0.0300 |
3.6610 |
0.0300 |
3.6610 |
| 69 |
Paracentral_Lobule_L |
Parietal |
0.0343 |
3.5148 |
0.0343 |
3.5148 |
AAL, automated anatomical labeling; Cp, clustering coefficient; Eloc, local
efficiency; L, Left; R, Right; Supp, Supplementary. Data are presented as the mean SD. p 0.05
indicates a significant difference between the groups. The F value was
obtained using the analysis of variance test.
Table 4.Brain regions with significant degree centrality differences.
| AAL number |
Corresponding brain regions |
Anatomical classification |
p |
F |
| 45 |
Cuneus_L |
Occipital |
0.0015 |
7.0803 |
| 28 |
Rectus_R |
Prefontal |
0.0021 |
6.6544 |
| 82 |
Temporal_Sup_R |
Temporal |
0.0162 |
4.3394 |
| 46 |
Cuneus_R |
Occipital |
0.0172 |
4.2714 |
| 85 |
Temporal_Mid_L |
Temporal |
0.0225 |
3.9771 |
| 26 |
Frontal_Mid_Orb_R |
Prefontal |
0.0225 |
3.9742 |
| 69 |
Paracentral_Lobule_L |
Parietal |
0.0261 |
3.8135 |
| 64 |
SupraMarginal_R |
Parietal |
0.0294 |
3.6829 |
AAL, automated anatomical labeling. Data are presented as the mean SD.
p 0.05 indicates a significant difference between the groups. The
F value was obtained using the analysis of variance test.
Table 5.Brain regions with significant betweenness centrality
differences.
| AAL number |
Corresponding brain regions |
Anatomical classification |
p |
F |
| 46 |
Cuneus_R |
Occipital |
0.0068 |
5.3126 |
| 45 |
Cuneus_L |
Occipital |
0.0082 |
5.0902 |
| 52 |
Occipital_Mid_R |
Occipital |
0.0210 |
4.0519 |
| 50 |
Occipital_Sup_R |
Occipital |
0.0276 |
3.7512 |
| 28 |
Rectus_R |
Prefontal |
0.0349 |
3.4969 |
| 72 |
Caudate_R |
Subcortical |
0.0436 |
3.2560 |
| 48 |
Lingual_R |
Occipital |
0.0486 |
3.1386 |
AAL, automated anatomical labeling. Data are presented as the mean SD.
p 0.05 indicates a significant difference between the groups. The
F value was obtained using the analysis of variance test.
4. Discussion
In this study, we used graph theory to study whole-brain network characteristics
and intracerebral node characteristics in the structural network in
APOE4+, APOE4-, and HC groups. Our results showed that
the three groups presented with small worldness and had statistically significant
differences in Cp, Eloc, and local node properties in some brain regions,
including the default mode network (DMN), occipital lobe, temporal lobe, and
subcortical regions. Moreover, different intracerebral node characteristics were
observed between the APOE4+ and APOE4- groups.
In all three groups, the brain structural network had high Cp
( 1) and close Lp ( 1),
with the characteristics of a small-world network. The Cp and Eloc in
APOE4+ and APOE4- groups were significantly lower than
those in the HC group. However, no statistical difference was observed between
the APOE4+ and APOE4- groups. Cp measures the local
information integration capability of the network and reflects local efficiency.
Brier et al. [28] found that the Cp changed with the progression of the
disease and was associated with the known cognitive impairment in AD patients.
Daianu et al. [29] and Lo et al. [30] demonstrated higher Lp
and lower Eg in the structural network of patients with AD. This study showed the
reduction of only Cp and Eloc, with no changes in Lp or Eg, which further
indicated that SCD included mild neuron injury. However, there existed
compensation in the structural network; thus, the global efficiency of the whole
structural network was not significantly changed.
This study identified significant changes in node Cp and node Eloc in some brain
regions of the structural network in both APOE4+ and
APOE4- groups, mainly including the bilateral cuneate lobes, the left
supplementary motor area, and the left paracentral lobule. The bilateral
cuneiform lobes are located on the medial side of the occipital lobe and form a
primary visual area between the spur sulcus and the parietal-occipital sulcus and
the surrounding cortex [24]. The left supplementary motor area is located on the
medial side of the left frontal lobe. Cona and Semenza [31] found that the
supplementary motor area involves perceptual and productive tasks (e.g.,
time/language/music perception and production) but has no association with the
information to be processed (e.g., spatial working memory and linguistic working
memory). The left paracenter lobule is located in the parietal lobe and belongs
to the DMN. The DMN includes a wide range of the frontal lobe and the posterior
midline and inferior parietal lobule. It is not a single network but rather
consists of multiple parallel intersecting networks [32]. Furthermore, it
performs functional activities in the human brain at rest, including those
related to emotional processing, self-introspection, and episodic memory
extraction [33]. Hahn et al. [34] found that the DMN of patients with AD
was subject to selective and gradual damage. Previous studies on DMN changes of
SCD mainly focused on the resting state functional MRI, and only a few studies
have been performed on the white matter structural network. However, Horn
et al. [35] observed a high similarity between functional and structural
connectivity in the DMN region. In studies on resting state functional MRI,
Verfaillie et al. [36] and Hafkemeijer et al. [37] showed that
the functional connectivity in the DMN of individuals with SCD was increased;
however, Wang et al. [38] and Dillen et al.
[39] observed less functional connectivity in the DMN of individuals with SCD.
The heterogeneity of functional connectivity in the DMN may be associated with
compensation and its degree in individuals with SCD. In a study on the white
matter structural network, Shu et al. [40] noted lower local node
efficiency in the paracentral lobule. Moreover, Ye et al. [41] studied
the abnormal connection mode in the structural network using multivariable
distance matrix regression and found that the supplementary motor area was
abnormal in patients with mild cognitive impairment (MCI), whereas the DMN was
abnormal in patients with AD. The results of the present study indicated that
individuals with SCD had similar changes to those with MCI and AD, and there were
differences between the APOE4+ and APOE4- groups. These
findings suggest that functional integration and separation are damaged in the
structural network at the SCD stage [42], and the structural network is affected
by APOE4.
Degree centrality was significantly changed in the DMN, occipital lobe, and
temporal lobe in both the APOE4+ and APOE4- groups. Node
centrality is the number of edges shared by a node and other nodes in the
network, and it used to measure the importance of a single node in the network.
Brain regions with any change in DMN centrality included the right gyrus rectus,
the right intraorbital superior frontal gyrus, the left paracentral lobule, and
the right supramarginal gyrus, in agreement with previous studies [41, 43].
Moreover, the brain regions with temporal lobe changes included the right
superior temporal gyrus and left middle temporal gyrus. The right superior
temporal gyrus involves language processing, connects auditory and visual
pathways [44], and is sensitive to emotional information [45]. The left middle
temporal gyrus plays a role in the process of memory. Brascamp et al.
[46] stimulated the middle temporal gyrus cortex using transcranial magnetic
stimulation and found that it was associated with the disruption of memory trace,
suggesting that abnormalities of the middle temporal gyrus may result in lower
memory confidence. The present study also found that changes in the internal
structural network in the DMN and temporal lobe were different between the
APOE4+ group and the APOE4- group, which may be
associated with the different compensatory pathways of the two groups after
structural network destruction.
Betweenness centrality was significantly changed in the occipital lobe, DMN, and
basal ganglia between the APOE4+ group and the APOE4-
group. Betweenness centrality is the number of shortest paths cutting through
this node among all other pairs in the whole network, and it reflects the node’s
importance in the network. The DMN region includes the right gyrus rectus. The
betweenness centrality in the DMN region was increased in the APOE4+
group and reduced in the APOE4- group. These different results
observed in the two SCD groups explain the findings of previous studies [47, 48, 49].
The reasons for the heterogeneity in the DMN region are associated with the
division of study subjects and their inclusion criteria. The occipital lobe
includes the bilateral cuneate lobes, the right middle occipital gyrus, the right
superior occipital gyrus, and the right lingual gyrus. The betweenness centrality
in the right superior occipital gyrus was increased in the APOE4+
group and reduced in the APOE4- group. The betweenness centrality in
the right middle occipital gyrus was reduced in both the APOE4+ and
APOE4- groups, with a more significant reduction in the
APOE4- group. Moreover, the betweenness centrality in the right
lingual gyrus was increased in both the APOE4+ and APOE4-
groups, with a more significant increase in the APOE4- group. Hayes
et al. [50] identified fewer occipital cortex activities in memory
coding. However, Viviano et al. [15] found no significant difference in
the occipital lobe. The caudate nucleus is closely related to repetitive
stereotyped behaviors and is a component of the
cortical–striatal–thalamocortical neural circuit [51]. In the present study,
the betweenness centrality in the right caudate nucleus increased in both the
APOE4+ and APOE4- groups, with a more significant
increase in the APOE4- group. The different node characteristics of
the two groups of individuals with SCD may be related to different degrees of
compensation generated to achieve network balance after an early injury.
APOE is the main lipid carrier of the central nervous system, and
APOE4 is the most potent genetic risk factor for sporadic AD [52].
APOE4 affects not only the clearance and aggregation of
A but also neuron growth, membrane repair and remodeling, and
synaptogenesis and neuroinflammation [53]. The present study found that the
structural network was different between the APOE4+ and
APOE4- groups, indicating that APOE4 had an
impact on the structural network, although the specific mechanism requires
further research.
Based on the preliminary nature of this study, the following limitations should
be considered. First, the sample size was small. Although the ADNI database
contains a large amount of data, there were few individuals with SCD with
T1-weighted images, DTI, and APOE4, which may weaken the
statistical power of this study. Second, this study is a cross-sectional study
without clinical follow-up. By expanding the sample size and using a more diverse
range of cognitive assessment tools in longitudinal follow-up studies, future
research may reveal meaningful associations that we have not been able to observe
at present. Third, to study the mechanism of the effect of
APOE4 on the white matter network, future studies should be
performed with live animal models, supplemented by molecular imaging and
molecular biological data for confirmation. Fourth, the original version of the
AAL atlas [17] was selected. Nevertheless, the latest version of AAL3 [54] adds
many previously undefined areas of the brain that are interested in many
neuroimaging studies, such as a new version of anterior cingulate, thalamus, and
brain nuclei (nucleus accumbens, substantia nigra, ventral tegmental area, red
nucleus, locus coeruleus, and raphe nuclei). AAL3 can be used as a toolkit for
statistical parametric mapping (SPM) and with MRIcron. AAL3 has an isotropic voxel size of 2 2
2 mm. In addition, the voxel sampling size of 1 1
1 mm is provided. The AAL3 atlas should be selected for future
studies. Additionally, while we have implemented measures to alleviate the impact
of connection density, such as empirically selecting a threshold for fiber
connections and retaining only those observed in at least 80% of participants,
we have not directly analyzed the implications of variations in connection
density on the results. Future research could delve deeper into investigating the
impact of connection density on topological property analysis and employ a more
comprehensive approach to address this factor. Finally, based on the DTI, we
constructed a structural network instead of a resting state functional network.
Future studies should further combine structural and functional networks for
multimodal MRI studies and further explore the effects of
APOE4 on the brain functional networks of individuals with
SCD in multimodal MRI.
5. Conclusions
In this study, the DTI of individuals with SCD showed structural connection
changes in the DMN, the occipital lobe, the temporal lobe, and subcortical
regions. APOE4 affects the structural network, but its
mechanism should be further studied. In practice, clinicians can use DTI as a
detection indicator to identify individuals with SCD.
Availability of Data and Materials
All raw data used in this study were from the Alzheimer’s
Disease Neuroimaging Initiative (ADNI). Data used in preparation of this article
were obtained from the ADNI
database (http://adni.loni.usc.edu). As such, the investigators within the ADNI
contributed to the design and implementation of ADNI and/or provided data but did
not participate in analysis or writing of this report. A complete listing of ADNI
investigators can be found at:
http://adni.loni.usc.edu/wp-content/uploads/how_to_apply/ADNI_Acknowledgement_List.pdf.
Author Contributions
These should be presented as follows: SD and WL designed the research study. SD
and WC performed the research. SF and HL provided help on analyzing the data. SD
and WL wrote the manuscript. All authors contributed to editorial changes in the
manuscript. All authors read and approved the final manuscript. All authors have
participated sufficiently in the work and agreed to be accountable for all
aspects of the work.
Ethics Approval and Consent to Participate
The ADNI passed a review by the Institutional Review Board (IRB), and all
subjects provided written informed consent and unified inclusion criteria
(https://adni.loni.usc.edu/). We obtained the approval of our local ethics review
committee (Dongguan Eighth People’s Hospital medical ethics committee
AF/SC-15/01.0) before the analysis began.
Funding
This research was funded by Guangdong Medical Science and Technology Research
Fund, grant number 20231129323888.
Conflict of Interest
The authors declare no conflict of interest.


