


 , Kazuma Oki 2, Masaki Takayose 3
1 College of Economics, Nihon University, 101-0061 Tokyo, Japan
2 College of Science and Technology, Nihon University, 274-8501 Chiba, Japan
3 College of Industrial Technology, Nihon University, 275-8576 Chiba, Japan
Abstract
Background: In this study, we used electroencephalogram (EEG) to investigate the activity pattern of the cerebral cortex related to visual pursuit and saccade strategies to predict the arrival position of a visual target. In addition, we clarified the differences in the EEG of those who could predict the arrival position well using the saccade strategy compared to those who were not proficient. Methods: Sixteen participants performed two tasks: the “Pursuit Strategy Task (PST)” and the “Saccade Strategy Task (SST)” while undergoing EEG. For the PST, the participants were instructed to follow the target with their eyes throughout its trajectory and indicate when it reached the final point. For the SST, the participants were instructed to shift their gaze to the end point of arrival once they had predicted it. Results: Low beta EEG activity at the Oz, Cz, and CP2 electrodes was significantly higher during the SST than during the PST. In addition, low beta EEG activity at P7 electrode was significantly higher in the group showing a small position error (PE) than in the group showing a large PE at response. Conclusions: EEG activity at the Oz, Cz, and CP2 electrodes during the SST may reflect visuospatial attention to the moving target, the tracking of moving targets, and the focus on the final destination position. In addition, EEG activity at P7 electrode may more accurately detect the speed and direction of the moving target by the small PE group at response.
Keywords
- electroencephalogram
- low beta
- middle temporal visual area
- saccades
- pursuit
When performing ball sports, such as bat or racket sports, accurate prediction of the ball’s target location is critical. Two eye movement strategies can be used for this task: “smooth pursuit” and “saccade”. Smooth pursuit eye movement is a slow, smooth eye movement that occurs only when the eye follows a moving target throughout its trajectory. Experienced athletes use smooth pursuit eye movement to track a ball for a longer period than inexperienced athletes. This feature is often observed when catching a ball that does not bounce, such as hitting a baseball or volleyball. According to Vickers and Adolphe [1], a skilled volleyball player can track a ball for 1400 ms on average, whereas a semi-skilled player can track it for only 768 ms. Therefore, the expert can start tracking the ball immediately after it is thrown, whereas the semi-expert’s response is delayed. Bahill and Laritz [2] measured gaze when a visual object simulating a ball being thrown was presented and showed that professional players can track the target more accurately than amateur players. Smooth pursuit eye movements allow accurate perception of the full trajectory of moving targets [3]. The expert can track the ball until just before receiving it, whereas the semi-expert looks away from the ball earlier [1]. It has been clarified that longer smooth pursuit eye movement to detect moving targets promotes the prediction of the future arrival position of a moving object [4]. Athletes can start smooth pursuit eye movement early to follow a moving target for a long time, allowing them to predict the location where the moving target will reach.
However, there is a limit to the smooth tracking of a ball by eye movements. The upper limit of the smooth pursuit eye movement velocity is approximately 90°/s [5]. In this way, when the angular velocity of the ball exceeds the upper limit, the athlete uses a very high-speed eye movement called a “saccade” (maximum speed 300–600°/s) to perceive the ball with the eyes. For example, Kishita et al. [6] conducted gaze point measurements under conditions closely resembling a game in which professional batters hit a ball thrown by an actual pitcher. As a result, it was revealed that smooth pursuit eye movement changed to saccade approximately 200 ms before impact [6]. Even a top-level batter cannot execute smooth pursuit eye movement before the bat and ball impact, where the ball angular velocity rises exponentially, and therefore, the player switches to saccade. Using saccade eye movement, it is possible to predict the arrival position sufficiently even if the moving target is fast and there is no margin for time. “Predictive saccade” is often observed in ball hitting and catching movements including bouncing balls such those used in tennis, table tennis, and cricket. A predictive saccade is a gaze strategy that uses saccadic (impulsive) eye movements to move the gaze position ahead of the ball. For example, a study comparing skilled and unskilled cricket batsmen found that higher-level batsmen used predictive saccades earlier and more accurately [7]. In addition, Bahill and Laritz [2] measured the player’s gaze when a visual object simulating a moving ball was presented and revealed that professional players tended to look ahead of the ball in some trials compared to amateur players [2]. However, to enable such a predictive saccade, it is necessary to detect information such as the speed and direction of the target at an early stage and quickly predict the arrival position.
While the motion-sensing neurons in the primary visual cortex respond only to movements in a narrow area in a specific direction, middle temporal (MT) visual area cells integrate the output of the motion-sensing neurons in the primary visual cortex over a wide range to detect moving targets. For example, the destruction of the MT area makes it impossible to discriminate motion direction [8, 9], and electrical stimulation of the MT area biases judgments regarding motion direction [10, 11]. These findings suggest that the MT area plays an essential role in the processing of target movements.
Although the brain regions involved in such speed processing have been clarified [12, 13], previous studies did not investigate when these regions are active during target movement, as we did in our previous study [14]. In addition, although some studies have attempted to predict arrival positions and arrival times using parabolically moving targets [15], no studies have clarified differences in brain processing. When a visual target jumps from one point to another, healthy individuals generate a saccade within approximately 200 ms [12]. It is believed that the brain processes the speed and direction of the moving target during this period, but there are few brain activity recording devices that can record such short-term brain activity in chronological order, and electroencephalography (EEG) is the only such device.
Therefore, in this study, we aimed to clarify the activity pattern of the cerebral cortex by recording EEG during the execution of the pursuit and saccade strategies, visual techniques which are used to predict the arrival position of the target within a limited time. To complicate the task of predicting the target’s arrival position, the target was partially occluded while it was moving. In addition, three types of parabolic moving targets with different arrival points were used in this study. This was intended to prevent habituation from repeated execution of the task.
Furthermore, it is imperative to carefully select a relevant EEG parameter capable of accurately capturing variations in cortical area activation during changing conditions, such as the initiation of a moving target. In contrast to event-related potential (ERP) analysis, employing the Hilbert transform enables a high temporal resolution to observe rapid changes in analytic state variables, including frequency, phase, and amplitude [16]. In addition, there are references to previous EEG studies that have employed this transform [17, 18]. When performing Hilbert transform analysis, the essential step involves confining EEG measurements to a specific frequency within the time series data, resulting in interpretable state variables [16]. The specific function varies depending on the EEG frequency. In this study, we analyzed the 13–15 Hz (low beta) frequency in EEG, which is the most common frequency band examined in previous studies (e.g., 12–20 Hz in Bressler and Richter [19]; 12–24 Hz in Donner et al. [20]; 12–20 Hz in Gelastopoulos et al. [21]; 12–20 Hz in Hanslmayr et al. [22]; 10–25 Hz in Hanslmayr et al. [23]; 12–20 Hz in Lee et al. [24]; 13–30 Hz in Spironelli et al. [25]; 8–15 Hz in Spitzer and Blankenburg [26]; 12–20 Hz in Spitzer and Haegens [27]; 12–20 Hz in Yaple et al. [28]).
Furthermore, we aimed to clarify the differences in the gaze and EEG of those who could predict the arrival position well using the Saccade Strategy Task (SST), which is more difficult than the Pursuit Strategy Task (PST), compared to participants who were not as proficient.
Sixteen participants aged 18–23 years (mean age: 20.13 years, 14 male) whose eyes could be captured with the Gazefinder® infrared eye-tracking system (JVC Kenwood, Kanagawa, Japan) were analyzed. All participants enrolled in the study who had either normal vision or vision corrected to a normal level and had no previous history of psychological, psychiatric, or neurological disorders. All participants provided written consent. The study was approved by the Ethics Review Committee on Research with Human Subjects, College of Industrial Technology, Nihon University (approval number: S2020–008) in accordance with the Declaration of Helsinki. None of the participants reported using drugs or alcohol in the days prior to the experiment.
The participants underwent EEG while viewing a target through the
Gazefinder® infrared eye-tracking system (JVC Kenwood, Kanagawa,
Japan). This system is a 19-inch (1280
EEG was recorded as previously described [14] using the mobile EEG system,
eegoTM sports (ANT Neuro, Enschede, Netherlands), with 32 Ag/AgCl electrodes
positioned in accordance with the 10/20 system. The electrode activities at Fz,
F3, F4, FC1, FC2, FC5, FC6, Cz, C3, C4, T7, T8, CP1, CP2, CP5, CP6, Pz, P3, P4,
P7, P8, POz, Oz, O1, and O2 were analyzed. Frontal electrode activity at Fpz,
Fp1, Fp2, F7, and F8 was not analyzed owing to the effect of unwanted eye
movements (see Data analysis section, Koshizawa et al. [14], and Makin
et al. [29]). During the recording, CPz and AFz served as the reference
and ground electrodes, respectively. All EEG data were converted to common
average references prior to analysis. The sampling rate was set to 1000 Hz with
impedances maintained below 20 k
The participants performed a task to predict the final arrival position (which was at the same height as the starting point) and the time of a target moving parabolically (imitating gravitational acceleration) from the lower left to the lower right of the screen. Three types of moving targets (CLOSE, MID, and DISTANT) with different final arrival positions were used. This was intended to prevent habituation due to the repeated execution of the task.
The common specifications of the three types of moving targets were as follows. Units: the coordinate position indicating one point is expressed in cm (horizontal (x) and vertical (y) distance from the origin), and the distance between two points is expressed in degrees (visual angle). Size of moving target: the target was a circle with a radius of 0.38°. Start point of the moving target (lower left of the screen): XY coordinate origin (x = 0, y = 0). Colors: the target color was red (RGB: R = 255, G = 0, B = 0) and the background was gray (RGB: R = 128, G = 128, B = 128). The target’s movement time (from the start of movement until reaching the final arrival position) was 4.6 s, and the latter half of the target’s trajectory (movement time 2.3 s) was occluded by the same gray color as the background (RGB: R = 128, G = 128, and B = 128). Time: the time that the target was presented at the starting point before the start of the trial was random, between 2.4 and 3.6 s, and the interval between trials was random, between 0.9 and 2.1 s.
The specifications of each of the three types of moving targets were as follows
(Fig. 1a,b). It was assumed that the moving target encountered no air resistance.
The parabolic moving target with arrival point “CLOSE” had an initial velocity:
23.28°/s, launch angle: 75.96°, highest point: x = 12.98 cm/y =
26.00 cm, arrival point: x = 25.97 cm/y = 0.12 cm, visual angle (horizontal):
24.78°, and visual angle (vertical): 24.69°. Hence, the formula
for horizontal movement = 23.28
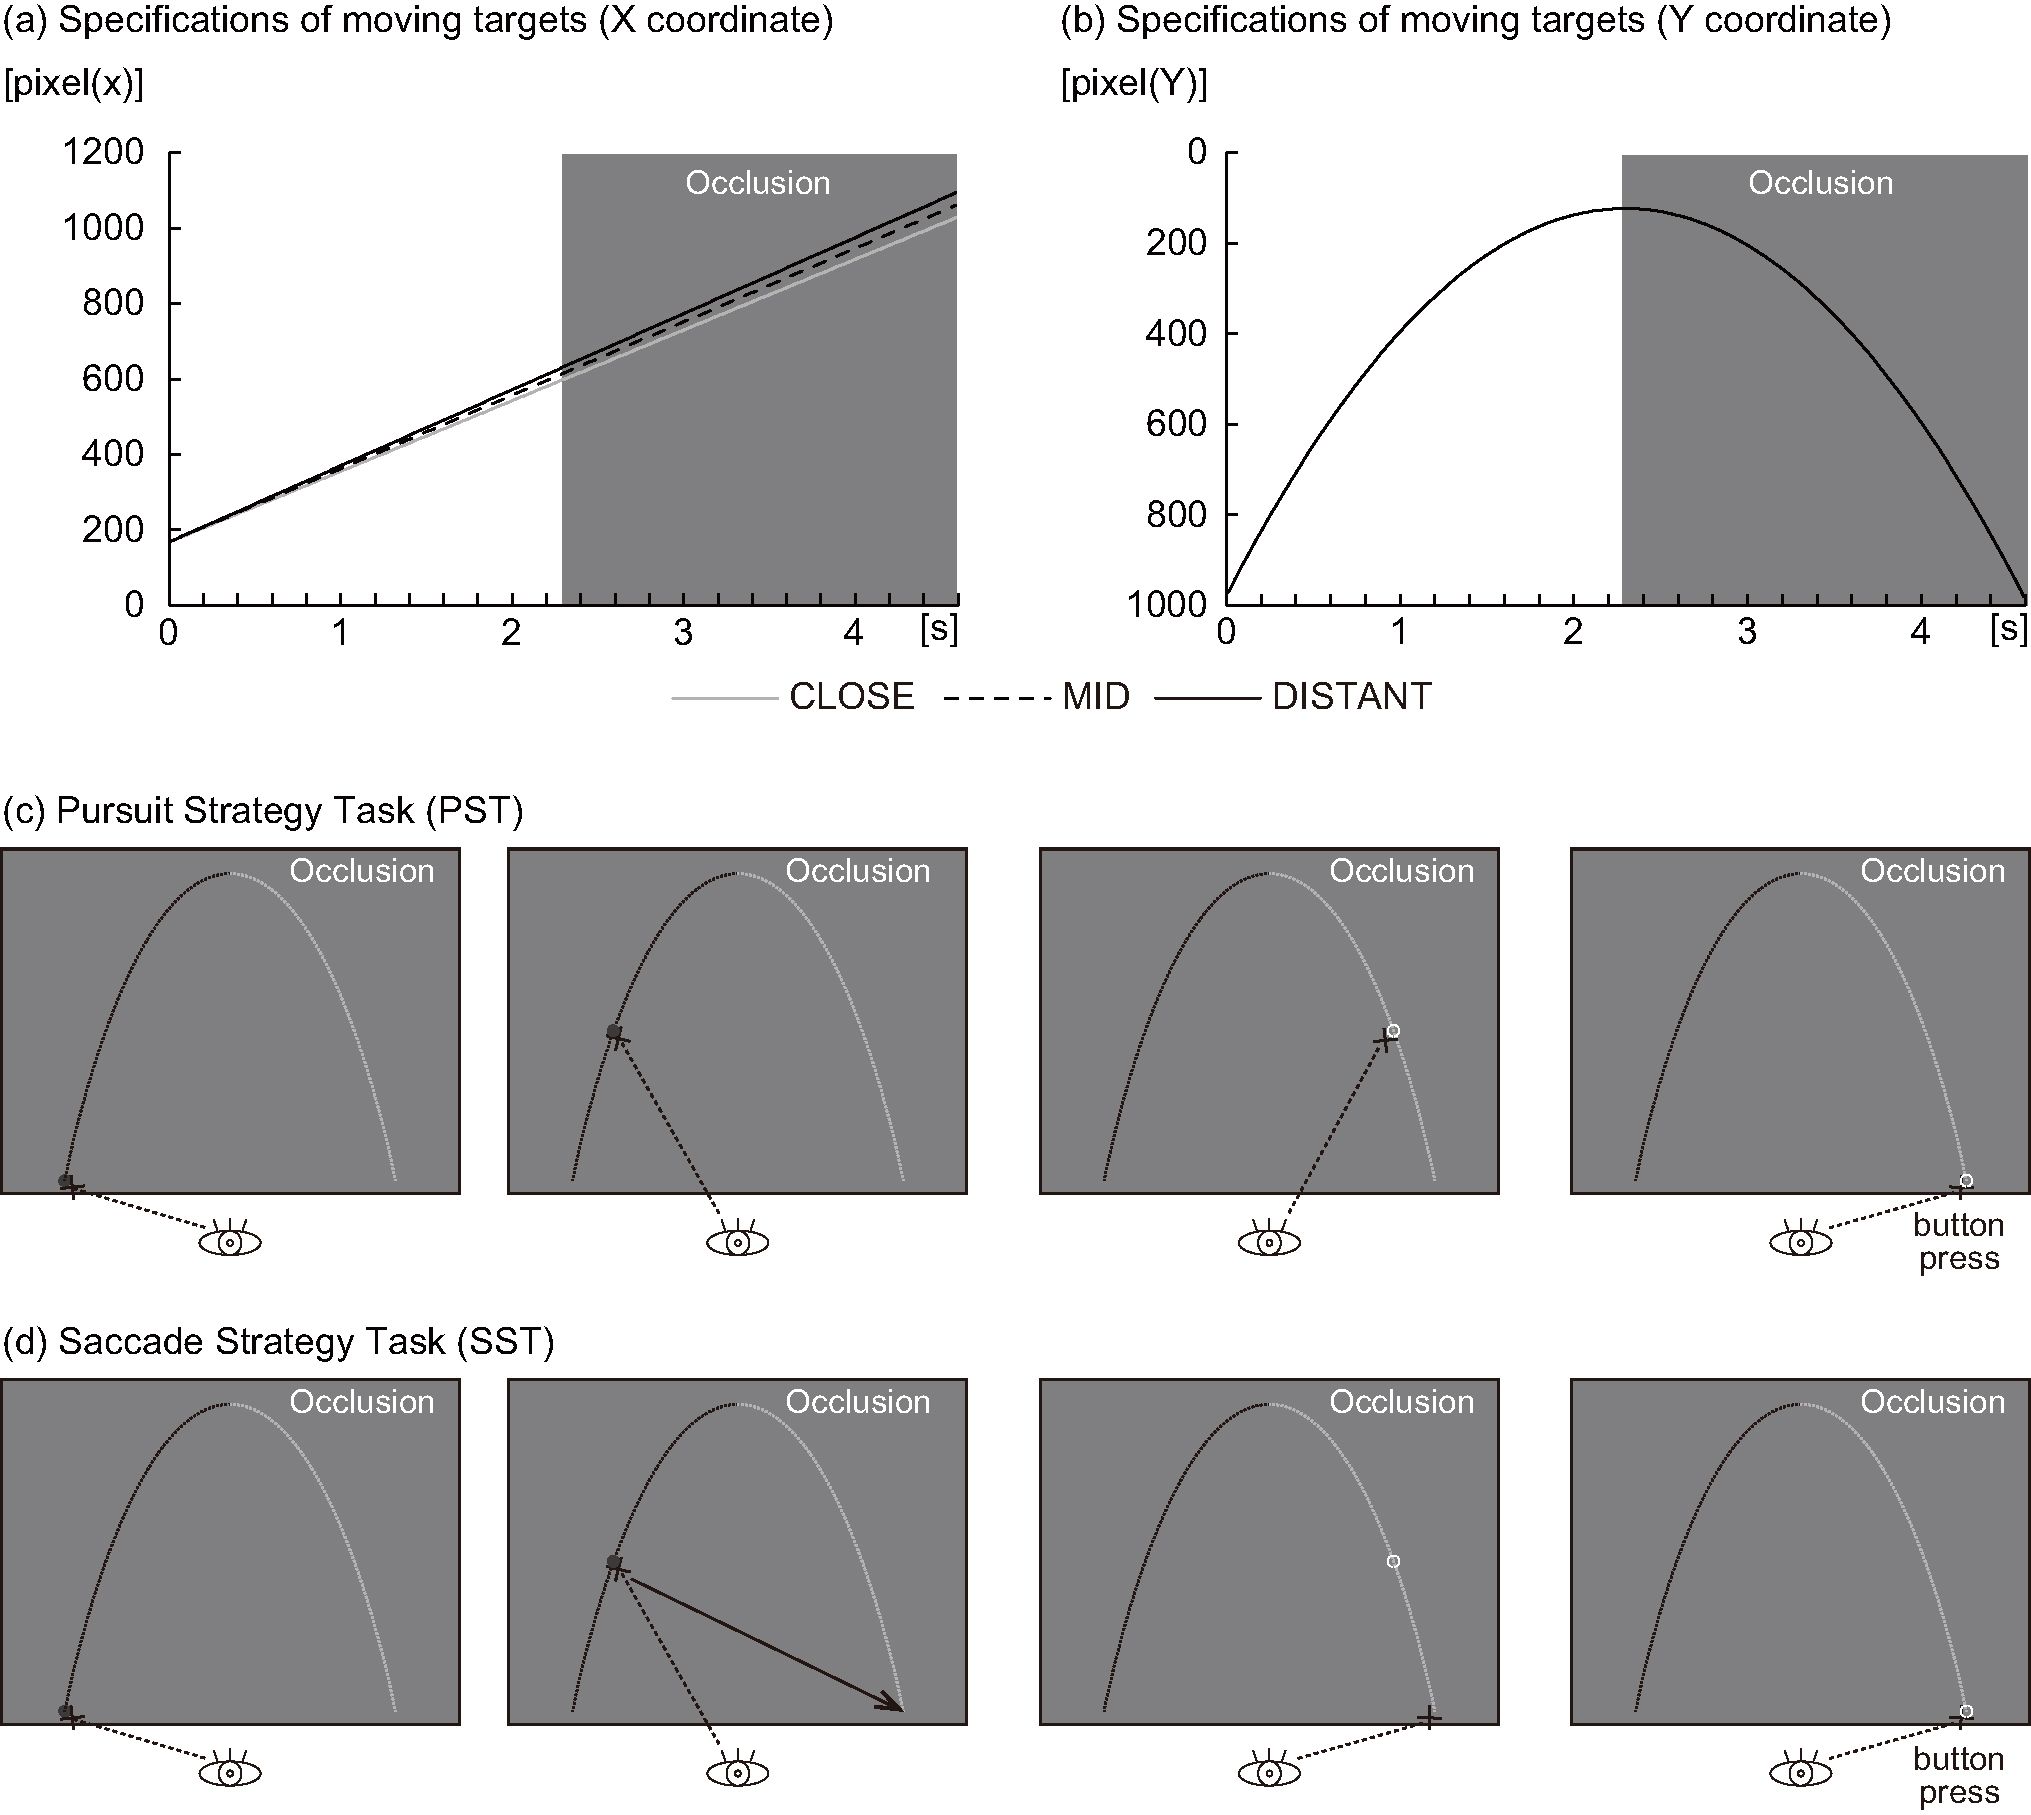 Fig. 1.
Experimental design. For targets that move parabolically, three types of moving targets (CLOSE, MID, DISTANT) with different final arrival positions in the X coordinate were used (a). This is intended to prevent habituation due to repeated execution of the task. On the other hand, target positions of the Y coordinate of moving targets (CLOSE, MID, DISTANT) were all the same (b). In addition, the travel time was the same at 4.6 s. For the “Pursuit Strategy Task”, the participants were instructed to pursue the target with their eyes (c). In particular, in the latter half of the task (occluded phase), the participants were instructed to pursue the target with their eyes, imagining that the target was moving, even though there was no visible target. Then, the participants were instructed to respond by pressing a button with their right thumb when they predicted that the target had reached the final arrival point at the bottom of the display (almost the same height as the starting point). For the “Saccade Strategy Task”, the participants were instructed to move their eyes to the final arrival point (at almost the same height as that at the starting point) as soon as they found the final arrival point of the target (d). In the latter half of the trial, when the moving target was occluded and visual perception was impossible, the participants were instructed to move their eyes to the final arrival point (at almost the same height as that at the starting point). Then, the participants were instructed to keep their eyes at the final arrival point (at almost the same height as that of the starting point) at the bottom of the display and to respond by pressing a button with their right thumb when they predicted that they had reached it.
Under the moving target specifications described above, the participants performed two tasks: the PST (Fig. 1c) and SST (Fig. 1d). For the PST, the participants were instructed to follow the target with their eyes. In particular, in the latter half of the trajectory (the occluded phase), the participants were instructed to imagine that the target was still traveling, even though there was no visible target, and anticipate its probable final destination with their eyes. The participants were instructed press a button with their right thumb when they predicted that the target had reached its final arrival point at the display bottom (almost the same height as the starting point). For the SST, the participants were instructed to move their eyes directly to the presumed final arrival point (at almost the same height as the starting point) as soon as they predicted it. The participants were then instructed to keep their eyes at the final arrival point (almost the same height as the starting point) at the display bottom and to respond by pressing a button with their right thumb when they predicted that it had been reached.
In both tasks, the three types of parabolically moving targets were presented randomly. For both tasks, 6 sets of 30 trials were performed. A break of 2 min or more was allowed between the sets.
First, while receiving instructions, the participants practiced the PST and SST.
A target different from that used in this experiment was used during practice.
The difference was the movement direction used: a right-to-left parabola. In the
experiment, the participants performed the SST first, in order to avoid the
influence of increasing the amount of information obtained (pursuit of moving
targets), and after the PST. The interval between the tasks was
For further analysis, trials were excluded based on the following criteria: loss of eye position data caused by blinks during the presentation of the moving target, signal loss from the eye tracker, or deflections surpassing 100 µV in any of the channels within the segmented EEG data ranging from 200 ms before target onset to 2300 ms after target onset [30]. The occluded section was excluded from the analysis because it was assumed that eye movement would increase and that artifacts would increase. Data from each of the remaining 16 participants during each condition were averaged for statistical analysis. Additionally, the analysis of the total EEG data at the time of the three parabolic moving targets with different arrival points was performed without dividing the three types of targets.
The distance between the actual target position of the final arrival point and the eye position when the participant responded by pressing a stick-type button with the thumb to predict that the moving target had reached the final arrival point at the bottom of the display (almost the same height as the starting point) was calculated as “position error (PE) at the response”.
The “response error” was calculated by subtracting 4.6 s (from when the target starts moving until it reaches the final arrival point) from the response time (time from when the target starts moving to when the participant predicts that the target has reached the final arrival point at the bottom of the display and responds by pressing the button).
At each time point (50 Hz) in the period of 4.6 s (from when the target starts moving until it reaches the final arrival point) during which the target moves, the distance between the eye position and the target position at the final arrival point was calculated as “PE at point (0.02–4.60 s)” in the time series data. Likewise, the “eye position of the XY coordinate (0.02–4.60 s)” was defined as the position in the time series data.
The instantaneous log amplitude of the complex analytic signal was calculated in the low beta frequency band (13–15 Hz) according to the Hilbert transform method [16] using EMSE Suite v5.6 (Cortech Solutions, Inc., Wilmington, NC, USA). A rectifier filter was used to obtain the log10 Hilbert envelope output for each channel. Following the application of polynomial detrend to baseline adjustment, the transformed signal displayed oscillations around zero, similar to the raw EEG. Subsequently, we calculated event-related averages and grand averages of log-transformed low beta-band amplitudes, employing a methodology akin to standard ERP data analysis. Additionally, scalp activity topographic maps were produced using the group mean voltage at each electrode, averaged over a significantly different section time window (see below).
We compared the SST and PST using a paired t-test for the four calculated parameters of (1) PE at response, (2) response error, (3) PE at point (0.02–4.60 s), and (4) eye position of the XY coordinate at point (0.02–4.60 s).
The participants were then divided into two groups of eight each: those with a small PE and those with a large PE at response. Next, the four parameters of the Small PE Group and the Large PE Group at response were compared using an unpaired t-test.
Statistical analyses were performed with SPSS (version 26, IBM Corp., Armonk,
NY, USA). The significance level was set at p
Non-parametric paired permutation tests [31, 32] were used to examine group differences in (1) PST vs. SST, (2) Small PE Group at response vs. Large PE Group at response, and each parameter for time (in 1 ms intervals throughout the recording epoch) and space (25 EEG channels) using EMSE Suite v5.6 (Cortech Solutions, Inc.). To address multiple comparisons across the visible section (ranging from 0 s to 2.300 s after target onset), the permutation test was utilized to compute p-values that were corrected for spatial effects. Based on the methodology described by Koshizawa et al. [14] and Naccache et al. [33], an effect was considered statistically significant if the corresponding p-value was less than 0.05 and maintained for a minimum duration of 10 ms. In addition, the topographic maps of scalp activity were produced only for the significantly different sections.
There was no significant difference with PE in response to the target arrival
point between the PST and SST (4.04
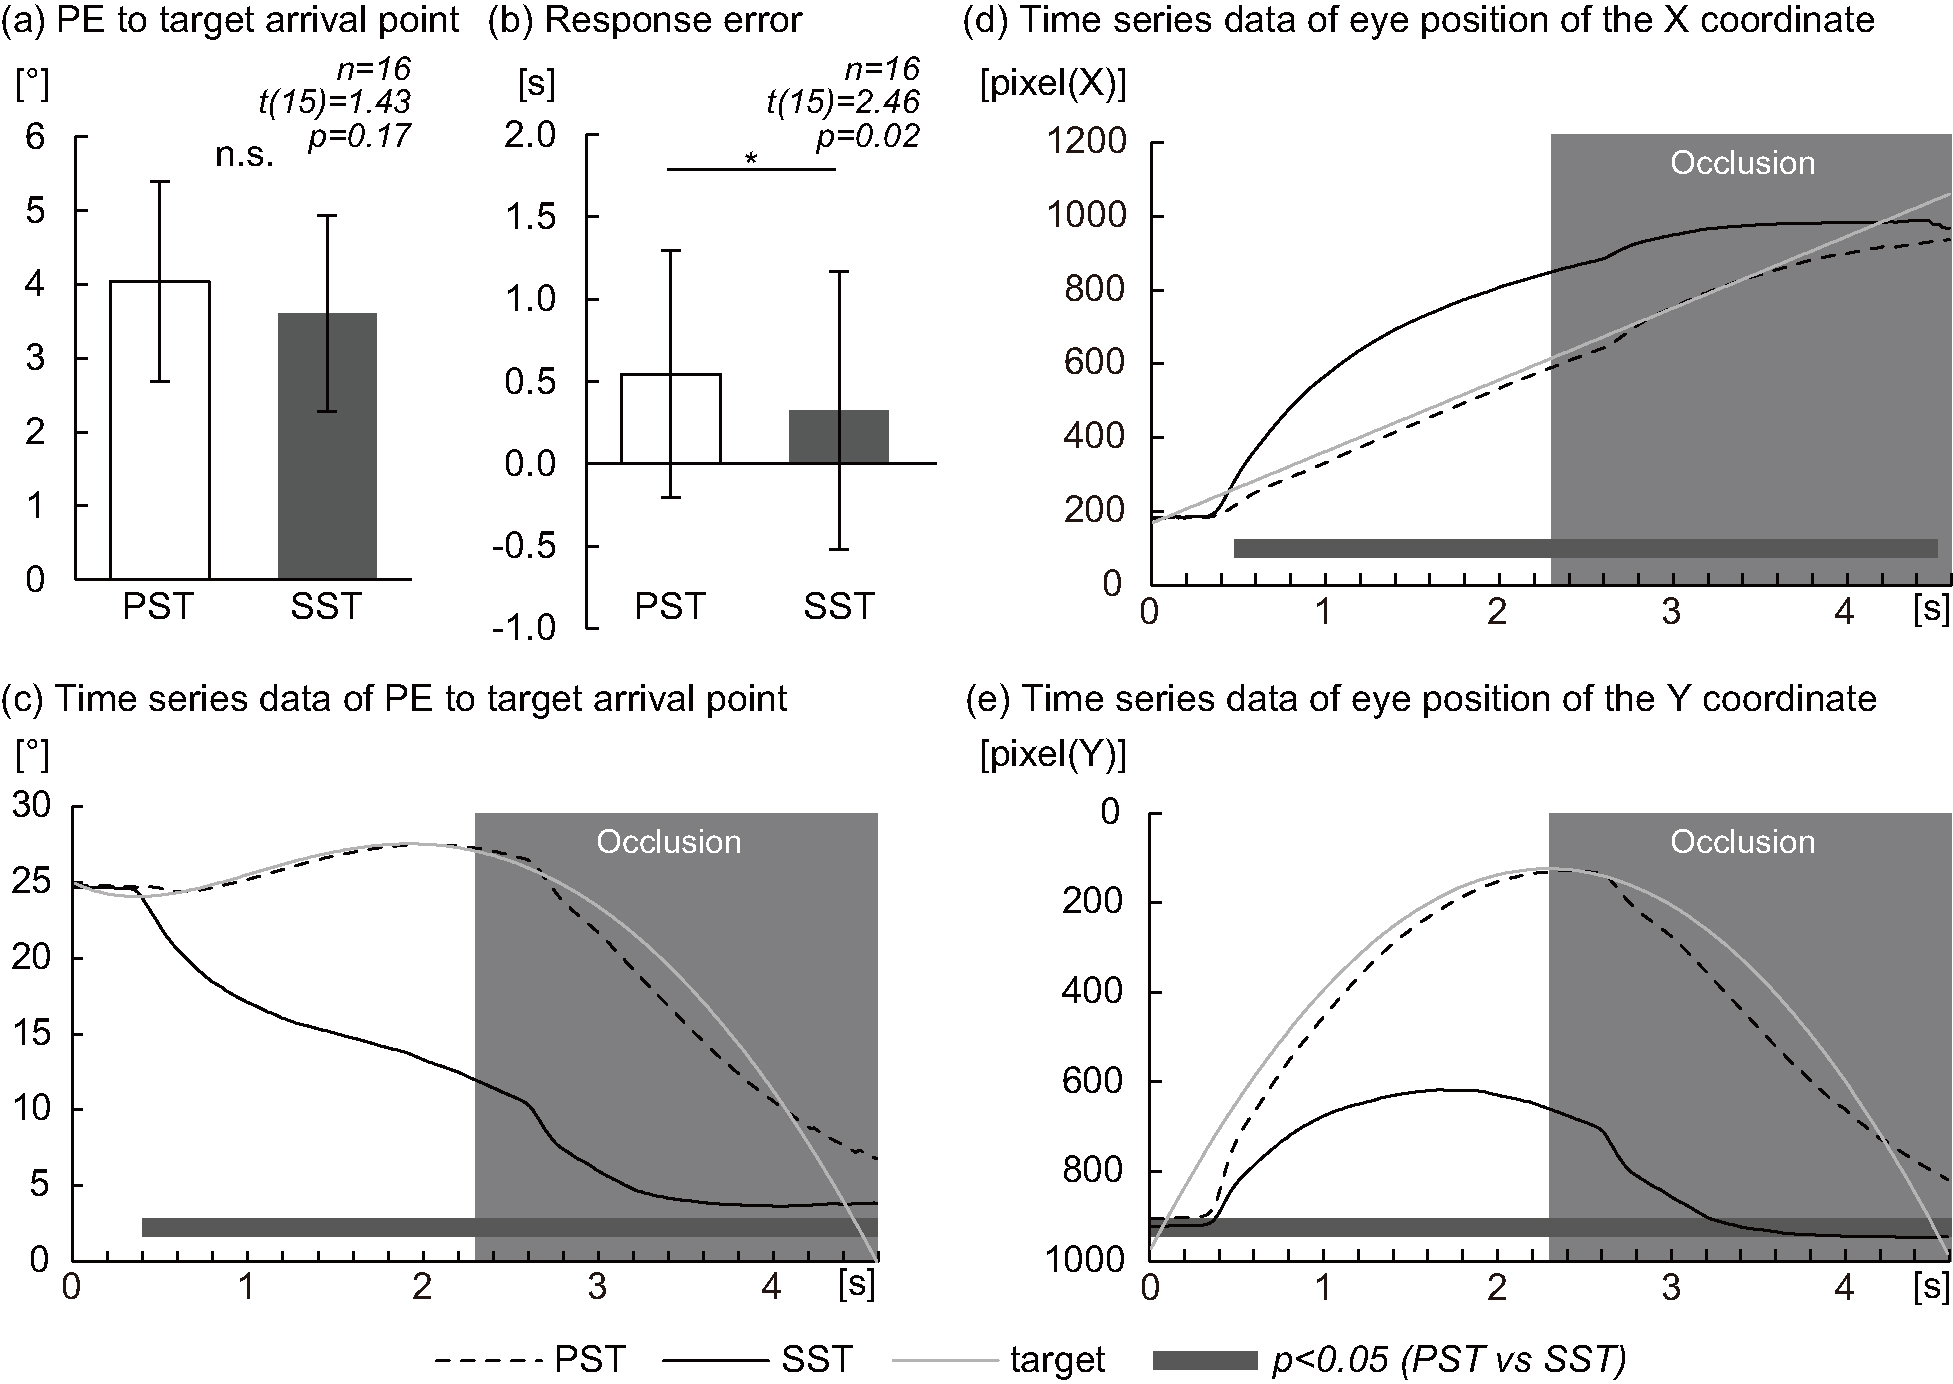 Fig. 2.
Eye position (Pursuit Strategy Task vs Saccade Strategy
Task). (a) Graph of the position error (PE) at response to the target arrival
point between the Pursuit Strategy Task (PST) and Saccade Strategy Task (SST).
(b) Graph of response error between the PST and SST. (c) Graph of time series
data of the PE to the target arrival point during the PST (dashed lines) and the
SST (smooth lines); the moving target is shown by gray lines. (d) Graph of time
series data of the eye position in the X coordinate during the PST (dashed lines)
and the SST (smooth lines); the moving target is shown by gray lines. (e) Graph
of time series data of the eye position in the Y coordinate during the PST
(dashed lines) and the SST (smooth lines); the moving target is shown by gray
lines. (a) n.s.: not significant. (b) *p
Using response error as a parameter, participants showed a delayed reaction time
in the PST compared with the SST (0.54
The time series data of the PE to the target arrival point during each task are
presented in Fig. 2c. Compared with the PST, the PE to target arrival point
during the SST was significantly decreased at 0.40–4.60 s (0.40–0.56 s;
p
The time series data of the eye position of the X coordinate during each task
are presented in Fig. 2d. Compared with the PST, the X coordinate eye position
during the SST was significantly increased at 0.48–4.52 s (0.48–0.66,
4.46–4.52 s; p
Time series data of the Y-coordinate eye position during each task are presented
in Fig. 2e. Compared with the PST, the eye position of the Y coordinate during
the SST was significantly increased at 0.02–4.60 s (0.02–0.36, 0.46–1.44,
4.46–4.60 s; p
Compared with the Large PE Group at response, the PE at response to target
arrival point in the Small PE Group at response was significantly decreased (2.43
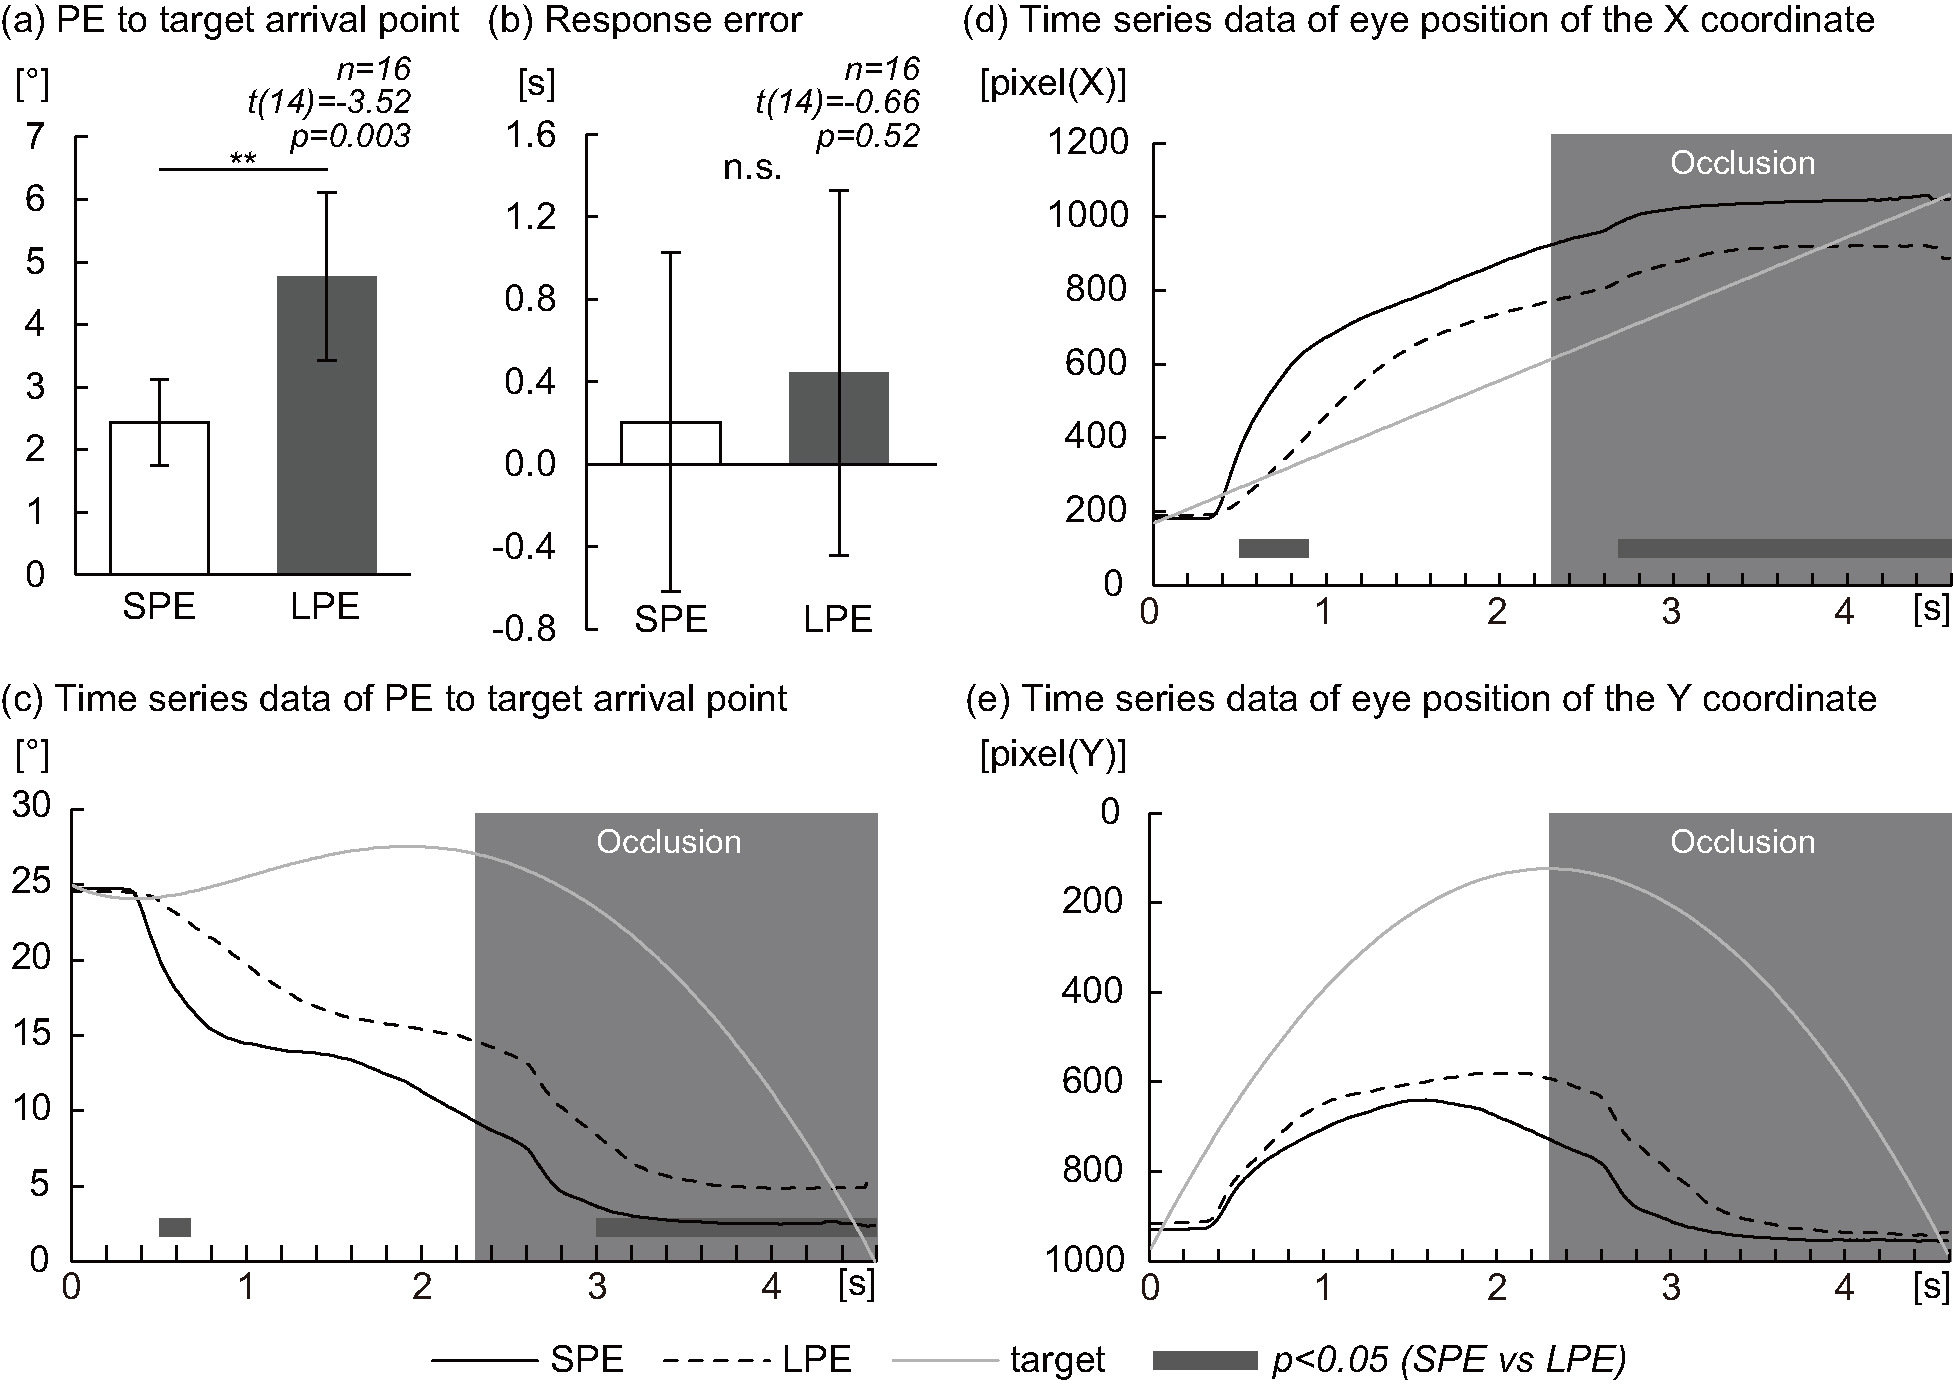 Fig. 3.
Eye position (Small Position Error Group at response vs
Large Position Error Group at response). (a) Graph of the position error (PE) at
response to the target arrival point between the Small Position Error (SPE) Group
at response and Large Position Error (LPE) Group at response. (b) Graph of the
response error between the SPE Group at response and LPE Group at response. (c)
Graph of time series data of the PE to the target arrival point in the LPE Group
at response (dashed lines) and the SPE Group at response (smooth lines); the
moving target is shown by gray lines. (d) Graph of time series data of the eye
position in the X coordinate in the LPE Group at response (dashed lines) and the
SPE Group at response (smooth lines); the moving target is shown by gray lines.
(e) Graph of time series data of the eye position in the Y coordinate in the LPE
Group at response (dashed lines) and the SPE Group at response (smooth lines);
the moving target is shown by gray lines. (a) **p
There was no significant difference in response error to target arrival point
between the Small PE Group at response and the Large PE Group at response (0.20
The PE time series data to the target arrival point during each condition are
presented in Fig. 3c. Compared with the Large PE Group at response, the PE to the
target arrival point in the Small PE Group at response was significantly
decreased at 0.50–0.68 s (p
The time series data of the eye position at the X coordinate during each task
are presented in Fig. 3d. Compared with the Large PE Group at response, the eye
position of the X coordinate of the Small PE Group at response was significantly
increased at 0.50–0.88 s (p
There was no significant difference in the eye position of the Y coordinate between the Small PE Group at response and the Large PE Group at response (Fig. 3e).
We performed non-parametric paired permutation tests to examine the differences
between activity during the PST and SST at each electrode position during the
2.300 s visible section of the trajectory. EEG spectra of low beta frequency
(13–15 Hz) were analyzed using the Hilbert transform. Fig. 4 shows the average
time series EEG data for each task (PST and SST) only for electrodes for which
significant differences were noted. A non-parametric paired permutation test
revealed that low beta frequency activity was higher during the SST than during
the PST at Oz from 0 to 0.010 s (p
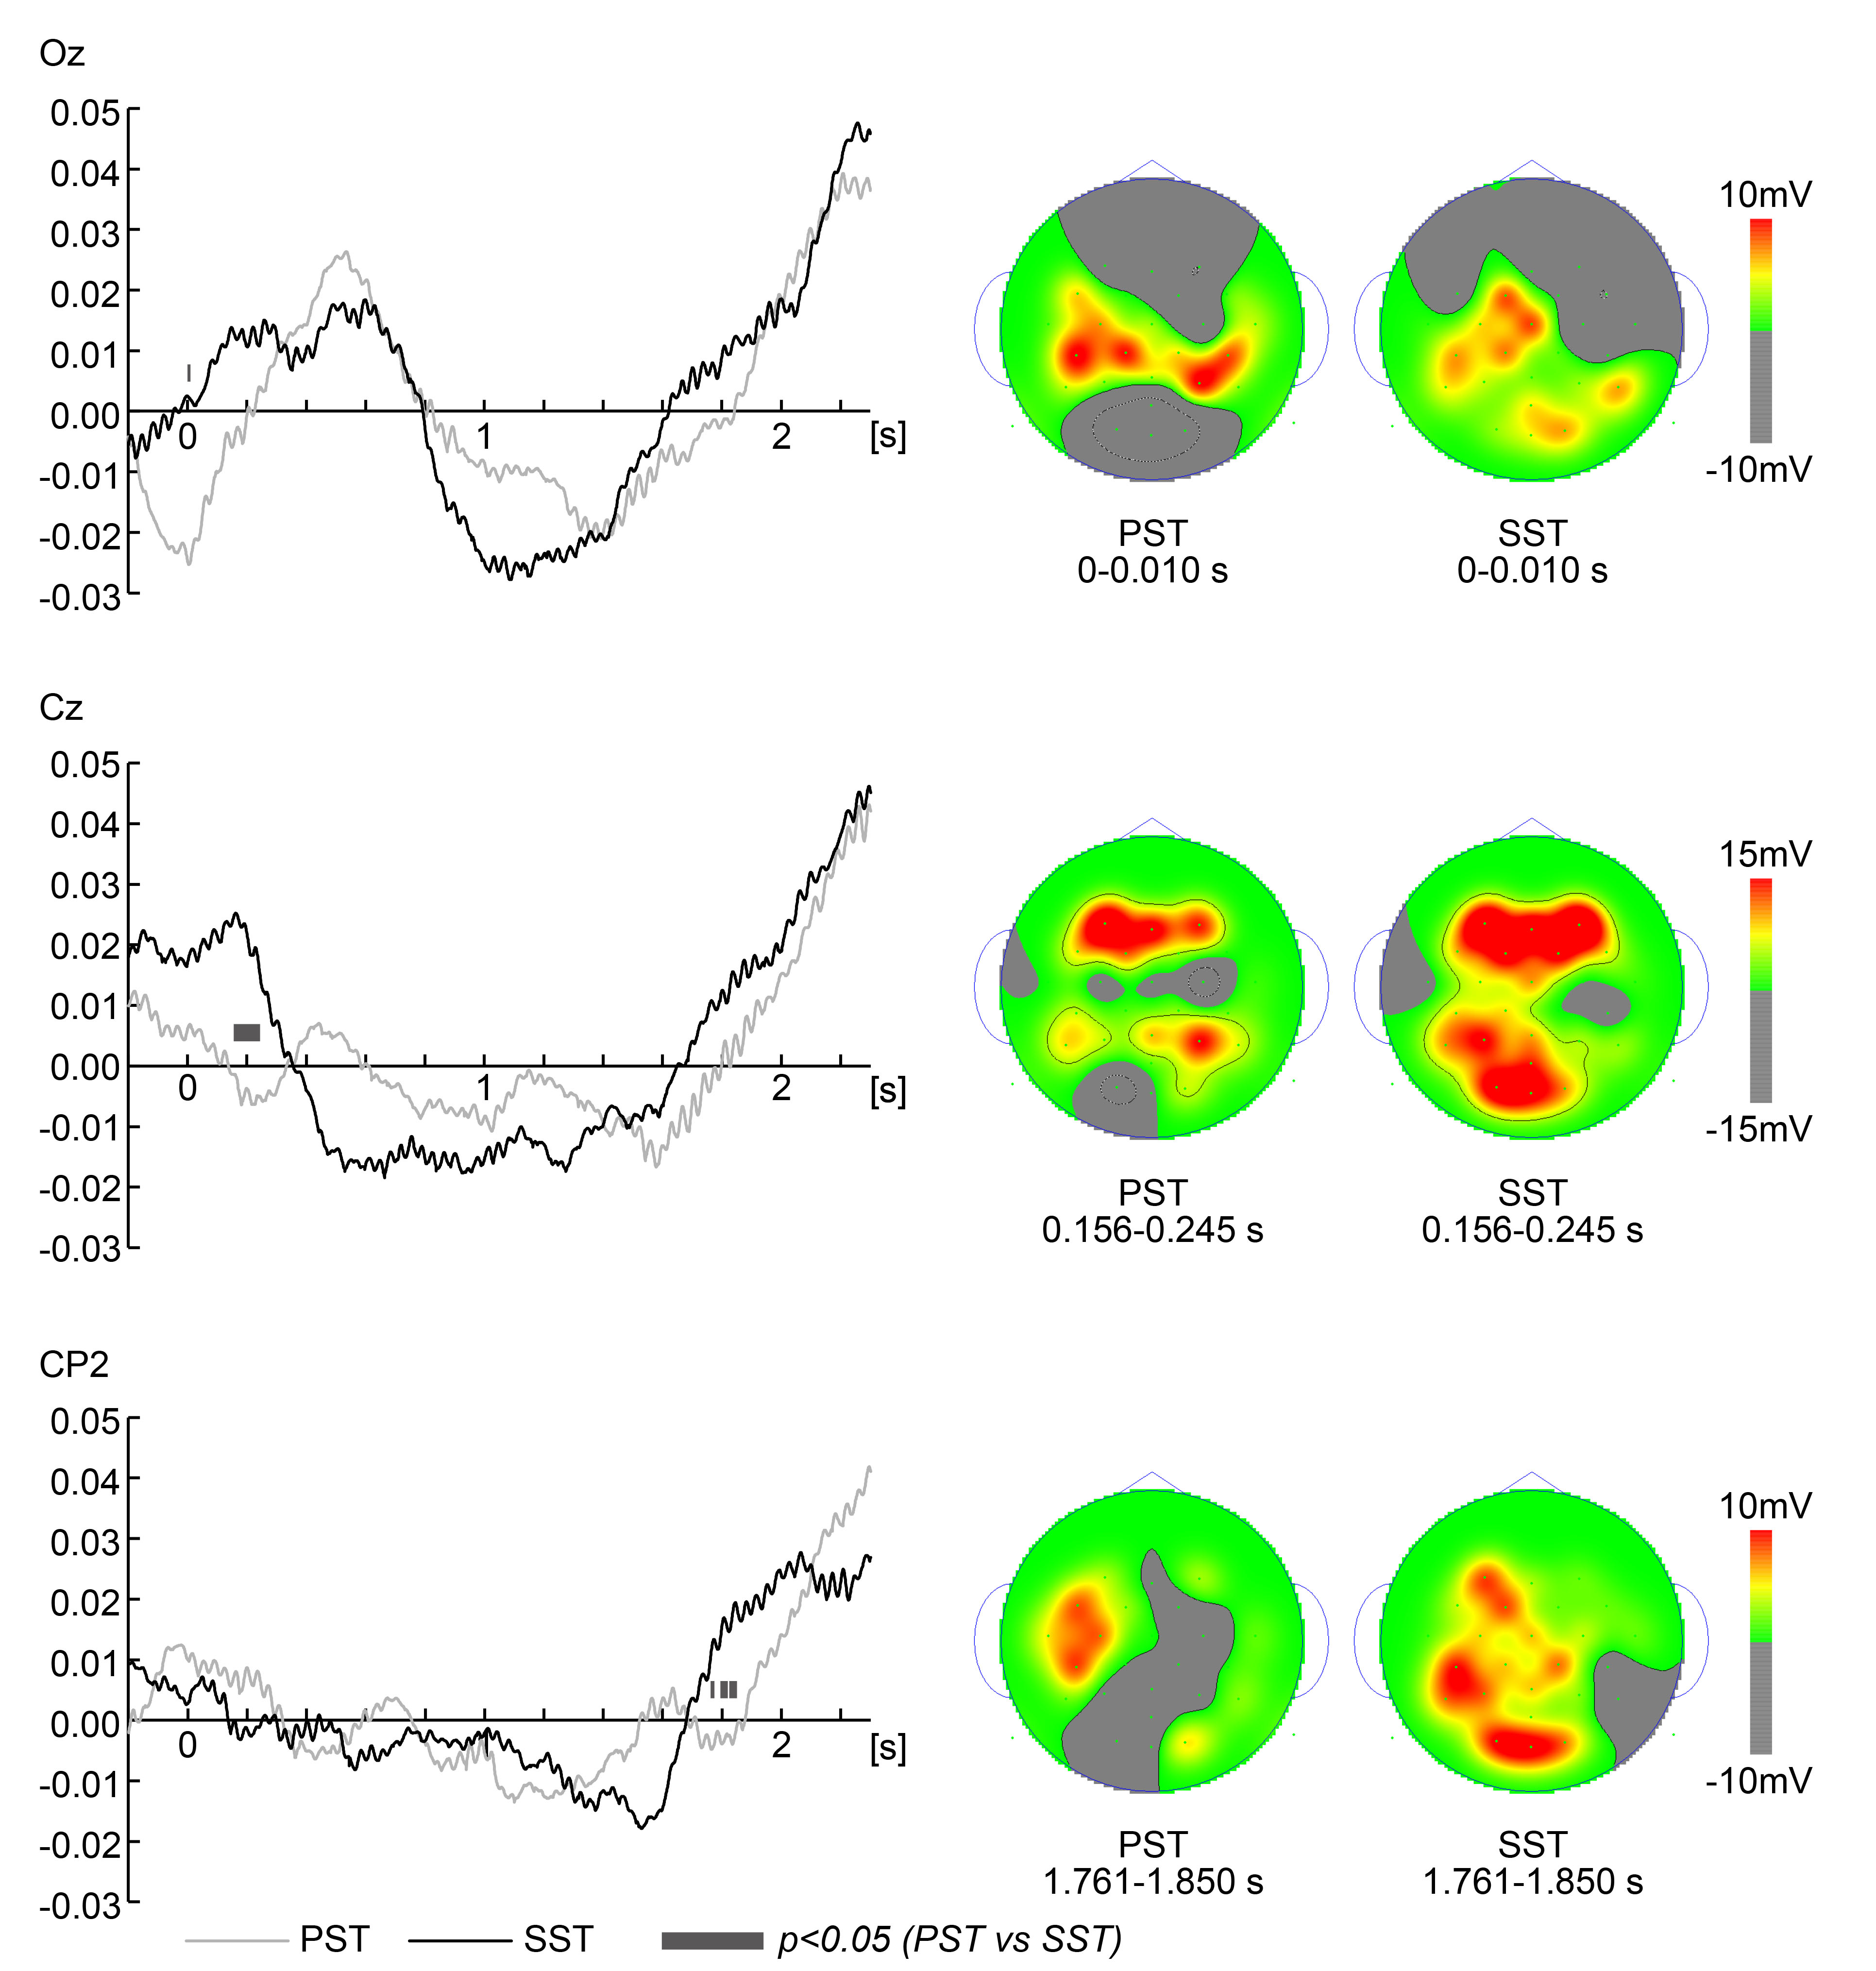 Fig. 4.
Electroencephalography data (Pursuit Strategy Task vs
Saccade Strategy Task). Grand average time series electroencephalography (EEG)
data of low beta frequency (13–15 Hz) activity were analyzed with the Hilbert
transform during the Pursuit Strategy Task (PST) and Saccade Strategy Task (SST)
during the 2.3 s visible section. The left panels show the average time-series
EEG data for each task (PST and SST) only for electrodes for which significant
differences were noted. Smooth and gray lines correspond to the SST and PST,
respectively. The X-axis shows the time of the target from the onset. Black-gray
segments at the bottom indicate a significant difference (t-test
p-value
Additionally, we performed a non-parametric unpaired permutation test to examine
differences between the Small PE Group at response and Large PE Group at response
at each electrode position during the 2.300 s visible section of the trajectory.
EEG spectra of low beta frequency (13–15 Hz) were analyzed using the Hilbert
transform. Fig. 5 shows the average time series EEG data for each task (Small PE
Group at response and Large PE Group at response) only for electrodes for which
significant differences were noted. A non-parametric paired permutation test
revealed that low beta frequency activity was higher in the Small PE Group at
response than in the Large PE Group at P7, from 0.105 to 0.185 s (0.105–0.166 s,
0.168–0.170 s, 0.175–0.185 s; p
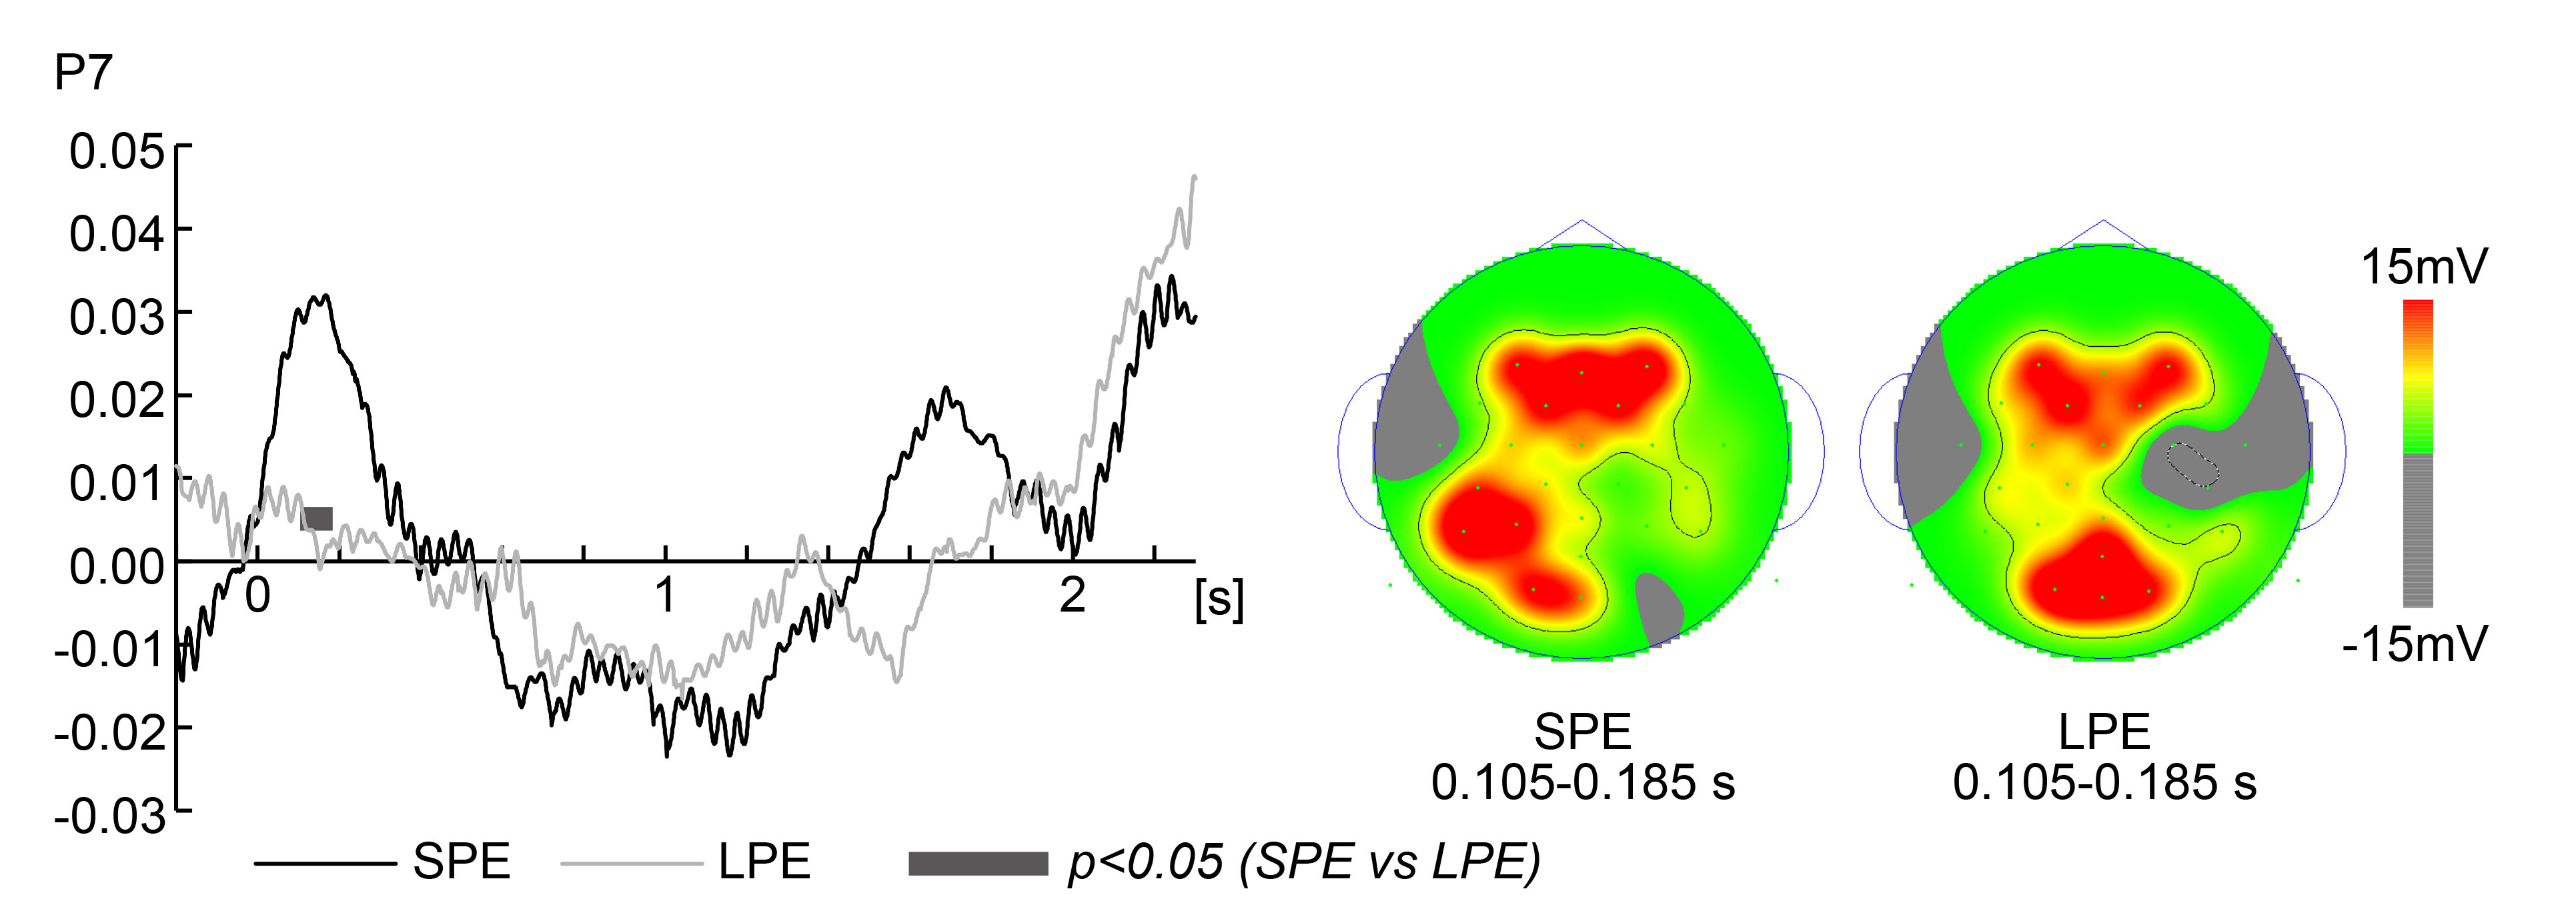 Fig. 5.
Electroencephalography data (Small Position Error Group at
response vs Large Position Error Group at response). Grand average time
series electroencephalography (EEG) data of low beta frequency (13–15 Hz)
activity were analyzed with the Hilbert transform in the Small Position Error
(SPE) Group at response and Large Position Error (LPE) Group at response during
the 2.3 s visible section. The left panels show the average time-series EEG data
for each task (the SPE Group at response and LPE Group at response) only for
electrodes for which significant differences were noted. Smooth and gray lines
correspond to the SPE Group at response and LPE Group at response, respectively.
The X-axis shows the time of the target from the onset. Black-gray segments at
the bottom indicate a significant difference (t-test p-value
There was no significant difference in PE in response to the target arrival point between the PST and the SST. Because the accuracy of gaze tracking performance was not important for the interception accuracy in previous studies, in which the best interception players showed an accuracy of ball tracking similar to that of the worst players [34], it was assumed that it is possible to predict the position and time of arrival of a moving target without tracking it. Therefore, it was clarified that the arrival position can be predicted successfully even if the participant does not “strategically” follow the target with eyes.
The target arrival point during the SST, compared with the PST, was significantly decreased from the PE at point (0.02–4.60 s) to at 0.40–4.60 s point after target onset. Time series data of the eye position of the X- and Y-coordinates were also significantly different between the PST and SST at approximately similar sections. In the PST, the participant was instructed to pursue the target. Therefore, when the pursuit strategy is used, a large PE in time series data to the target arrival point inevitably occurs because the target is followed in this case. A response delay occurs when tracking a target that moves parabolically with pursuit eye movements [15]. Using response error as a parameter, the PST showed a delayed reaction compared with the SST, which can be mentioned as one of the results showing that the PST follows the target. On the other hand, in the SST, the user was instructed to quickly move the eye to the target arrival point as soon as the target arrival point is predicted. Therefore, the SST had a lower PE to the target arrival point at an early stage compared with the PST (Fig. 3c). Especially around 2.70 s, the PE and the Y-coordinate eye position to the target arrival point suddenly dropped. As a result, since the visual information of moving targets cannot be obtained at least in the section where the target is occluded, in the SST, all experimental participants are considered to have moved their eyes to the target arrival point.
Compared with the Large PE Group at response, the PE in response to the target arrival point in the Small PE Group was significantly decreased by approximately 2°. There was no significant difference in response error to the target arrival point between the Small PE Group at response and the Large PE Group at response. This result is natural because the participants were grouped based on PE at response rather than on the response error in comparison.
Then, with the time series results, compared with the Large PE Group at response, the PE to the target arrival point in the Small PE Group at response was significantly decreased at 0.50–0.68 s after target onset. Time series data of the eye position of the X-coordinate were also significantly different between the Small PE Group and Large PE Group in response to approximately similar sections. On the other hand, there was no significant difference in time series data of the eye position of the Y-coordinate between the Small PE Group and the Large PE Group at response. Since the lack of a direct relationship between the ocular pursuit performance and the participant’s catching ability has been clarified in previous studies, it might be not necessary to continue the pursuit eye movement to accurately predict the target position [34]. Therefore, for the Small PE Group at response, these results suggest that immediately after the target starts moving, the participant detects the speed and direction of the target, knows the target arrival point at this early stage (0.50–0.68 s), does not follow the target, and directs the eyes to the vicinity of the target arrival point. Additionally, compared with the Large PE Group at response, the PE to the target arrival point in the Small PE Group at response was significantly decreased at 3.00–4.60 s after target onset. The significant difference in this period is considered to be the result reflecting the PE at response.
First, as for both topography in Fig. 4, the potential in the frontal region is high in both PST and SST. The frontal regions become functional by 3 to 4 months of age, forming part of the cerebellar network that predicts eye movements [35]. By 4 months of age, the prefrontal cortex is functional, as evidenced by ERPs, particularly for anticipatory or reactive saccades [36]. Canfield and Kirkham [37] suggest that frontal eye field may be operative even earlier, by 3 months of age. In other words, frontal regions play a very important role as a basic level of executive function (early cortical network) when performing tasks that require anticipatory or reactive saccades, such as the tasks in this study. Therefore, the topography results with high potentials in the frontal region in both PST and SST might reflect the “predictive control of eye movements” associated with “maturation of the visual motor system and its relationship with large-scale brain networks”.
In the following EEG discussion section, with reference to Koessler et al. [38], we will identify the region located at the electrode where a significant difference has occurred, and proceed with the discussion based on the localization of that region. Koessler et al. [38] clarified the cranio-cerebral correlation in the 10-10 system, facilitating improved accuracy of brain surface imaging and aiding electrophysiological analyzes such as the localization of cortical generators in superficial focal areas [38]. Conversely, Lantz et al. [39] state that a setup of at least 63 electrodes is essential for optimal source localization of the underlying EEG source. The number of electrodes recorded in this study is smaller than that. Therefore, multiple neural generators may contribute to the evoked activity recorded at a particular electrode. This compromises the precise correspondence between a single electrode and its responsible neural source. As we proceed with the ensuing discussion, we will take the above points into consideration.
Oz corresponds to brodmann area (BA) 18 (0.3
Cz corresponds to BA4 (0.8
CP2 corresponds to BA7 (25.8
P7 corresponds to BA19 (–55.9
In the present study, we aimed to clarify the activity pattern of the cerebral cortex by recording EEG during visual pursuit and saccade strategies to predict the arrival position of a visual target. In addition, we clarified the differences in the EEG of those who could predict the arrival position well using the saccade strategy compared to those who were not proficient. Our results indicate that low beta EEG activity at the Oz, Cz, and CP2 electrodes was significantly higher during the SST than during the PST. This EEG activity during the SST may reflect visuospatial attention to the moving target, the tracking of moving targets, and the focus on the final destination position. In addition, our results indicate that low beta EEG activity at P7 was significantly higher in the group showing a small PE than in the group showing a large PE at response. This EEG activity may more accurately detect the speed and direction of the moving target by the small PE group at response.
The datasets generated during and/or analyzed during the current study are available from the corresponding author on reasonable request.
RK, KO, and MT designed and performed the experiments. RK analyzed the data and wrote the manuscript. KO and MT performed the critical review. All authors contributed to editorial changes in the manuscript. All authors read and approved the final manuscript. All authors have participated sufficiently in the work and agreed to be accountable for all aspects of the work.
All participants provided written consent. The study was approved by the Ethics Review Committee on Research with Human Subjects, College of Industrial Technology, Nihon University (approval number: S2020–008) in accordance with the Declaration of Helsinki.
Not applicable.
This research was funded by JSPS KAKENHI Grant-in-aid for Young Scientists (Grant Number JP20K19549).
The authors declare no conflict of interest.
References
Publisher’s Note: IMR Press stays neutral with regard to jurisdictional claims in published maps and institutional affiliations.