


1 Department of Pharmacology, Graduate School of Pharmaceutical Sciences, Tohoku University, 980-8578 Sendai, Japan
2 Florey Institute of Neuroscience and Mental Health, University of Melbourne, Melbourne, VIC 3010, Australia
Abstract
Neurodegenerative dementias and related diseases, such as Alzheimer's disease, dementia with Lewy bodies, and Parkinson's disease have no fundamental cure yet. Degenerative proteins begin to accumulate before the onset of the symptoms of these diseases, and the early detection of these symptoms can lead to early therapeutic intervention. Therefore, early and simpler diagnostic methods are required. This review focuses on blood biomarkers, which are less expensive and easier to use than cerebrospinal fluid biomarkers and diagnostic imaging. A variety of approaches exist for establishing diagnostic methods for neurodegenerative dementias using blood biomarkers, such as disease differentiation using a single molecule, methods that combine multiple biomarkers, studies that search for important markers by comprehensively analyzing many molecules, and methods that combine other data. Finally, we discuss the future prospects for blood biomarker research based on the characteristics of each approach.
Keywords
- blood biomarkers
- dementia
- neurodegenerative disease
- diagnosis
- discrimination technique
Despite years of research, fundamental cures for neurodegenerative dementias and
related neurodegenerative diseases (NDD), such as Alzheimer’s disease (AD),
dementia with Lewy bodies (DLB), and Parkinson’s disease (PD), remain poorly
defined. In these diseases, the accumulation and aggregation of misfolded
proteins are thought to cause neurodegeneration and neuronal cell death,
resulting in cognitive and motor impairments. Specifically, AD
is thought to be caused by amyloid-
The misfolded proteins begin to accumulate long before the onset of cognitive and motor impairments, which are the major symptoms of NDD [3, 4, 5, 6]. In other words, there is a time lag between the aggregation of misfolded proteins and the onset of serious symptoms; therefore, by the time the disease is diagnosed, it has already progressed significantly. The early detection of these signs before the onset of serious symptoms due to neurodegeneration can lead to early therapeutic intervention.
The overlap between symptoms and pathological mechanisms of NDD is complex
[7, 8]. For example, dementia, which has similar symptoms, has some variations in
pathological mechanisms and is categorized into different diseases, such as AD,
DLB, and frontotemporal dementia (FTD). Both PD and DLB are caused by
Research on the molecular biomarkers related to these diseases may provide a breakthrough in solving the problems that make NDD diagnosis and treatment difficult. This review summarizes the research on blood biomarker-based NDD diagnosis, a relatively easily accessible approach, and discusses the current state of research and future prospects.
Cerebrospinal fluid (CSF) biomarkers for the diagnosis of NDD have been widely
studied. Some CSF biomarkers have already been incorporated into diagnostic
criteria, such as the decrease of A
Blood biomarkers, similar to CSF biomarkers, have been studied by examining
changes in a single molecule. Specifically, disease-causing proteins such as
A
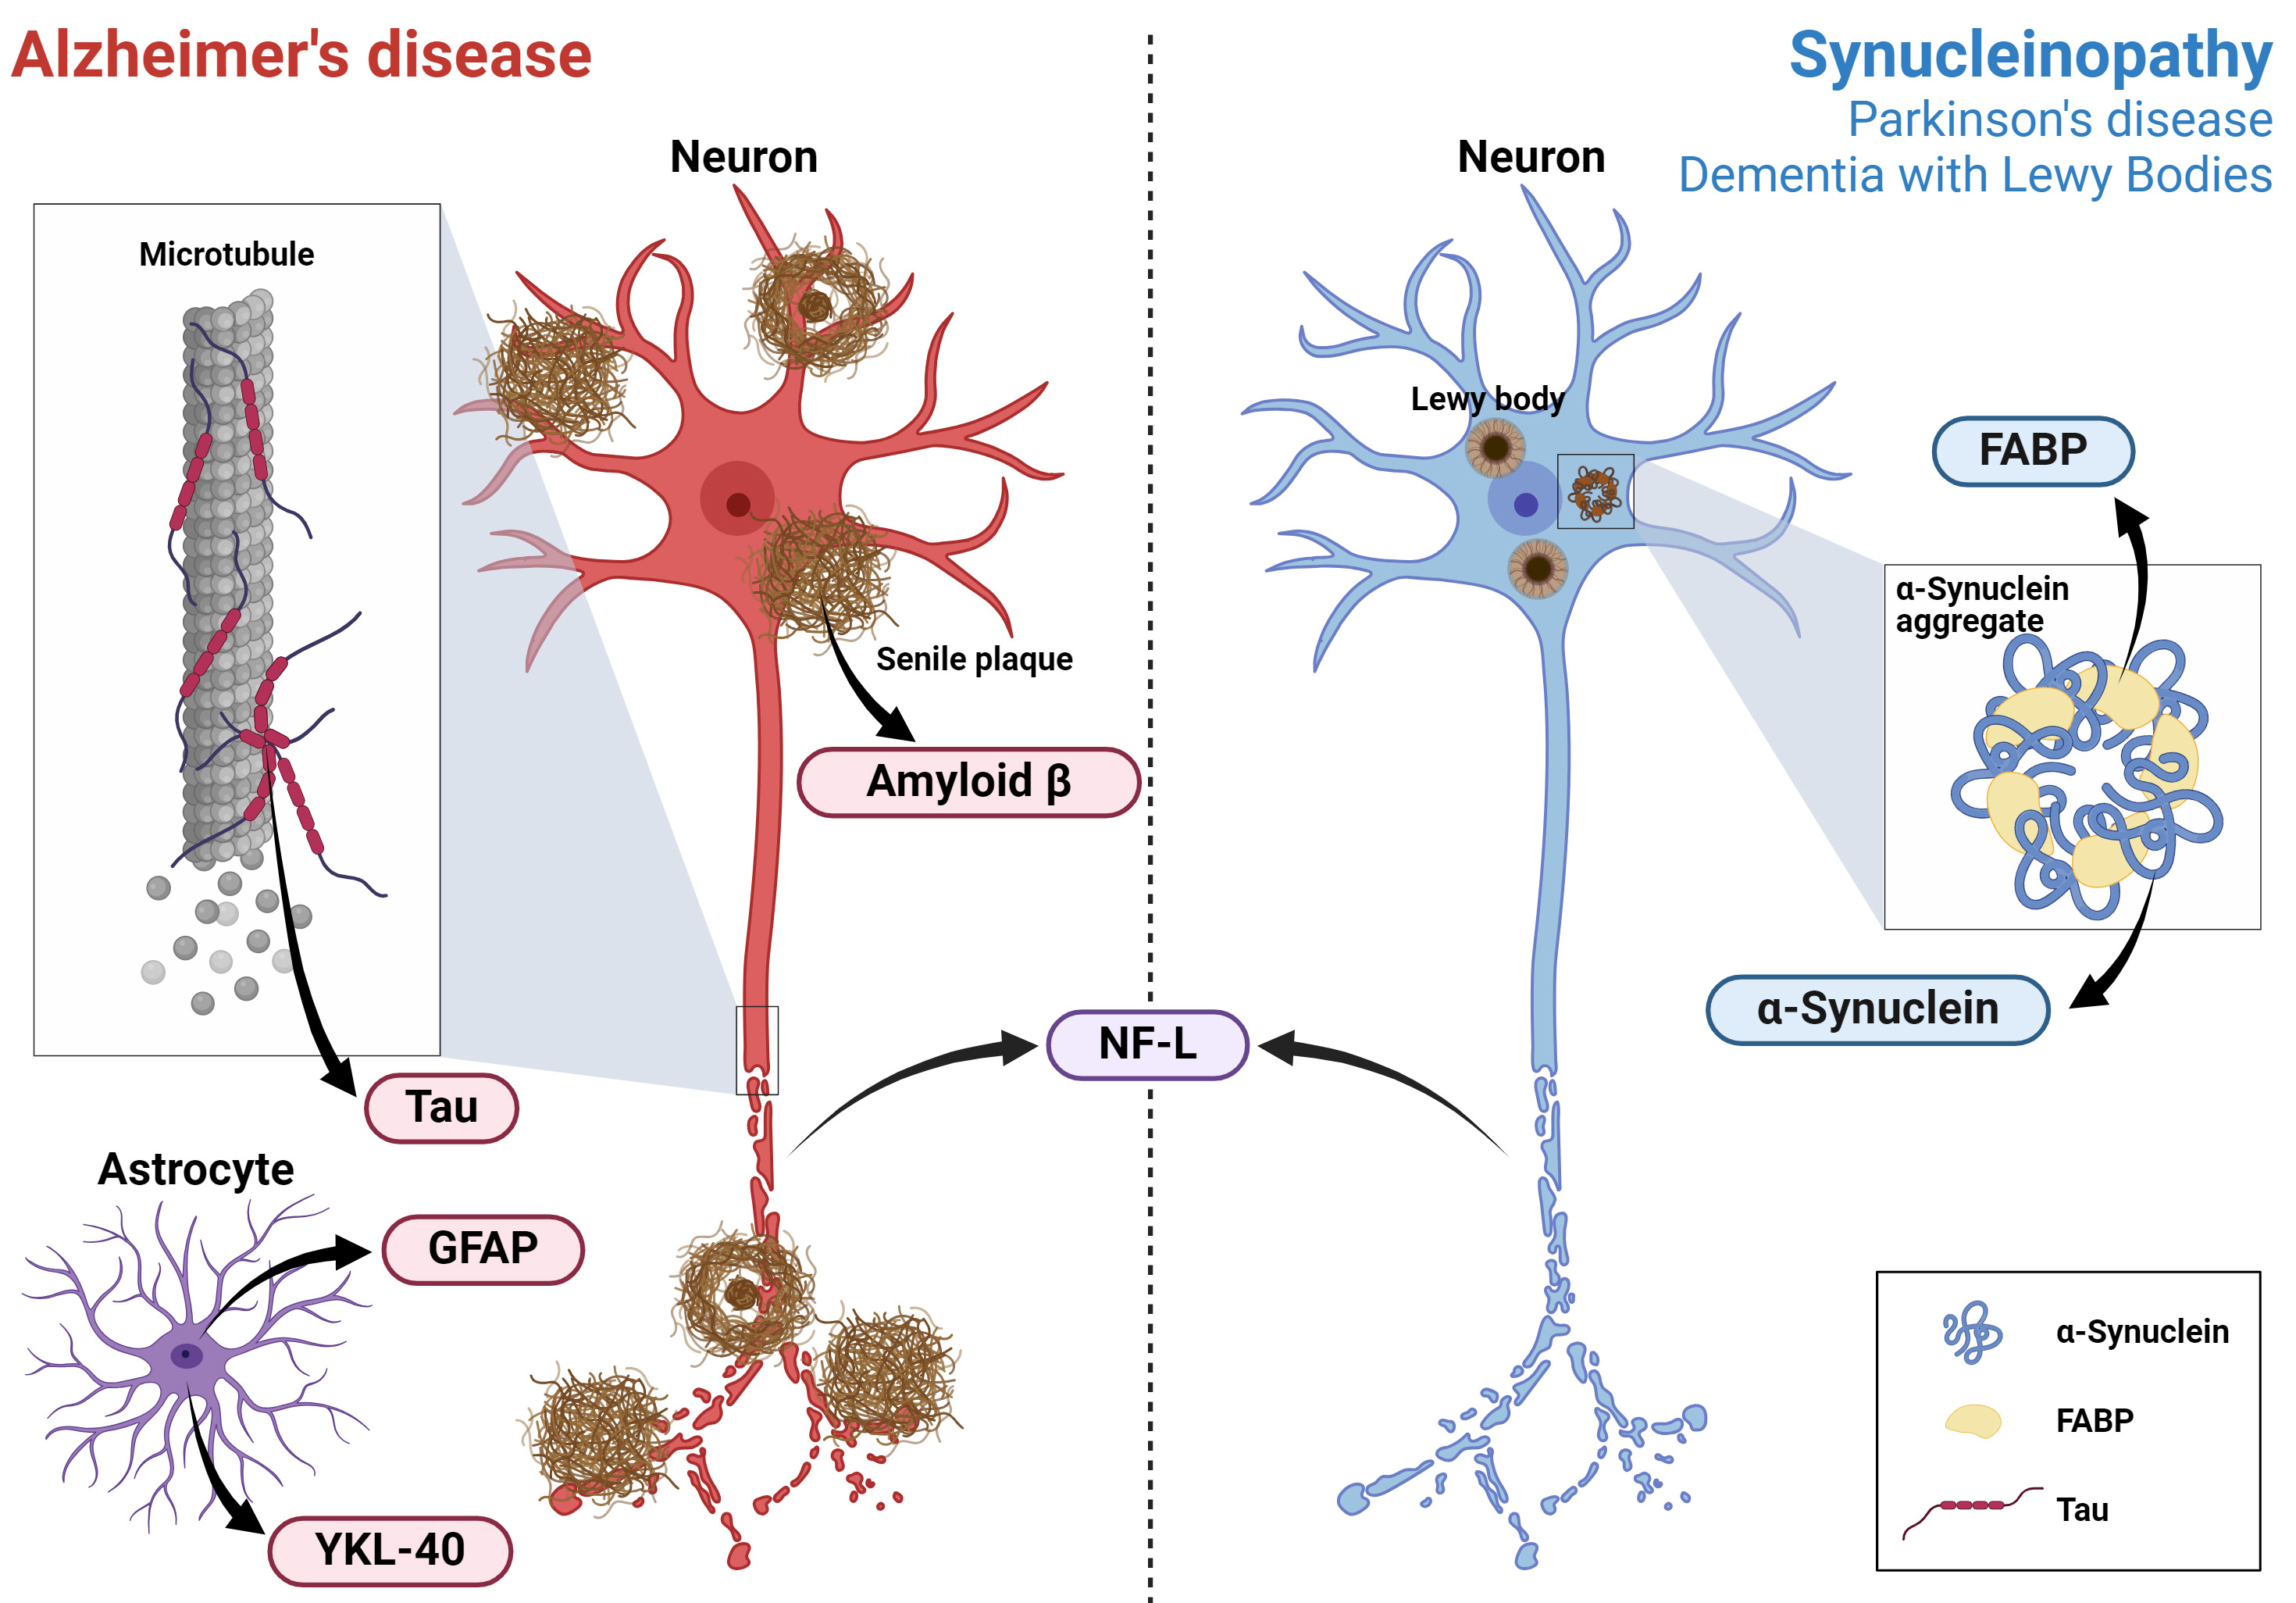 Fig. 1.
The estimated sources of the basic biomarkers for NDD diagnosis. Estimated sources of the basic biomarkers of Alzheimer’s disease and synucleinopathy (Parkinson’s disease and dementia with Lewy bodies), which were primarily discussed in Chapter 2, are graphically illustrated. NDD, neurodegenerative diseases; GFAP, glial fibrillary acidic protein; NF-L, neurofilament-light; FABP, fatty acid-binding protein. Created with BioRender.com (https://www.biorender.com/).
A
Tau, another causative protein of AD—specifically total Tau (t-tau) and phosphorylated Tau (p-tau)—has been studied as a candidate biomarker. Plasma t-tau levels are significantly increased in patients with AD [18]. Regarding p-tau levels, p-tau181, p-tau217, and p-tau231, which have different phosphorylation sites, have been studied [19]. Recent studies have reported that p-tau levels are elevated in patients with AD, unlike in those with other types of dementia [20, 21, 22].
Neurofilament, which consists of four subunits: neurofilament-light (NF-L),
neurofilament-middle (NF-M), neurofilament-heavy (NF-H),
Glial fibrillary acidic protein (GFAP) is an intermediate filament protein found
specifically in the astrocytes of the central nervous system, non-myelinating
Schwann cells of the peripheral nervous system, and enteric glial cells that
maintain the cytoskeletal structure and mechanical strength of glial cells [33].
In neurological diseases, astrocyte disruption releases GFAP from tissues into
the blood and is considered a biomarker of neurological damage [34].
Meta-analysis has shown that blood GFAP levels are higher in the
A
In addition to the molecules discussed above, various other molecules have been
investigated as candidate biomarkers for NDD. For example, plasma levels of
YKL-40 are significantly higher in patients with AD than in healthy participants
[36]. YKL-40, also known as chitinase 3-like protein 1, is a 40-kDa heparin- and
chitin-binding glycoprotein secreted by various cell types and is abundant in
neuroinflammatory astrocytes [37, 38, 39]. Several subtypes of fatty acid-binding
protein (FABP), a protein involved in lipid metabolism, are elevated in patients
with NDD [40, 41, 42, 43]. FABP plays an important role in the aggregation and toxicity
of
Chapter 2 introduces the studies that have attempted to diagnose and differentiate NDD using a single molecule. This chapter introduces studies that combine multiple biomarkers to distinguish between diseases or simultaneously classify multiple diseases. Diseases that can be differentiated based on each biomarker combination presented in this chapter are shown in Fig. 2. This chapter presents the findings categorized by disease coverage.
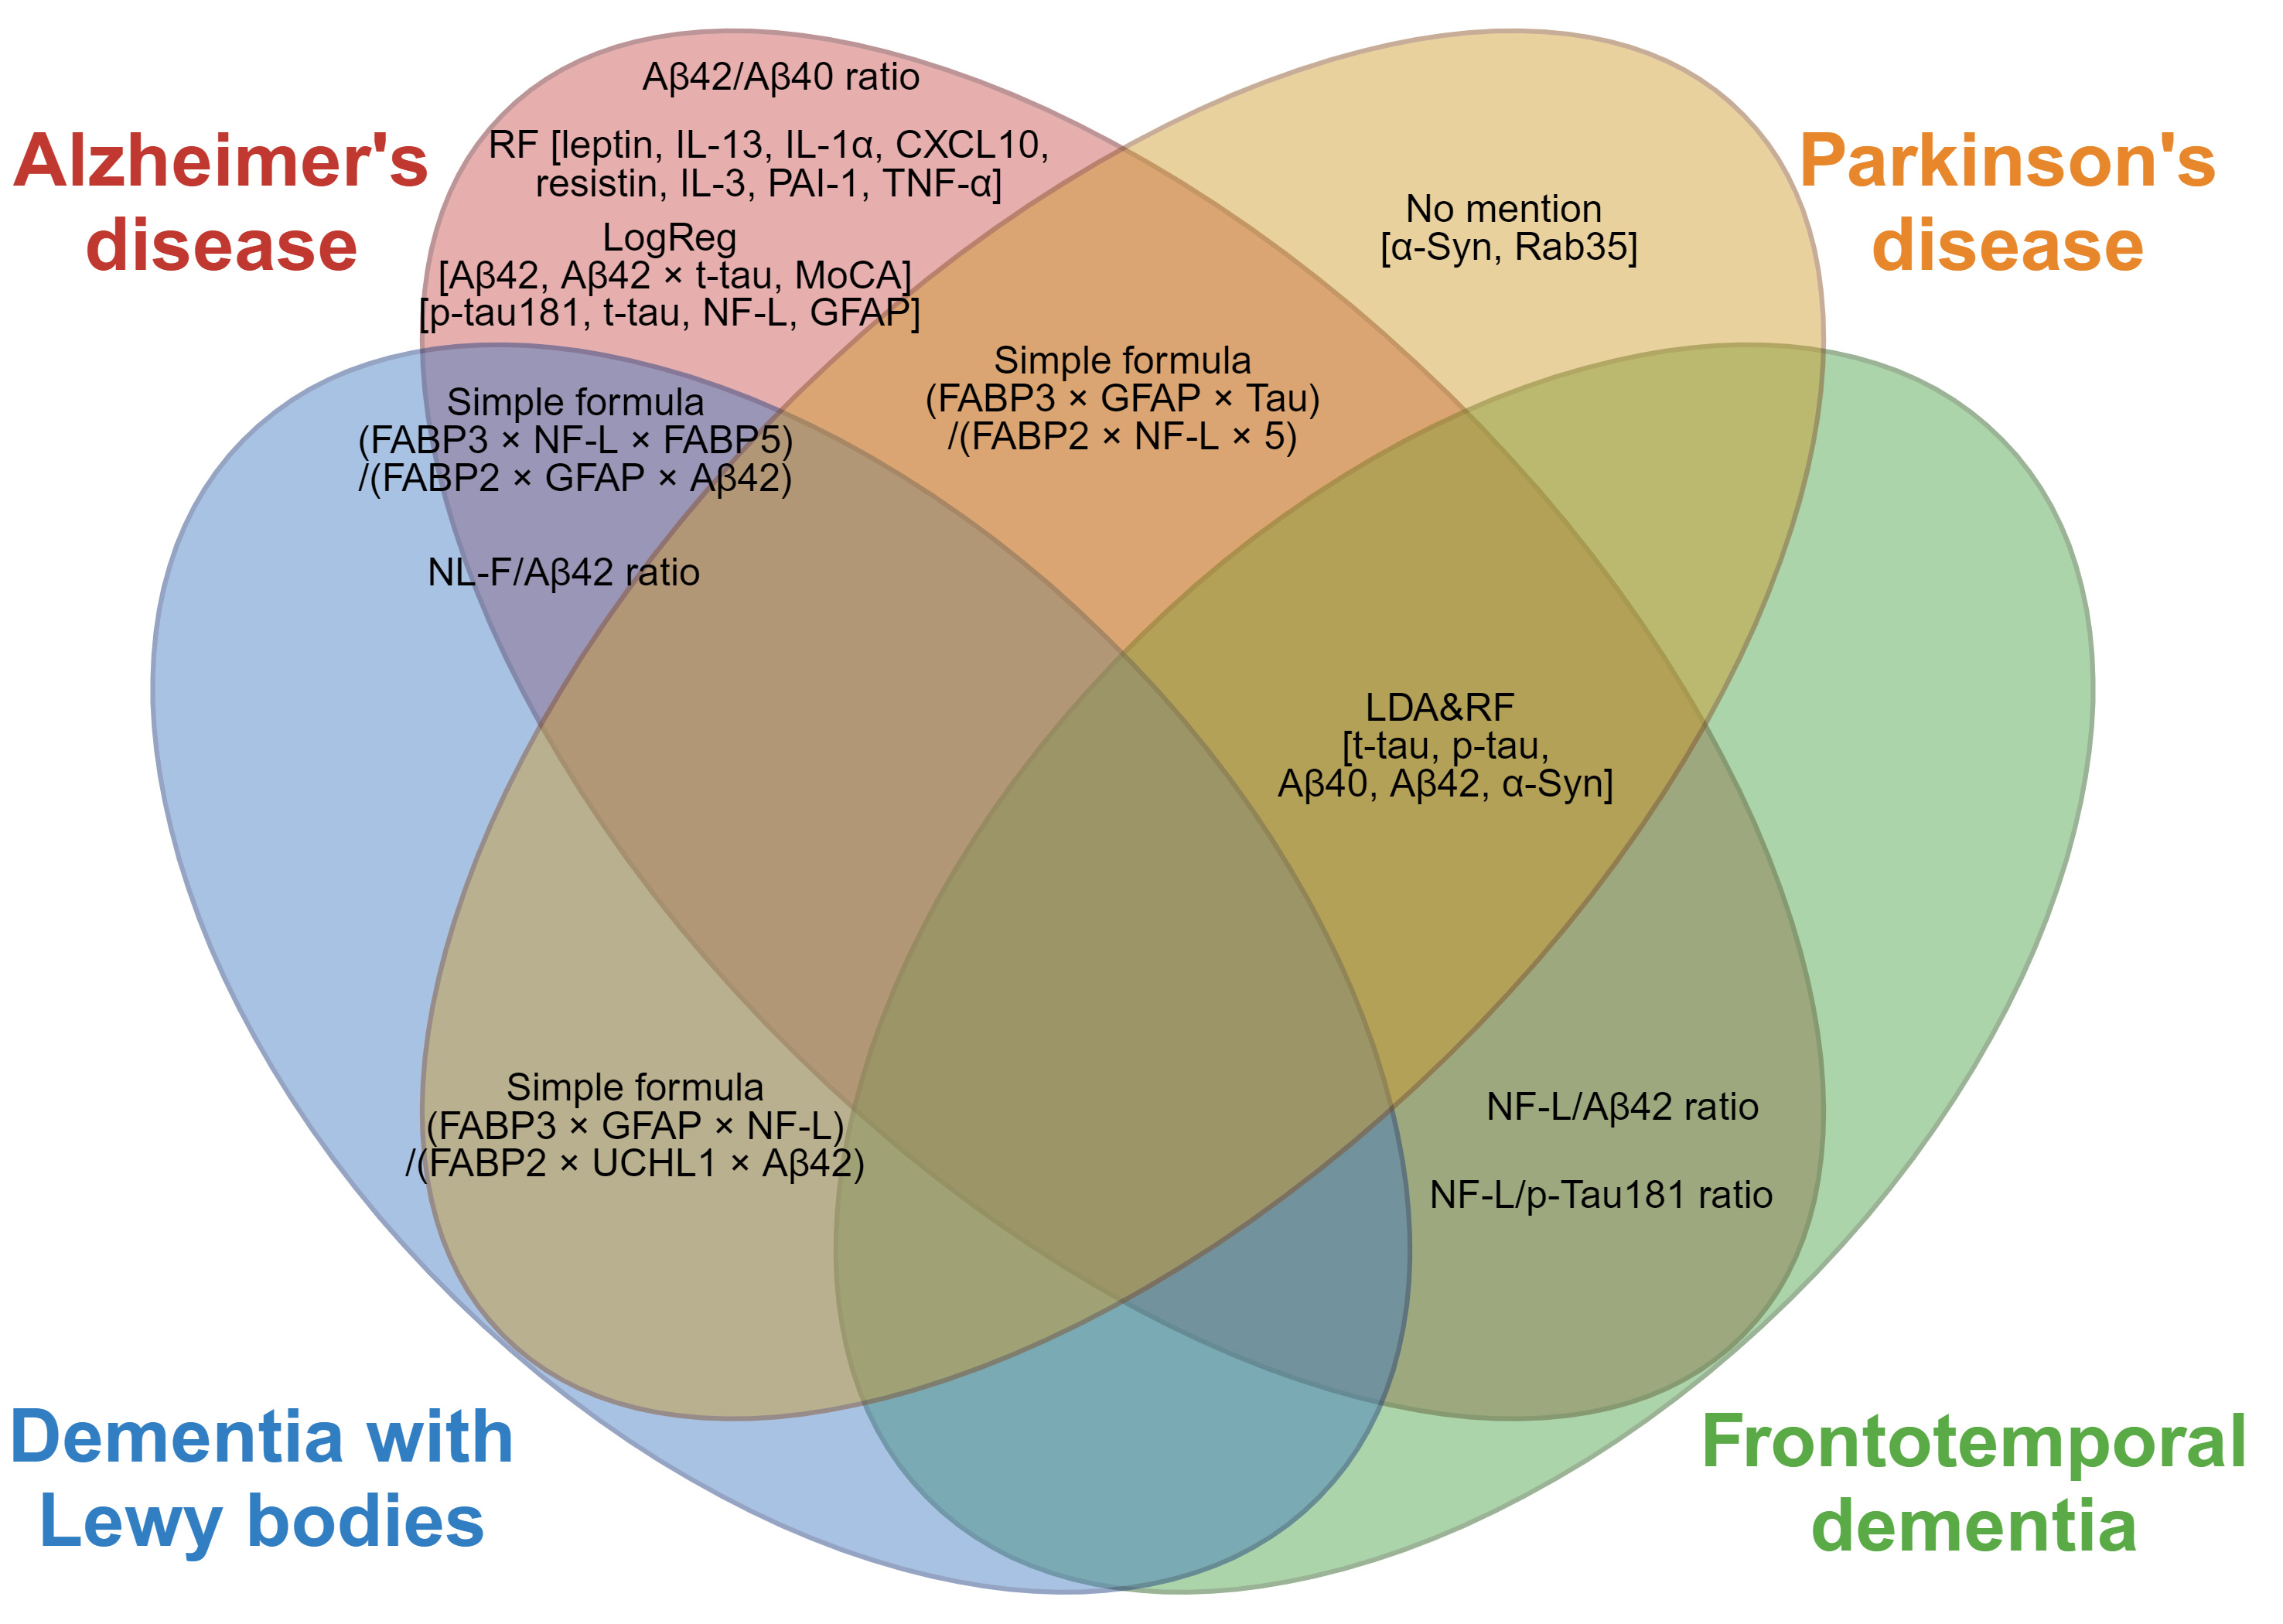 Fig. 2.
A disease differentiation index that combines multiple
biomarkers. Red, orange, blue, and green in the Venn diagram represent
Alzheimer’s disease, Parkinson’s disease, dementia with Lewy bodies, and
frontotemporal dementia, respectively. The indicators shown in the overlapping
ellipses are the indicators for differentiating these diseases. The indicators in
the non-overlapping areas are used to differentiate between healthy participants
and patients with the disease. LogReg, logistic regression; LDA, linear
discriminant analysis; RF, random forest; A
A
It has also been reported that the NF-L/A
As an approach to logistic regression by combining multiple indicators, a
combination of A
Eight biomarker molecules, including leptin, interleukin (IL)-13,
IL-1
A combination of
A scoring method combining FABP2, FABP3, FABP5, NF-L, ubiquitin C-terminal
hydrolase 1 (UCHL1), GFAP, Tau, A
A method combining p-tau181 and NF-L to differentiate FTD from AD has been previously reported [61]. According to this study, although p-tau181 and NF-L alone could not distinguish FTD from AD, a diagnostic algorithm incorporating the NF-L/p-tau181 ratio was used to improve the diagnostic accuracy between FTD and AD.
Although the methods described above differentiate between the two types of
diseases, attempts have been made to classify three or more diseases
simultaneously. t-tau, p-tau, A
This chapter presents the candidate biomarker molecules identified in studies that have comprehensively measured dozens to hundreds of biomarkers. The approaches and the molecules of particular importance for each approach are summarized in Table 1 (Ref. [54, 63, 64, 65, 66, 67, 68, 69, 70, 71, 72, 73, 74, 75, 76]). These methods have determined the importance of several biomarkers for disease differentiation. In these studies, plasma or serum were used as the assay sample. The sample types used in each study are presented in Table 1. Although there are reports that hemocytes, such as red blood cells [27] and platelets [77], also contain important disease-related molecules, this report focuses on widely reported studies using plasma and serum.
| Study | Total validated biomarkers | Sample | Measurement methods | Target disease | Important biomarkers |
| Ray et al., 2007 [76] | 120 | Plasma | Sandwich ELISA | AD, MCI | angiopoietin 2, CCL5, CCL7, CCL15, CCL18 (PARC), CXCL8, EGF, G-CSF, GDNF, ICAM-1, IGFBP-6, IL-1 |
| O’Bryant et al., 2010 [69] | 108 | Serum | Luminex xMAP | AD | ACE/CD143, angiopoietin 2, apolipoprotein C-III, C-reactive protein, CCL18 (PARC), cancer antigen 125, cancer antigen 19-9, carcinoembryonic antigen, creatine kinase MB, eotaxin-3, FAS, Fas ligand, ferritin, fibrinogen, IL-5, IL-7, IL-10, lipoprotein (a), MCP-1, MIF, MIP1 |
| Hu et al., 2012 [70] | 190 | Plasma | Luminex xMAP | AD, MCI | APOE, BNP, C-reactive protein, pancreatic polypeptide |
| Soares et al., 2012 [71] | 146 | Plasma | Luminex xMAP | AD | APOE, eotaxin-3, pancreatic polypeptide, NT-proBNP, MMP1, tenascin C |
| O’Bryant et al., 2014 [65] | 21 | Serum | MSD | AD | C-reactive protein, ICAM-1, IL-5, IL-6, IL-7, IL-10, TNF- |
| Olazarán et al., 2015 [73] | 495 | Plasma | UPLC-MS | AD, MCI | DHA, alanine, aspartate, deoxycholic acid, glutamate, phosphatidylethanolamine [PE(36:4)], sphingomyelin [SM(39:1)] |
| Williams-Gray et al., 2016 [66] | 11 | Serum | MSD | PD | IL-1 |
| Pedrini et al., 2017 [67] | 22 | Plasma | MSD | AD | eotaxin-3, IL-10, IL-12/23p40, leptin, PYY |
| Yu et al., 2018 [54] | 33 | Serum | Luminex xMAP | AD | CXCL10, IL-1 |
| Kim et al., 2019 [74] | 883 | Plasma | UPLC-MS/MS | AD, MCI | 12,13-DiHOME, 9,10-DiHOME, argininate, aspartate, glutamate, linoleamide (18:2n6), oleamide, palmitamide, stearamide |
| Stamate et al., 2019 [75] | 883 | Plasma | UPLC-MS/MS | AD | 1-(1-enyl-oleyl)-GPE (P-18:1), 1-(1-enyl-palmitoyl)-GPE (P-16:0), 1-(1-enyl-syeatoyl)-GPE (P-18:0), 1-linolenoyl-GPC (18:3), N-(2-furoyl) glycine, adenosine 5′-monophosphate (AMP), aspartate, caprylate (8:0), cysteine-glutathione disulfide, dodecanedioate, glutamate, glycerophosphoethanolamine, glycolithocholate, iminodiacetate (IDA), maltotoriose, methionine sulfone, nicotinamide, phosphoethanolamine, phytanate, taurine |
| O’Bryant et al., 2019 [68] | 25 | Plasma | MSD | NDD | CCL17 (TARC), eotaxin-3, FABP3, IL-5, IL-7, IL-18, neurofilament-light, pancreatic polypeptide, thrombopoietin, |
| PD vs. other NDD | A | ||||
| Walker et al., 2021 [72] | 4877 | Plasma | SomaScan | Dementia | SVEP1, WFDC2, Anthrax toxin receptor 2, Agouti-related protein (AGRP), NT-proBNP |
| Jiang et al., 2022 [63] | 1160 | Plasma | Simoa or PEA | AD | Amine oxidase copper containing 3 (AOC3), CD164, CD8A, caspase 3, centrin 2, gamma-secretase activating protein (GSAP), guanidinoacetate N-methyltransferase (GAMT), human kallikrein 14 (hK14), KLK4, LIF-R, legumain, Lyn, NF-κB inhibitor epsilon, NELL1, PKCθ, peroxiredoxin 1, thymosin |
| Lin et al., 2022 [64] | 38 | Plasma | Simoa or ELISA or Luminex xMAP or MSD | Dementia | Aß42/40, cystatin C, HDL-C, homocysteine, IGFBP-2, leptin, MCP-1, PAI-1, TNF- |
The biomarkers discussed in Chapter 4 are indicated using bold font.
AD, Alzheimer’s disease; MCI, mild cognitive impairment; PD, Parkinson’s
disease; NDD, neurodegenerative disease; ELISA, enzyme-linked immunosorbent
assay; MSD, Meso Scale Discovery; UPLC, ultra-performance liquid chromatography;
MS, mass spectrometry; PEA, proximity extension assay; CCL, C-C motif chemokine
ligand; CXCL8, C-X-C motif chemokine ligand 8; ICAM-1, intercellular adhesion
molecule-1; BNP, brain natriuretic peptide; NT-proBNP, N-terminal prohormone of
brain natriuretic peptide; PYY, peptide tyrosine tyrosine; PAI-1, plasminogen
activator inhibitor 1; FABP, fatty acid-binding protein; NF-
Several methods have been used for the comprehensive analysis of various markers. The measurement methods used in each study are listed in Table 1. The most basic method is the enzyme-linked immunosorbent assay (ELISA), which uses antibodies to capture the molecule of interest. Recently, new immunoassays such as the single-molecule array (Simoa) [63, 64], Meso Scale Discovery (MSD) [64, 65, 66, 67, 68], Luminex xMAP [64, 69, 70, 71], and proximity extension assay (PEA) [63] have been developed and used as upgrades to this ELISA, and other assays have been developed and are in use. The SomaScan technology uses artificial DNA aptamers instead of antibodies [72]. Mass spectrometry techniques (ultra-performance liquid chromatography (UPLC) - mass spectrometry (MS) and UPLC-MS/MS) have also been used to measure lipids and metabolites [73, 74, 75]. These measurement techniques have been described in detail by Alcolea et al. [78].
Molecules discovered using this approach may include those that have not
received much attention in the past or have been implicated in diseases but have
not been studied extensively. However, reports often disagree on the molecules
considered important and how their expression varies among disease groups. This
chapter presents three cytokines (TNF-
TNF-
IL-10 is an important anti-inflammatory cytokine that is used for NDD identification [65, 66, 67, 69]. In particular, it has been extensively studied as a biomarker of PD, but its changes in patients with PD compared with healthy participants are controversial [81]. Interestingly, IL-10 levels correlate with gastrointestinal symptoms in patients with early PD [82], and IL-10 levels increased in healthy individuals with high amyloid deposition [67], making it a distinctive biomarker that may be important in the early stages of the disease.
Eotaxin-3, also known as the C-C motif chemokine ligand (CCL) 26, is a
potentially important biomarker [67, 68, 69, 71]. Eotaxin-3, together with eotaxin-1
(CCL11) and eotaxin-2 (CCL24), constitute the eotaxin family and are potent
eosinophil chemoattractants that facilitate eosinophil recruitment to
inflammatory sites in response to allergic and autoimmune diseases, such as
asthma, atopic dermatitis, inflammatory bowel disease, and parasite infection
[83]. Blood eotaxin-3 levels are elevated in patients with AD and are
particularly important in patients with AD with apolipoprotein E
Leptin is a potentially important peptide biomarker for NDD [54, 64, 67]. Although
the involvement of leptin in AD has been implicated in various ways, whether
blood leptin levels vary among different patient groups remains controversial
[85, 86]. Some reports suggest that leptin may be involved in metabolic changes
caused by the APOE
The neuropeptide Y family has been noted in omics studies for its association with AD [67, 68, 69, 70, 71]. The Neuropeptide Y family includes three structurally similar peptides: neuropeptide Y, pancreatic polypeptide, and peptide tyrosine tyrosine (PYY), which have a wide variety of biological effects on the gastrointestinal tract [90, 91]. Few reports have focused on its specific involvement in NDD and there is little evidence of its association with neurodegenerative or psychiatric disorders other than AD, making it a potentially useful biomarker for AD [92].
Brain natriuretic peptide (BNP) and N-terminal prohormone of brain natriuretic peptide (NT-proBNP) are also important for NDD identification [70, 71, 72]. BNP is synthesized as a prehormone (proBNP), and when released into circulation, proBNP is cleaved into BNP, a biologically active C-terminal fragment, and NT-proBNP, a biologically inactive N-terminal fragment [93]. BNP binds to natriuretic peptide receptor type A and increases intracellular cyclic guanosine monophosphate (cGMP) production, which is involved in diuresis, vasodilation, the suppression of renin and aldosterone production, and the inhibition of cardiac and vascular myocyte growth [94]. Although the association between BNP and NT-proBNP and neurodegenerative diseases has not been well reported, it has been suggested that high levels of BNP and NT-proBNP in the blood are associated with cognitive decline [95, 96].
Several studies have evaluated the importance of ICAM-1 [65, 68, 76], a cell
surface glycoprotein and an adhesion receptor that regulates the recruitment of
leukocytes from circulation to inflammatory sites [97]. Regarding the
relationship between ICAM-1 and AD, previous studies have suggested that ICAM-1
accumulates in senile plaques as evinced by immunostaining of brain tissue from
patients with AD [98, 99]. Recent study has reported that ICAM-1 blocks the
upregulation of nuclear factor
Tenascin C was also mentioned in several reports as an important molecule
[65, 68, 69, 71]. It is a large hexameric extracellular glycoprotein expressed in
the extracellular matrix and limited perivascular regions of the CNS during
development, disease, or injury [102]. Tenascin C levels are high in patients
with AD and low in those with PD; thus, it can be used to differentiate between
these diseases [68, 69]. In terms of its relation to AD, tenascin C expression is
increased in the brains of transgenic mice overexpressing APP, cerebral
A
The approaches presented thus far in this paper have used only molecular biomarkers or, when combined, only cognitive function tests such as the MoCA. This section presents approaches that use other data.
The first involves a combination of plasma biomarkers and magnetic resonance
imaging (MRI). Chiu et al. [105] reported a method to classify patients
with AD, MCI, or subjective cognitive decline (SCD), and healthy participants by
combining three plasma biomarkers (A
Benussi et al. [106] used a combination of plasma and
neurophysiological biomarkers to develop a two-step diagnostic procedure for
differentiating between AD and frontotemporal lobar degeneration (FTLD). First,
to differentiate between patient and control groups, they used three plasma
biomarkers (p-tau181, GFAP, and NF-L) and three transcranial magnetic stimulation
(TMS) neurophysiological biomarkers (short-interval intracortical inhibition
(SICI), intracortical facilitation (ICF), and short-latency afferent inhibition
(SAI)). In the second step, to classify AD from FTLD, they combined two plasma
biomarkers (A
Palmqvist et al. [107] created a model based on plasma p-tau217 levels
combined with memory, executive function, and number of
APOE
Thus far, we have discussed various blood-biomarker-based approaches for NDD diagnosis. Although all these studies focus on blood biomarkers, each approach has its characteristics, which can be broadly classified into “Mechanism-based” and “Data-driven” approaches. “Mechanism-based” methods attempt to use disease-related molecules as biomarkers based on research results on NDD pathophysiology. In contrast, a “Data-driven” approach comprehensively examines various proteins or metabolites in the body, whether specific to NDD or not, and searches for molecules that can be used as biomarkers.
Using a single molecule as a biomarker, first discussed in this review, is a
“Mechanism-based” method: A
In contrast, a “Data-driven” approach searches for biomarkers through comprehensive analyses such as proteomics and metabolomics. This approach has the advantage of identifying molecules potentially involved in diseases without being restricted to the pathological mechanisms considered to date. It can also rediscover molecules that have been implicated in previous studies but have not yet been studied. However, the disadvantage of this approach is that it is difficult to determine whether the variation in the biomarker level is directly due to the disease and explain the reason for this variation. For example, a variety of factors are involved in neuroinflammation, which is an important trigger of neurodegeneration; however, it is difficult to identify the critical inflammatory markers responsible for NDD [108,109,110]. Furthermore, as shown in Table 1, the type of biomarker found to be important in the analysis may vary greatly among studies. Even if the same biomarker is identified, its variation is often not in the same direction, resulting in inconsistent results.
We propose the following approach as a research direction for diagnosing and differentiating NDD using blood biomarkers. In the short term, it may be pragmatic to combine “Mechanism-based” biomarkers in order to discriminate NDD to some degree. To overcome the lack of discriminative abilities of these blood biomarkers, physiological [106] or imaging biomarkers [105] could be incorporated. First, screening for a blood biomarker, which is relatively easy to obtain, was used to detect potential patients with neurodegenerative diseases. NF-L may be a promising marker for this purpose, based on the report of Benussi et al. [106]. Suspected patients were then tested for MRI or TMS neurophysiological biomarkers to identify the disease. The long-term goal is to achieve high diagnostic performance with a single biomarker or a small number of biomarkers. Through “Data-driven” research, biomarkers with high disease discriminatory ability and those that can detect the prodromal phase of a disease can be identified. Then, by elucidating the relationship between these biomarkers and diseases, the biomarkers can be called new “Mechanism-based” biomarkers. This process could lead to breakthroughs in the understanding of NDD and elucidation of its pathomechanisms.
In this review, we discuss various approaches for blood-based NDD biomarker research, such as using a single biomarker, combining multiple biomarkers, comprehensively measuring tens to hundreds of molecules, and incorporating indicators other than molecular biomarkers. Each approach has its own characteristics and requires further development. Biomarker research is not only beneficial for the establishment of diagnostic techniques but may also provide important knowledge that will elucidate the pathophysiology of NDD.
TS, KF, DIF, and IK conceptualized the manuscript. TS wrote the original draft. KF, DIF, and IK reviewed and edited the draft. TS, KF, DIF, and IK acquired the funding. All authors read and approved the final manuscript. All authors have participated sufficiently in the work and agreed to be accountable for all aspects of the work.
Not applicable.
Not applicable.
This work was supported by the Japan Science and Technology Agency (JST) SPRING (JPMJSP2114) and the Japan Ministry of Education, Culture, Sports, Science and Technology (MEXT)/the Japan Society for the Promotion of Science (JSPS) WISE Program: Advanced Graduate Program for Future Medicine and Health Care, Tohoku University to T.S.; the Japan Agency for Medical Research and Development (AMED) (JP20dm0107071) to K.F.; Australian National Health and Medical Research Council, The Michael J. Fox Foundation for Parkinson’s Disease Research for D.I.F.; AMED (22ym0126095h0001, 23ym0126095h0002), the Japan Society for the Promotion of Science (JSPS) KAKENHI (22K06644), and the Takeda Science Foundation to I.K.
The authors declare no conflict of interest. Kohji Fukunaga and Ichiro Kawahata are serving as the Guest editors of this journal. We declare that Kohji Fukunaga and Ichiro Kawahata had no involvement in the peer review of this article and have no access to information regarding its peer review. Full responsibility for the editorial process for this article was delegated to Gernot Riedel.
References
Publisher’s Note: IMR Press stays neutral with regard to jurisdictional claims in published maps and institutional affiliations.