


 , Huiping Wei 1,*
1 Department of Basic Medicine, Hebei North University, 075000 Zhangjiakou, Hebei, China
2 Department of Sports, Hebei North University, 075000 Zhangjiakou, Hebei, China
Abstract
Background: Alzheimer’s disease (AD) occurs in the elderly and
pre-elderly, characterized by decline of memory, cognitive dysfunction,
impairment of learning capacity, and motor dysfunction. Recently a competitive
endogenous RNA (ceRNA) network has been found to be related to AD progression,
but there is still little understanding of the ceRNA regulatory network in AD.
This study aims to explore the important regulatory mechanisms of ceRNA
regulatory networks containing long non-coding RNAs (lncRNAs), circular RNAs
(circRNAs), microRNAs (miRNAs), and messenger RNAs (mRNAs) in AD.
Methods: Data from the gene expression omnibus (GEO) database were used
for the analysis. To study enrichment function for the upregulated and
downregulated mRNAs, Gene Ontology (GO) and Kyoto Encyclopedia of Genes and
Genomes (KEGG) enrichment analyses were performed using the Metascape database,
respectively. Based on the STRING database and Cytoscape
software 3.9.1, a protein-protein interaction (PPI) network was constructed. The
hub genes in this network were identified utilizing the CytoHubba plugin in
Cytoscape. The TargetScan, miRWalk, and miRDB were selected to calculate the
regulatory interaction between miRNAs and the hub genes. LncRNAs were predicted
using RNA22. Additionally, circRNA prediction was executed using the circBank
database. Results: 711
downregulated and 670 upregulated overlapping mRNAs were identified between AD
and control samples. 32 downregulated and 340 upregulated miRNAs were obtained
from AD samples compared with control samples. 78 upregulated and 205
downregulated circRNAs were screened. 275 upregulated lncRNAs and 209
downregulated lncRNAs were found between AD samples and control samples. The PPI
network constructed consists of 1016 nodes and 13,946 edges. Ten hub genes were
selected to identify target miRNAs and ceRNAs. On the basis of the ceRNA
hypothesis, a circRNA/lncRNA-miRNA-mRNA network was established. It included five
lncRNAs (TRHDE-AS1, SNHG10, OIP5-AS, LINC00926 and LINC00662), 26 circRNAs, five
miRNAs (hsa-miR-3158-3p, hsa-miR-4435, hsa-let-7d-3p, hsa-miR-330-5p and
hsa-miR-3605-3p), and ten mRNAs (RPL11, RPL34, RPL21, RPL22, RPL6, RPL32, RPL24,
RPL35, RPL31, and RPL35A). RPL35 and RPL35A were found to be significantly
associated with AD pathology in tau and A
Keywords
- Alzheimer's disease
- lncRNA
- miRNA
- mRNA
- circRNA
- ceRNA network
More than 90% of human genes are transcriptional genes, but most of them do not
encode proteins and are transcribed into non-coding RNAs (ncRNAs) [1]. NcRNAs are
classified into two main types: housekeeping ncRNAs and regulatory ncRNAs.
Regulatory ncRNAs include long ncRNAs (lncRNAs
Alzheimer’s disease (AD) is considered to be a complex heterogeneous disease. Its exact pathogenesis remains unknown, and has no effective treatment method [4]. Thus, there is a need for further research on underlying disease processes to better understand AD and aid the development of feasible treatment options. Considerable evidence shows that ncRNAs, particularly lncRNAs, miRNAs, and circRNAs, are a major class of regulatory molecules involved in the pathophysiology associated with AD [5].
LncRNAs are ncRNAs with a length of more than 200 nts and have been reported as
important for cell regulation. Cytoplasmic lncRNA act as miRNA sponges or miRNA
precursors to alter the expression and function of miRNA. They also recognize
target messenger RNA (mRNA) and interact with cellular translation mechanisms. In SH-SY5Y cells,
the upregulation of nuclear enriched abundant transcript 1 (lncRNA NEAT1) has
been related to the downregulation of miR-27a-3p and upregulation of amyloid
(A
MiRNAs are small molecules with transcripts of 21–23 nts. Changes in the levels
of several miRNAs and their targeted mRNA have been reported to affect the
development and progression of the disease such as APP production, Tau
aggregation, A
CircRNAs are non-coding RNA molecules that do not have a 5
Competitive endogenous RNA (ceRNA) includes mRNA of coding-protein lncRNA and circRNA. Numerous studies have emphasized that these ceRNA molecules regulate miRNA target gene expression via competitively binding to the same miRNA by miRNA responsive elements (MREs). Recently, it was reported that the ceRNA network plays a critical role in many diseases, such as cardiovascular, neuroimmune and neurodegenerative disease [14, 15, 16]. Thus, the ceRNA network offers new approaches to understanding AD. Though some ceRNAs have been found related to AD progression, there is currently little discussion of the role of the ceRNA regulatory network in AD. In this study, data were obtained from the gene expression omnibus (GEO) database. Differentially expressed circRNAs (DEcircRNAs), mRNAs (DEmRNAs), lncRNAs (DElncRNAs), and miRNAs (DEmiRNAs) were screened from sequencing data. The targeted miRNAs and their related circRNAs and lncRNAs were forecast, an integrated ceRNA network was constructed, and their potential value for AD diagnosis was explored. The key pathways and regulatory mechanisms of central genes were analyzed and discussed using bioinformatics tools. MiRNAs, targeted mRNAs, related lncRNAs, and circRNAs involved in the ceRNA network may be possible biomarkers and treatment targets for AD. The workflow is shown in Fig. 1.
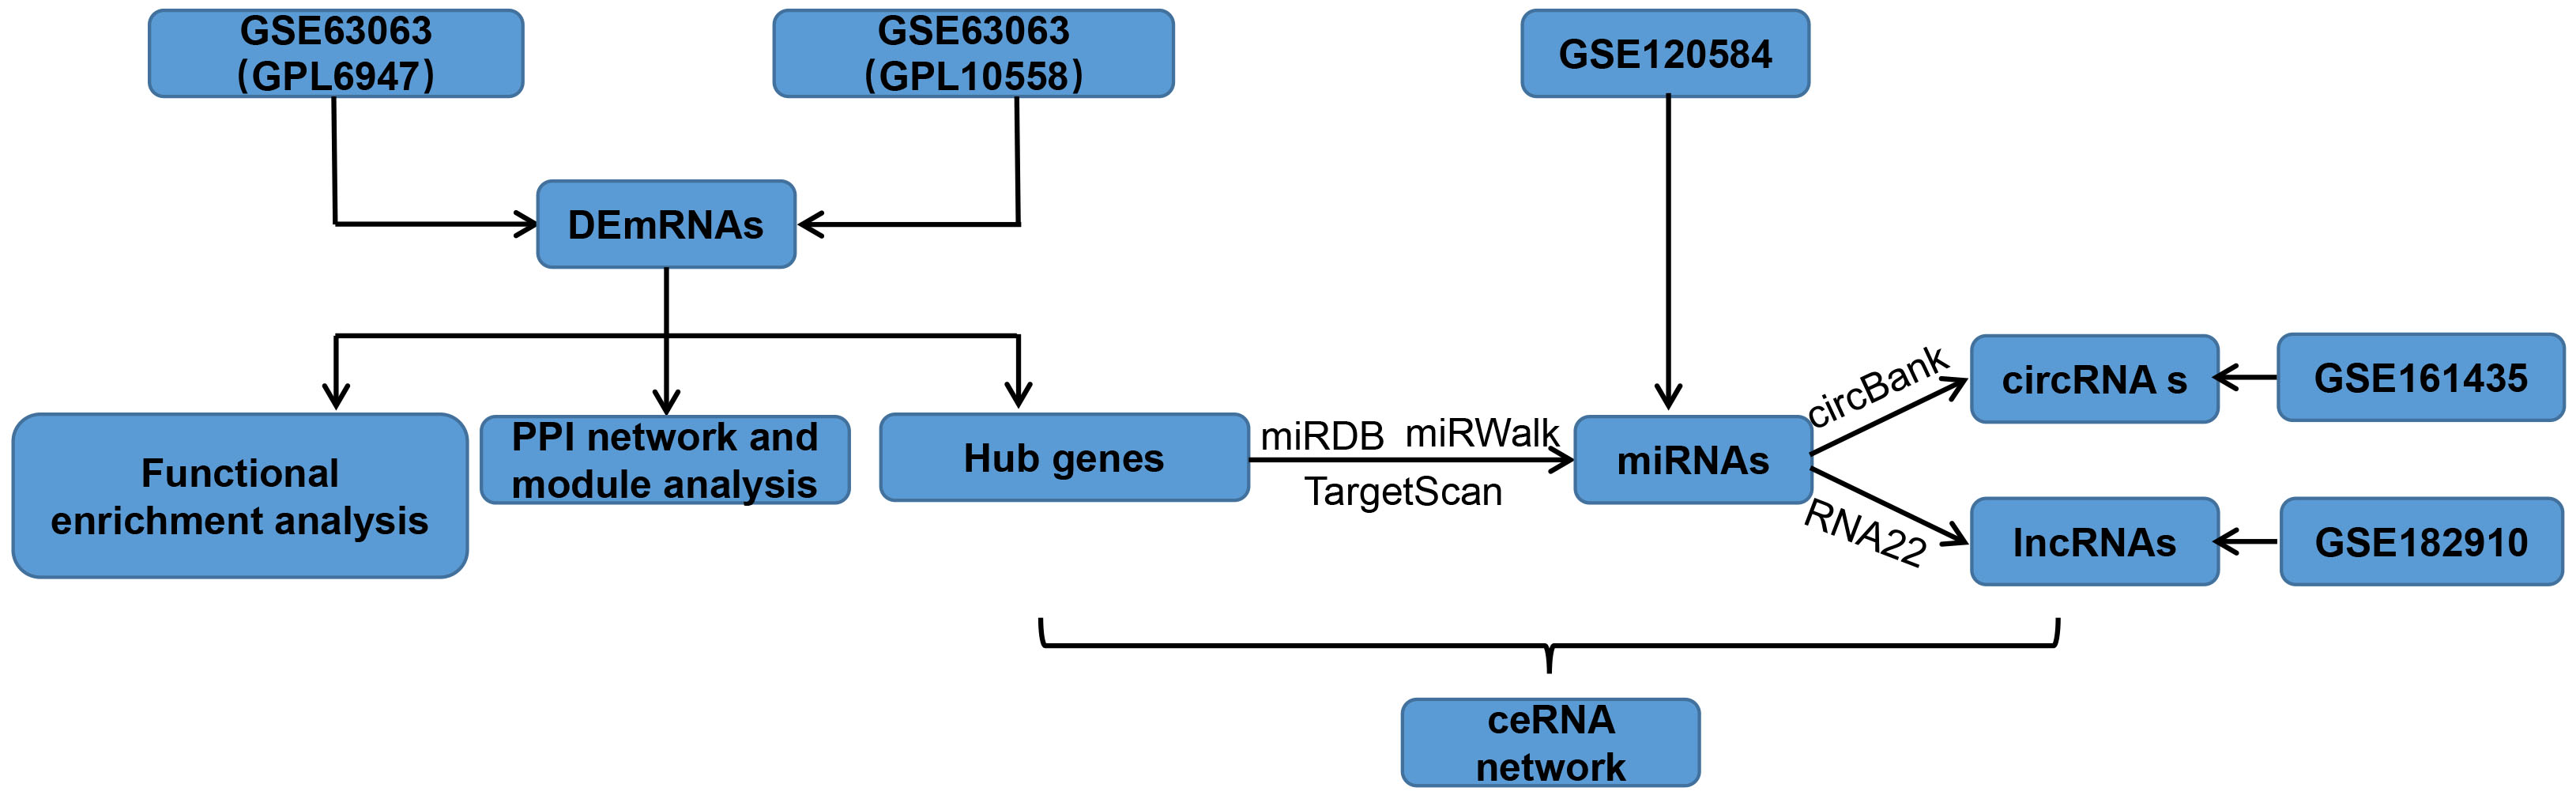 Fig. 1.
Study design flowchart. DEmRNAs, differentially expressed mRNAs; miRNAs, microRNAs; circRNAs, circular RNAs; lncRNAs, long ncRNAs; PPI, protein-protein interaction; ceRNA, competitive endogenous RNA.
MRNA, miRNA, circRNA, and lncRNA expression datasets were obtained from the GEO database (https://www.ncbi.nlm.nih.gov/geo/). GSE63063 was selected for analysis of differentially expressed mRNAs from AD patients compared with controls, in which 329 samples (145 AD cases and 104 controls) based on GPL6947 platform (chip A) were collected and 382 samples (139 AD cases and 134 controls) based on the GPL10558 platform (chip B) were selected. GSE120584 was downloaded to derive DEmiRNAs between AD patients and controls, in which 1309 data sets were downloaded (1021 AD cases and 288 controls) for analysis. The circRNA expression data were derived from GSE161435 (3 AD cases and 3 control cases). The lncRNAs expression data were obtained from GSE182910 (3 AD cases and 3 control cases).
Details of the microarray data selected are described in Table 1.
| GEO accession number | Sample size (AD/control) | Platform |
| mRNA | ||
| GSE63063 (Blood) | AD = 145 | GPL6947 Illumina HumanHT-12 V3.0 expression BeadChip |
| HC = 104 | ||
| AD = 139 | GPL10558 Illumina HumanHT-12 V4.0 expression BeadChip | |
| HC = 134 | ||
| miRNA | ||
| GSE120584 (Serum) | AD = 1021 | GPL21263 3D-Gene Human miRNA V21_1.0.0 |
| HC = 288 | ||
| circRNA | ||
| GSE161435 (Blood) | AD = 3 | GPL21825 074301 Arraystar Human CircRNA microarray V2 |
| HC = 3 | ||
| lncRNA | ||
| GSE182910 (Serum) | AD = 3 | GPL21827 Agilent-079487 Arraystar Human LncRNA microarray V4 (Probe Name version) |
| HC = 3 | ||
AD, Alzheimer’s disease; HC, control; GEO, gene expression omnibus; mRNA, messenger RNA.
The differential expression analysis of mRNAs, miRNAs, circRNAs, and lncRNAs
among different groups was performed using GEO2R. GEO2R completed the analysis
using limma R software packages (version 3.56.0) (limma R software, University of
Melbourne, Parkville, Victoria, Australia). p
The criteria for the selection of DEmiRNAs were FDR
DEcircRNAs were identified with the criterion p-value
DElncRNAs with p
Kyoto Encyclopedia of Genes and Genomes (KEGG) and Gene Ontology (GO) enrichment
analyses for the DEmRNAs were executed using the Metascape database
(v3.5.20230501)
(http://metascape.org/gp/index.html#/main/step1). Significant enrichment was
selected with a threshold of p
The interaction relationships among DEmRNAs were constructed by STRING version 11.5 (https://cn.string-db.org/) [17]. High confidence (0.7) was selected as the cutoff criterion for the minimum required interaction score. The protein-protein interaction (PPI) network of DEmRNAs was visualized by Cytoscape 3.9.1 (Cytoscape, Institute for Systems Biology, Seattle, WA, USA) [18]. Key modules of the PPI network were screened using the Molecular Complex Detection (MCODE) plugin in Cytoscape 3.9.1 (Cytoscape, Institute for Systems Biology, Seattle, WA, USA). Cutoff = 2, node score cutoff = 0.2, k-core = 2, and maximum depth = 100 were regarded as selection criteria.
Additionally, the KEGG pathway enrichment of mRNAs in the significant modules
was analyzed by Metascape database
(v3.5.20230501)
(http://metascape.org/gp/index.html#/main/step1). A p
Hub genes of the network were identified by applying CytoHubba which is a plugin
for Cytoscape 3.9.1 (Cytoscape, Institute for
Systems Biology) [19]. The top ten nodes ranked by the maximum
group centrality (MCC) algorithm were selected as hub genes. The AlzData
database, a one-stop database, covers high-throughput omics data and
high-confident functional data of AD [20]. The hub genes identified in this study
were inserted into the AlzData database (http://www.alzdata.org/) to obtain each
hub gene-related cell type and correlation with AD pathology (A
Regulatory interaction between miRNAs and the hub genes was predicted by TargetScan (https://www.targetscan.org/vert_72/) [21], miRWalk (http://mirwalk.umm.uni-heidelberg.de/) [22], and miRDB (http://www.mirdb.org/) [22]. The DEmiRNAs that were potential targets of these hub genes were screened and a DEmiRNAs-hub genes network was constructed.
A ceRNA network was constructed based on the regulatory mechanism among DEcircRNAs, DElncRNAs, DEmiRNAs, and DEmRNAs.
DEmiRNA binding sites of the circRNA were predicted via the circBank database (http://www.circbank.cn/) and RNA22 database was selected to calculate DEmiRNAs binding sites of the lncRNAs. Finally, a ceRNA network of hub genes, DEmiRNAs, DElncRNAs, and DEcircRNAs was constructed.
Statistical analyses were performed using GraphPad Prism 8 (GraphPad Software,
Inc., San Diego, CA, USA). A p-value
According to the parameters, 3051 DEmRNAs were identified from the GSE63063 datasets based on a GPL6947 platform (Fig. 2A), including 1618 upregulated and 1433 downregulated mRNAs. A total of 1961 DEmRNAs were obtained from the GSE63063 datasets based on the GPL10558 platform, containing 1056 upregulated and 905 downregulated mRNAs (Fig. 2B). Overlapping DEmRNAs of the two datasets were then screened. The outcome showed 711 common downregulated mRNAs (Fig. 2D), while 670 upregulated mRNAs were shared (Fig. 2E) (Supplementary Table 1).
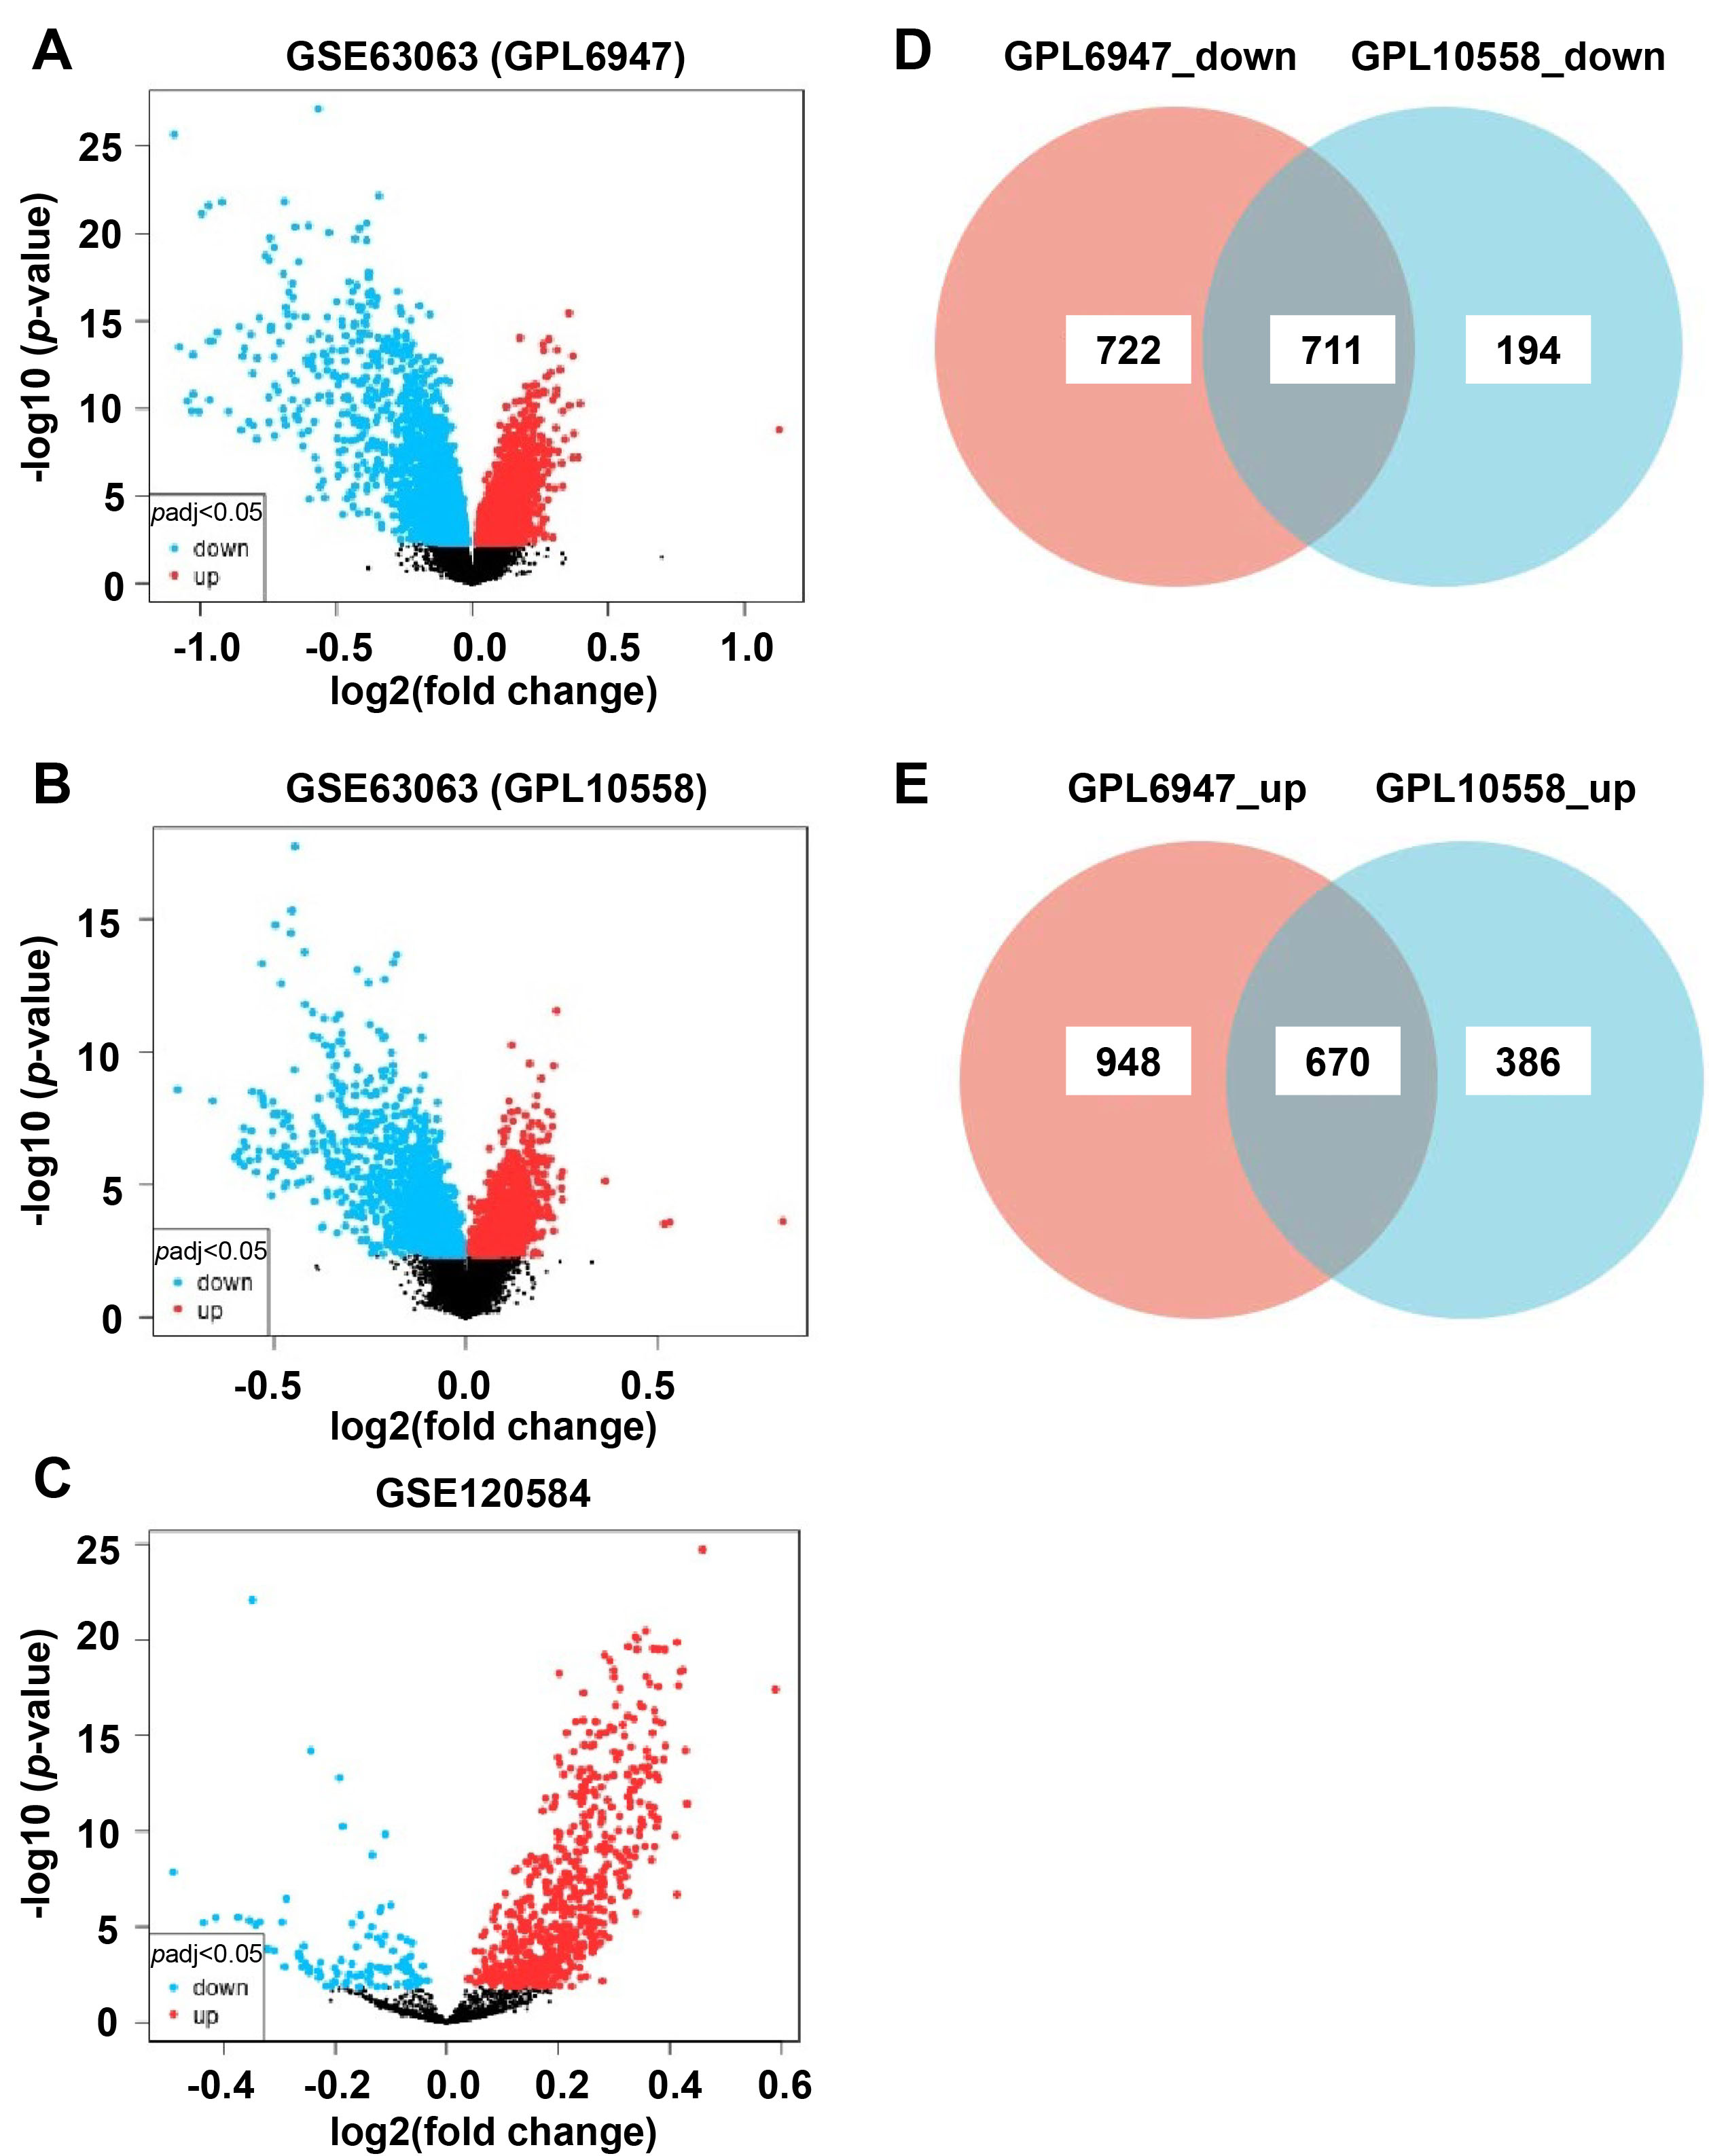 Fig. 2.
Identification of DEmRNAs and DEmiRNAs. (A) Volcano plot of the GSE63063 (GPL6974) datasets. (B) Volcano plot of the GSE63063 (GPL10558) datasets. (C) Volcano plot of GSE120584 datasets. (D,E) Venn diagram of overlapping upregulated and downregulated DEmRNAs. DEmiRNAs, differentially expressed miRNAs; DEmRNAs, differentially expressed mRNAs.
A total of 372 DEmiRNAs were obtained from the GSE120584 datasets (Fig. 2C), 32 of which were downregulated and 340 were upregulated (Supplementary Table 2). Among them, the top five upregulated DEmiRNAs included hsa-miR-208a-5p, hsa-miR-6761-3p, hsa-miR-3646, hsa-miR-595, and hsa-miR-6754-3p, while the top five downregulated DEmiRNAs included hsa-miR-125a-3p, hsa-miR-6131, hsa-miR-24-3p, hsa-miR-125b-1-3p, and hsa-miR-22-3p.
There were 283 DEcircRNAs screened from the GSE161435 datasets, containing 78 upregulated and 205 downregulated circRNAs (Supplementary Table 3). The top five upregulated DEcircRNAs included hsa_circRNA_044837, hsa_circRNA_101213, hsa_circRNA_406841, hsa_circRNA_092388, and hsa_circRNA_104193, while the top five downregulated DEcircRNAs included hsa_circRNA_0102552, hsa_circRNA_0050212, hsa_circRNA_0102457, hsa_circRNA_0102551, and hsa_circRNA_0002532.
A total of 484 DElncRNAs were found, including 275 upregulated and 209 downregulated lncRNAs. These DElncRNAs are shown in Supplementary Table 4. Among them, the top five upregulated DElncRNAs included G0S2, SLED1, LINC02065, TAGLN, and AC011193.1, while the top five downregulated DElncRNAs included MYOM2, AL935212.1, AC245452.5, LINC00989, and AL023693.1.
Functional enrichment analysis showed that the upregulated DEmRNAs were mainly enriched in the regulation of response to biotic stimulus, regulation of defense response and regulation of innate immune response in the biological process (BP) category; secretory granule membrane, tertiary granule, specific granule and specific granule membrane in the cellular component (CC) category; GTPase regulator activity, nucleoside-triphosphatase regulator activity, enzyme activator activity, and small GTPase activator activity in the molecular function (MF) category (Fig. 3A,C,E and Supplementary Table 5). For the downregulated DEmRNAs, functional enrichment analysis indicated that the enriched GO terms mainly included translation, peptide biosynthetic process, and peptide metabolic process in the BP category; ribosomal subunit, focal adhesion, cell-substrate junction, and mitochondrial protein-containing complex in the CC category; structural constituent of ribosome, rRNA binding, oxidoreduction-driven active transmembrane transporter activity and nicotinamide adenine dinucleotide (NADH) dehydrogenase (ubiquinone) activity in the MF category (Fig. 3B,D,F and Supplementary Table 6).
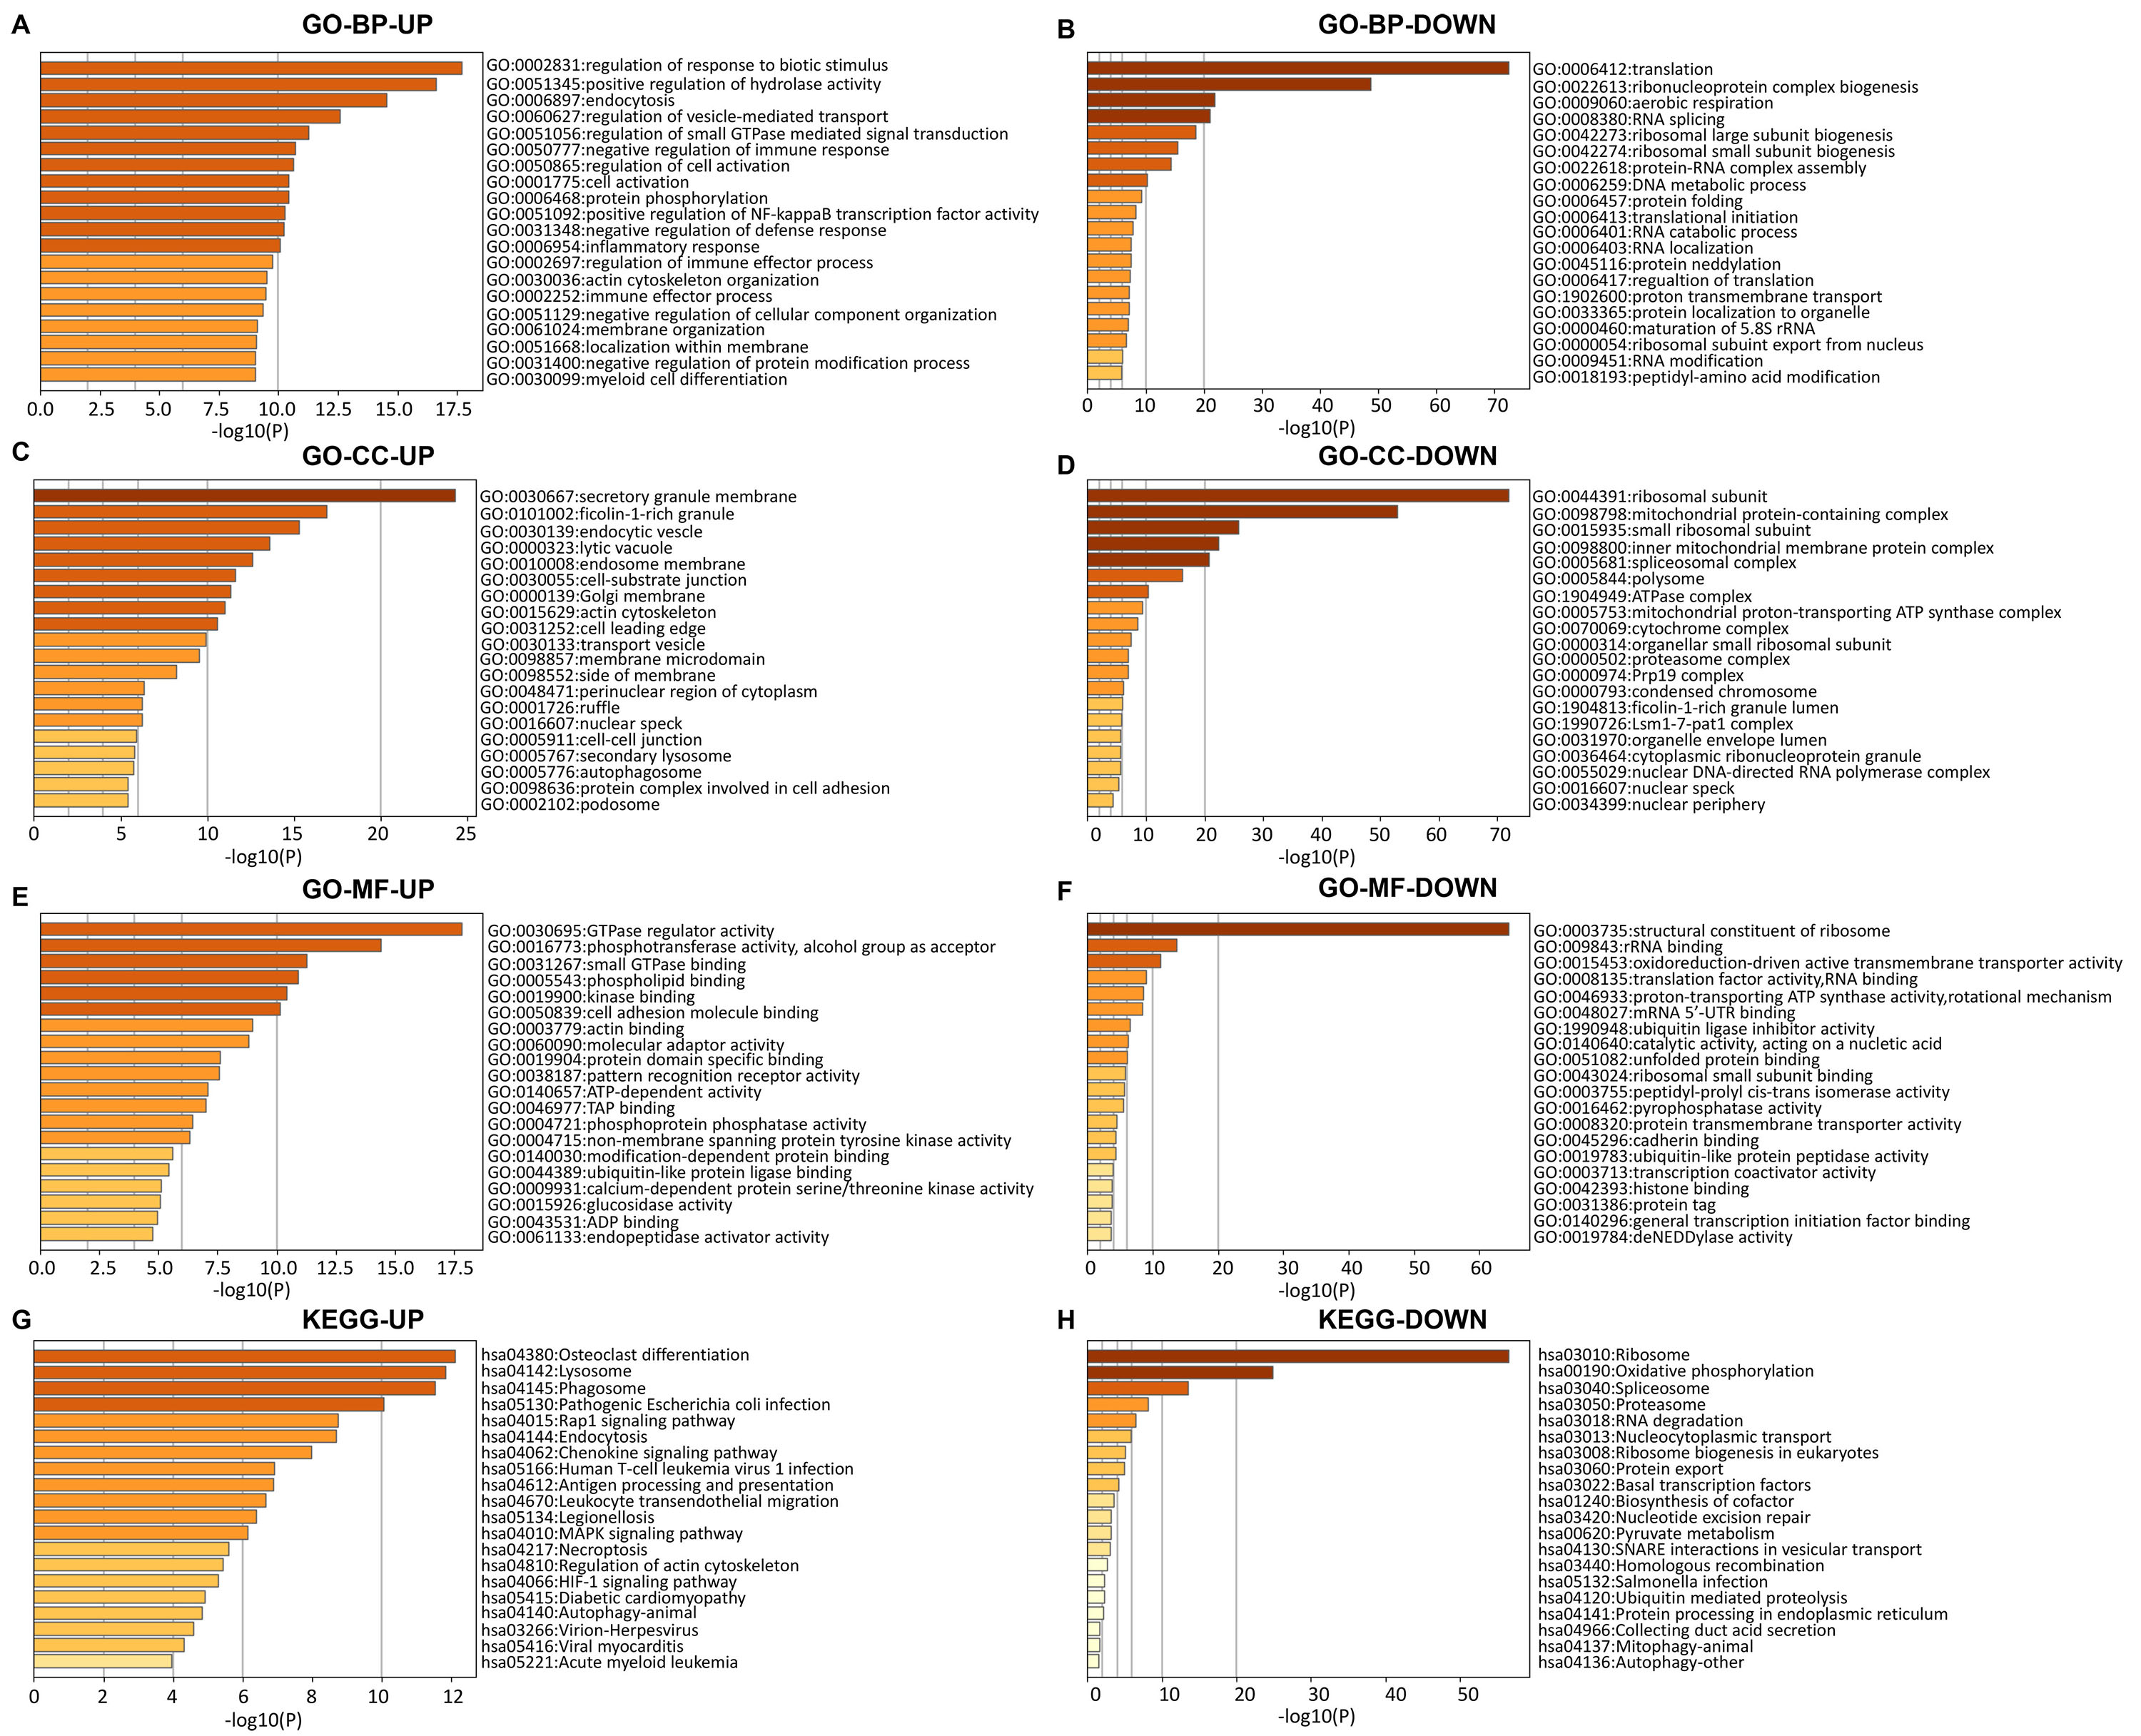 Fig. 3.
Enrichment analysis of function for upregulated and downregulated differentially expressed mRNAs (DEmRNAs). Enrichment analysis of the biological process (BP) for DEmRNAs (A,B), Enrichment analysis of cellular component (CC) for DEmRNAs (C,D), and enrichment analysis of molecular function (MF) for DEmRNAs (E,F). (G,H) KEGG analysis for DEmRNAs. UP, upregulated; DOWN, downregulated; FDR, false discovery rate; KEGG, Kyoto Encyclopedia of Genes and Genomes; GO, Gene Ontology.
As shown in Fig. 3G,H and Supplementary Tables 7,8, KEGG pathways for the upregulated DEmRNAs mainly included osteoclast differentiation, NOD-like receptor signaling pathway, lipid and atherosclerosis and epstein-Barr virus infection (Supplementary Table 7), while the downregulated DEmRNAs were mainly enriched in various metabolic pathways such as ribosome, oxidative phosphorylation and Alzheimer disease (Supplementary Table 8).
A PPI network was constructed, which consisted of 1016 nodes and 13,946 edges. The MCODE plug-in was utilized for finding key subnetworks and genes based on the relationship between edges and nodes in the network for downstream analysis. Based on MCODE analysis, 44 modules were obtained (Supplementary Table 9), 6 modules of which were selected for Fig. 4A–F. The highest score of module 1 is 53.724, which was significantly enriched in ribosomes and protein export (Fig. 4G). Module 2 was mainly related to the ribosome (Fig. 4H). Similarly, module 3 was significantly enriched in oxidative phosphorylation, and so on (Fig. 4I). Module 4 was mainly assembled in ribosome biogenesis (Fig. 4J). Module 5 was primarily associated with the proteasome (Fig. 4K). Module 6 was mainly associated with the spliceosome (Fig. 4L).
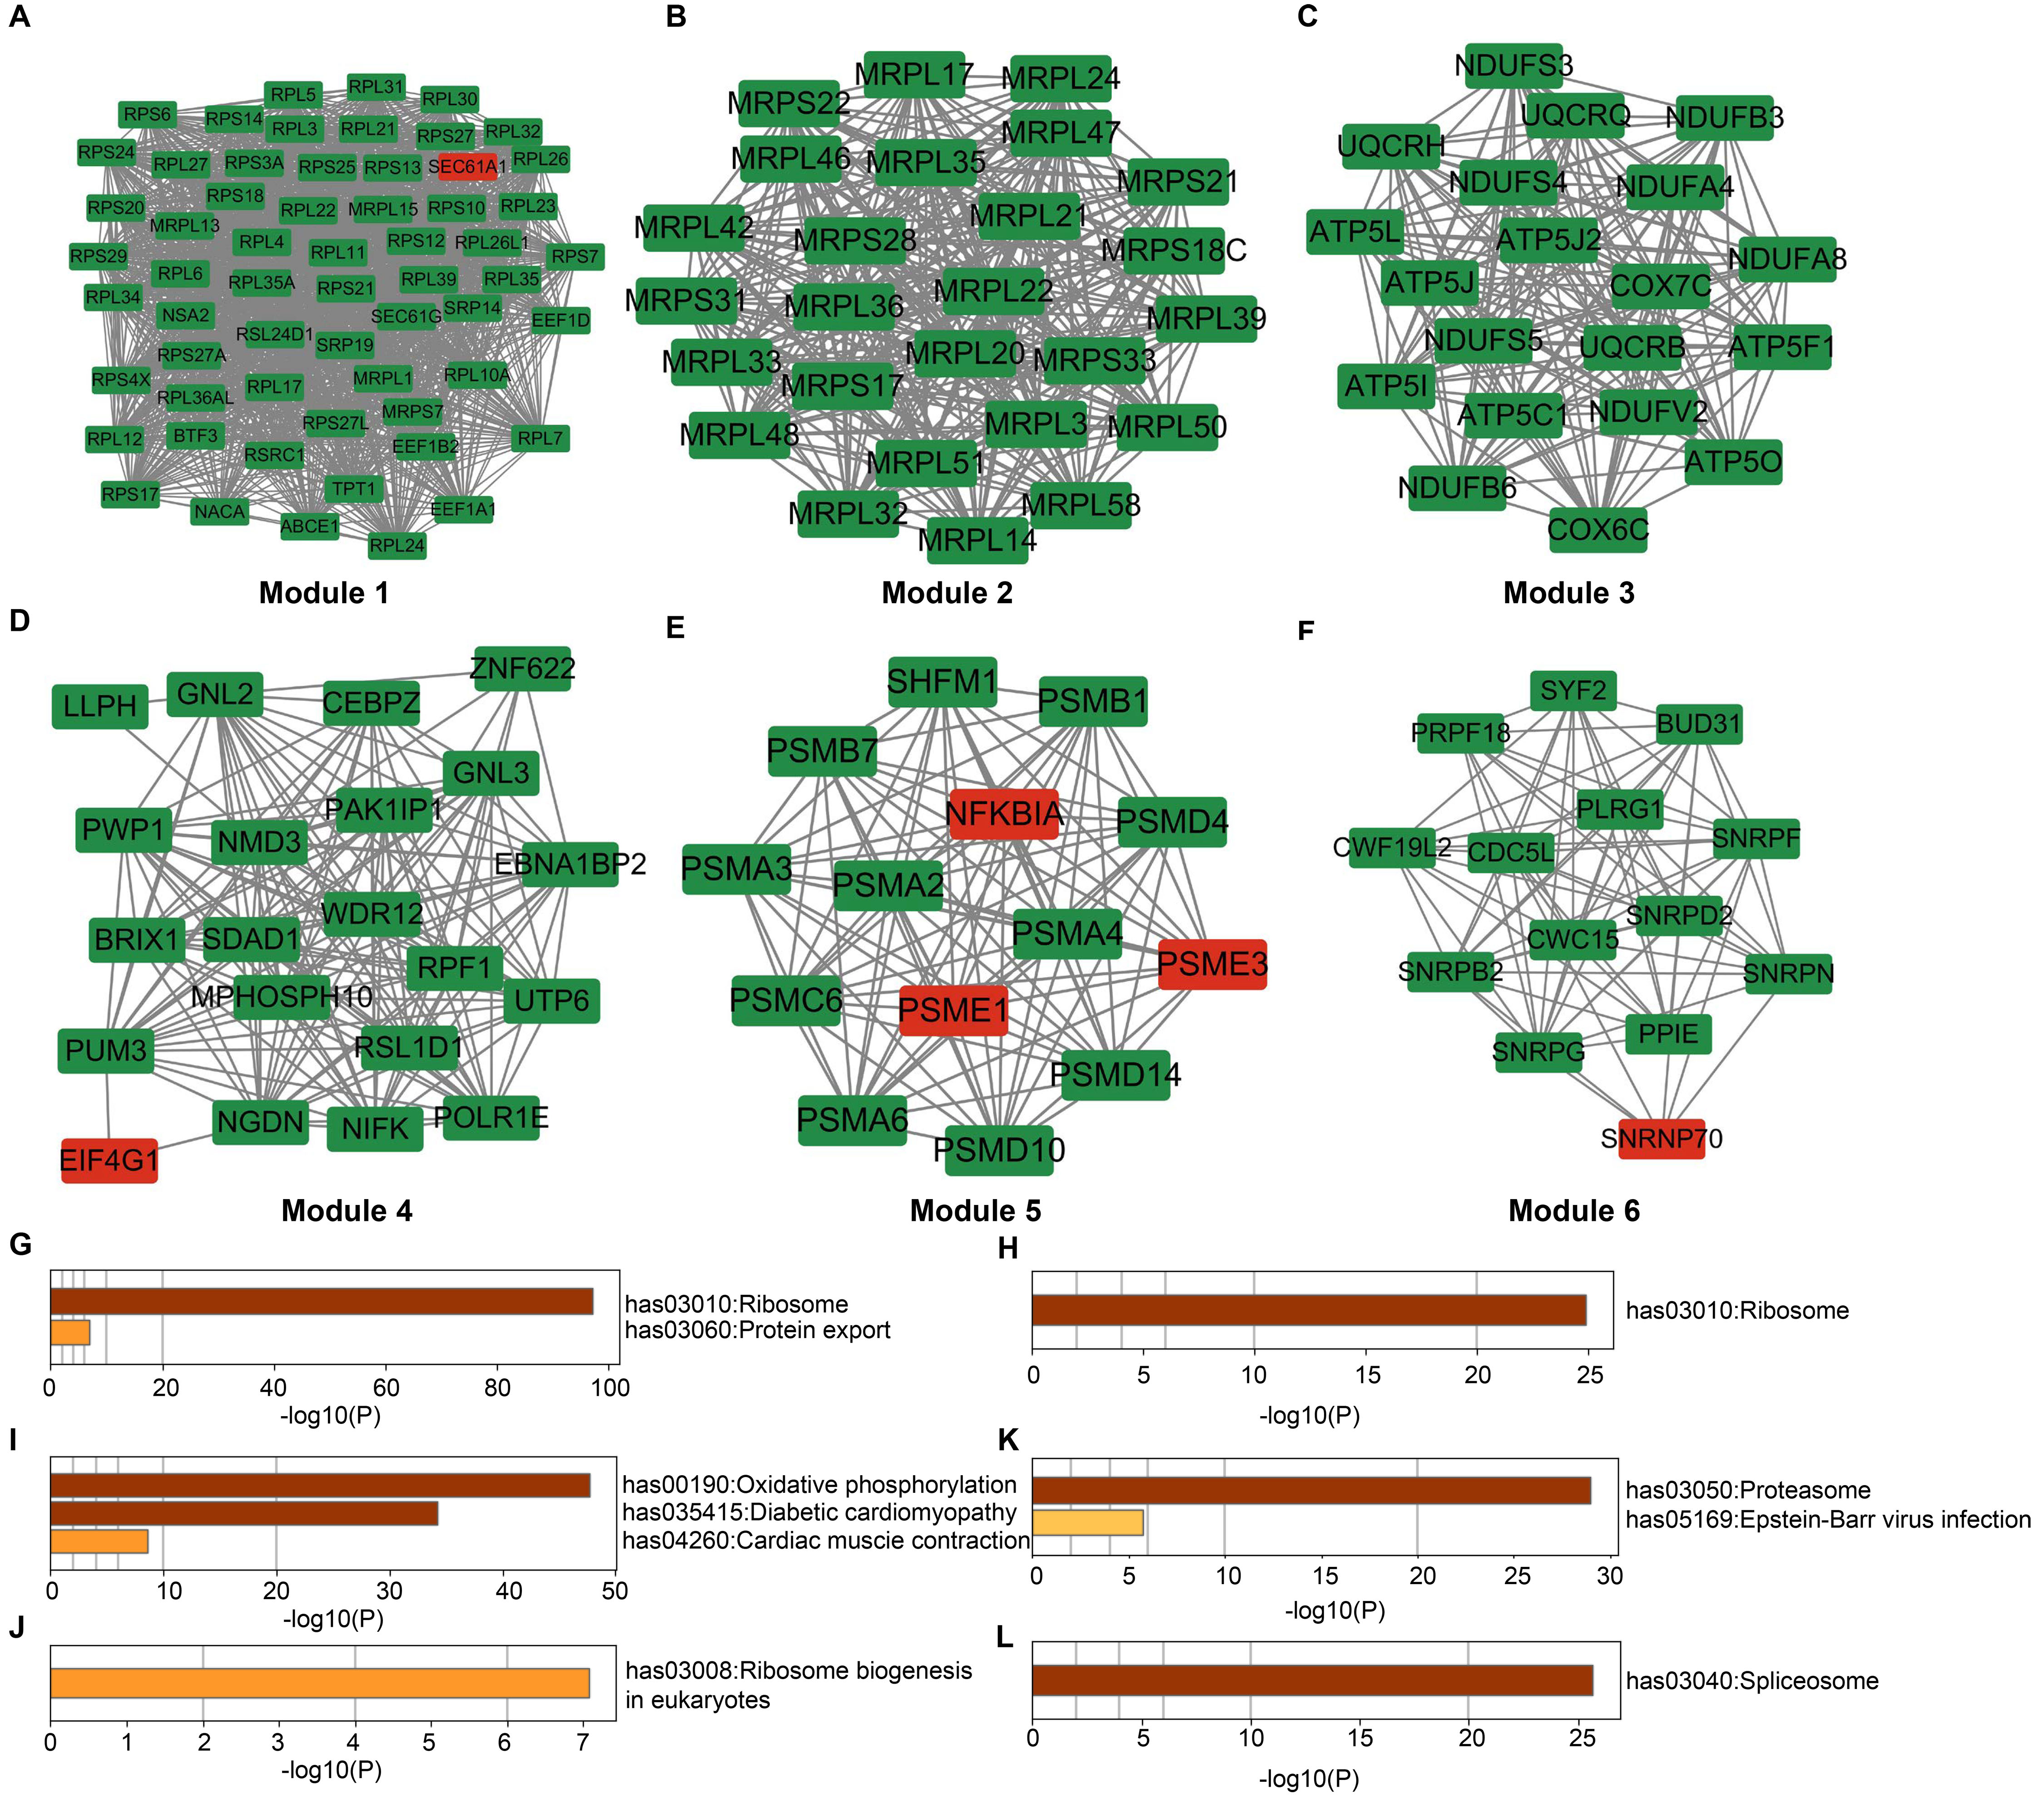 Fig. 4.
Construction of the PPI network and analysis of modules. (A–F) PPI network of for the selected 6 modules. Red: Upregulated DEmRNAs. Green: Downregulated DEmRNAs. (G–L) Enrichment of KEGG pathway of these modules. DEmRNAs, differentially expressed mRNAs; KEGG, Kyoto Encyclopedia of Genes and Genomes.
Based on importance, ten downregulated genes in module 1 were considered as hub
genes of the network, such as ribosomal protein L11 (RPL11), ribosomal
protein L34 (RPL34), ribosomal protein L21 (RPL21), ribosomal
protein L22 (RPL22), ribosomal protein 61 (RPL6), ribosomal
protein L32 (RPL32), ribosomal protein L24 (RPL24), ribosomal
protein L35 (RPL35), ribosomal protein L31 (RPL31), and
ribosomal protein L35A (RPL35A). These hub genes are primarily enriched
in ribosomes (Table 2 and Fig. 5A,B). Moreover, the AlzData database was
utilized for analysing the hub genes. Nine of these hub genes (RPL11,
RPL34, RPL22, RPL6, RPL32, RPL24,
RPL35, RPL31, and RPL35A) were confirmed to be
significantly expressed in various parts of the brain based on the results (Fig. 5C–K). The hub genes related to AD were ranked using the AlzData database (Table 3). According to the score of convergent functional genomics (CFG),
RPL35, RPL24, RPL22, and RPL35A were
identified as significantly relevant to pathology of AD mouse models of
A
| Gene name | Score | Expression |
| RPL35 | 3.62661 |
downregulated |
| RPL31 | 3.62661 |
downregulated |
| RPL24 | 3.62661 |
downregulated |
| RPL34 | 3.62661 |
downregulated |
| RPL32 | 3.62661 |
downregulated |
| RPL11 | 3.62661 |
downregulated |
| RPL22 | 3.62661 |
downregulated |
| RPL35A | 3.62661 |
downregulated |
| RPL6 | 3.62661 |
downregulated |
| RPL21 | 3.62661 |
downregulated |
| Gene | eQTL | GWAS | PPI | Early_DEG | Pathology correlation (A |
Pathology correlation (tau) | CFG |
| RPL35 | 2 | 0 | PSEN1 | NA | 0.485, *** | 0.763, *** | 3 |
| RPL31 | NA | 0 | PSEN1 | yes | 0.273, ns | 0.621, * | 3 |
| RPL24 | 0 | 0 | - | yes | 0.368, * | 0.508, ns | 2 |
| RPL34 | 0 | 0 | PSEN1 | NA | NA | NA | 1 |
| RPL32 | 2 | 0 | PSEN1 | NA | NA | NA | 2 |
| RPL11 | 1 | 0 | - | NA | NA | NA | 1 |
| RPL22 | 2 | 0 | - | yes | 0.370, * | 0.400, ns | 3 |
| RPL35A | 1 | 0 | - | yes | 0.339, * | 0.546, * | 3 |
| RPL6 | 1 | 1 | - | NA | NA | NA | 2 |
| RPL21 | 0 | 0 | - | NA | 0.278, ns | 0.566, * | 1 |
Note: eQTL: target gene expression is affected by variation of the AD
gene (p
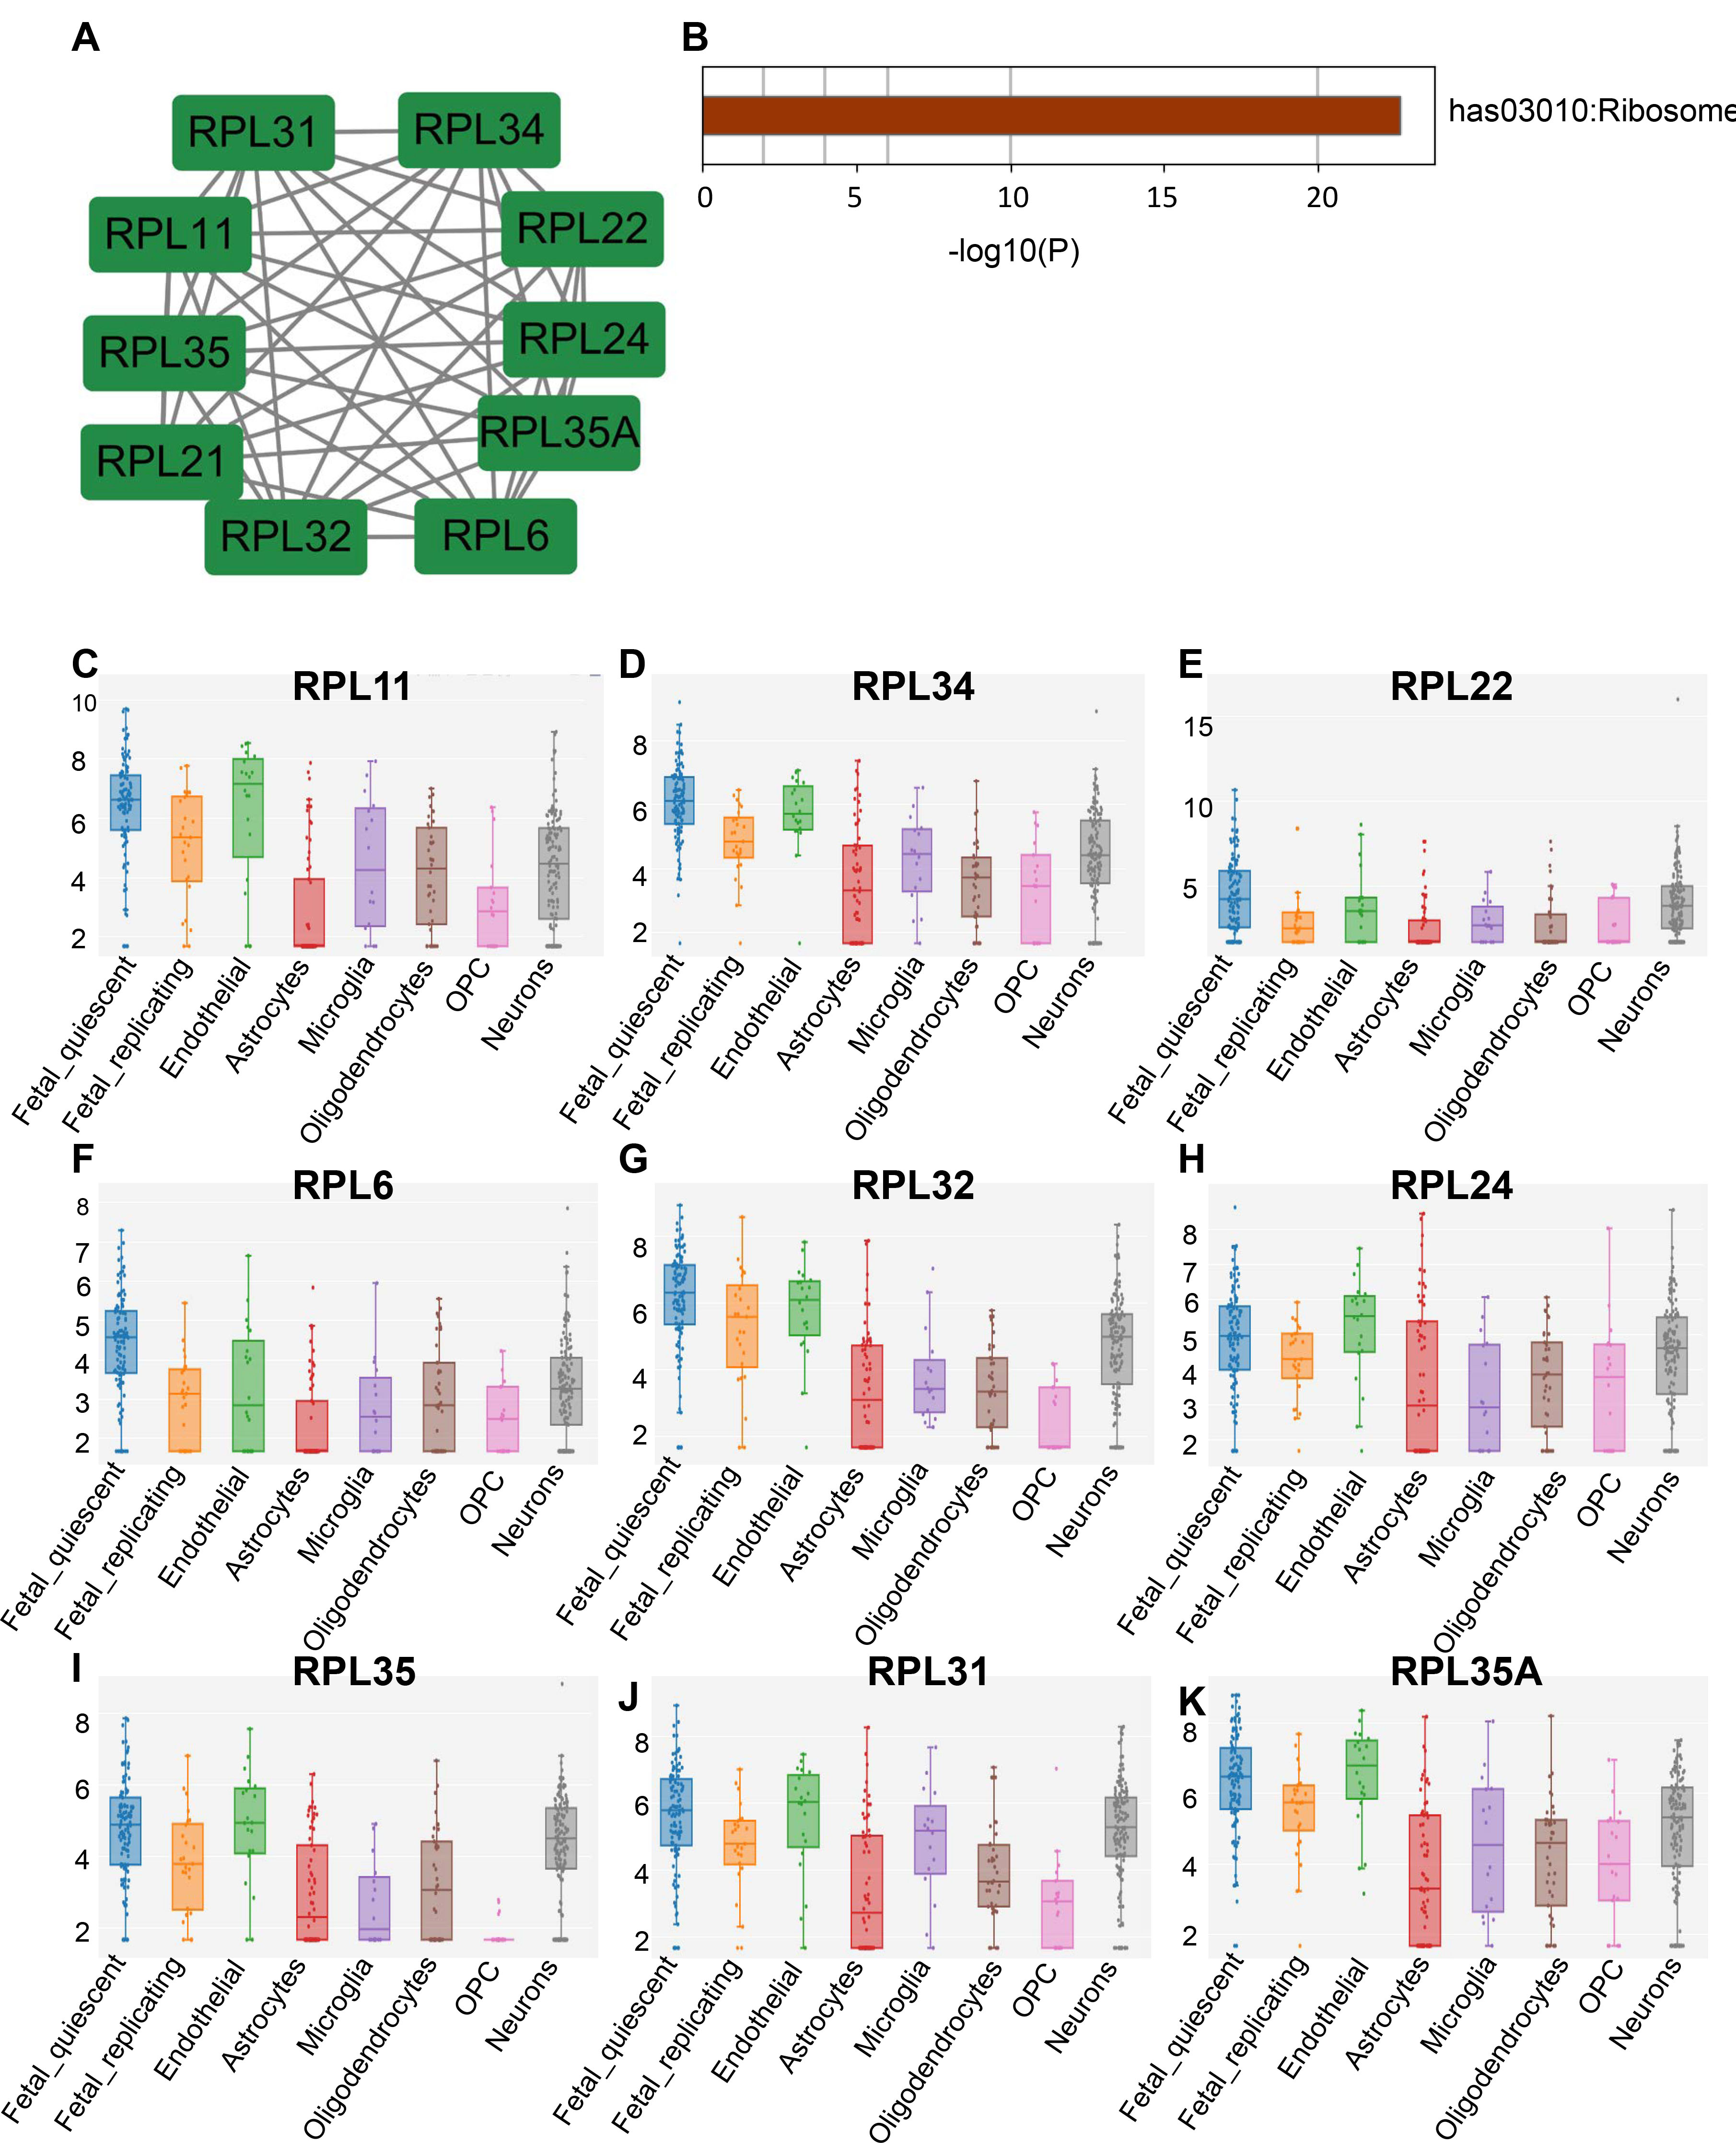 Fig. 5.
Verification of hub genes. (A) Regulatory network of the hub genes. (B) KEGG pathway enrichment of hub genes. (C–K) Hub gene expression in different parts of the brain.
Based on these results, it was shown that these hub genes may have a significant role in AD pathogenesis.
MiRNAs are endogenous non-coding RNAs with regulatory functions. The size of miRNAs is about 21~23 nts. They inhibit target mRNA expression by recognizing target mRNA through base complementary pairing. Based on this, the DEmiRNAs-hub genes pairs with an up-down mode were selected for further study.
A total of 337 overlapped upregulated DEmiRNAs related to the above ten downregulated hub genes were collected using TargetScan, miRWalk, and miRDB databases. Based on the regulatory relationship, a miRNA-mRNA network was constructed, as given in Supplementary Table 10.
To further verify the 337 overlapped upregulated DEmiRNAs, a GSE46579 dataset for studying miRNA expression profiles in the blood of AD patients and controls was collected. In total, GSE46579 detected 180 differentially expressed miRNAs, including 90 downregulated and 90 upregulated miRNAs in AD samples compared with controls. Then, the common DEmiRNAs were screened between the 337 DEmiRNAs and the 180 differentially expressed miRNAs, which revealed 5 common upregulated DEmiRNAs. Information in detail is shown in Table 4.
| miRNA symbol | GSE120584 | GSE46579 | ||||
| adj. p-value | p-value | logFC | adj. p-value | p-value | logFC | |
| has-miR-3158-3p | 0.000000547 | 5.09 × 10 |
0.277258 | 0.027374587 | 0.008323958 | 0.501717096 |
| has-miR-4435 | 0.00000203 | 0.000000211 | 0.412811 | 0.01527147 | 0.004076448 | 0.648281094 |
| has-let-7d-3p | 0.00063 | 0.000109 | 0.213241 | 0.026760404 | 0.007878648 | 1.069946327 |
| has-miR-330-5p | 0.0000441 | 0.0000058 | 0.252895 | 0.000771818 | 0.000119924 | 1.007092612 |
| has-miR-3605-3p | 5.01 × 10 |
2.56 × 10 |
0.348935 | 0.048411001 | 0.0164906 | 0.832622225 |
In addition to mRNA, lncRNA and circRNA also have MREs. When lncRNA or circRNA and mRNA have the same MREs, they will competitively bind to the same miRNAs. In other words, lncRNA or circRNA expression level in cells directly influences the expression of miRNAs that bind to the corresponding mRNA. That is, through the MREs bridge, lncRNA or circRNA indirectly regulating the mRNA expression level, thus regulate cell function.
On the basis of the aforementioned 5 overlapped upregulated DEmiRNAs, 36 DElncRNA-DEmiRNA regulatory pairs were obtained using RNA22 and 53 DEcircRNA-DEmiRNA regulatory pairs were obtained using CircBank. Based on the ceRNA hypothesis, the DEcircRNAs/DElncRNAs-DEmiRNAs-hub genes with a mode of down-up-down were chosen for further investigation.
A DEcircRNAs-DEmiRNAs-hub genes network was constructed by Cytoscape 3.9.1 and included 26 circRNAs, 5 miRNAs, and 10 mRNAs (Table 5 and Fig. 6).
| DEmiRNAs | circRNAs associated with miRNAs | Targeted hub genes of DEmiRNAs |
| has-miR-3158-3p (upregulated) | has_circRNA_0090682 (down), has_circRNA_0100723 (down), has_circRNA_0076336 (down), has_circRNA_0100174 (down), has_circRNA_0001959 (down), has_circRNA_0104352 (down) | RPL11 (down), RPL22 (down), RPL24 (down), RPL31 (down), RPL32 (down), RPL34 (down), RPL35A (down), RPL6 (down) |
| has-miR-4435 (upregulated) | has_circRNA_0101760 (down), has_circRNA_0002172 (down), has_circRNA_0101758 (down), has_circRNA_0103108 (down), has_circRNA_0020990 (down), has_circRNA_0051620 (down), has_circRNA_0101472 (down), has_circRNA_0002640 (down), has_circRNA_0003057 (down), has_circRNA_0102589 (down), has_circRNA_0104911 (down) | RPL11 (down), RPL21 (down), RPL22 (down), RPL32 (down), RPL34 (down), RPL35 (down), RPL35A (down), RPL6 (down) |
| hsa-let-7d-3p (upregulated) | hsa_circRNA_0073593 (down), hsa_circRNA_0082335 (down) | RPL11 (down), RPL22 (down), RPL31 (down), RPL35 (down), RPL35A (down) |
| hsa-miR-330-5p (upregulated) | hsa_circRNA_0090682 (down), hsa_circRNA_0100946 (down), hsa_circRNA_0104911 (down), hsa_circRNA_0001276 (down), hsa_circRNA_0100021 (down), hsa_circRNA_0001399 (down), hsa_circRNA_0026074 (down), hsa_circRNA_0066331 (down), hsa_circRNA_0076336 (down), hsa_circRNA_0100723 (down) | RPL11 (down), RPL22 (down), RPL31 (down), RPL32 (down), RPL34 (down), RPL35A (down), RPL6 (down) |
| hsa-miR-3605-3p (upregulated) | hsa_circRNA_0025332 (down) | RPL11 (down), RPL22 (down), RPL32 (down), RPL35A (down), RPL6 (down) |
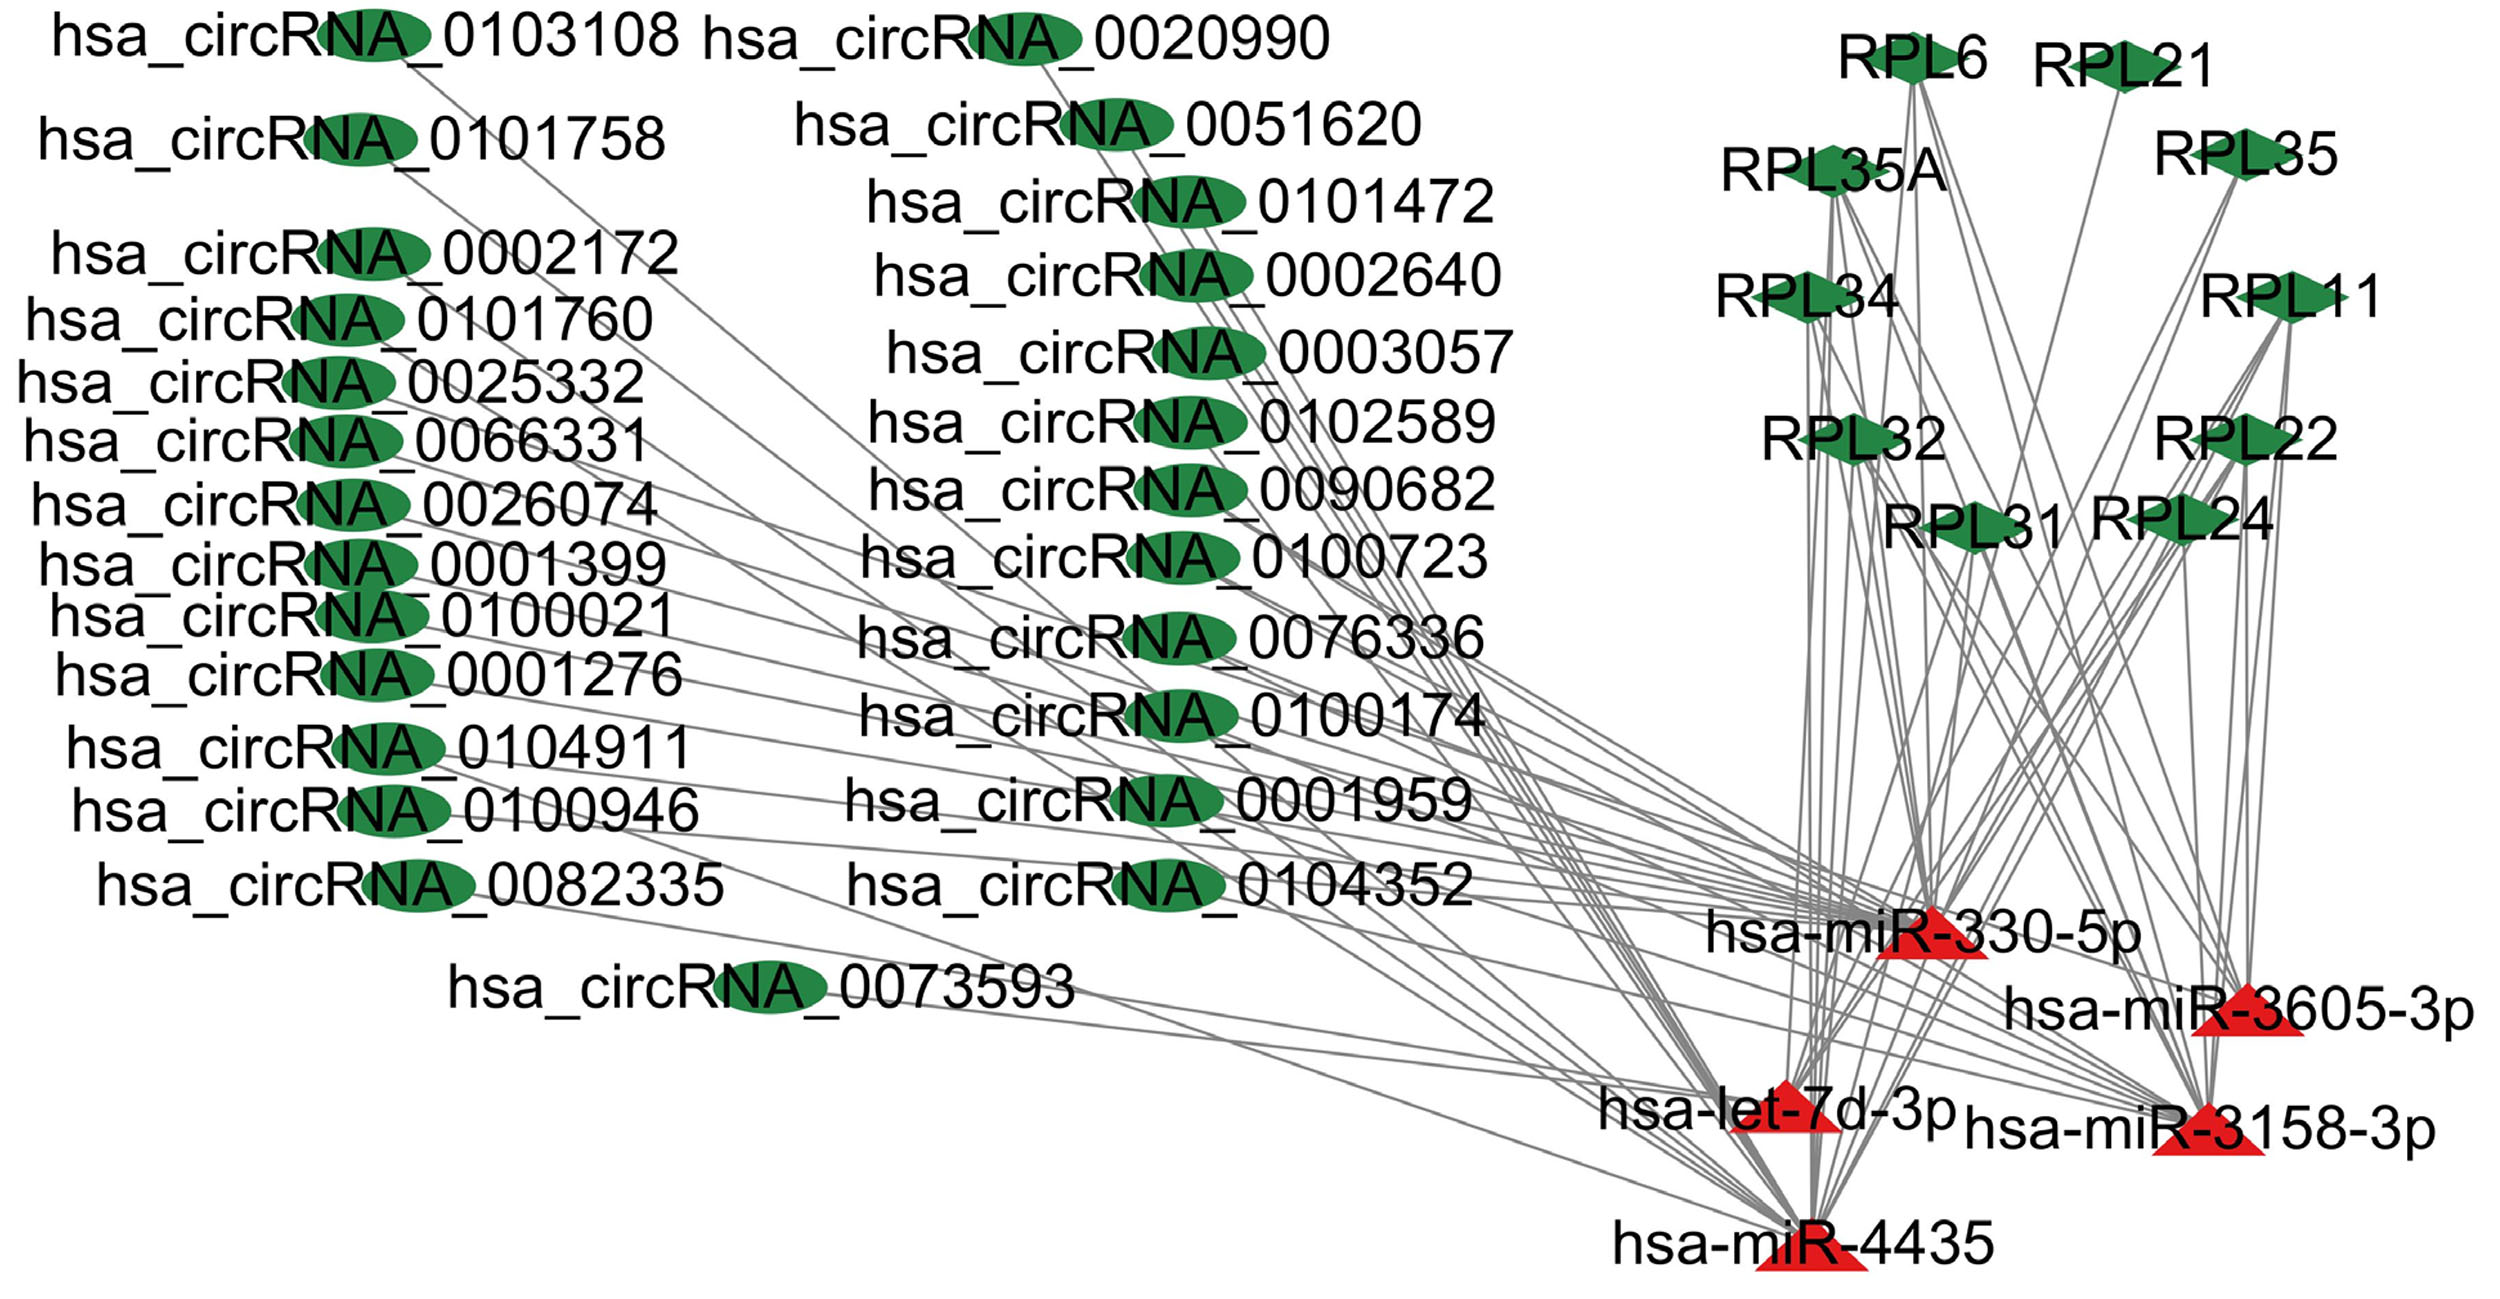 Fig. 6.
The circRNAs-miRNAs-mRNAs network. Triangle nodes indicate miRNAs, ellipse-shaped nodes indicate circRNAs and diamond nodes indicate hub genes. Red: upregulated nodes. Green: downregulated nodes.
Generally, the lncRNAs in cytoplasm competitively bound to miRNA to regulate mRNA expression level. The RNALocate v2.0 database was selected to perform the intracellular localization of these lncRNAs (Fig. 7). It should be noted that the lncRNAs not located in cytoplasm or unclear were excluded from the network. The network of DElncRNAs-DEmiRNAs-hub genes (including 5 lncRNAs, 3 miRNAs and 10 mRNAs) is given in Table 6 and Fig. 8. AD-associated lncRNAs were then identified from the 5 DElncRNAs using the LncRNADisease v2.0 online software. Out of the 5 DElncRNAs, 3 have previously been shown to be associated with AD (SNHG10, OIP5-AS1 and LINC00662).
| DEmiRNAs | lncRNAs associated with miRNAs | Targeted hub genes of DEmiRNAs |
| hsa-miR-3158-3p (upregulated) | TRHDE-AS1 (down), SNHG10 (down)*, OIP5-AS1 (down)*, LINC00926 (down) | RPL11 (down), RPL22 (down), RPL24 (down), RPL31 (down), RPL32 (down), RPL34 (down), RPL35A (down), RPL6 (down) |
| hsa-miR-4435 (upregulated) | OIP5-AS1 (down)*, LINC00662 (down)* | RPL11 (down), RPL21 (down), RPL22 (down), RPL32 (down), RPL34 (down), RPL35 (down), RPL35A (down), RPL6 (down) |
| hsa-miR-3605-3p (upregulated) | TRHDE-AS1 (down), LINC00662 (down)* | RPL11 (down), RPL22 (down), RPL32 (down), RPL35A (down), RPL6 (down) |
* Previously known to be associated with Alzheimer’s disease.
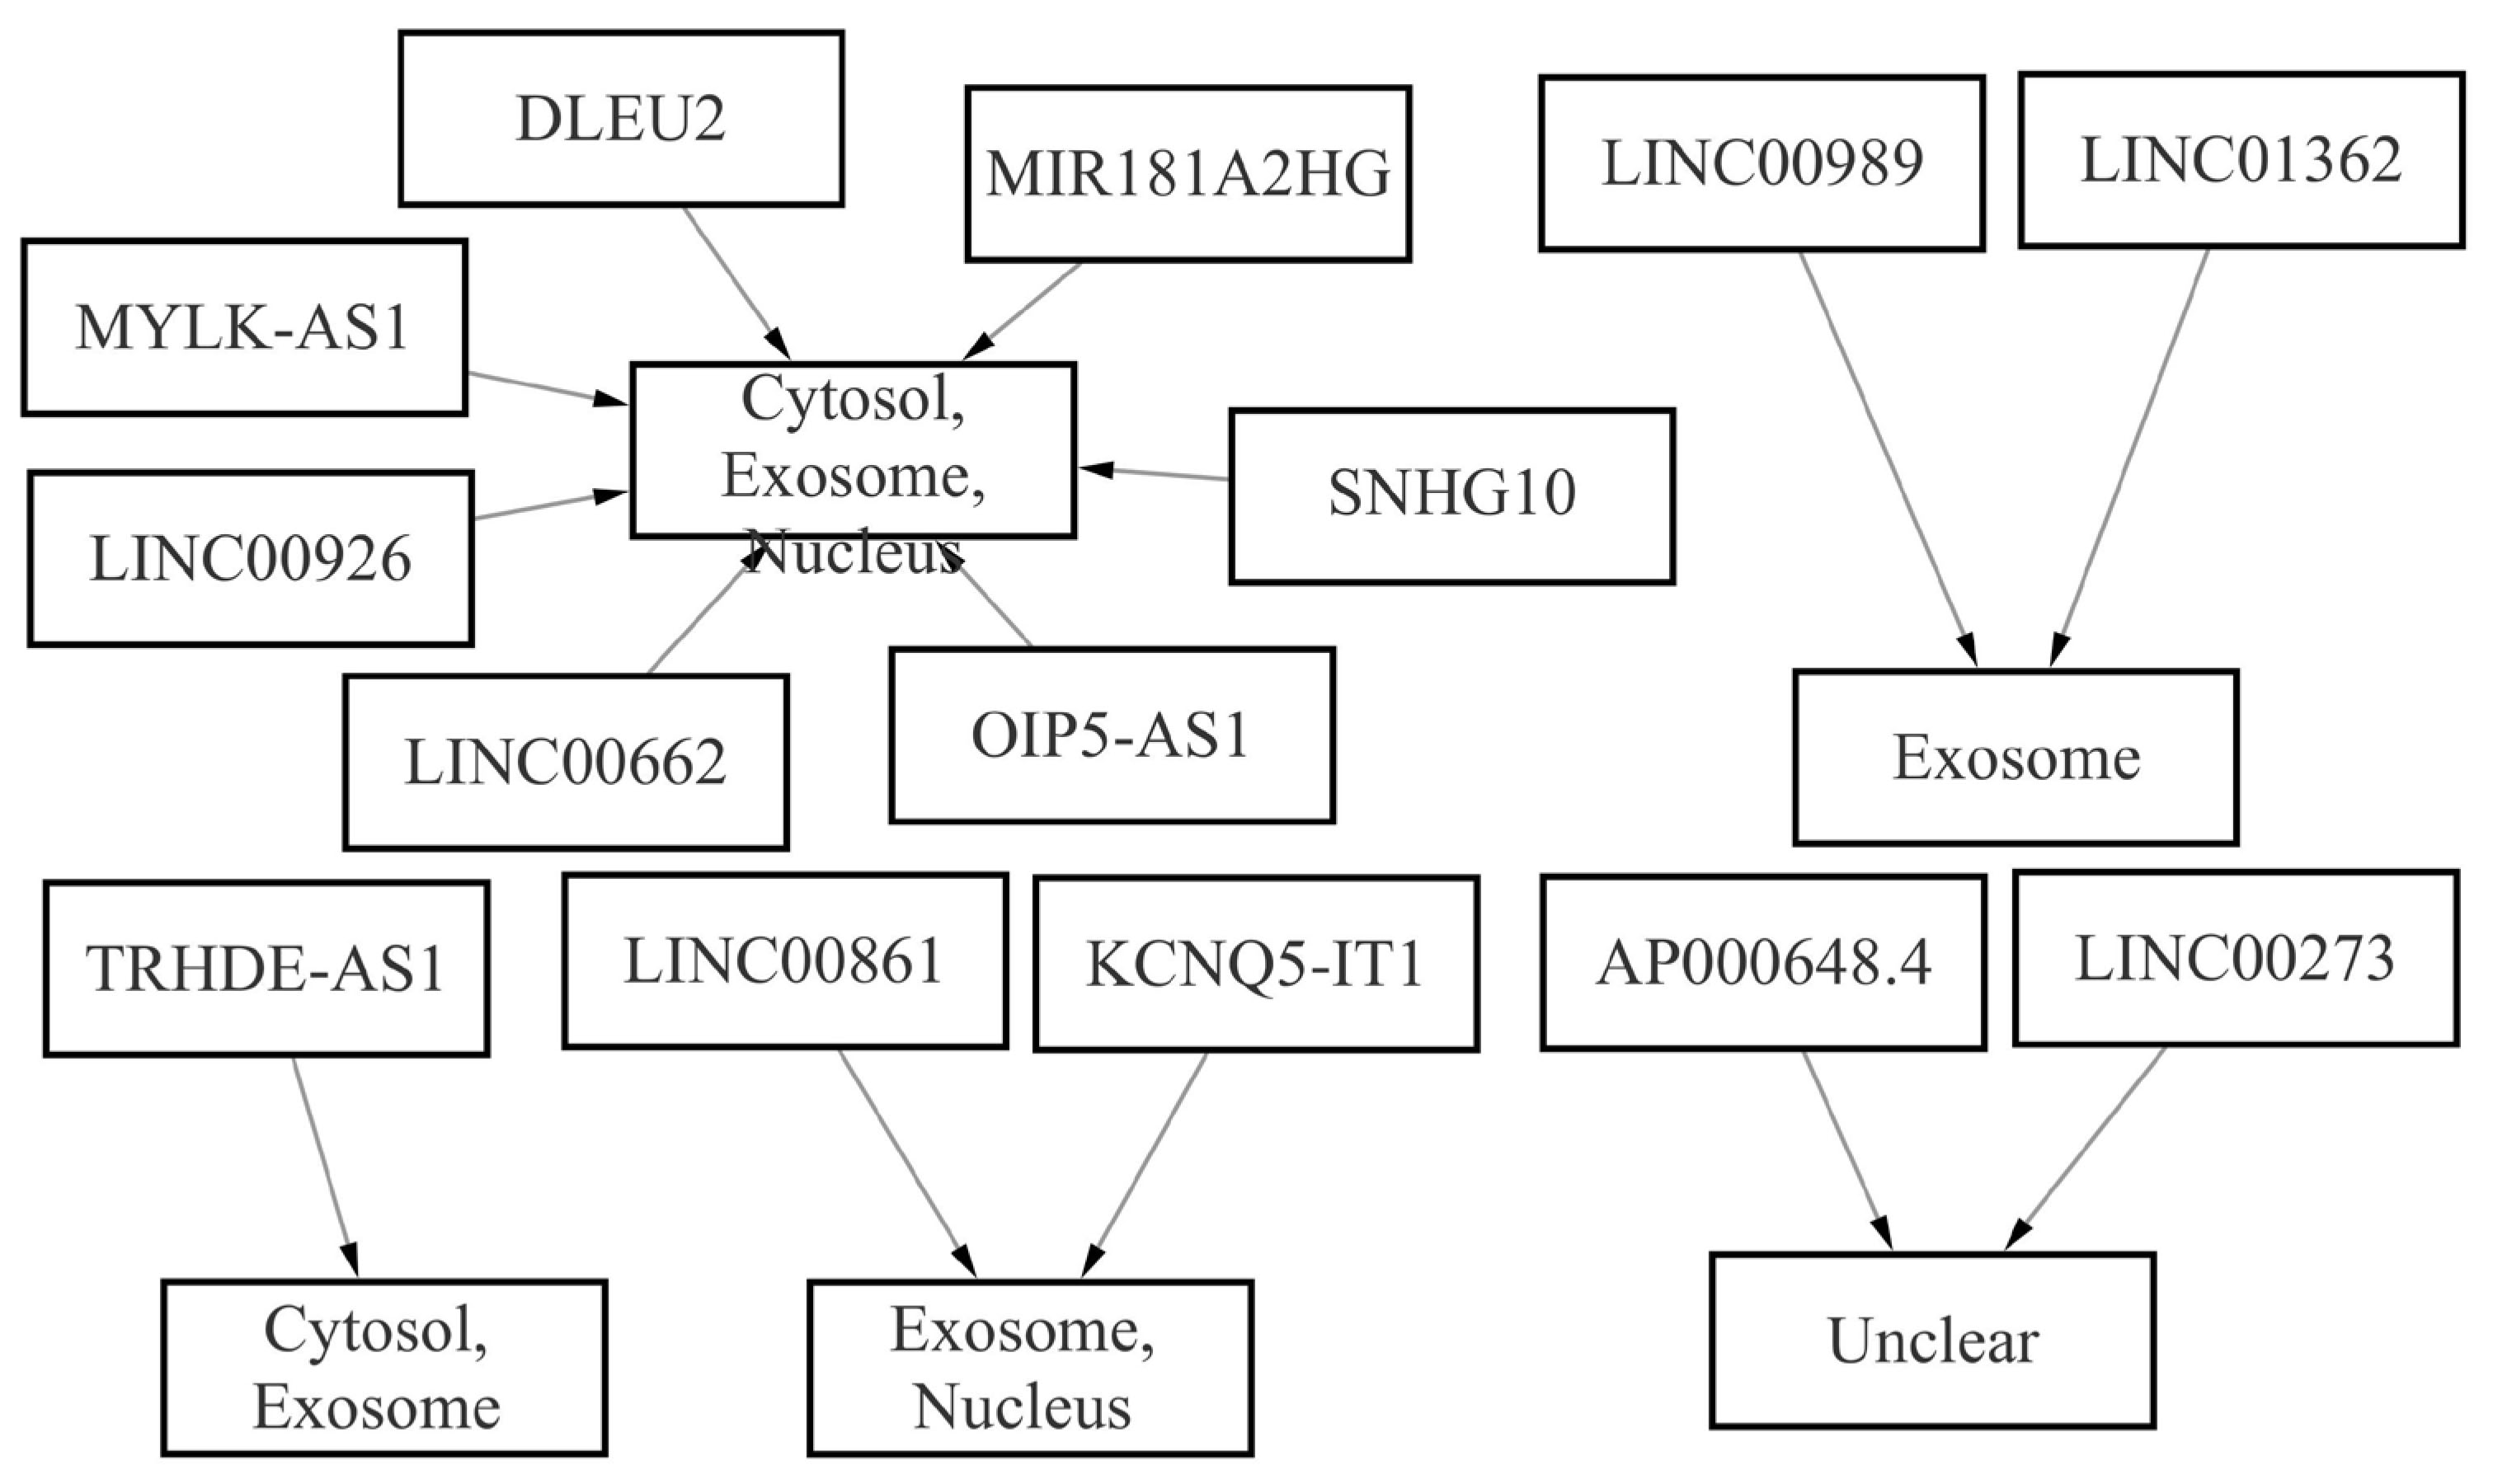 Fig. 7.
Intracellular localization of lncRNAs.
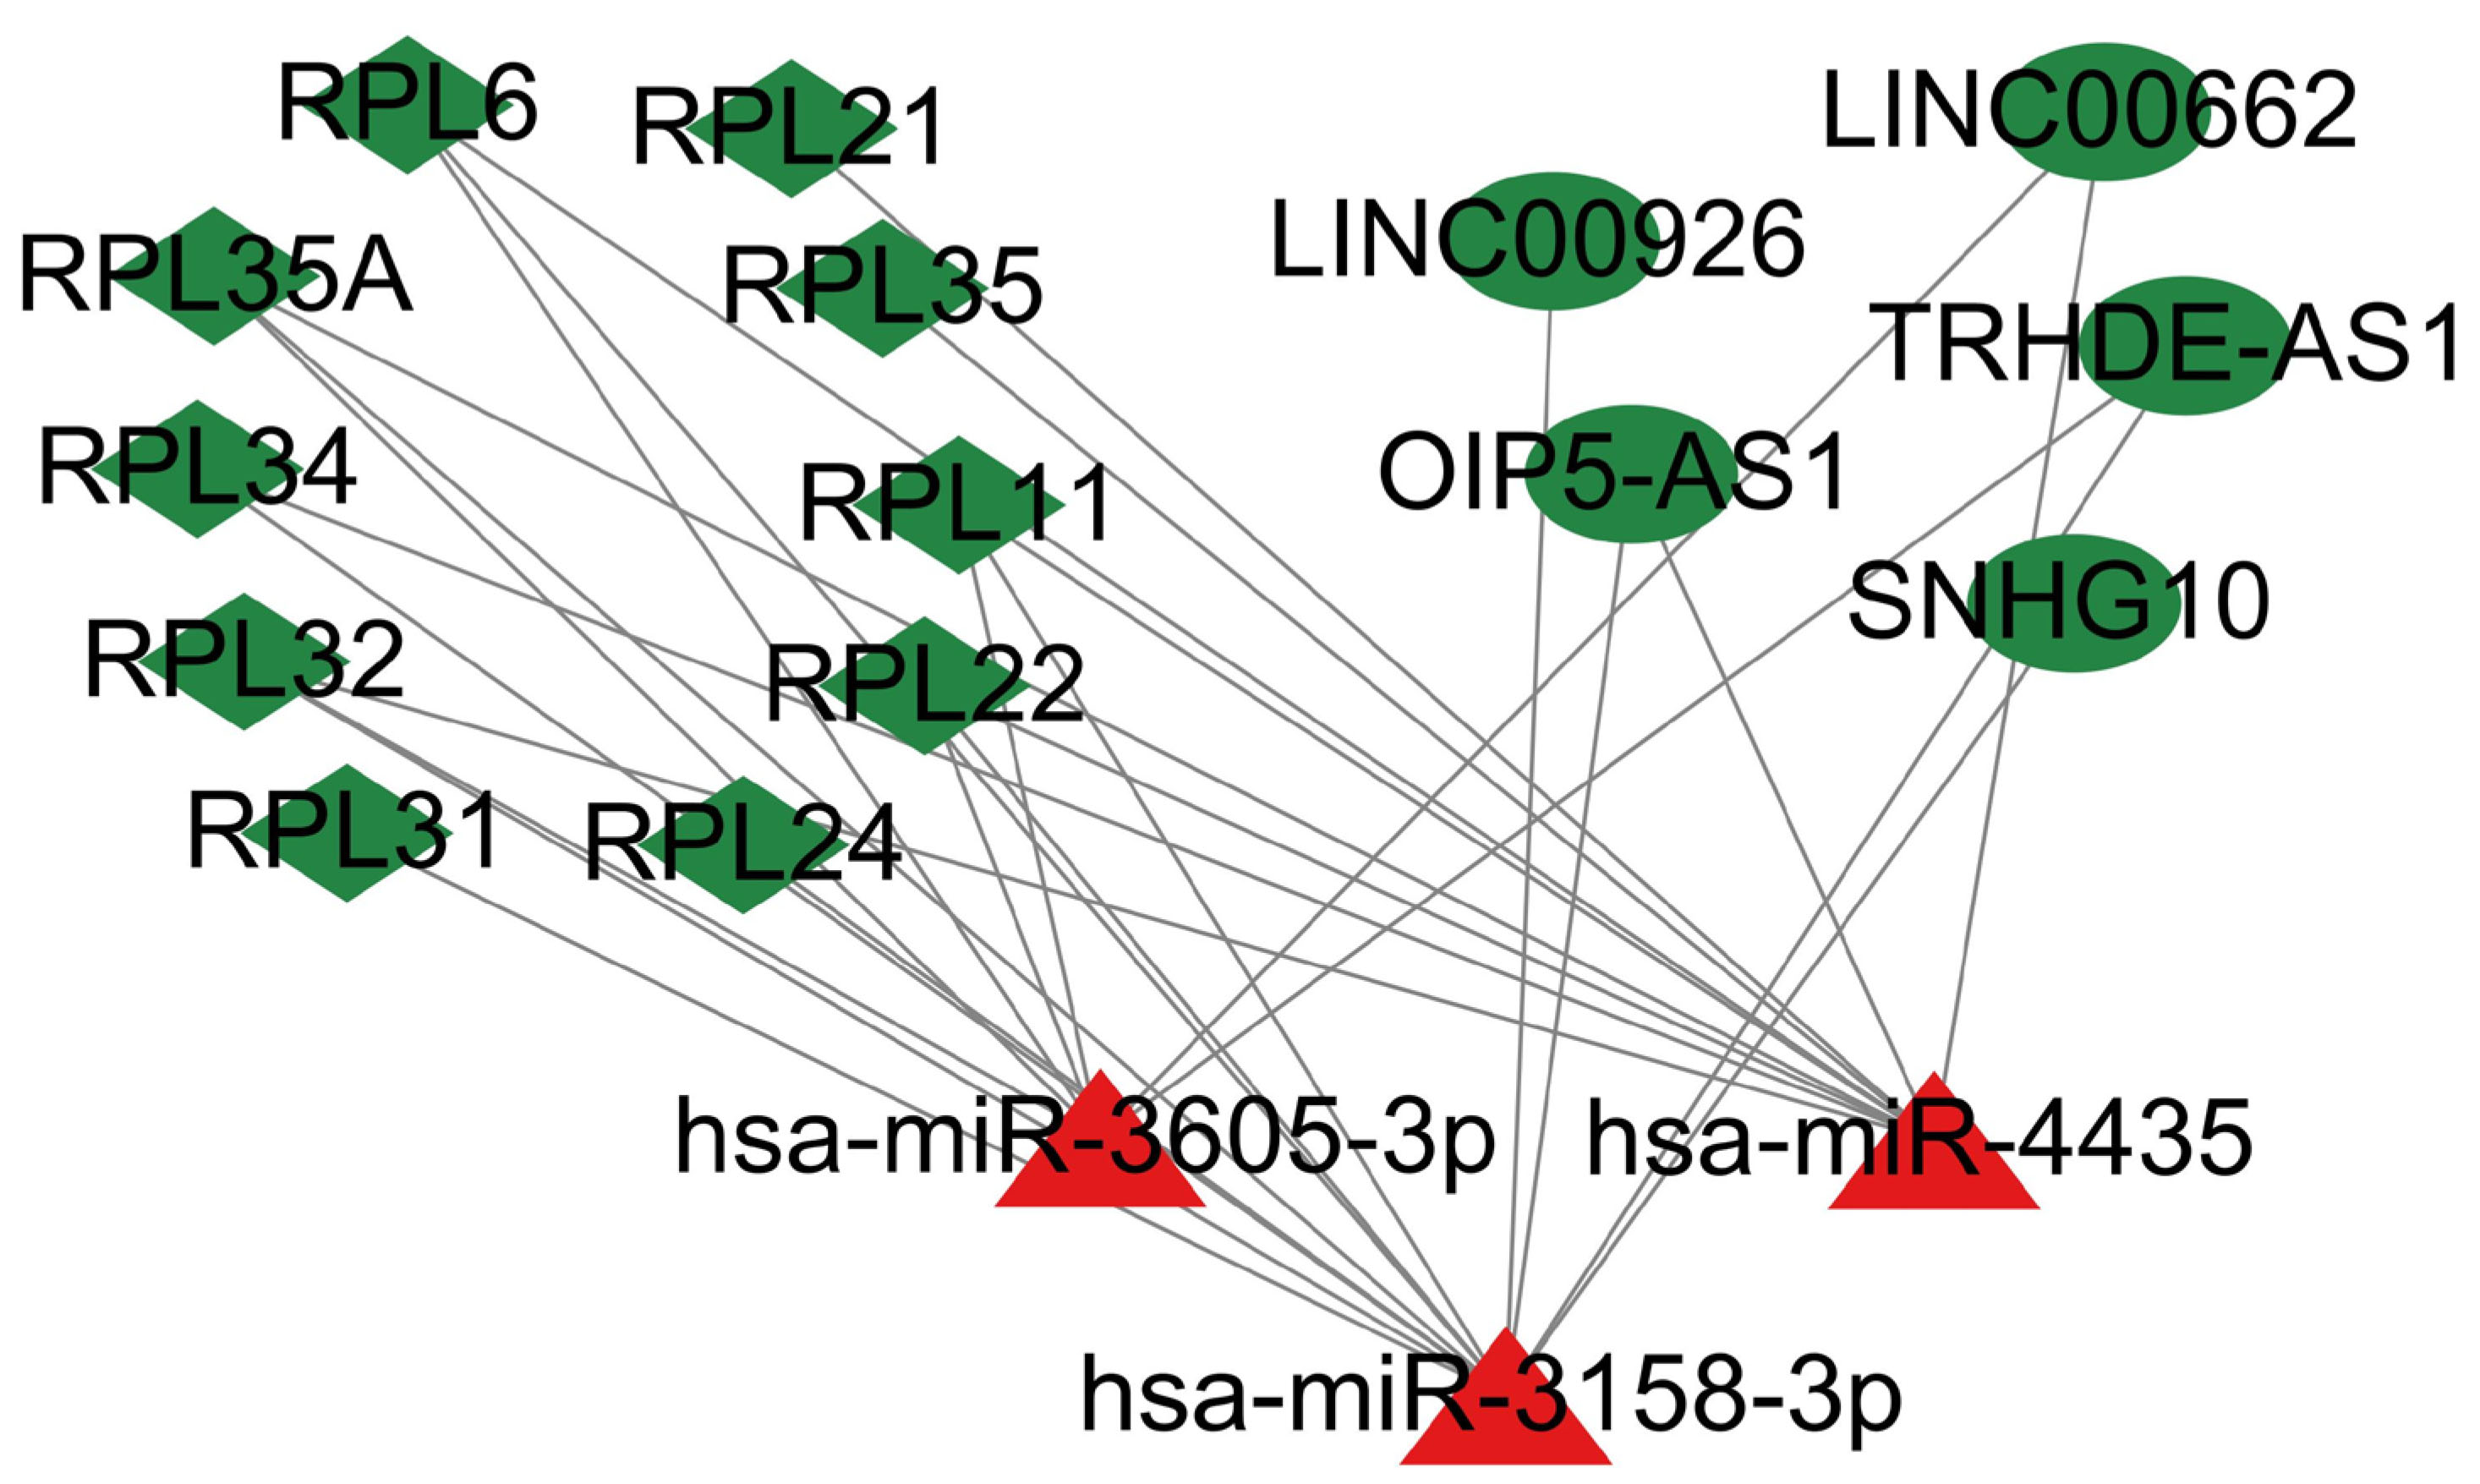 Fig. 8.
The lncRNAs-miRNAs-mRNAs network. Triangle nodes: miRNAs, ellipse-shaped nodes: lncRNAs, and diamond nodes: hub genes. Red: Upregulated nodes. Green: Downregulated nodes.
Various ceRNAs are abnormally expressed in AD [23, 24, 25] and mounting evidence has shown the relationships among dysregulated lncRNAs, circRNAs, miRNAs, and mRNAs and the construction of AD-related ceRNA networks [26]. The ceRNA network is beneficial for a deeper understanding of the AD mechanism. In this study, transcriptome data of AD patients from the GEO database was used that contained mRNAs, circRNA, lncRNAs, and miRNAs. A total of 1381 DEmRNAs, 283 DEcircRNA, 484 DElncRNAs, and 372 DEmiRNAs were identified. A circRNA/lncRNA-miRNA-mRNA ceRNA network with biologic functions in AD was constructed following bioinformatic analysis. It is noteworthy that the ceRNA hypothesis indicates that there is a negative correlation between the ceRNA and miRNA expression levels but a positive correlation with mRNA expression. Therefore, the predicted relationships were integrated with the corresponding expression data to obtain more reliable results.
Through functional enrichment analysis, the upregulated DEmRNAs were mainly associated with regulation of response to biotic stimulus, regulation of defense response and regulation of innate immune response. Additionally, the downregulated DEmRNAs were mainly involved in translation, peptide biosynthetic process and peptide metabolic process. Importantly, ten hub genes were identified (RPL11, RPL34, RPL21, RPL22, RPL6, RPL32, RPL24, RPL35, RPL31 and RPL35A) using the CytoHubba tool. These ten hub genes were found to be downregulated in AD samples. The results of enrichment analysis showed that hub genes were mainly involved in ribosomes. These hub genes are members of a ribosomal protein family, which is important for the end and correctness of translation in the ribosome [27]. Ribosomal proteins were reported to be significant parts of ribosomes and participate in regulating bioprocesses [28]. Recently, it was reported that ribosomal proteins are tightly related to the progress of AD [29, 30, 31].
Previous investigation has shown that the low expression level of RPL11
is related to ribosome pathway dysfunction during AD development, which is the
same as the conclusion of this analysis. There was evidence to suggest that
RPL11 was correlated with brain maturation [32]. RPL11
contributed to the cortical neuron function damaged by ribosomal stress in
neurodegenerative diseases [33]. Thus, it was speculated here that RPL11
may influence AD progression via the ribosome pathway. RPL34, a member of the
ribosomal protein L34E family, is a highly conserved protein and has been
demonstrated to participate in the occurrence and development of human
malignancies. No evidence showed a role for RPL34 in AD development. The
RPL21 gene was identified to be involved in Parkinson’s disease [34].
RPL22, a ribosomal protein, is induced by Cre recombinase, which
primarily participates in the formation of the 60S subunit [35]. Recent research
has demonstrated that RPL22 plays a significant role in normal T cell
development to arrest new protein synthesis by regulating endoplasmic reticulum
stress signal transduction [36] and deactivation or deficiency of the single
allele of RPL22 has been found [37]. However, its association with
neurodegenerative diseases such as AD has not been evaluated. RPL6 is a
gene encoding a 60S subribosome, which plays an important role in oxidative
phosphorylation and neuronal signal transduction in neurodegenerative diseases
such as Parkinson’s disease [38]. RPL6 has been reported to be
downregulated in Parkinson’s disease and induce 5
Three upregulated miRNAs (hsa-miR-3158-3p, hsa-miR-4435, and hsa-miR-3605-3p) were screened from AD samples in this ceRNA network. Among them, previous research has reported the upregulation of hsa-miR-4435 in AD samples [48]. This study was consistent with what is reported here. Additionally, the relationship of hsa-miR-3158-3p and hsa-miR-3605-3p with the pathogenesis of AD has not previously been reported. Similarly, five downregulated lncRNAs (TRHDE-AS1, SNHG10, OIP5-AS, LINC00926, and LINC00662) were found in AD samples. Three of them (SNHG10, OIP5-AS, and LINC00662) have been found to be correlated to the progression of AD by LncRNADisease v2.0. LINC00662 is a newly discovered long noncoding RNA. Previous study has shown that LINC00662 knockdown lowers the permeability of the blood brain barrier in the AD microenvironment due to enhanced tight junction-related protein expression levels [49]. Moreover, the ceRNA network constructed here predicted 26 differentially expressed circRNAs (see Table 4) that have been identified to be downregulated in AD. Among them, circRNA_0051620 was found to facilitate the occurrence and development of gastric cancer via acting as a miR-338-3p sponge and inhibiting ADAM17 [50]. However, there is little research on other circRNAs.
Notably, this study identified the clinical significance of several lncRNA-miRNA-mRNA and circRNA-miRNA-mRNA axes that included RPL35A and RPL35. LncRNA SNHG10 and OIP5-AS1 might be helpful for the development of AD via acting as a hsa-miR-3158-3p sponge and inhibiting the target mRNA RPL35A expression level. LncRNA LINC00662 might help the development of AD via acting as a sponge of hsa-miR-3605-3p and inhibiting the target mRNA RPL35A expression level. LncRNA OIP5-AS1 and LINC00662 might be helpful in the development of AD via acting as a sponge of hsa-miR-4435 and regulating target mRNA RPL35 expression level. Six differentially expressed circRNAs (hsa_circRNA_0090682, hsa_circRNA_0100723, hsa_circRNA_0076336, hsa_circRNA_0100174, hsa_circRNA_0001959, and hsa_circRNA_0104352) might regulate the development of AD via acting as a sponge of hsa-miR-3158-3p and inhibiting the target mRNA RPL35A expression. 11 circRNAs with differential expression (hsa_circRNA_0101760, hsa_circRNA_0002172, hsa_circRNA_0101758, hsa_circRNA_0103108, hsa_circRNA_0020990, hsa_circRNA_0051620, hsa_circRNA_0101472, hsa_circRNA_0002640, hsa_circRNA_0003057, hsa_circRNA_0102589, and hsa_circRNA_0104911) might regulate the development of AD via acting as a sponge of hsa-miR-4435 and inhibiting the expression level of target mRNA RPL35A and RPL35. Two circRNAs with differential expression (hsa_circRNA_0073593 and hsa_circRNA_0082335) might regulate the development of AD by sponging hsa-let-7d-3p and inhibiting the target mRNA RPL35A and RPL35 expression level. Ten differentially expressed circRNAs (hsa_circRNA_0090682, hsa_circRNA_0100946, hsa_circRNA_0104911, hsa_circRNA_0001276, hsa_circRNA_0100021, hsa_circRNA_0001399, hsa_circRNA_0026074, hsa_circRNA_0066331, hsa_circRNA_0076336, and hsa_circRNA_0100723) were found to be correlated to AD development via acting as a sponge of hsa-miR-330-5p and inhibiting the expression level of the target mRNA RPL35A. Hsa_circRNA_0025332 was found to be related to AD progression via acting as a sponge of hsa-miR-3605-3p and inhibiting the target mRNA RPL35A expression. Additionally, this analysis using the AlzData database showed that the target mRNA RPL35 and RPL35A were significantly associated with the clinicopathological features of AD. This study could provide new insights for understanding the interaction of ceRNA regulation and the pathogenesis of AD.
1381 differentially expressed overlapping mRNAs (711 downregulated and 670 upregulated) were identified between AD samples and control samples. 372 differentially expressed miRNAs (32 downregulated and 340 upregulated miRNAs) were obtained from AD samples compared with control samples. A total of 283 differentially expressed circRNAs (upregulation of 78 circRNAs and downregulation of 205 circRNAs) were screened. 275 upregulated lncRNAs and 209 downregulated lncRNAs were found between AD samples and control samples. Based on the ceRNA hypothesis, networks were constructed for lncRNA-miRNA-mRNA and circRNA-miRNA-mRNA, which include five lncRNAs (TRHDE-AS1, SNHG10, OIP5-AS, LINC00926 and LINC00662), 26 circRNAs, five miRNAs (hsa-miR-3158-3p, hsa-miR-4435, hsa-let-7d-3p, hsa-miR-330-5p and hsa-miR-3605-3p), and ten mRNAs (RPL11, RPL34, RPL21, RPL22, RPL6, RPL32, RPL24, RPL35, RPL31 and RPL35A). Based on the important role of RPL35 and RPL35A in AD reported in the AlzData database, the significance of the ceRNA network that includes RPL35A and RPL35 was discovered. These ceRNA networks are believed to be involved in the development of AD.
All the data supporting the results of this study are included in the manuscript and the Supplementary Documents.
LS, YW and HW designed the research study. LS, YZ and YW performed the research. LS and YZ conducted experiments. LS and YW analyzed the data. All authors contributed to editorial changes in the manuscript. All authors read and approved the final manuscript. All authors have participated sufficiently in the work and agreed to be accountable for all aspects of the work.
Not applicable.
Not applicable.
This work was supported by the project of department of health of Hebei Province (20200196), excellent youth fund for basic scientific research projects of Hebei North University (JYT2021005), youth fund for basic scientific research projects of Hebei North University (JYT2022008) and the Project of Hebei North University (H2022405030), China.
The authors declare no conflict of interest.
References
Publisher’s Note: IMR Press stays neutral with regard to jurisdictional claims in published maps and institutional affiliations.