

1 Department of Radiology, Affiliated Hospital of North Sichuan Medical College, 637000 Nanchong, Sichuan, China
†These authors contributed equally.
Abstract
Background: The frontal lobe is affected by Alzheimer’s disease (AD) and mild cognitive impairment (MCI). However, we still lack sufficient understanding of subregion atrophy in the frontal cortex, and the relationship between subregions volume and cognitive decline in AD or MCI remains unclear. Methods: This study enrolled 434 participants from the Alzheimer’s Disease Neuroimaging Initiative (ADNI), including 150 cognitively normals (CN), 187 subjects with MCI, and 97 patients with AD. The gray matter of frontal regions and subregions was divided based on the BNA-246 atlas and its volume was measured by voxel-based morphometry (VBM). Analysis of covariance was performed to compare the differences in frontal regions and subregions volume. Then, receiver operating characteristic (ROC) curve and the area under the curve (AUC) were used to analyze the discriminative ability of subregion volume to distinguish the three groups. In addition, we investigated the association of subregion volume with Mini-Mental State Examination (MMSE) score and Alzheimer’s Disease Assessment Scale-Cognitive Behavior section (ADAS-cog) scores with age, gender, education, and the estimated total intracranial volume (eTIV) as covariates. Results: In addition to the regions of frontal lobe atrophy found in previous studies, atrophy of the precentral gyrus (PrG) and some of its subregions were found in MCI. The volume of the right dorsal area 9/46 (MFG_7_1) was the best index to differentiate AD from CN, with an AUC value of 0.7. Moreover, we found that some subregions are associated with cognition in patients with MCI and AD. Conclusions: Frontal lobe atrophy in MCI is more extensive than we assumed. In addition, the volume of right MFG_7_1 has the potential to distinguish AD from CN.
Keywords
- Alzheimer's disease
- mild cognitive impairment
- structural magnetic resonance imaging
- frontal lobe
- subregion cortex
Alzheimer’s disease (AD) is the most common progressive neurodegenerative disease, leading to severe disabilities due to progressive cognitive impairments. With the population aging, the incidence of AD is rising, which imposes a heavy burden on societies. Mild cognitive impairment (MCI) is the prodromal form of AD and is a higher at-risk state for AD [1]. Despite the increase of neuroimaging studies related to AD and MCI over the past decades, the brain structural change underlying the disease has not been fully elucidated.
Gray matter (GM) changes are closely associated with tau pathology in AD
patients with abnormal accumulation of amyloids
A study found amyloid deposits in the frontal and parietal lobes in patients with mild AD [10]. More amyloid deposits may be associated with faster cortical damage [5]. Therefore, the frontal lobe should be regarded as an important site of AD-associated GM atrophy. The frontal lobe plays an important role in various cognitive processes and is essential for memory, attention, executive function (EF), and self-awareness [11]. Prefrontal cortex (PFC) integrates complex information to form the physiologic constructs of memory, perception, and intricate functions [12], which damage will severely affect executive function (EF) and working memory (WM) [13]. Among the healthy population, larger PFC volume was found to be associated with better execution performance [14]. The middle frontal cortex plays an important role in the maintenance of working memory and response inhibition [15]. The inferior frontal gyrus is pivotal for interference control processes [16]. Moreover, cognitive function is a complex neural process, requiring collaborative effects of different brain regions to operate as a functional brain network. Cognitive decline is closely related to cortical atrophy [17]. However, the relationship between frontal subregions atrophy and cognitive decline in AD or MCI is still unclear.
A reliable and accurate brain partition atlas is crucial for quantitative studies of brain structure in AD. The human Brainnetome (BN-246) atlas [18] is a tractography-based and cross-validated atlas with fine delineation of brain regions and precise boundary localization, containing information on both anatomical and functional connections. Using voxel-based morphometry (VBM), Long et al. [4] indicated that the BN-246 atlas is superior to other widely used atlases in distinguishing patients with MCI from cognitively normals (CN). Several studies used the BN-246 atlas to identify the connection between different parts of the cerebral cortex and diseases [4, 19, 20].
However, the pattern of atrophy in frontal brain regions based on the BNA-246 atlas and its relationship with the cognitive impairments in MCI and AD has not been extensively investigated. We hypothesized that: (1) The atrophy trajectory of the frontal lobe in AD is different from previous studies. (2) The volume of some subregions has a better diagnostic ability to distinguish AD from CN. (3) There is a correlation between certain subregions’ volume and cognitive impairment. This study aimed to determine the trajectory of atrophy in frontal subregions and to find which subregion can better differentiate between groups.
The data used in this study is from AD Neuroimaging Initiative (ADNI; http://adni.loni.usc.edu/). Launched in 2003, ADNI’s main goal is to combine serial MRI, positron emission tomography (PET), neuropsychological assessments, and neuroimaging to monitor disease progression in MCI and AD. we included 150 cognitively normals (CN), 187 MCI cases, and 97 AD cases from ADNI-1. The following data for each participant were obtained: T1-weighted MRI, the apolipoprotein E (APOE) genotyping data, and clinical information of patients including age, gender, years of education, Mini-Mental State Examination (MMSE), Alzheimer’s Disease Assessment Scale-Cognitive (ADAS-cog) 13, and the Clinical Dementia Rating (CDR) score. MMSE and ADAS-cog have been widely used to assess cognitive function in dementia [21, 22], or to estimate disease progression and cognitive change [23, 24, 25]. The study procedures were approved by the institutional review boards of all participating institutions. Written informed consents of neuropsychological assessment and neuroimaging were obtained from all study participants or their representatives.
The inclusion and exclusion criteria are as follows. CN subjects: MMSE score is between 24 and 30 (inclusive), CDR is 0, with no signs of MCI, dementia, or depression. MCI subjects: MMSE score is between 24 and 30 (inclusive), CDR is 0.5, and there was a report of a subjective memory problem. With no obvious degree of damage in other cognitive areas, activities of daily living are basically maintained without dementia. Patients with AD met the Alzheimer’s Disease and Related Disorders Association (ADRDA) criteria for probable AD [26]. All subjects in our study are prohibited or restricted from using psychotropic substances. More details can be found in ADNI (website: http://adni.loni.usc.edu/).
MRI data were collected according to a standardized protocol [27]. This protocol
included a high-resolution T1-weighted, rapid gradient echo sequence on a 1.5 T
scanner. Acquisition parameters of high resolution T1-weighted fast gradient echo
sequence for one platform (Siemens Magnetom Sonata syngo MR 2004 A) were as
follows: T1 = 1000 ms, TR = 2400 ms, TE = 3.5, flip Angle = 8, FOV = 240 mm,
acquisition matrix = 192
All sMRI data were processed with the VBM toolbox (VBM8, c.gaser, Structural Brain Mapping group, Jena University Hospital, Jena, Germany, version 414, http://dbm.neuro.uni-jena.de/vbm8/) implemented in Statistical Parametric Mapping software version 8 (SPM8; Wellcome TrustCenter for Neuroimaging, London, UK; http://www.fil.ion.ucl.ac.uk/spm). At first, the T1-weighted image was manually repositioned to the anterior commissure. After unifing segmentation in SPM8, MRI images were segmented into the GM, white matter, cerebral spinal fluid, bone, and soft tissue. GM neuroimages were normalized to a population template in Montreal Neurological Institute space with the high-dimensional DARTEL normalization algorithm. The normalized images were modulated with Jacobian matrices to preserve the actual amounts of a tissue class within each voxel. Then, the modulated images were smoothed with an 8-mm full width at half-maximum Gaussian kernel. Each neuroimage was put into non-linear modulation that displayed the absolute amount of brain tissue, corrected for subject headsize in VBM8. The total cranial internal volume (i.e., estimated total intracranial volume (eTIV)) was calculated based on the sum of GM, WM, and CSF volume obtained from the unstandardized segmented image.
The processed sMRI images were utilized to extract the volume. BNA-246 atlas was used for frontal lobe parcellation. The frontal lobe cortex was divided into six regions, including superior frontal gyrus (SFG), middle frontal gyrus (MFG), inferior frontal gyrus (IFG), orbital gyrus (OrG), precentral gyrus (PrG) and paracentral lobule (PCL). Then, they were divided into 34 regions in each hemisphere, the SFG was divided into seven functional subregions, the MFG was divided into seven functional subregions, the IFG was divided into six functional subregions, the OrG was divided into six functional subregions, the PrG was divided into six functional subregions, and the PCL was divided into two functional subregions (Table 1, Ref. [18]). RESTplus software package (http://www.restfmri.net) was used to extract gray matter volume.
| The names of frontal lobe subregions from Brainnetome Atlas | Anatomical description | |
| Superior frontal gyrus (SFG) | ||
| SFG_L(R)_7_1 | A8m, medial area 8 | |
| SFG_L(R)_7_2 | A8dl, dorsolateral area 8 | |
| SFG_L(R)_7_3 | A9l, lateral area 9 | |
| SFG_L(R)_7_4 | A6dl, dorsolateral area 6 | |
| SFG_L(R)_7_5 | A6m, medial area 6 | |
| SFG_L(R)_7_6 | A9m, medial area 9 | |
| SFG_L(R)_7_7 | A10m, medial area 10 | |
| Middle frontal gyrus (MFG) | ||
| MFG_L(R)_7_1 | A9/46d, dorsal area 9/46 | |
| MFG_L(R)_7_2 | IFJ, inferior frontal junction | |
| MFG_L(R)_7_3 | A46, area 46 | |
| MFG_L(R)_7_4 | A9/46v, ventral area 9/46 | |
| MFG_L(R)_7_5 | A8vl, ventrolateral area 8 | |
| MFG_L(R)_7_6 | A6vl, ventrolateral area 6 | |
| MFG_L(R)_7_7 | A10l, lateral area10 | |
| Inferior frontal gyrus (IFG) | ||
| IFG_L(R)_6_1 | A44d, dorsal area 44 | |
| IFG_L(R)_6_2 | IFS, inferior frontal sulcus | |
| IFG_L(R)_6_3 | A45c, caudal area 45 | |
| IFG_L(R)_6_4 | A45r, rostral area 45 | |
| IFG_L(R)_6_5 | A44op, opercular area 44 | |
| IFG_L(R)_6_6 | A44v, ventral area 44 | |
| Orbital gyrus (OrG) | ||
| OrG_L(R)_6_1 | A14m, medial area 14 | |
| OrG_L(R)_6_2 | A12/47o, orbital area 12/47 | |
| OrG_L(R)_6_3 | A11l, lateral area 11 | |
| OrG_L(R)_6_4 | A11m, medial area 11 | |
| OrG_L(R)_6_5 | A13, area 13 | |
| OrG_L(R)_6_6 | A12/47l, lateral area 12/47 | |
| Precentral gyrus (PrG) | ||
| PrG_L(R)_6_1 | A4hf, area 4 (head and face region) | |
| PrG_L(R)_6_2 | A6cdl, caudal dorsolateral area 6 | |
| PrG_L(R)_6_3 | A4ul, area 4 (upper limb region) | |
| PrG_L(R)_6_4 | A4t, area 4 (trunk region) | |
| PrG_L(R)_6_5 | A4tl, area 4 (tongue and larynx region) | |
| PrG_L(R)_6_6 | A6cvl, caudal ventrolateral area 6 | |
| Paracentral lobule (PCL) | ||
| PCL_L(R)_2_1 | A1/2/3ll, area1/2/3 (lower limb region) | |
| PCL_L(R)_2_2 | A4ll, area 4 (lower limb region) | |
Abbreviations: The names of frontal lobe regions and their corresponding anatomical descriptions are from the Brainnetome Atlas [18]; SFG_L(R)_7_1, SFG_7_1 in the left hemisphere or SFG_7_1 in the right hemisphere; MFG_L(R)_7_1, MFG_7_1 in the left hemisphere or in the right hemisphere; IFG_L(R)_6_1, IFG_6_1 in the left hemisphere or in the right hemisphere; OrG_L(R)_6_1, OrG_6_1 in the left hemisphere or in the right hemisphere; PrG_L(R)_6_1, PrG_6_1 in the left hemisphere or in the right hemisphere; PCL_L(R)_2_1, PCL_2_1 in the left hemisphere or in the right hemisphere.
Statistical analysis was performed using Statistical Package for Social Sciences
software IBM SPSS 28.0 (IBM Corp., Armonk, NY, USA). Data with normal
distribution are expressed as mean
Table 2 shows the age, gender, education, APOE4 genotype, and scores of MMSE,
CDR and ADAS-cog 13. There were no differences in age between groups. The male
proportion was higher in the MCI than in CN (p =0.015) and AD
(p = 0.022) groups. Education level was lower in the AD group than in
MCI (p = 0.008) and CN (p = 0.026). There were significant
differences between the groups in APOE
| CN (n = 150) | MCI (n = 187) | AD (n = 97) | p-value | ||||
| CN vs MCI vs AD | MCI vs CN | AD vs MCI | CN vs AD | ||||
| Age, y (mean |
76.0 |
75.1 |
75.0 |
0.347 | 0.395 | 0.576 | 1 |
| Gender (male/female) | 77/73 | 121/66 | 49/48 | 0.015 | 0.022 | 1 | |
| Education (year) | 16.0 |
15.8 |
14.8 |
0.007 | 1 | 0.008 | 0.026 |
| APOE4 (Carries#/no carries) | 43/107 | 103/84 | 67/20 | 0.016 | |||
| MMSE | 29.2 |
26.8 |
23.1 |
||||
| CDR | 0 (150) | 0.5 (186) 1 (1) | 0.5 (43) | ||||
| 1 (54) | |||||||
| ADAS-cog 13 | 5.8 |
11.4 |
19.1 |
||||
Abbreviations: “#”, One or two copies of
We measured differences in frontal regions and subregion volumes between the groups using ANCOVA with age, gender, years of education, and eTIV as covariates. The results are shown in Table 3. We found that the volume of SFG, MFG, IFG, and PrG decreased in a stepwise manner in CN, MCI, and AD groups. Compared with the CN group, the volume of most subregions of SFG, MFG, IFG, and OrG was decreased in the MCI group. In addition, right PrG_6_2 and left PrG_6_6 atrophy were evidence.
| Brain regions or subregions | CN (n = 150) | MCI (n = 187) | AD (n = 97) | p-value | ||
| MCI vs CN | AD vs CN | MCI vs AD | ||||
| SFG | 0.40 |
0.39 |
0.38 |
0.014* | 0.073 | |
| SFG_L_7_1 | 0.43 |
0.42 |
0.41 |
0.443 | 0.025* | 0.433 |
| SFG_R_7_1 | 0.43 |
0.41 |
0.40 |
0.23 | 0.036* | |
| SFG_L_7_2 | 0.42 |
0.40 |
0.38 |
0.034* | 0.056 | |
| SFG_R_7_2 | 0.43 |
0.40 |
0.39 |
0.05 | 0.202 | |
| SFG_L_7_3 | 0.30 |
0.28 |
0.27 |
0.198 | 0.004* | 0.261 |
| SFG_R_7_3 | 0.32 |
0.30 |
0.30 |
0.161 | 0.012* | 0.571 |
| SFG_L_7_4 | 0.38 |
0.36 |
0.34 |
0.183 | 0.002* | 0.176 |
| SFG_R_7_4 | 0.38 |
0.35 |
0.34 |
0.018* | 0.002* | 0.799 |
| SFG_L_7_5 | 0.45 |
0.44 |
0.43 |
0.284 | 0.020* | 0.531 |
| SFG_R_7_5 | 0.43 |
0.42 |
0.41 |
0.301 | 0.025* | 0.569 |
| SFG_L_7_6 | 0.47 |
0.45 |
0.45 |
0.095 | 0.002* | 0.252 |
| SFG_R_7_6 | 0.45 |
0.43 |
0.42 |
0.038* | 0.093 | |
| SFG_L_7_7 | 0.39 |
0.37 |
0.37 |
0.024* | 0.001* | 0.465 |
| SFG_R_7_7 | 0.39 |
0.37 |
0.37 |
0.014* | 0.001* | 0.382 |
| MFG | 0.32 |
0.30 |
0.29 |
0.304 | ||
| MFG_L_7_1 | 0.40 |
0.38 |
0.36 |
0.003* | 0.020* | |
| MFG_R_7_1 | 0.46 |
0.42 |
0.41 |
0.092 | ||
| MFG_L_7_2 | 0.43 |
0.41 |
0.40 |
0.036* | 0.076 | |
| MFG_R_7_2 | 0.44 |
0.43 |
0.40 |
0.297 | 0.009* | |
| MFG_L_7_3 | 0.35 |
0.32 |
0.31 |
0.002* | 0.402 | |
| MFG_R_7_3 | 0.39 |
0.36 |
0.35 |
0.108 | ||
| MFG_L_7_4 | 0.43 |
0.40 |
0.40 |
0.005* | 0.001* | 0.956 |
| MFG_R_7_4 | 0.44 |
0.41 |
0.39 |
0.003* | 0.556 | |
| MFG_L_7_5 | 0.40 |
0.36 |
0.34 |
0.009* | 0.030* | |
| MFG_R_7_5 | 0.38 |
0.35 |
0.33 |
0.006* | 0.267 | |
| MFG_L_7_6 | 0.42 |
0.40 |
0.37 |
0.094 | 0.025* | |
| MFG_R_7_6 | 0.41 |
0.389 |
0.369 |
0.048* | 0.245 | |
| MFG_L_7_7 | 0.37 |
0.34 |
0.34 |
0.009* | 0.004* | 1 |
| MFG_R_7_7 | 0.41 |
0.38 |
0.38 |
0.022* | 0.006* | 1 |
| IFG | 0.44 |
0.41 |
0.40 |
0.006* | 0.018* | |
| IFG_L_6_1 | 0.49 |
0.47 |
0.45 |
0.092 | 0.081 | |
| IFG_R_6_1 | 0.47 |
0.44 |
0.43 |
0.016* | 0.497 | |
| IFG_L_6_2 | 0.39 |
0.35 |
0.35 |
0.006* | 0.073 | |
| IFG_R_6_2 | 0.46 |
0.43 |
0.44 |
0.009* | 0.004* | 1 |
| IFG_L_6_3 | 0.39 |
0.39 |
0.38 |
1 | 0.319 | 0.926 |
| IFG_R_6_3 | 0.38 |
0.37 |
0.36 |
0.433 | 0.051 | 0.685 |
| IFG_L_6_4 | 0.38 |
0.35 |
0.35 |
0.018* | 0.004* | 0.948 |
| IFG_R_6_4 | 0.42 |
0.40 |
0.38 |
0.616 | 0.018* | 0.238 |
| IFG_L_6_5 | 0.41 |
0.39 |
0.38 |
0.003* | 0.856 | |
| IFG_R_6_5 | 0.48 |
0.46 |
0.45 |
0.037* | 0.001* | 0.359 |
| IFG_L_6_6 | 0.48 |
0.46 |
0.46 |
0.136 | 0.014* | 0.647 |
| IFG_R_6_6 | 0.49 |
0.46 |
0.44 |
0.572 | 0.014* | |
| OrG | 0.57 |
0.54 |
0.54 |
0.002* | 0.169 | |
| OrG_L_6_1 | 0.50 |
0.47 |
0.47 |
0.004* | 0.004* | 1 |
| OrG_R_6_1 | 0.57 |
0.54 |
0.52 |
0.242 | ||
| OrG_L_6_2 | 0.56 |
0.54 |
0.53 |
0.073 | 0.004* | 0.556 |
| OrG_R_6_2 | 0.52 |
0.50 |
0.50 |
0.136 | 0.022* | 0.872 |
| OrG_L_6_3 | 0.63 |
0.60 |
0.59 |
0.014* | 0.397 | |
| OrG_R_6_3 | 0.62 |
0.59 |
0.59 |
0.022* | 0.003* | 0.799 |
| OrG_L_6_4 | 0.50 |
0.47 |
0.48 |
0.024* | 0.036* | 1 |
| OrG_R_6_4 | 0.40 |
0.39 |
0.39 |
0.274 | 0.037* | 0.803 |
| OrG_L_6_5 | 0.67 |
0.64 |
0.62 |
0.006* | 0.006* | |
| OrG_R_6_5 | 0.64 |
0.61 |
0.59 |
0.003* | 0.030* | |
| OrG_L_6_6 | 0.53 |
0.49 |
0.49 |
0.004* | 0.359 | |
| OrG_R_6_6 | 0.57 |
0.54 |
0.53 |
0.037* | 0.001* | 0.377 |
| PrG | 0.39 |
0.37 |
0.36 |
0.082 | 0.030* | |
| PrG_L_6_1 | 0.39 |
0.37 |
0.37 |
0.424 | 0.092 | 1 |
| PrG_R_6_1 | 0.36 |
0.35 |
0.34 |
0.304 | 0.025* | 0.58 |
| PrG_L_6_2 | 0.41 |
0.39 |
0.37 |
0.08 | 0.145 | |
| PrG_R_6_2 | 0.42 |
0.40 |
0.38 |
0.027* | 0.022* | |
| PrG_L_6_3 | 0.29 |
0.29 |
0.29 |
1 | 1 | 1 |
| PrG_R_6_3 | 0.31 |
0.31 |
0.31 |
1 | 0.93 | 1 |
| PrG_L_6_4 | 0.23 |
0.24 |
0.22 |
0.803 | 1 | 0.443 |
| PrG_R_6_4 | 0.28 |
0.28 |
0.28 |
1 | 1 | 1 |
| PrG_L_6_5 | 0.49 |
0.49 |
0.48 |
1 | 0.181 | 0.377 |
| PrG_R_6_5 | 0.46 |
0.46 |
0.44 |
1 | 0.46 | 0.498 |
| PrG_L_6_6 | 0.46 |
0.43 |
0.40 |
0.002* | 0.004* | |
| PrG_R_6_6 | 0.43 |
0.40 |
0.37 |
0.066 | 0.002* | |
| PCL | 0.44 |
0.43 |
0.43 |
0.69 | 0.433 | 1 |
| PCL_L_2_1 | 0.46 |
0.44 |
0.45 |
0.556 | 1 | 1 |
| PCL_R_2_1 | 0.48 |
0.46 |
0.46 |
0.192 | 0.111 | 1 |
| PCL_L_2_2 | 0.42 |
0.42 |
0.42 |
1 | 1 | 1 |
| PCL_R_2_2 | 0.43 |
0.42 |
0.42 |
0.93 | 0.59 | 1 |
Abbreviations: *p
The AUC values for the three groups are summarized in Supplementary
Table 1. All p values were
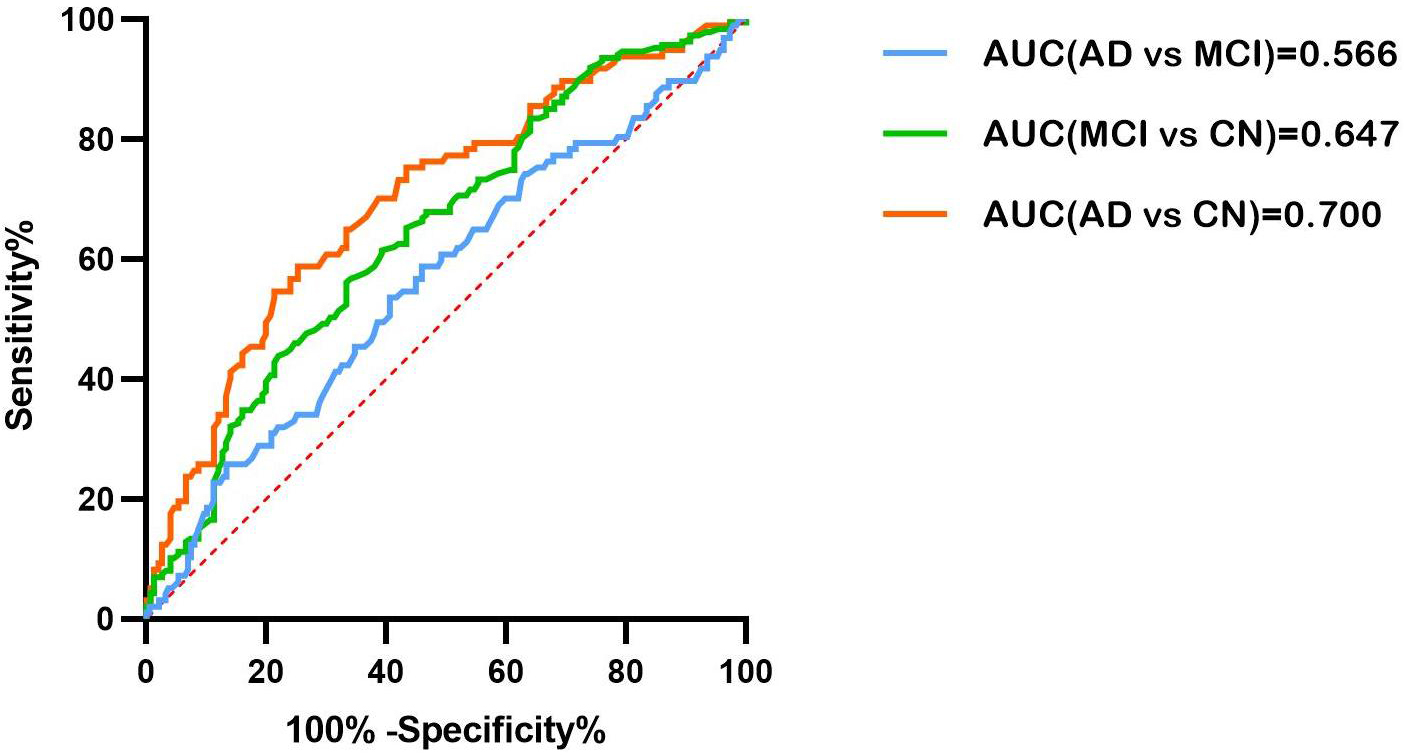
 Fig. 1.
The ROC curve of the right MFG_7_1 volume in differentiating between AD and MCI (blue), MCI and CN (green), and AD and CN (red). AUC, area under the curve; ROC, receiver operating characteristic; MFG, Middle frontal gyrus; AD, Alzheimer’s disease; MCI, mild cognitive impairment.
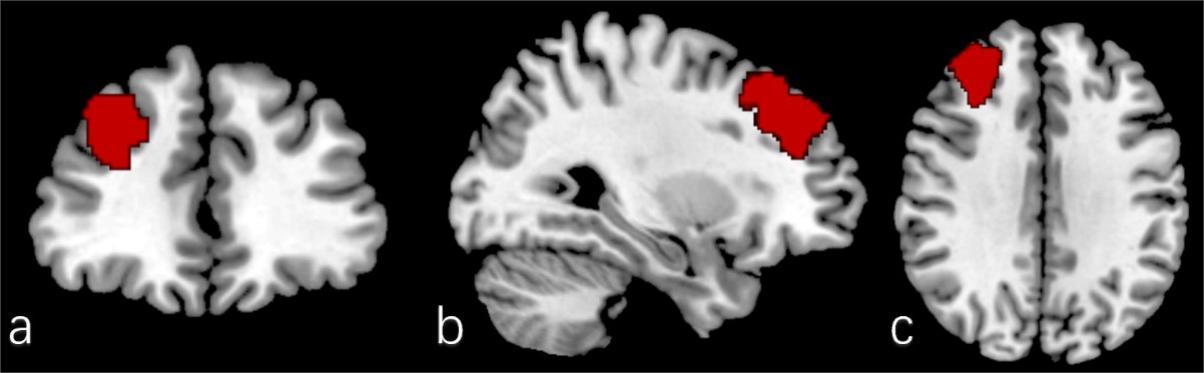
 Fig. 2.
The position of the right MFG_7_1 in the brain (red). (a) Coronal. (b) Sagittal. (c) Axial.
The frontal subregions related to MMSE or ADAS-cog scores in patients with MCI
are shown in Table 4. Only subregions that were statistically related to MMSE or
ADAS-cog 13 are displayed, (see more details in Supplementary Table 2).
There were 26 frontal subregions with slightly negative correlations with
ADAS-cog 13 scores. The strongest associations were observed for the right
SFG_7_3 (r = –0.203, p = 0.006) and the right MFG_7_5 (r = –0.278,
p
| MMSE | ADAS-cog 13 | |||
| r | p-value | r | p-value | |
| SFG_L_7_1 | –0.035 | 0.641 | –0.157 | 0.034* |
| SFG_R_7_1 | –0.031 | 0.679 | –0.175 | 0.018* |
| SFG_L_7_2 | 0.049 | 0.514 | –0.182 | 0.014* |
| SFG_R_7_2 | 0.021 | 0.777 | –0.184 | 0.013* |
| SFG_L_7_3 | 0.013 | 0.864 | –0.199 | 0.007* |
| SFG_R_7_3 | –0.035 | 0.641 | –0.203 | 0.006* |
| SFG_L_7_4 | 0.092 | 0.275 | –0.165 | 0.026* |
| SFG_R_7_4 | 0.055 | 0.463 | –0.192 | 0.009* |
| SFG_L_7_7 | 0.021 | 0.774 | –0.17 | 0.021* |
| MFG_L_7_1 | 0.059 | 0.428 | –0.188 | 0.011* |
| MFG_R_7_1 | 0.089 | 0.232 | –0.17 | 0.022* |
| MFG_R_7_2 | 0.033 | 0.656 | –0.156 | 0.035* |
| MFG_R_7_3 | 0.129 | 0.082 | –0.158 | 0.032* |
| MFG_R_7_4 | 0.005 | 0.944 | –0.175 | 0.018* |
| MFG_L_7_5 | 0.079 | 0.29 | –0.168 | 0.023* |
| MFG_R_7_5 | 0.067 | 0.371 | –0.278 | |
| MFG_L_7_6 | 0.07 | 0.334 | –0.201 | 0.006* |
| MFG_R_7_6 | 0.048 | 0.521 | –0.199 | 0.007* |
| IFG_R_6_4 | 0.056 | 0.449 | –0.202 | 0.006* |
| OrG_L_6_5 | –0.104 | 0.16 | –0.218 | 0.003* |
| OrG_R_6_5 | 0.099 | 0.184 | –0.179 | 0.015* |
| ORG_R_6_6 | 0.059 | 0.427 | –0.184 | 0.013* |
| PrG_L_6_2 | 0.049 | 0.507 | –0.245 | |
| PrG_R_6_2 | 0.103 | 0.164 | –0.257 | |
| PRG_R_6_5 | 0.116 | 0.119 | –0.205 | 0.005* |
| PCL_L_2_1 | 0.021 | 0.778 | –0.183 | 0.013* |
Abbreviations: *p
For patients with AD, the subregions of frontal lobe related to MMSE or ADAS-cog
13 scores are shown in Table 5 (Only subregions that are statistically related to
MMSE or ADAS-cog 13 are displayed, see more details in Supplementary
Table 2). Several subregions had slightly positive correlations with MMSE
scores, with the strongest associations for right IFG_6_5 (r = –0.299,
p = 0.004). Significantly moderate correlation coefficients were
observed in right IFG_6_1 (r = –0.321, p = 0.002), left IFG_6_2 (r
= –0.308, p = 0.003), right IFG_6_3 (r = –0.309, p =
0.003), right IFG_6_5 (r = –0.333, p = 0.001), right OrG_6_5 (r =
–0.351, p
| MMSE | ADAS-cog 13 | |||
| r | p-value | r | p-value | |
| SFG_L_7_2 | 0.218 | 0.035* | –0.23 | 0.027* |
| SFG_L_7_3 | 0.1119 | 0.256 | –0.21 | 0.043* |
| SFG_R_7_6 | 0.216 | 0.038* | –0.149 | 0.155 |
| MFG_L_7_1 | 0.183 | 0.078 | –0.222 | 0.033* |
| MFG_R_7_1 | 0.236 | 0.023* | –0.206 | 0.047* |
| MFG_R_7_3 | 0.266 | 0.01* | –0.212 | 0.042* |
| MFG_L_7_4 | 0.172 | 0.1 | –0.025 | 0.049* |
| MFG_L_7_7 | 0.202 | 0.052 | –0.239 | 0.021* |
| IFG_L_6_1 | 0.175 | 0.094 | –0.289 | 0.005* |
| IFG_R_6_1 | 0.094 | 0.368 | –0.321 | 0.002* |
| IFG_L_6_2 | 0.062 | 0.555 | –0.308 | 0.003* |
| IFG_L_6_3 | –0.024 | 0.822 | –0.252 | 0.015* |
| IFG_R_6_3 | 0.216 | 0.038* | –0.309 | 0.003* |
| IFG_L_6_4 | 0.124 | 0.238 | –0.28 | 0.007* |
| IFG_L_6_5 | 0.169 | 0.105 | –0.254 | 0.014* |
| IFG_R_6_5 | 0.299 | 0.004* | –0.333 | 0.001* |
| OrG_L_6_1 | 0.162 | 0.121 | –0.258 | 0.013* |
| OrG_R_6_1 | 0.147 | 0.158 | –0.273 | 0.008* |
| OrG_L_6_2 | 0.19 | 0.068 | –0.226 | 0.03* |
| OrG_R_6_2 | 0.159 | 0.1229 | –0.228 | 0.028* |
| OrG_L_6_4 | 0.163 | 0.118 | –0.221 | 0.033* |
| OrG_R_6_4 | 0.089 | 0.394 | –0.276 | 0.007* |
| OrG_L_6_5 | 0.138 | 0.186 | –0.295 | 0.004* |
| OrG_R_6_5 | 0.212 | 0.042* | –0.351 | |
| OrG_L_6_6 | 0.183 | 0.079 | –0.282 | 0.006* |
| OrG_R_6_6 | 0.283 | 0.006* | –0.326 | 0.001* |
Abbreviations: *p
In this study, we first compared grey matter volume (GMV) in frontal regions and subregions between AD, MCI, and CN groups. Then, the AUC results demonstrated that the right MFG_7_1 has a satisfactory ability to distinguish between AD and CN. Furthermore, after adjustment for age, gender, years of education, and eTIV, we found that the right IFG_6_1, the left IFG_6_3, the right IFG_6_3, the right IFG_6_5, the right OrG_6_5, and the right OrG_6_6 with ADAS-cog 13 score and slightly correlated with MMSE score in patients with AD.
In our study, widespread cortical atrophy was found in the bilateral frontal lobes in patients with MCI, which was exacerbated by disease progression [7, 8, 9]. The right dorsal area 9/46 (right MFG_7_1) showed a more severe atrophy and its volume is the best one to distinguish AD patients from CN. In addition, PrG subregion atrophy was found in patients with MCI. Machine learning has suggested that the precentral gyrus is one of several regions affected by AD [28]. However, no studies reported decreased PrG volume in MCI patients through voxel-based morphometry. Compared with previous studies of MCI [7, 9], our results suggested more extensive frontal cortical deficits. Using magnetic resonance elastography (MRE), Lucy et al. [29] identified stiffness deficits in the frontal operculum and PrG. PrG_6_6 corresponds to the caudal ventrolateral area 6 [18], and controls muscle contraction and speech [30]. Moreover, it may control eye blinking [31], and an abnormally high eye blink rate may be characteristic of subjects with MCI [32].
The frontal cortex is a heterogeneous region with multiple functional subdivisions, and damage to different subdivisions can impair different cognitive functions, including memory, language, response inhibition, and cognitive flexibility. ADAS-cog 13, whose scores range from 0 to 85, with higher scores indicating more severe cognitive impairment. MMSE, the score ranges from 0 to 30, with lower scores indicating more severe cognitive impairment. Among patients with AD, the volume of these subregions was more robustly correlated with ADAS-cog 13 than with the MMSE score. The reason may be the greater involvement of memory, language, and orientation in the ADAS-cog 13 than in the MMSE. Due to the ceiling effect, MMSE may lack sensitivity to early cognitive impairment, which may lead to the absence of any correlations between subregion volumes and MMSE score in MCI. Despite our findings, Han et al. [33] reported that volume reduction in the left inferior frontal gyrus is related to the severity of symptoms in MCI. Differences in the MCI groups may warrant this discrepancy between the studies. Han et al. [33] recruited amnestic MCI patients, whereas MCI includes more heterogeneous groups of patients [34].
Broca’s area is essential for speech production [35]. It has been divided into BA 44 and BA 45 [36], usually in the left hemisphere. However, the right BA 44 also plays an important role in successful language. The right BA 44 is also involved in language processing in both visual and auditory ways [37]. Moreover, BA 44 is considered the core area of syntax processing [38]. There is growing evidence that cross-hemispheric communication is also important for syntactic learning and processing [39, 40]. Chen L et al. [40] suggested that right BA 44 may transfer information to left BA44 for promoting syntactic operations. In our study, the BA 44 was further subdivided into ventral (IFG_6_1), dorsal (IFG_6_6), and operculum parts (IFG_6_5) subregions [41]. BA 45 was subdivided into caudal (IFG_6_3) and rostral (IFG_6_4) areas. Molnar-Szakacs et al. [42] reported that the dorsal part of area 45 is active during observation and imitation, whereas the ventral part is active just during imitation, but not during observation. In this study, cognitive function was correlated with right IFG_6_1 and right IFG_6_3 volumes, but not with IFG_6_6 and IFG_6_4 volumes, which warrants further parcellation within the BA 44 and BA 45.
The right BA 44 might function beyond phonological processing. The operculum (IFG_6_5) is crucial for successful response inhibition and task-switching in the stop-signal task [43, 44]. The inability to maintain directed attention in the presence of interfering stimuli may be the mechanism underlying frontal lobe memory deficit [45]. Meanwhile, the right IFG_6_5 is involved in integrating exteroceptive and interoceptive signals, which are necessary for interoceptive awareness. The defect may be responsible for the lack of insight, which is a frequent symptom of dementia [18, 46]. Inferior frontal sulcus areas of the left hemisphere (left IFG_6_2) are associated with language and working memory [47].
The right IFG and its connections with the striatum may be the basis of cognitive control, whereas the right ventrolateral prefrontal cortex (VLPFC) is a critical area in control [16, 44]. VLPFC is a component of the ventral attention (VANet), dorsal attention (DANet), and salience (SNet) networks. These brain network patterns are important for cognitive flexibility [48, 49]. Cognitive flexibility, also known as behavioral flexibility, relies on both inhibitory control and WM. Transient inactivation of the right VLPFC, including right IFG_6_3, right IFG_6_4, right OrG_6_2, and right OrG_6_6 subregions, impairs audiovisual working memory performance [50]. In this study, the right OrG_6_5 and OrG_6_6 were correlated with cognitive function. OrG_6_5 is a part of the orbitofrontal cortex (OFC), whose lesions usually affect flexible cognitive processes such as learning, recognition, and drive response [51, 52]. Therefore, the impaired function of these areas can affect different aspects of cognition.
Although MMSE items cover several cognitive domains, they are unlikely to identify more subtle cognitive changes related to frontal subregions, as MMSE is a global scale of cognitive impairment. The most important disadvantage of MMSE is low sensitivity to MCI. More sensitive and precise measures of frontal lobe function, such as verbal fluency test and false memory test [53, 54], are recommended for future studies. It has been shown that some brain networks are disrupted in AD [55]. Cognitive function depends on the normal function of multiple regions in the brain network. Cognitive impairment is also associated with abnormal connectivity between different brain regions [56]. Changes in the functional connectivity of the intrinsic network can be detected by resting state fMRI. Whether there is a compensatory mechanism between brain regions can be explored by task-state fMRI. The combination of multimodal imaging, such as structural and functional MRI, can provide a great deal of information to expand our understanding of the mechanisms of brain changes in AD. Furthermore, the BNA-246 atlas we used in this study was developed in the Chinese population, and the results of this study need to be further verified among Chinese patients with MCI and AD.
(1) There is atrophy in the frontal superior frontal gyrus, middle frontal gyrus, inferior frontal gyrus, orbital gyrus and precentral gyrus in MCI. Dividing the frontal lobe into 34 subregions can more accurately and objectively analyze the structural changes of the frontal lobe in MCI and AD patients. (2) The 9/46 area of the middle frontal gyrus is an important part of the structural changes of the frontal lobe in AD patients, which helps to promote the exploration of the pathological mechanism of the frontal lobe in AD patients. (3) Atrophy of certain frontal subregion cortex is associated with cognitive dysfunction in AD patients.
The raw data supporting the conclusions of this manuscript will be made available by the authors, without undue reservation, to any qualified researcher.
All authors contributed significantly to this research and preparation of the manuscript. Conceived and designed the experiments—CS, XD, WY. Performed the experiments and analyzed the data—CS, HD, DR. All authors have been involved in the drafting, critical revision, and final approval of the manuscript for publication. All authors agree to be accountable for all aspects of the work in ensuring that questions related to the accuracy or integrity of any part of the work are appropriately investigated and resolved. All authors read and approved the final manuscript.
The study has been approved by Medical Ethics Committee of Affiliated Hospital of North Sichuan Medical College with the IRB number (2022ER452-1). The patient consent form was waived which was approved by IRB.
We thank all of the study participants and their families that participated in the neuroimaging research. Data used in preparation of this article were obtained from the Alzheimer’s Disease Neuroimaging Initiative (ADNI) database (http://adni.loni.usc.edu). As such, the investigators within the ADNI contributed to the design and implementation of ADNI and/or provided data but did not participate in analysis or writing of this report. We also appreciate their contributions. A complete listing of ADNI investigators can be found at http://adni.loni.usc.edu/wp-content/uploads/how_to_apply/ADNI_Acknowledgement_List.pdf.
This research received no external funding.
The authors declare no conflict of interest.
References
Publisher’s Note: IMR Press stays neutral with regard to jurisdictional claims in published maps and institutional affiliations.