1. Introduction
Alzheimer’s disease (AD) is the commonest neurodegenerative
disorder in the older people accompanied by progressive cognitive impairment and
behavior disfunction. Approximately 3.2% of the population over 65 years old
suffers AD, and the global prevalence will reach 115 million sufferers by 2050
[1]. The typical pathological features are extracellular aggregated senile
plaques of amyloid beta (A) and intracellular highly phosphorylated
neurofibrillary tau tangles in the cerebrum [2]. Abnormal accumulation of
A within the cerebrum is an initial pathological change of AD, which
appears years or more than a decade ahead of the onset of clinical symptoms [3].
An imbalance between A generation by neurons and clearance from the
interstitial fluid results in extracellular amyloid plaques deposition [4],
accompanied by the resultant neuroinflammation, oxidative stress, free radical
damage, and extensive neuron death [5]. Membrane-spanning protein amyloid
precursor protein (APP) is cleaved to A
peptide and A peptide by -secretase and
-secretase [6]. A peptide is more
hydrophobic and tends to aggregate to form an oligomeric or
fibrous structure which is the core component of senile plaques [7]. Cells with
neurotoxic A peptide intervention could replicate the
pathological hallmarks of AD. Therefore, the in vitro A‑treated
mouse neuroblastoma N2a cell line is considered a classical model to mimic the
cell injury of AD, which can be used for exploring the underlying pathological
mechanism of AD.
Phytochemicals are bioactive substances of plant origin with various structures
and significant pharmaceutical properties [8]. Ginkgolide B (GB,
CHO, molecular weight = 424.3986 g/mol) is a kind of
diterpenoids isolated from the leaves of Ginkgo biloba, and has various
pharmacological effects, such as inhibiting platelet activating [9],
scavenging oxygen free radicals [10], and
antioxidative stress function. GB could prevent neuronal cell
injury caused by oxidative stress in vitro and improve cognitive function in the
central nervous system [11]. GB also possesses neuroprotective functions
against cerebral ischemic injury and A-induced neurotoxicity through
various biological properties of anti-inflammation, antioxidative stress, and
anti-apoptosis [12, 13, 14]. However, its specific pharmacological mechanism in AD
remains ambiguous. In the current study, we aim to explore the protective effects
of GB on cell injury caused by A and uncover
its underlying cellular mechanisms.
Mass spectrometry (MS)-based quantitative proteomics is an advanced technology
for unbiased protein identification and quantitation on a large scale, which
relies on precise, high-throughput, and reproducible techniques [15]. Advances in
liquid chromatography-tandem MS (LC-MS/MS) have qualified for
the identification and quantification of thousands of proteins in biological
samples. It not only identifies proteins in normal and pathological states, but
also accurately quantifies their abundance [16]. LC-MS/MS technique has
significant value in identifying functional modules and pathways, discovering
biomarkers, as well as diagnosing and surveilling diseases. LC-MS/MS technology
with stable isotope-labeling amino acids has been extensively applied for
exploring the targets and mechanisms of multiple diseases and drugs.
Therefore, tandem mass tag (TMT) labeled LC-MS/MS-based
quantitative proteomic analysis of proteins from GB treated N2a
cells was performed to analyze the differentially expressed
proteins (DEPs) that are associated with the neuroprotective mechanism of GB. As
a result, 61 proteins were identified as DEPs (fold change 1.5 and
p 0.1). Of these, 42 proteins were upregulated and 19 proteins were
downregulated after GB treatment. Gene ontology (GO) and Kyoto Encyclopedia of
Genes and Genomes (KEGG) enrichment analyses revealed that DEPs mainly
involved in the regulation of cell death, immune system process, and ferroptosis.
Among the DEPs, two key proteins ferritin heavy chain 1 (FTH1) and osteopontin
(SPP1), mainly participate in the regulation of cell death and ferroptosis, were
verified using western blot and quantitative real-time PCR (qRT-PCR). The current
conclusions provide new insight into the potential therapeutic targets of GB in
AD.
2. Materials and Methods
2.1 Preparation of GB Stock Solutions
GB (HPLC purity 98%) was purchased from Chengdu Pufei De
Biotech Co., Ltd. Its molecular weight is 424.3986 g/mol and
molecular formula is CHO (Fig. 1c). It was dissolved in
dimethyl sulfoxide (DMSO, Sigma, St. Louis, MO, USA) and prepared in a stock
solution of 5 mmol/L with culture medium.
The stock solution was diluted to required
concentrations with the same culture before use. DMSO
concentration was kept below 0.1% to prevent cytotoxic reaction [17].
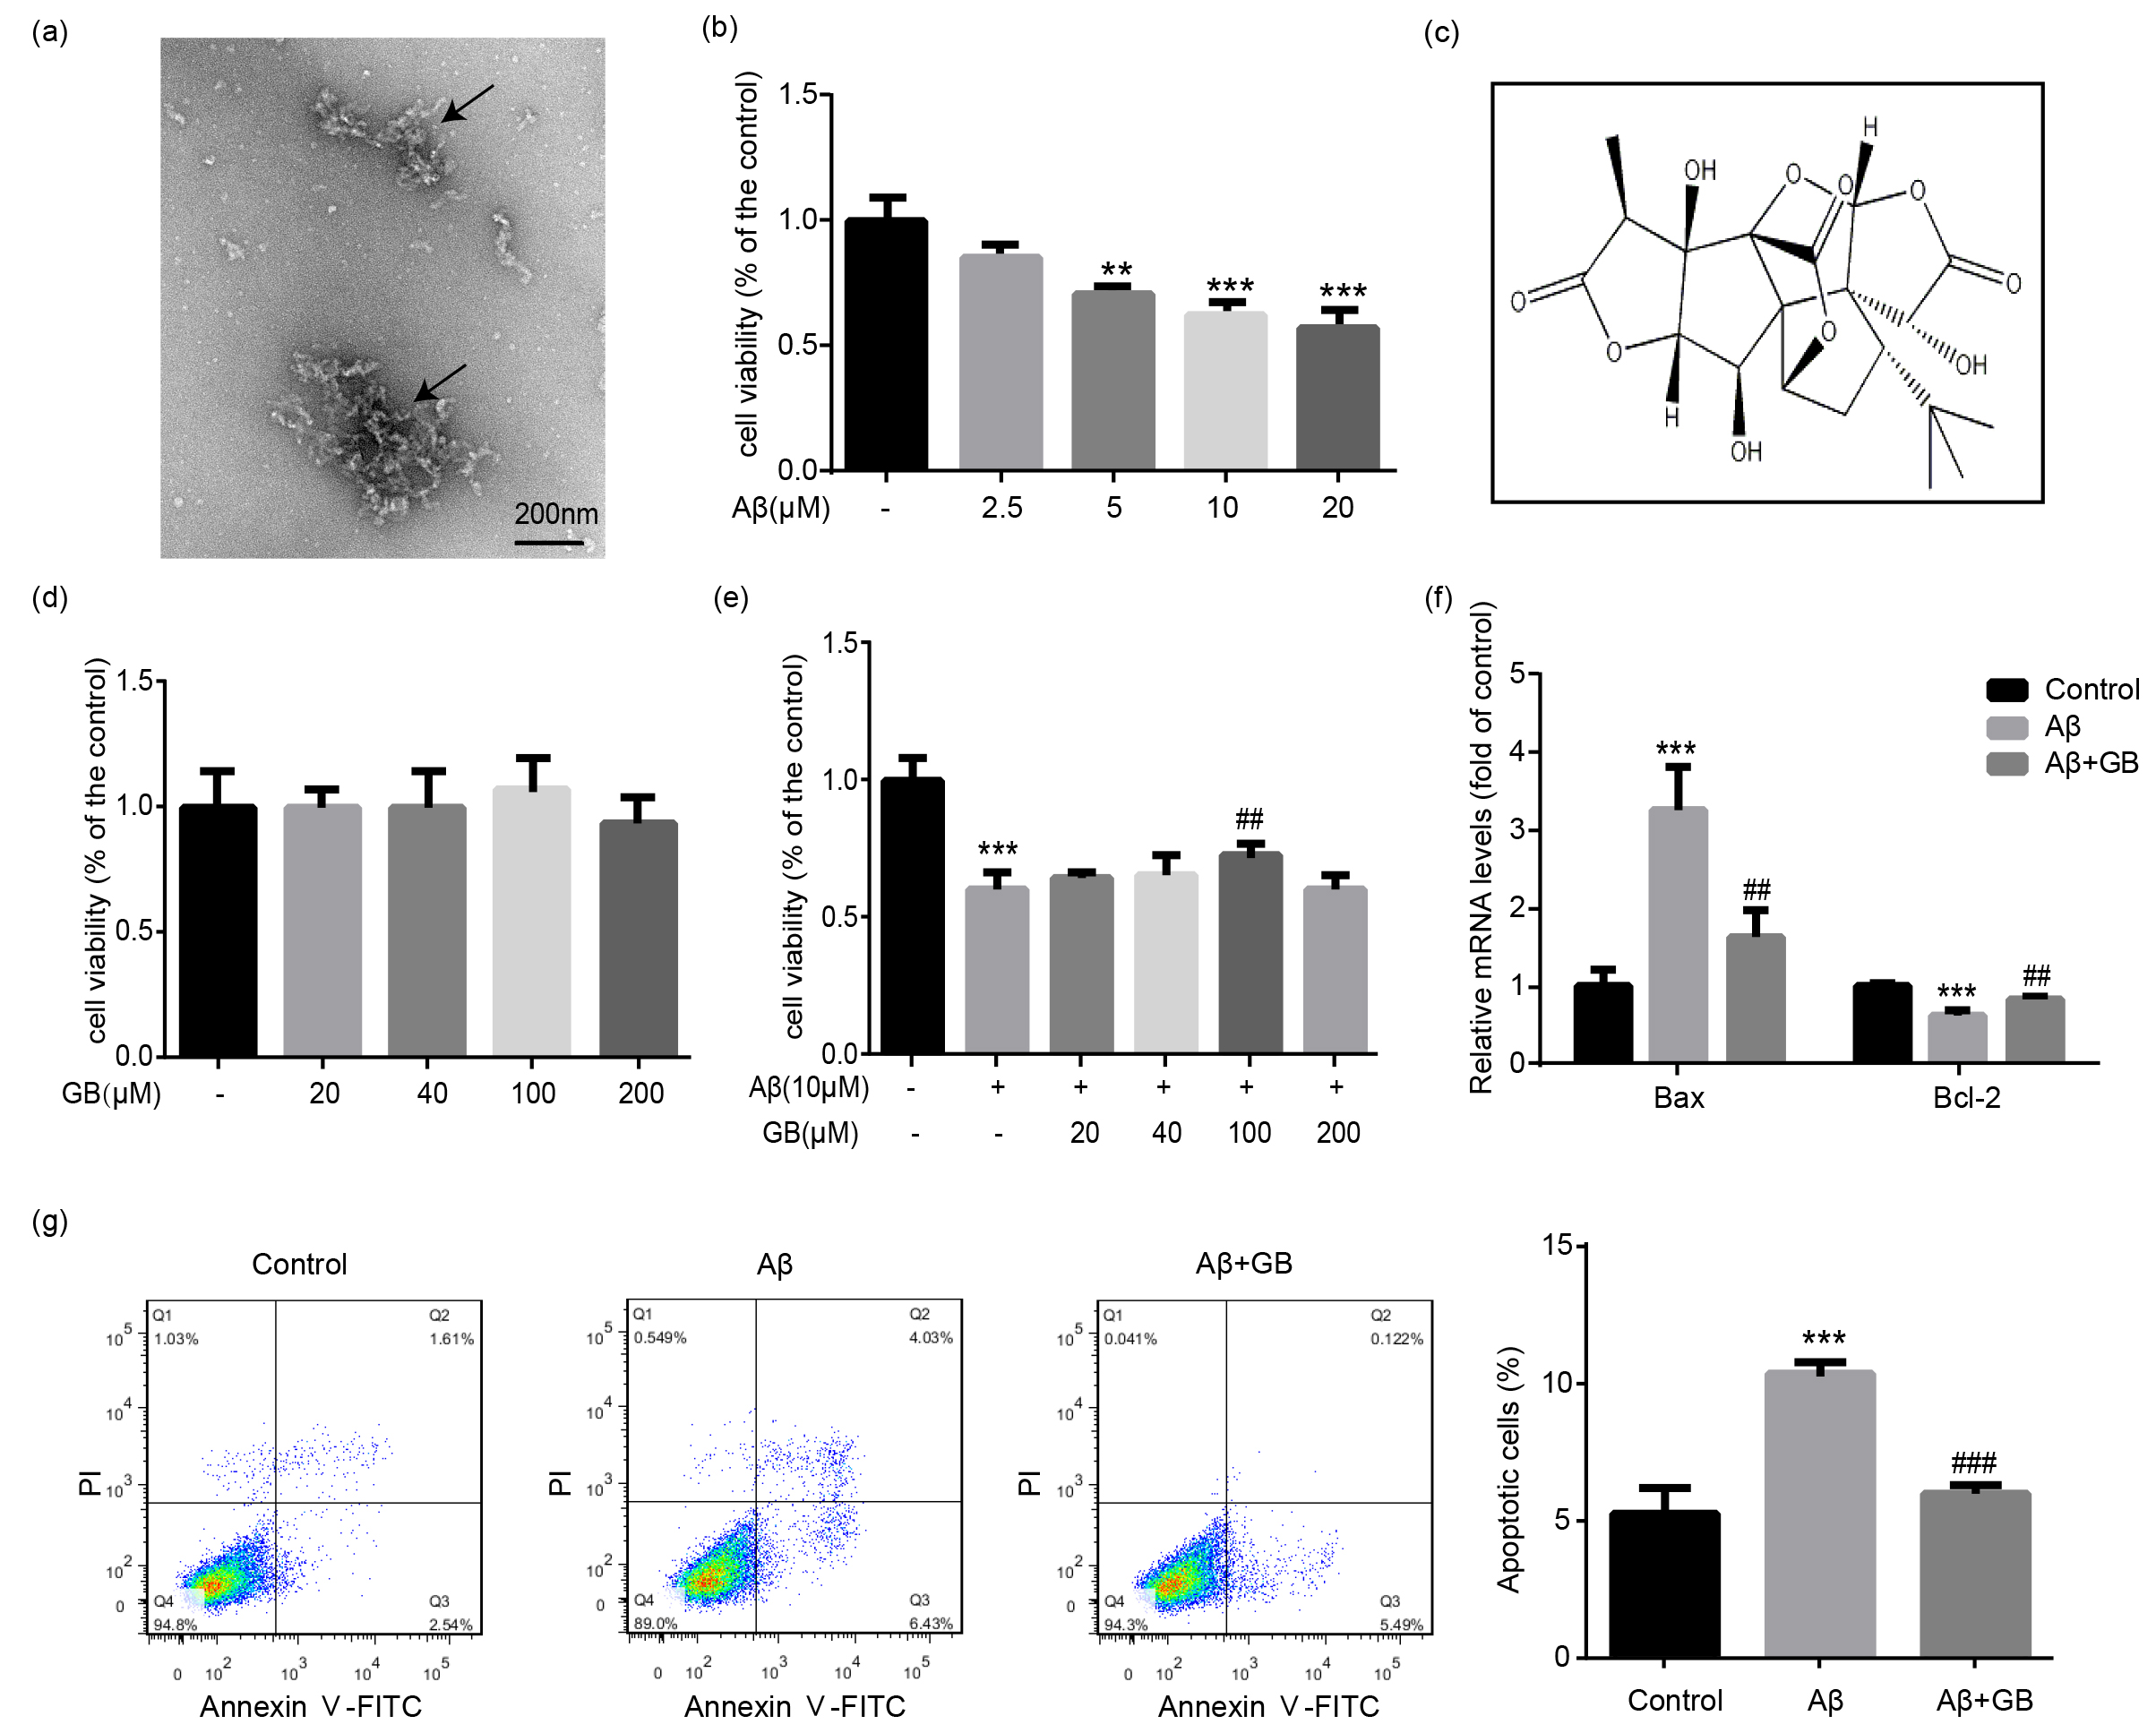 Fig. 1.
Effect of Ginkgolide B (GB) on A-induced
cytotoxicity in N2a neuroblastoma cells. (a) The TEM images of A
oligomers via negative staining. (b) N2a cells were treated with 0, 2.5, 5, 10
and 20 M A oligomers for 24 h, and the cell survival rates
were then measured by MTT assay (n = 5). (c) The chemical structure of GB. (d)
Cells were treated with GB at various concentrations (0, 20, 40, 100 and 200
M) for 24 h, and the cell viability was measured by MTT assay (n = 5). (e)
Cells were pretreated with various concentrations of GB (0, 20, 40, 100 and 200
M) for 2 h, followed by incubation with 10 M A
oligomers for another 24 h. Cell survival rates were measured by MTT assay (n =
5). (f) Bax and Bcl-2 mRNA levels determined by quantitative PCR (qPCR) (n = 3).
(g) The number of apoptotic cells in the existence of A oligomers
and GB analyzed by flow cytometry. Quantified apoptotic cells in all groups (n =
3). Data were presented as mean SEM. **p 0.01 and
***p 0.001 vs. control group; ##p 0.01 and
###p 0.001 vs. A group.
2.2 Preparation of A Oligomers
The preparation of A oligomers was based on
a widely recognized method [18, 19]. 1 mg lyophilized
A peptide (AS-20276; AnaSpec, shanghai, China)
was dissolved in 221 L of 100% hexafluoroisopropanol at a
concentration of 1 mM and evenly divided into
two tubes. Then, the peptide film was dried under vacuum. Approximately 0.5 mg
dried peptide film was redissolved in 20 L of fresh dry DMSO to a
concentration of 5 mM and diluted with F12 cell culture medium to 100 M
[17]. The solution was incubated at 4 °C for 24 h and centrifugated at
14,000 g at 4 °C for 10 min for elimination of
fibrils. The supernatant that consists of soluble oligomerized
A was used for experiments.
2.3 Transmission Electron Microscopy (TEM)
Oligomerized A was identified by means of TEM. Briefly, 10
L of A oligomers was added to
copper mesh grids with formvar coating and
carbon stabilizing for 1 min. A oligomers were stained with 5
L of 1% uranyl acetate for 30 s using negative staining technique [17].
The completely dried grids were observed using a 200 kV electron microscope
(Tecnai G2 20 Twin, FEI, Czech Republic).
2.4 Cell Culture and Treatments
The mouse neuroblastoma N2a cells were donated by Ji Jianguo
Lab (the State Key laboratory of Protein and Plant Gene Research, College of Life
Sciences, Peking University) and cultured in Dulbecco’s Modified Eagle Medium
(DMEM, Hyclone, Logan, UT, USA) containing 10% fetal bovine serum (Hyclone, Logan, UT, USA). N2a
cells were maintained in a humidified atmosphere containing 5% CO at 37
°C. The cells were pretreated with GB or vehicle for 2 h, followed by
incubation in the presence or absence of 10 M A
oligomers for an additional 24 h. The experiments involve the control group
(treated with 0.1% DMSO for 24 h), the A group (treated with 10
M A for 24 h) and the A + GB group (pretreated
with 100 M GB for 2 h followed by 10 M
A for 24 h).
2.5 Detection of Cell Survival Rates
Cell survival rates were tested by a colorimetric
3-4,5-dimethylthiazol-2-yl-2,5-diphenyl-tetrazolium bromide (MTT) assay (Beyotime
Biotechnology, Shanghai, China). N2a cells were seeded in 96-well plates and
treated according to the experiment designed when the cells reached to 60%
confluence. Then the cells were incubated with 10 L MTT (5 mg/mL) at 37 °C
for 4 h, and the MTT formazan was extracted with 150 L DMSO. The
absorbance of each well was measured at 570 nm using a Multiskan FC microtiter
plate reader (Thermo Fisher Scientific, Waltham, MA, USA).
2.6 Flow Cytometry Analysis of Cell Apoptosis
Apoptotic N2a cells were determined using Annexin
V-fluorescein isothiocyanate (FITC)/propidium iodide (PI) cell apoptosis
detection kit (TransGen Biotech Co, Beinjing, China). After treatments, N2a cells were digested
with trypsin, washed, and resuspended in Annexin Ⅴ binding buffer. Then, cells
were incubated with 5 L of Annexin V-FITC and 5 L of PI at room
temperature for 15 min in the dark. The number of apoptotic cells were detected
using a flow cytometer (FACSVerse, BD Biosciences, Franklin, NJ, USA) and analyzed using FlowJo
software (Version 7.6, TreeStar Inc, San Carlos, CA, USA).
2.7 Measurement of Intracellular Reactive Oxygen Species (ROS)
Intracellular ROS levels of N2a cells were tested using ROS probe
2’,7’-dichlorofluorescein diacetate (DCFH-DA) (Beyotime Biotechnology, Nanjing,
China). After treatment, N2a cells were incubated with 10 M DCFH-DA for 30
min and then washed with serum-free cell culture medium. The DCF fluorescence was
quantified using a multimode microplate reader with an excitation source at 485
nm and an emission at 530 nm. The values were expressed as the fold of control.
2.8 Measurement of Superoxide Dismutase (SOD) Activity and Malondialdehyde (MDA) Content
The SOD activity and MDA content were detected using commercially available kits
(Nanjing Jiancheng Bioengineering Institute, Nanjing, China) following the
protocols. The SOD activity was tested using the xanthine oxidase method and
measured by the absorbance of superoxide anion free radical at 550 nm. The
lipid peroxidation level was reflected by MDA concentrations using the
thibabituric acid (TBA) method. MDA concentrations were measured by the
absorbance of TBA reactive substances at 532 nm.
2.9 Protein Digestion and TMT Labeling
The proteins of N2a cells were precipitated in pre-chilled (–20 °C)
trichloroacetic acid and acetone. The precipitated proteins were then dissolved
in 8 M urea buffer, reduced with 100 mM dithiothreitol (Sigma Aldrich, Saint Louis, MO, USA), and
alkylated with 200 mM iodoacetamide (Sigma Aldrich, Saint Louis, MO, USA). Protein digestion took place
in the existence of Lys-C (1:1000, 37 °C for 3 h) and trypsin (1:50, 37 °C for
8–18 h) [20], and this reaction was terminated with trifluoroacetic acid (TFA).
The peptide mixtures were transferred to C18 Extraction Disks (Empore 3M,
Agilent Technologies, Sant Clara, CA, USA) and sequentially flushed with anhydrous
acetonitrile (ACN), 0.1% TFA/70% ACN, and 0.1% TFA for desalination.
Peptides were then vacuum dried and dissolved
in 100 mM tetraethylammonium bicarbonate buffer. Each sample (40 g
peptides) were labeled using six-plex TMT
reagents (90061, Thermo Scientific, Waltham, MA, USA)
with ACN buffer for 60 min at room temperature [17].
Peptides derived from the control group,
A group and A + GB group were labeled with 126 and 127 TMT
tags, 128 and 129 TMT tags, 130 and 131 TMT tags, respectively. The labeling
reaction was terminated by 8 L of 5% hydroxylamine (20 min, room
temperature). TMT-labeled peptide mixture was loaded on the C18 extraction disk
cartridge and eluted by gradient acetonitrile (10%, 12.5%, 15%, 17.5%, 20%,
22.5%, 25%, and 50%). The fractionated peptides (10% and 50%) were pooled
into one fraction, leaving seven fractions in the TMT experiment. These fractions
were vacuum dried for subsequent LC-MS/MS measurement.
2.10 LC-MS/MS Analysis
TMT-labeled peptides were analyzed on an Orbitrap Fusion Lumos Tribrid
instrument (Thermo Scientific). Peptides were
dissolved in 0.2% formic acid, detached in mobile phase
containing 0.1% formic acid and eluted using a nonlinear 194
min acetonitrile gradient of 6%–90% buffer (0.1% formic acid with 80%
acetonitrile) at 300 nL/min. The settings of MS parameters were
as follows: MS1 resolution at 120,000, mass scan of 300–1500 m/z,
automatic gain control (AGC) target at 1 10,
maximum injection time at 100 ms, and 30% of radio frequency, MS2 mass
resolution at 50,000, high-energy collision dissociation for MS/MS, 37% of
collision energy, normalized AGC target at 1 10, 1.2 m/z
isolation width, 30 s dynamic exclusion [17].
2.11 Database Search Parameters
Protein identification, quantification, and MS/MS original data were analyzed by
SEQUEST search algorithm using Proteome Discoverer (version 2.2, Thermo
Scientific, Waltham, MA, USA). Raw files were searched with a mouse Uniprot protein database.
Search criteria included maximum missed trypsin cleavages of 2; fixed
modification on lysine and N-terminus for TMT six-plex tags; dynamic modification
for oxidation of methionine residues; carbamidomethyl on cysteines; mass
tolerance of 10 ppm; 0.05 Da for MS/MS tolerance; 1% false discovery rate (FDR)
[21, 22]; and 1% FDR at peptide and protein levels [17]. Reporter ion
intensities was normalized using the index of total reporter ion intensity.
2.12 Data Analysis and Interpretation
The protein ratios (A + GB/A) were normalized in the
transformed Log2 fold change to adjust the unequal protein content.
p-value was calculated with an independent student’s t-test
(A + GB versus A). Proteins with a cut-off of p 0.1 and fold change 1.5 from two independent experiments were regarded
as DEPs.
2.13 KEGG and GO Enrichment Analyses of DEPs
The Database for Annotation, Visualization, and Integrated Discovery (DAVID) is
an online database that offers systematic and comprehensive functional annotation
information of proteins and genes to reveal biological information [23, 24]. KEGG
pathway enrichment analysis and GO analysis (biological process, molecular
function, and cellular component) of DEPS were carried out using
DAVID (version 6.8) to analyze the function of DEPs.
p 0.05 was regarded as statistical significance.
2.14 Western Blot
N2a cells were lysed in 1% sodium dodecyl sulfate using an ultrasound
homogenizer. Protein concentration was quantitatively measured using a Pierce™ BCA Protein Assay Kit (Thermo Fisher Scientific).
Equal amounts of protein (15 g) were loaded in to each lane of 10% sodium
dodecyl sulfate-polyacrylamide gel electrophoresis and transferred to a
polyvinylidene fluoride membranes using a semidry blotting apparatus (Bio-Rad,
Hercules, CA, USA). The membranes were blocked with 5% nonfat milk and incubated
with primary antibodies overnight at 4 C: anti-FTH1 (1:1000; ab63856,
Abcam, Cambridge, UK), anti-SPP1 (1:1000; ab218237, Abcam), anti-A
(1:1000; 14974, Cell Signaling, Boston, MA, USA), and anti--actin
(1:2000; ab3280, Abcam). After washing, the membranes were then
incubated with horseradish peroxidase (HRP)-conjugated secondary antibodies
(4050-05 or 1031-05, Southern Biotech, Birmingham, AL, USA) for 1 h at room temperature.
Subsequently, the Protein bands were detected using Immobilon Western
Chemiluminescent HRP substrate (Millipore, Billerica, MA, USA), and images were
scanned using X-ray films. Kodak Digital Science 1D software
(Eastman Kodak Company, Rochester, NY, USA) was used to analysis the sum optical density.
2.15 Quantitative Real-Time PCR Assay
Total RNA was extracted from N2a cells using Trizol reagent (Invitrogen, Carlsbad, CA, USA)
following the supplier’s recommendations. Total RNA (1.5 g) was reversely
transcribed to cDNA using a HiFi-Script cDNA Synthesis kit (CW Bio, Beijing, China).
Quantitative analysis of FTH1 and SPP1 expressions was performed using
CFX96™ Real Time PCR Detection System (Bio-Rad, Hercules, CA, USA). The mRNA levels were
calculated using the 2 algorithm and normalized to
GAPDH. The primers in this article were as follows: SPP1, Forward
(5-3): AGCAAGAAACTCTTCCAAGCAA, Reverse (5-3):
GTGAGATTCGTCAGATTCATCCG. FTH1, Forward (5-3): TAAAGAAACCAGACCGTGATGACT,
Reverse (5-3): TGCAGTTCCAGTAGTGACTGATTC. GAPDH, Forward
(5-3): GGTCGGTGTGAACGGATTT, Reverse (5-3):
GTGGATGCAGGGATGATGTT.
2.16 Statistical Analysis
All data were shown as mean SEM and
analyzed by one-way analysis of variance
(ANOVA) followed by Student-Newman-Keuls test for intergroup comparisons. All
analyses were conducted using SPSS statistical software (Version 17.0, SPSS, Chicago, IL, USA). A p value
0.05 was identified as statistical significance.
3. Results
3.1 GB Alleviated
A-Induced Cytotoxicity in
N2a Cells
The A-injured N2a cell model was established in the present
study. The characteristic of A oligomers was revealed by TEM
(Fig. 1a), and the toxicity of A oligomers was tested by MTT
assay. The MTT results showed a dose-dependent association
between A concentration and cell injury. 10
M A treatment markedly decreased cell
survival rate compared with the control group (Fig. 1b). However, 20 M
A produced no notable changes in cell viability compared with
10 M A (Fig. 1b, p 0.05). Therefore, A oligomers at a concentration of 10 M was chosen for
A-induced cell model. GB, a kind of diterpenoids isolated from the
leaves of Ginkgo biloba, provides neuroprotective functions against
A-induced neurotoxicity in previous studies [14]. To verify whether GB
exerts any effect on N2a cells themselves, the viability of various
concentrations of GB intervened N2a cells was detected. GB (20–200 M)
alone caused no obvious effects on cell viability, with the maximal cell
viability occurring at 100 M (Fig. 1d). GB (20–200 M) pretreatment
showed certain inhibitory effect on cell injury caused by A
oligomers, especially at a concentration of 100 M (Fig. 1e). Hence, 100
M GB was used for further experiments.
3.2 GB Relieved
A-Induced Apoptosis in N2a Cells
The functions of GB on cell apoptosis stimulated by A
oligomers were measured by Annexin V-FITC/PI staining and flow cytometry. Cells
incubated with A alone showed the highest apoptosis rate
(10.46%), and the apoptosis rate was significantly reduced with 100 M GB
treatment (5.61%) (Fig. 1g). GB also alleviated A-induced
elevation of Bax expression and downregulation of Bcl-2 level (Fig. 1f). These
results showed that GB relieved cell apoptosis caused by A oligomers.
3.3 GB Attenuated A-Induced Oxidative Stress and
A Peptide Levels in N2a Cells
The levels of oxidative stress in N2a cells in various groups were
tested by measuring intracellular levels of ROS, SOD and MDA. Compared with the
control group, 10 M A gave rise to a prominent reduction
of SOD level and a considerable elevation of ROS and MDA levels (Fig. 2a–c). On
the contrary, 100 M GB pretreatment significantly relieved
A-induced oxidative injury with increased SOD level and
decreased ROS and MDA levels (Fig. 2a–c). Then, we examined
whether GB affects A peptide expression.
Western blot revealed that A peptide level significantly
increased with A intervention, and the uptrend was reversed by
100 M GB pretreatment (Fig. 2d).
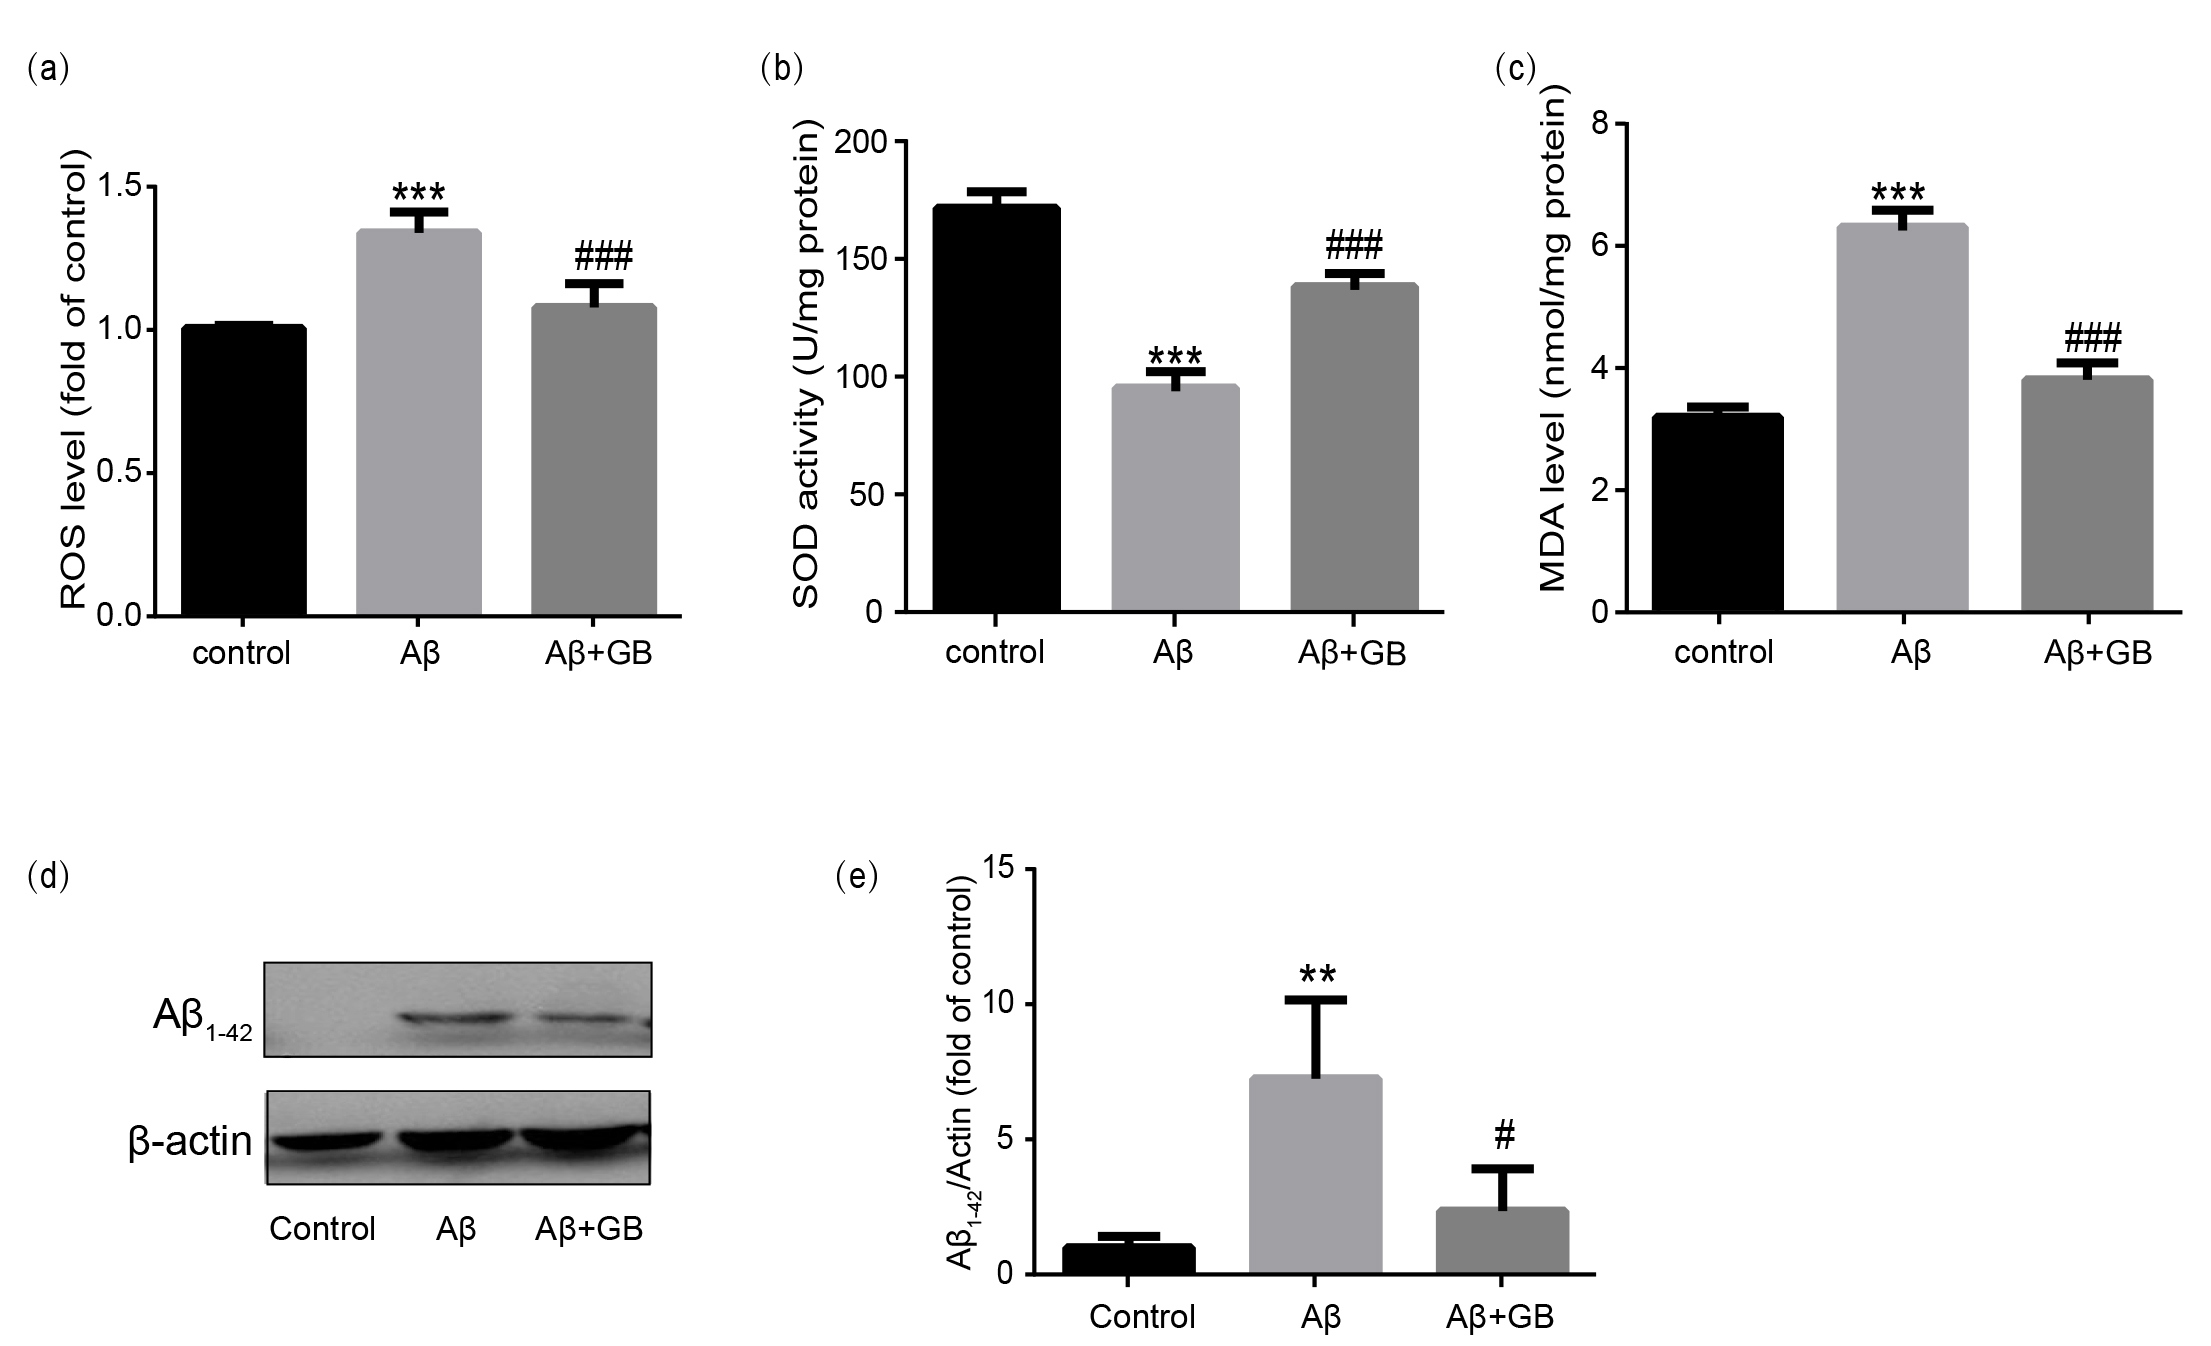 Fig. 2.
Effect of Ginkgolide B (GB) on A-induced oxidative
stress in N2a cells. The relative ROS level (a), SOD activity (b) and MDA
content (c) from all experimental groups were measured using commercial kits (n =
5). (d,e) Representative images of A peptide levels and
relative level normalized to -actin (n = 3). Data were presented as mean
SEM. **p 0.01 and ***p 0.001
vs. control group; #p 0.05 and ###p 0.001 vs.
A group.
3.4 Global Proteome Profiling of
N2a Cells with GB Pretreatment
To explore the neuroprotective mechanisms of
GB against cell injury stimulated by A oligomers,
TMT-labeled LC-MS/MS analysis was executed to
find out the relative changes in protein abundance. The workflow is exhibited in
Fig. 3a. Cells from the control group, A group and
A + GB group were labeled with 126 and 127 TMT tags, 128 and 129 TMT
tags, and 130 and 131 TMT tags, respectively. In the end, 6969 proteins were
identified and 6740 proteins (96.71%) were quantified in two independent
biological replicates. The
relative abundance ratios (A + GB/A)
distribution of the quantified proteins was normality (Fig. 3b). Only proteins
with fold change 1.5 and p value 0.1 were identified to be
differentially expressed. 61 proteins were considered as DEPs, including 42
upregulated and 19 downregulated proteins. In the volcano
figure, red dots indicate upregulated proteins and blue dots indicate
downregulated proteins (Fig. 3c). The DEPs were showed in Table 1.
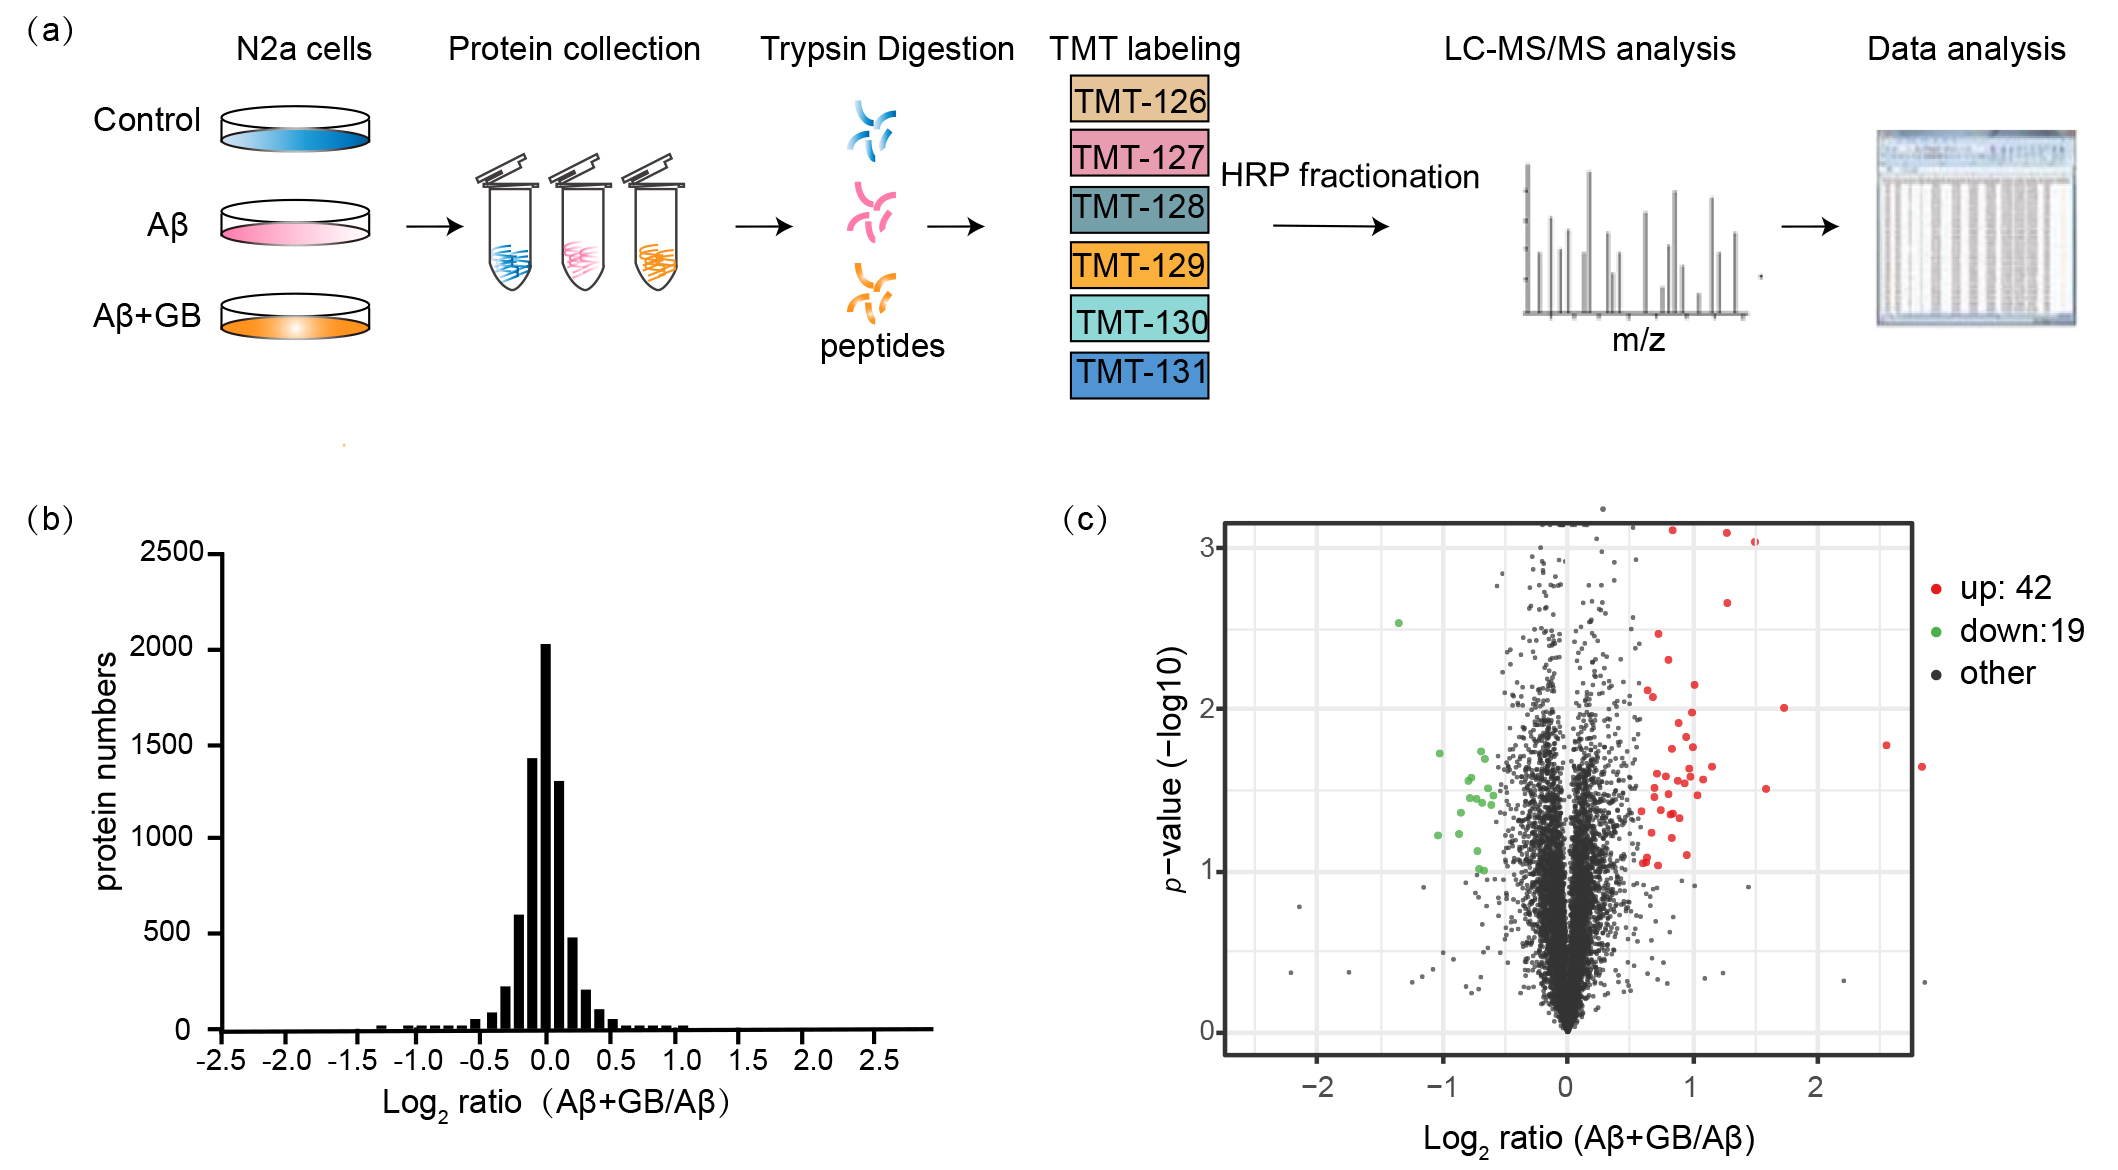 Fig. 3.
Global proteome profiling of N2a cells with GB pretreatment.
(a) Experimental workflow for proteomic analysis of N2a cells. (b) The relative
abundance ratios distribution of quantified 6740 proteins in GB treated N2a cells
by proteomics. Proteins ratios (A + GB/A) were presented on the
log2 scale. (c) Volcano plot of quantified proteins was represented as the fold
change (log2) and the p value (–log10). The criterion for determining
DEPs is fold change 1.5 and p value 0.1. Red dots are upregulated
proteins, and blue plots are downregulated proteins.
Table 1.Effects of GB on A-induced differentially expressed
proteins.
| No |
Accession |
Gene name |
Description |
GB/Aβ |
Ratio |
p value |
| 1 |
O08600 |
Endog |
Endonuclease G, mitochondrial |
UP |
1.7890 |
0.0008 |
| 2 |
E9Q414 |
Apob |
Apolipoprotein B-100 |
UP |
2.4161 |
0.0008 |
| 3 |
P09528 |
Fth1 |
Ferritin heavy chain 1 |
UP |
2.8239 |
0.0009 |
| 4 |
P32261 |
Serpinc1 |
Antithrombin-III |
UP |
2.4223 |
0.0022 |
| 5 |
Q61838 |
Pzp |
Pregnancy zone protein |
UP |
1.6535 |
0.0034 |
| 6 |
Q8BU04 |
Ubr7 |
Putative E3 ubiquitin-protein ligase UBR7 |
UP |
1.7480 |
0.0049 |
| 7 |
P13011 |
Scd2 |
Acyl-CoA desaturase 2 |
UP |
2.0205 |
0.0070 |
| 8 |
P07742 |
Rrm1 |
Ribonucleoside-diphosphate reductase large subunit |
UP |
1.5571 |
0.0075 |
| 9 |
P19221 |
F2 |
Prothrombin |
UP |
1.6033 |
0.0083 |
| 10 |
Q9CPX4 |
Ftl1 |
Ferritin |
UP |
3.3193 |
0.0097 |
| 11 |
P11276 |
Fn1 |
Fibronectin |
UP |
1.9921 |
0.0104 |
| 12 |
Q9D1C1 |
Ube2c |
Ubiquitin-conjugating enzyme E2 C |
UP |
1.8494 |
0.0121 |
| 13 |
O88668 |
Creg1 |
Protein CREG1 |
UP |
1.9284 |
0.0147 |
| 14 |
P02802 |
Mt1 |
Metallothionein-1 |
UP |
5.8565 |
0.0166 |
| 15 |
P53996 |
Cnbp |
Cellular nucleic acid-binding protein |
UP |
2.0013 |
0.0170 |
| 16 |
Q9D0J8 |
Ptms |
Parathymosin |
UP |
1.7816 |
0.0174 |
| 17 |
Q61704 |
Itih3 |
Inter-alpha-trypsin inhibitor heavy chain H3 |
UP |
2.2255 |
0.0225 |
| 18 |
P02798 |
Mt2 |
Metallothionein-2 |
UP |
7.1289 |
0.0226 |
| 19 |
P26350 |
Ptma |
Prothymosin alpha |
UP |
1.9612 |
0.0232 |
| 20 |
Q9ESY9 |
Ifi30 |
Gamma-interferon-inducible lysosomal thiol reductase |
UP |
1.6397 |
0.0249 |
| 21 |
G5E911 |
Fam3c |
DNA segment, Chr 6, Wayne State University 176, expressed, isoform CRA_f |
UP |
1.7230 |
0.0259 |
| 22 |
V9GX81 |
Mroh6 |
Maestro heat-like repeat family member 6 |
UP |
1.9743 |
0.0260 |
| 23 |
Q6GQT1 |
A2m |
Alpha-2-macroglobulin-P |
UP |
2.1189 |
0.0271 |
| 24 |
P29699 |
Ahsg |
Alpha-2-HS-glycoprotein |
UP |
1.8409 |
0.0276 |
| 25 |
Q9DBX1 |
Rgcc |
Regulator of cell cycle RGCC |
UP |
1.9121 |
0.0286 |
| 26 |
A0A140LI34 |
Zfp654 |
Zinc finger protein 654 |
UP |
1.6178 |
0.0305 |
| 27 |
P01029 |
C4b |
Complement C4-B |
UP |
3.0035 |
0.0309 |
| 28 |
Q91W10 |
Slc39a8 |
Zinc transporter ZIP8 |
UP |
1.7485 |
0.0334 |
| 29 |
P06684 |
C5 |
Complement C5 |
UP |
2.0535 |
0.0339 |
| 30 |
Q8VDF2 |
Uhrf1 |
E3 ubiquitin-protein ligase UHRF1 |
UP |
1.6168 |
0.0348 |
| 31 |
Q8BVE8-2 |
Nsd2 |
Isoform 2 of Histone-lysine N-methyltransferase NSD2 |
UP |
1.6752 |
0.0419 |
| 32 |
Q9Z2G0 |
Fem1b |
Protein fem-1 homolog B |
UP |
1.5050 |
0.0426 |
| 33 |
Q9WUQ5 |
Cxcl14 |
C-X-C motif chemokine 14 |
UP |
1.7908 |
0.0440 |
| 34 |
Q8K0E8 |
Fgb |
Fibrinogen beta chain |
UP |
1.7678 |
0.0447 |
| 35 |
Q3UA16 |
Spc25 |
Kinetochore protein Spc25 |
UP |
1.8590 |
0.0471 |
| 36 |
Q80V24 |
Vgll4 |
Transcription cofactor vestigial-like protein 4 |
UP |
1.5912 |
0.0580 |
| 37 |
Q3UU35 |
Ovos |
Ovostatin homolog |
UP |
1.7804 |
0.0624 |
| 38 |
P54843-2 |
Maf |
Isoform 2 of Transcription factor Maf |
UP |
1.9349 |
0.0798 |
| 39 |
P22272 |
Il6ra |
Interleukin-6 receptor subunit alpha |
UP |
1.5519 |
0.0826 |
| 40 |
Q9WTN3 |
Srebf1 |
Sterol regulatory element-binding protein 1 |
UP |
1.5448 |
0.0886 |
| 41 |
Q80YQ1 |
Thbs1 |
Thrombospondin-1 |
UP |
1.5171 |
0.0897 |
| 42 |
Q9QZI9 |
Serinc3 |
Serine incorporator 3 |
UP |
1.6498 |
0.0926 |
| 43 |
P04441-2 |
Cd74 |
Isoform Short of H-2 class II histocompatibility antigen gamma chain |
DOWN |
0.6207 |
0.0005 |
| 44 |
Q9Z0J7 |
Gdf15 |
Growth/differentiation factor 15 |
DOWN |
0.3918 |
0.0029 |
| 45 |
Q9D154 |
Serpinb1a |
Leukocyte elastase inhibitor A |
DOWN |
0.6184 |
0.0181 |
| 46 |
Q64339 |
Isg15 |
Ubiquitin-like protein ISG15 |
DOWN |
0.4915 |
0.0186 |
| 47 |
A0A0B4J1E6 |
Fcgr2b |
Fc receptor, IgG, low affinity IIb |
DOWN |
0.6316 |
0.0202 |
| 48 |
P04117 |
Fabp4 |
Fatty acid-binding protein, adipocyte |
DOWN |
0.5860 |
0.0264 |
| 49 |
Q9CYL5 |
Glipr2 |
Golgi-associated plant pathogenesis-related protein 1 |
DOWN |
0.5763 |
0.0276 |
| 50 |
A6H5X4 |
Phf11 |
PHD finger protein 11 |
DOWN |
0.6428 |
0.0307 |
| 51 |
P49813 |
Tmod1 |
Tropomodulin-1 |
DOWN |
0.6621 |
0.0340 |
| 52 |
O35368-3 |
Ifi203 |
Isoform 3 of Interferon-activable protein 203 |
DOWN |
0.5812 |
0.0353 |
| 53 |
Q3U4P5 |
Psen2 |
Presenilin |
DOWN |
0.6028 |
0.0357 |
| 54 |
A0A0R4J0G6 |
Qpct |
Glutaminyl-peptide cyclotransferase |
DOWN |
0.6221 |
0.0378 |
| 55 |
Q3TRM8 |
Hk3 |
Hexokinase-3 |
DOWN |
0.6545 |
0.0389 |
| 56 |
F8WIP8 |
Spp1 |
Osteopontin |
DOWN |
0.5529 |
0.0435 |
| 57 |
P11152 |
Lpl |
Lipoprotein lipase |
DOWN |
0.5473 |
0.0590 |
| 58 |
O88935 |
Syn1 |
Synapsin-1 |
DOWN |
0.4871 |
0.0603 |
| 59 |
Q9Z1R3 |
Apom |
Apolipoprotein M |
DOWN |
0.6059 |
0.0754 |
| 60 |
Q8C9S4 |
Ccdc186 |
Coiled-coil domain-containing protein 186 |
DOWN |
0.6117 |
0.0973 |
| 61 |
Q9WTR6 |
Slc7a11 |
Cystine/glutamate transporter |
DOWN |
0.6284 |
0.0997 |
To identify obviously different proteins in GB treated N2a cells, hierarchical
clustering analysis was performed. The heatmap of 61 DEPs revealed that DEPs were
distinctly separated into three distinct areas (Fig. 4). The
expression levels of DEPs in the A group were apparently different from
those in the control group, while GB pretreatment attenuated these differences.
These results indicated that protein expression undergoes extensive remodeling
during AD pathogenesis and this trend can be partially reversed by GB.
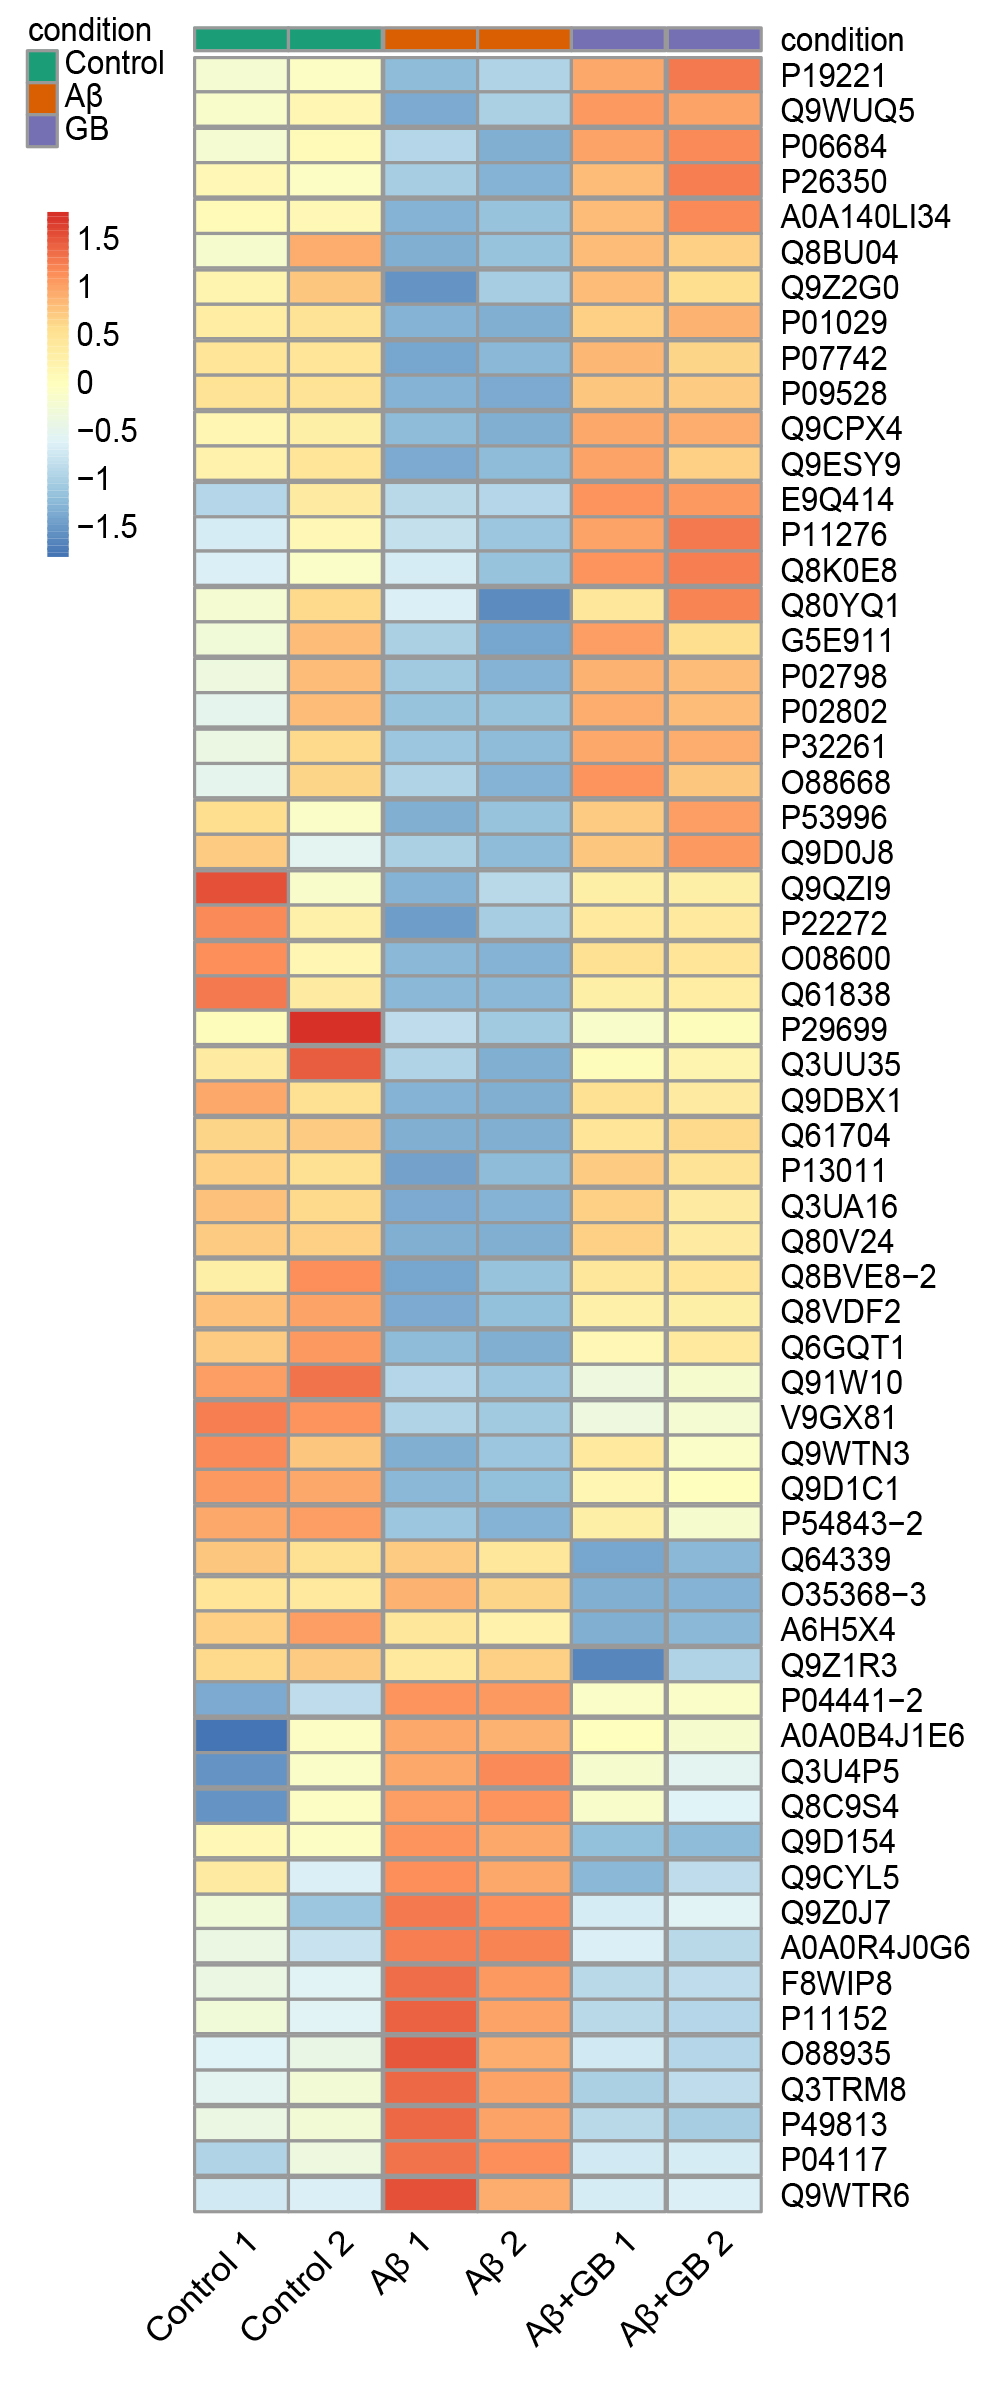 Fig. 4.
Hierarchical clustering analysis of the DEPs in N2a cells with
GB pretreatment. The map reflects the relative abundance ratios (A +
GB/A). Red squares indicate high expression proteins, and blue squares
indicate low expression proteins.
3.5 GO and KEGG Enrichment Analyses of DEPs in
A-Induced N2a Cells with GB Pretreatment
To explore the biological classification of the DEPs, we annotated the DEPs into
some functional categories using DAVID. These proteins were categorized in
accordance with GO biological process (GOBP), GO molecular function (GOMF), GO
cellular component (GOCC) and KEGG enrichment analysis by DAVID [25]. GOBP
analysis showed that DEPs predominantly participate in response to external
stimulation (GO:0032101, p = 7.52E-07), immune system process
(GO:0002684, p = 2.82E-05), cell activation (GO:0001775, p =
0.0004), and negative regulation of cell death (GO:0060548, p = 0.011)
(Fig. 5a). GOMF analysis showed that the DEPs were principally associated with
signaling receptor binding (GO:0005102, p = 2.02E-05), transition metal
ion binding (GO:0046914, p = 0.003), and peptidase regulator activity
(GO:0061134, p = 4.53E-09) (Fig. 5b). In the GOCC analysis, we
discovered that most DEPs were localized in the extracellular region (GO:0005576,
p = 6.99E-18) and extracellular matrix (GO:0031012, p =
1.59E-07), followed by cell surface (GO:0009986, p = 0.0002) and cell
body (GO:0044297, p = 0.015) (Fig. 5c). KEGG pathway analysis indicated
that the biological pathways were involved in complement and coagulation cascades
(mmu04610, p = 4.05E-08), ferroptosis (mmu04216,
p = 0.00027), cytokine-cytokine receptor interaction
(mmu04060, p = 0.0006), and PPAR signaling pathway (mmu03320, p
= 0.0058) (Fig. 5d).
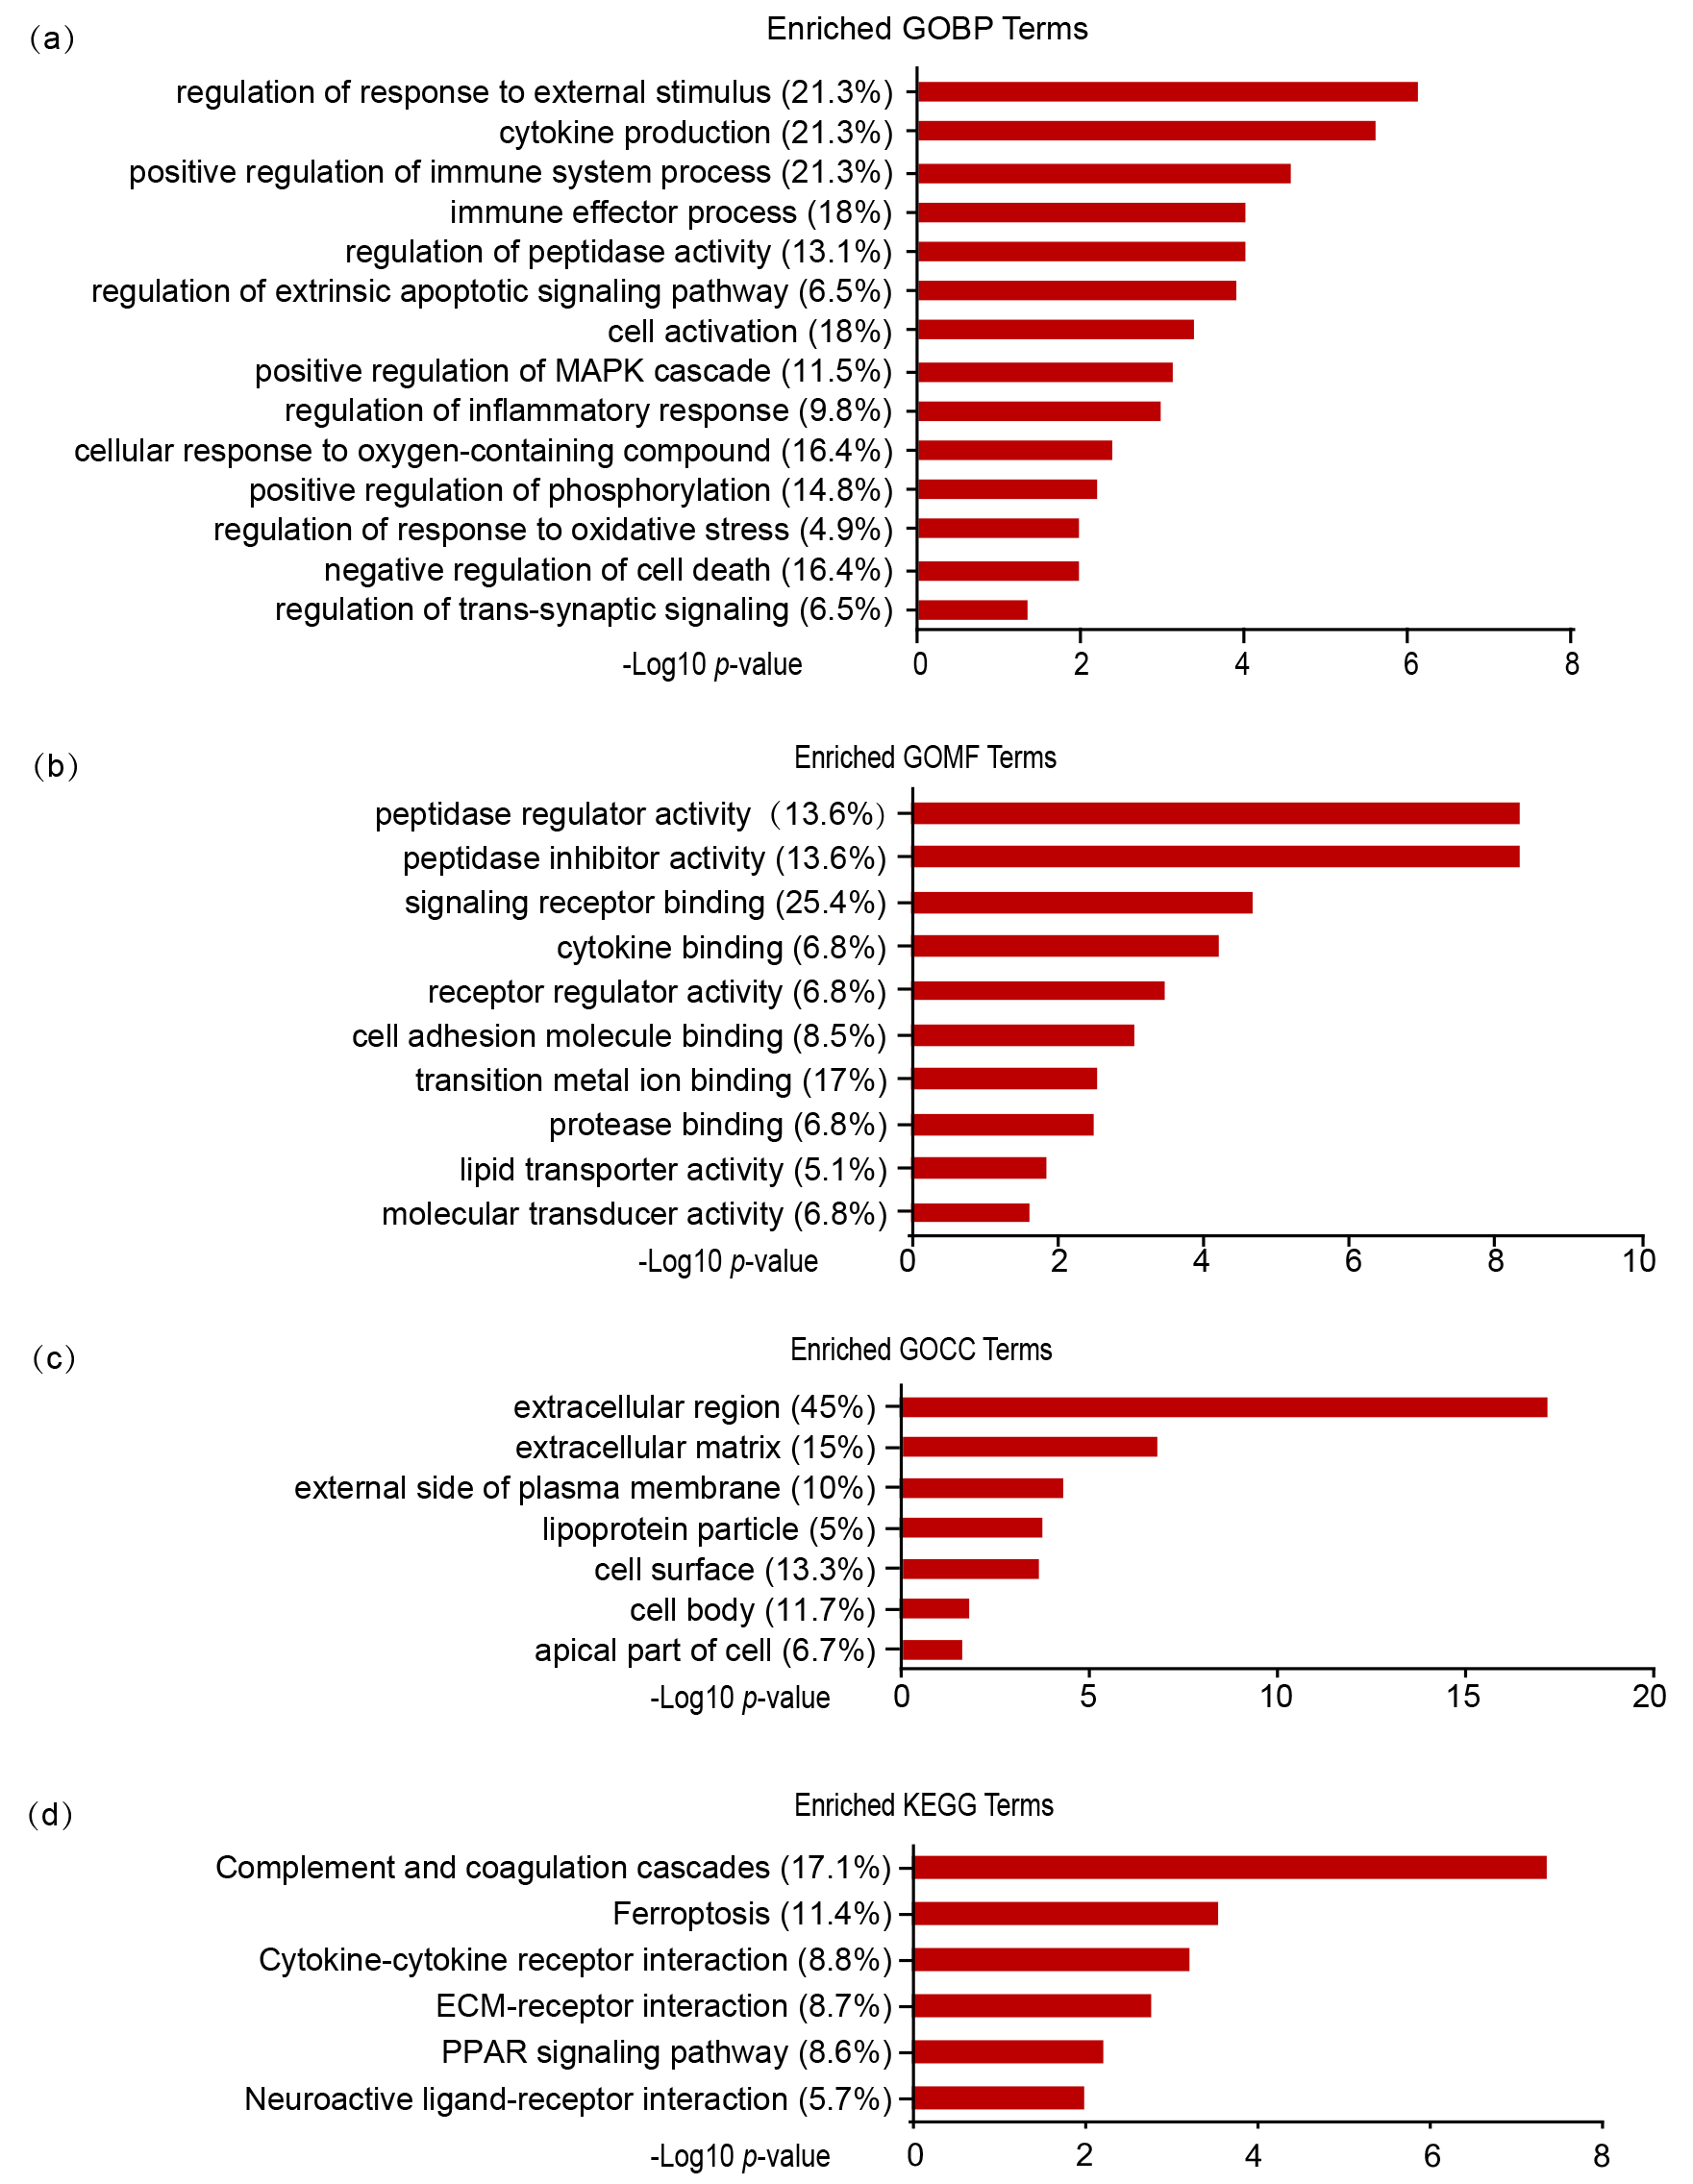 Fig. 5.
GO and KEGG enrichment analyses of DEPs. GO enrichment analysis
of DEPs in three categories: biological process (a), molecular function (b), and
cellular component (c). (d) KEGG pathway enrichment analysis of DEPs. The
percentages indicate the enriched proteins among all DEPs. p value
indicates significantly enriched terms.
3.6 Validation of the Key Proteins in DEPs
To confirm the MS-based quantitative proteomics, we analyzed
the expression levels of two key proteins SPP1 and FTH1 in
A-induced and GB treated N2a cells using western blot and qPCR.
FTH1 protein and mRNA levels in the A group decreased
markedly, and 100 M GB treatment upregulated their expressions (Fig. 6b,c). SPP1 protein and mRNA levels in the A group significantly
increased, and these upregulations were potently suppressed by 100 M GB
pretreatment (Fig. 6a,c). The change tendency of FTH1 and SPP1 expression levels
detected by western blot and qPCR is consistent with mass spectrometric data.
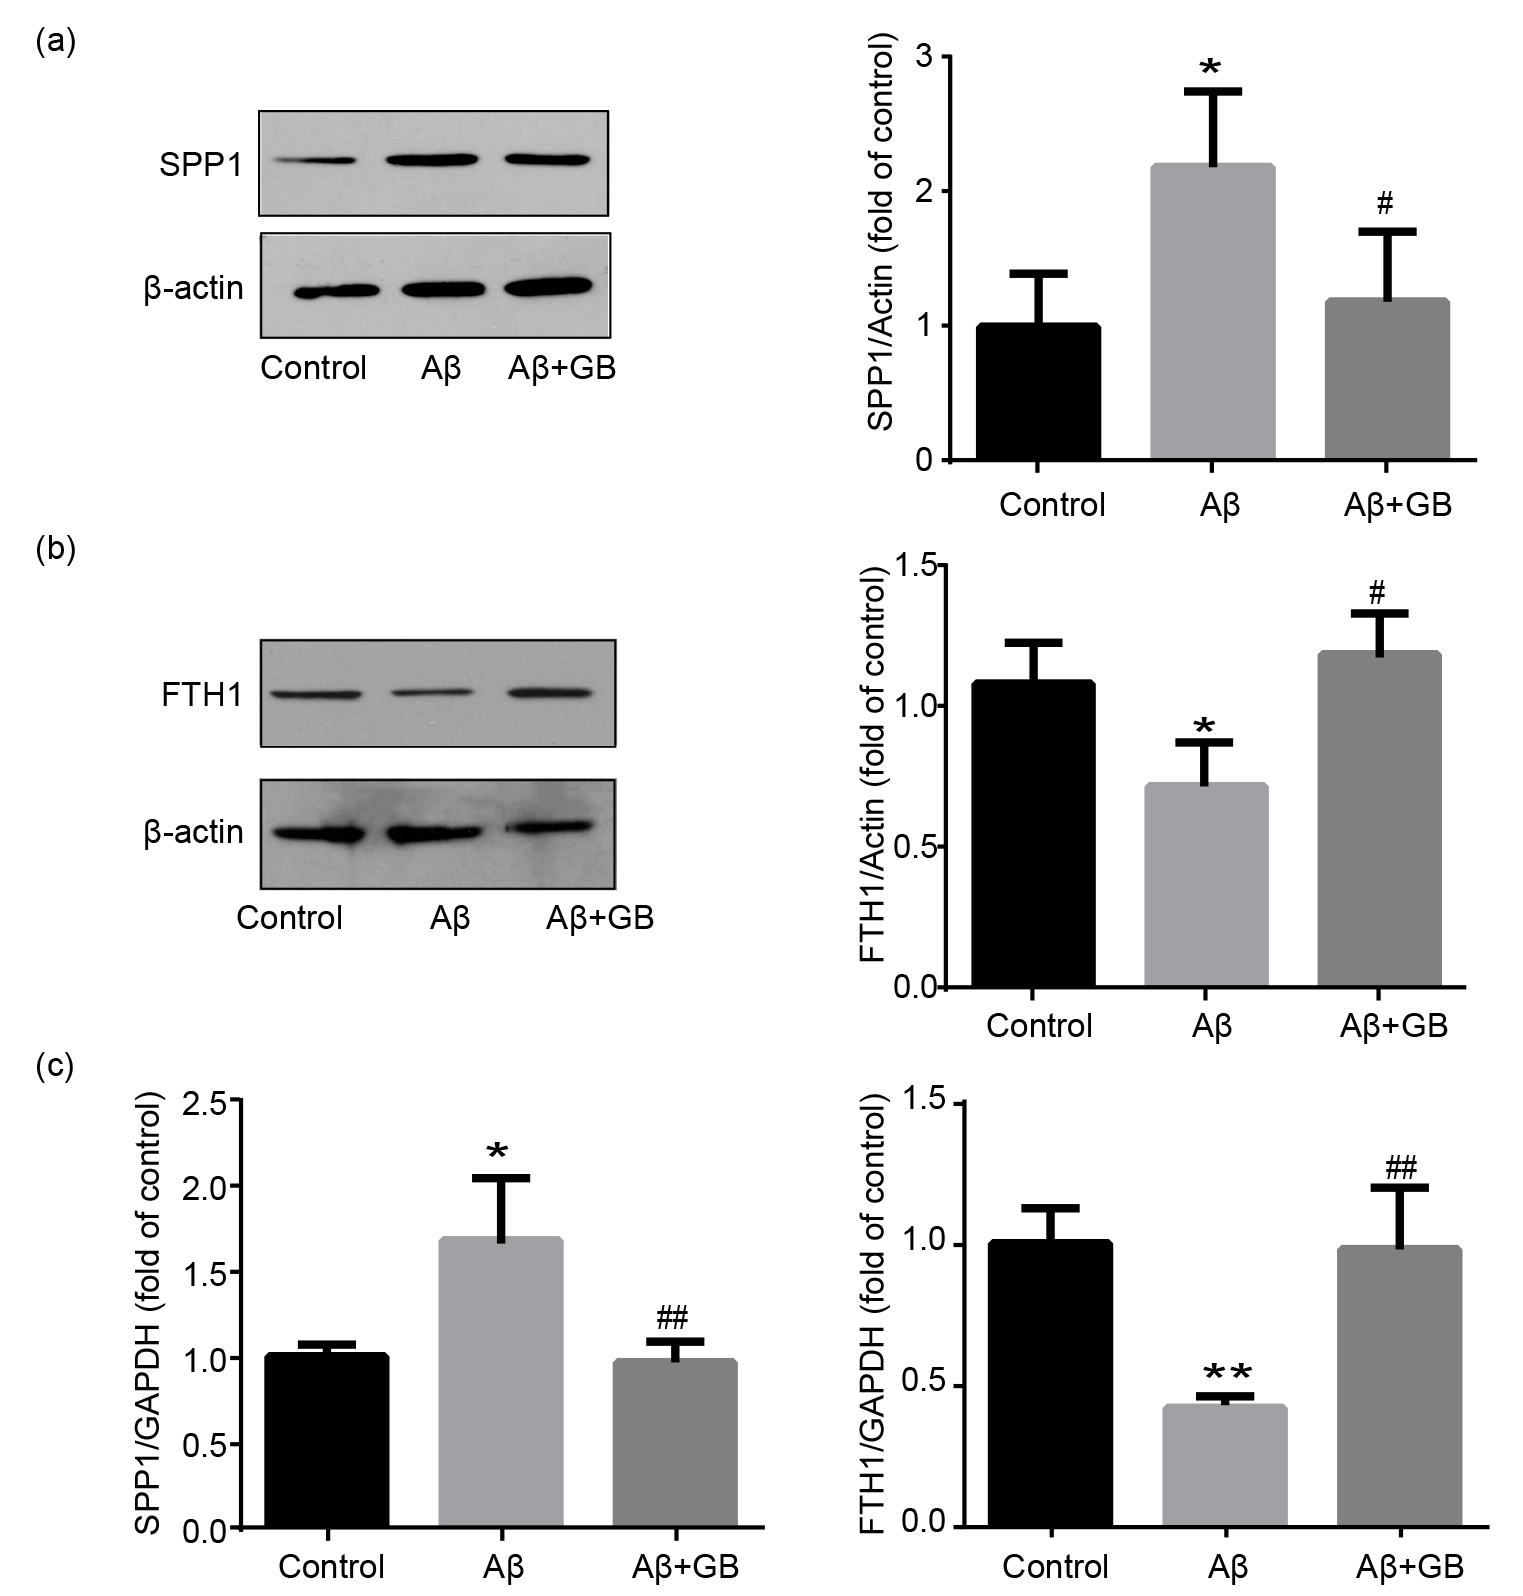 Fig. 6.
Validation of SPP1 and FTH1 expression levels in N2a cells. (a)
Representative images of SPP1 protein levels and relative level normalized to
-actin (n = 3). (b) Representative images of FTH1 protein levels and
relative level normalized to -actin (n = 3). (c) Relative mRNA levels of
SPP1 and FTH1 determined by qPCR (n = 3). Data was expressed as mean SEM.
*p 0.05 and ** p 0.01 vs. control group; # p 0.05 and ## p 0.01 vs. A group.
4. Discussion
Extracellular aggregated amyloid plaques and intracellular highly phosphorylated
neurofibrillary tangles are the typical pathological features of AD. Abnormal
aggregation of neurotoxic A promotes inflammatory responses, oxidative
stress, and apoptotic activation, which results in extensive neuron death and the
onset of clinical symptoms [26]. GB has anti-apoptotic and
antioxidant functions against cerebral ischemic injury and A-induced
neurotoxicity [12, 14]. A-induced cell injury model of
AD has been widely used for the investigation of AD pathogenesis. In the present
study, N2a cells stimulated by A oligomers
alone revealed significantly decreased cell survival rates and cell apoptosis.
Nevertheless, this change was efficiently reversed in cells with GB pretreatment
(Fig. 1e–g). These results showed that GB relieved cell
toxicity and apoptosis caused by A oligomers, implying the
neuroprotective effect of GB against cell injury. Next, we investigated whether
GB protects against A-induced oxidative injury in N2a
cells. GB inhibited intracellular ROS and MDA production and
induced an upregulation of antioxidant substance like SOD (Fig. 2a–c),
demonstrating the antioxidant effect of GB on cell toxicity stimulated by
A oligomers. In addition, the increased A peptide
level in the A group was also reversed by 100 M GB (Fig. 2d). GB
provided anti-apoptotic and antioxidant function on A-induced
cell injury, and downregulated A peptide expression. However,
the potential molecular mechanisms of GB in the progression of AD remain
ambiguous.
In order to explore the neuroprotective effects of GB in AD and reveal its
underlying molecular mechanisms, TMT labeled proteomics was
performed to explore the profile of DEPs associated with GB pretreatment in
A-induced cell injury model of AD (Figs. 3,4). We
confirmed 61 DEPs in A-induced N2a cells with GB pretreatment,
including 42 upregulated and 19 downregulated proteins (Table 1). These DEPs
contained several known AD protein biomarkers, like presenilin-2 (PSEN2), SPP1,
and SLC7A11. The protein levels of Psen2, SPP1, and SLC7A11 were remarkably
increased in A group, and decreased after GB treatment. On the basis of
LC-MS/MS analysis results, bioinformatic analysis of DEPs were applied to uncover
the underlying signaling pathways and protein targets of GB.
GO enrichment analysis showed that DEPs
mainly participated in the regulation of cell death, reminded us that apoptotic
signaling pathway has definite function in the pharmacological effects of GB in
AD (Fig. 5). Proteins involved in the regulation of cell death
pathway included PSEN2 and SPP1. Secreted glycophosphoprotein
SPP1 has an extensive range of functions [27], such as prompting
neuroinflammation and apoptosis. SPP1 protein expression has been observed to
upregulate in the prefrontal cortex and cerebrospinal fluid of AD patients [27, 28], as well as in APP/human presenilin-1(PS1) KI mouse model of AD [29]. Our
study showed that SPP1 participants in the regulation of
apoptotic progress of AD and exacerbates cell apoptosis. We
validated obvious up-regulation of SPP1 in A-induced N2a cells,
and the increased SPP1 level was significantly reduced after GB treatment (Fig. 6). These results further support the anti-apoptotic effect of GB in AD, which
possibly is related to downregulated SPP1 protein.
KEGG enrichment analysis showed that DEPs in GB treated N2a cells were concerned
with ferroptosis. Ferroptosis is a newly recognized iron-dependent oxidative cell
death that is considered as a crucial pathological process in AD [30, 31]. It
depends on the regulation of various iron metabolism proteins, such as FTH1 and
ferroportin [32]. FTH1, the essential iron storage protein,
provides protective effects against neural damage through the regulation of iron
metabolism [33, 34]. In APP/PS1 mice, neurons in cerebral cortex and hippocampus
were vulnerable to ferroptosis, accompanied by downregulated FTH1 protein [30].
GB exerted anti-ferroptosis effects by up-regulating Nrf2 and FTH1 in
nonalcoholic fatty liver disease [35].
Consistent with previous conclusions, FTH1
remarkably decreased in the A group and GB pretreatment upregulated
its expression in our study (Fig. 6). This result implies that GB may exert
anti-ferroptosis effect by up-regulating FTH1 protein in AD.
Taken together, above results confirmed that GB exerts
neuroprotective effects against A induced cell injury by
restoring DEPs involved in the regulation of cell death and ferroptosis. GB
provided anti-apoptotic and anti-ferroptosis roles in AD through down-regulating
SPP1 and up-regulating FTH1. Therefore, SPP1 and FTH1 proteins can be considered
as potential therapeutic targets of GB for AD.
Abbreviations
ACN, acetonitrile; AGC, automatic gain control; A, amyloid beta; AD,
Alzheimer’s disease; ANOVA, one-way analysis of variance; APP, amyloid precursor
protein; DEPs, differentially expressed proteins; DMEM, Dulbecco’s Modified Eagle
Medium; DMSO, Dimethyl sulfoxide; FDR, false discovery rate; FITC, fluorescein
isothiocyanate; FTH1, ferritin heavy chain 1; GB, Ginkgolide B; GOBP, gene
ontology biological process; GOCC, GO cellular component; GOMF, GO molecular
function; HRP, horseradish peroxidase; KEGG, Kyoto Encyclopedia of Genes and
Genomes; LC-MS/MS, Liquid chromatography-tandem mass spectrometry; MTT,
3-4,5-dimethylthiazol-2-yl-2,5-diphenyl-tetrazolium bromide; PE, phycoerythrin;
PI, propidium iodide; PS1, human presenilin-1; PSEN2, presenilin-2; qRT-PCR,
quantitative real-time PCR; ROS, reactive oxygen species; SPP1,
osteopontin; TFA, trifluoroacetic acid; TEM, transmission electron microscopy;
TMT, Tandem mass tag.


