


 , Takashi Hoshikawa 1, Atsuko Ikenouchi 1,2, Tomoya Natsuyama 1, Rintaro Fujii 1, Ryohei Igata 1, Hirofumi Tesen 1, Yuki Konishi 1, Yuichi Honma 3, Masaru Harada 3, Reiji Yoshimura 1,*
1 Department of Psychiatry, University of Occupational and Environmental Health, 807-8555 Kitakyushu, Japan
2 Medical Center for Dementia, Hospital of University of Occupational and Environmental Health, 807-8555 Kitakyushu, Japan
3 Third Department of Internal Medicine, University of Occupational and Environmental Health, 807-8555 Kitakyushu, Japan
Academic Editor: Gernot Riedel
Abstract
Background: A close relationship exists between major depressive disorder (MDD) and diabetes mellitus. The metabolomic difference and similarity between patients with and without diabetes mellitus have not been well studied in the context of MDD. We aimed to examine these differences and common serum metabolomics patterns, pathways and biomarkers that can comprehensively reflect the pathogenetic difference and similarity between these MDD groups. Methods: We performed a metabolomics analysis of serum samples of healthy controls (n = 6), patients with MDD and type 2 diabetes mellitus (n = 13), and patients with MDD without type 2 diabetes mellitus (n = 27). Metabolomics analysis was conducted using capillary electrophoresis Fourier transform mass spectrometry and a candidate compound was assigned to the 496 (290 cation, 206 anion) peaks. Moreover, we evaluated the sensitivity and specificity of the candidate biomarkers for distinguishing between MDD patients with or without type 2 diabetes mellitus. Results: Principal component analysis revealed no clear distinction among the three groups, while naive partial least squares discriminant analysis yielded three relatively good and distinct populations based on the first principal component. Energy conversion by the tricarboxylic acid cycle represented the highest percentage among the top 30 positive factors of the first principal component, and glutamate metabolism and urea cycle represented the highest percentage among the top 30 negative factors of the first principal component. Synthesis and degradation of ketone bodies had high impact in MDD with type 2 diabetes mellitus group and taurine and hypotaurine metabolism had high impact in MDD without type 2 diabetes mellitus group for the pathway. Conclusions: Patterns of serum metabolites may be different among MDD with type 2 diabetes mellitus, MDD without type 2 diabetes mellitus, and healthy controls groups. Specifically, comorbid type 2 diabetes mellitus could affect metabolomics pathway and alter the distribution of serum metabolites in patients with MDD. These findings may shed light on the influence of the type 2 diabetes on the pathophysiology of MDD.
Major depressive disorder (MDD) and diabetes mellitus are closely related [1]. Previous studies have reported that patients with MDD exhibit reduced physical activity, altered eating habits, abnormalities in the hypothalamic-pituitary-adrenal axis, and increased levels of inflammatory cytokines, all of which increase the risk of the development or worsening of diabetes [2]. On the other hand, the lifestyle modifications required for diabetes mellitus treatment and self-care are stressful, and physiological factors, such as insulin resistance in the brain and cerebrovascular disease contribute to the development and persistence of MDD [3]. Elevated cortisol levels alter both the morphology and function of the brain in patients with MDD [4], further triggering the vicious cycle.
Recently, metabolomics, a branch of systems biology, has been applied in many
fields, wherein the development and application of effective analytical
techniques and methods for the analysis of biological tissues and fluids has
contributed significantly to the understanding of the basis of several diseases
and the discovery of specific biomarkers [5]. Metabolomics provides information
on the underlying metabolic pathways and aids in the exploration of potential
pathways [6]. A previous study reported that rats subjected to chronic
unpredictable mild stress exhibited significant metabolomic changes when compared
with controls [7]. Kyoto Encyclopedia of Genes and Genomes (KEGG) is a generic
resource applicable to all organisms and enables interpretation of high-level
functions from genomic and molecular data [8]. An analysis based on the KEGG
pathway database demonstrated that amino acid metabolism, energy metabolism, and
glycometabolism are influenced by chronic unpredictable mild stress exposure [9].
Interestingly, another previous study used plasma metabolomics analysis to show
that glycometabolism was related to depressive symptoms in a chronic
unpredictable mild stress model of depression [10]. Specific metabolite changes
in depression and type 2 diabetes are as follow. Melancholic major depression has
been shown to be related to changes in amino acids, catecholamines, lipids,
stress hormones, and immune-related metabolites [11]. Many studies have found
elevated plasma levels of branched-chain amino acids and their derivatives,
aromatic amino acids and
The above findings suggest that MDD are closely related to type 2 diabetes like glycometabolism and energy metabolism, and amino acid metabolism; however, the precise metabolomic differences between patients with MDD with and without diabetes mellitus remain to be elucidated. We hypothesized that patients with MDD with and without diabetes mellitus have different metabolomic profile. Thus, diabetes mellitus as a comorbidity could alter the MDD metabolic phenotype. While type 2 diabetes and MDD may share some metabolomic pathways, there are depression-specific metabolomic pathways. Hence, we performed a metabolomics analysis of serum samples from healthy controls (HCs), patients with MDD with type 2 diabetes mellitus, and patients with MDD without type 2 diabetes mellitus.
This exploratory study aimed to examine the differences in the associated metabolites and search for serum metabolomics patterns, pathways and biomarkers that can comprehensively reflect the differences in pathogenesis between MDD with and without diabetes mellitus.
This study was conducted in accordance with the Declaration of Helsinki, and the protocol was approved by the Ethics Committee of University of Occupational and Environmental Health, Kitakyushu, Japan (UOHECRB21-057). All participants provided verbal and written informed consent. All participants were assured that they could withdraw consent at any time and would not be disadvantaged as a result.
Forty patients with MDD participated in this study. Patients were recruited from
Hospital of University of Occupational and Environmental Health Japan. All
patients were diagnosed with MDD using the Diagnostic and Statistical Manual for
Mental Disorders, fifth edition [14]. Exclusion criteria included a history of
major neurological disease, epilepsy, cerebrovascular accident, head trauma with
cognitive sequelae, and intellectual disability. Three of the 40 patients did not
take any antidepressant medication, while 37 patients were taking antidepressant
drugs. Total antidepressant use was calculated based on imipramine equivalent
[15, 16]. Type 2 diabetes mellitus was diagnosed in accordance with the relevant
Japan Diabetes Society criteria (i.e., plasma glucose levels: fasting
The clinical symptoms of patients with MDD were assessed using the Montgomery-Asberg Depression Rating Scale (MADRS) [19]. We collected non-fasting serum blood sample. Patient blood was collected in plain blood tubes at University of Occupational and Environmental Health Japan; serum was separated by centrifugation at 2000 g for 20 min and stored at –80 °C in silicone-coated tubes until analysis.
Serum samples were transferred to Human Metabolome Technologies, Inc. (HMT, Tsuruoka, Japan) for metabolite analysis, using capillary electrophoresis (CE)
coupled with Fourier transform mass spectrometry (CE-FTMS) based on the method
described in HMT’s
The detected peaks were broadly classified into the following 12 pathways based on the candidate compounds: carbohydrate metabolism, glucose metabolism/gluconeogenesis, energy storage by the tricarboxylic acid (TCA) cycle, energy conversion by the TCA cycle, glutamate metabolism and urea cycle, choline metabolism and methionine cycle, aromatic amino acid metabolism (tryptophan), aromatic amino acid metabolism (phenylalanine and tyrosine), nucleic acid metabolism (purine metabolism - adenosine), nucleic acid metabolism (purine metabolism - guanosine), nucleic acid metabolism (pyrimidine metabolism), and coenzyme metabolism. The classification of metabolic pathways and substance properties was mainly based on the KEGG pathway database [8]. Note that some metabolites were not classified under the 12 pathways. This is because metabolomics analysis also comprehensively detects metabolites which structure can be detected but actual action or metabolic pathway they can be classified into is not known. When a metabolite spanned more than one pathway, it was counted in both. Second, for each of the top 30 positive and negative factor loading metabolites we used the Human Metabolome Database numbers and calculated their pathway impact and match status [21]. Metabolomics pathway analysis combines several advanced pathway enrichment analysis procedures along with the analysis of pathway topological characteristics to help identify the most relevant metabolic pathways involved in given metabolomic study [21].
Statistical analyses were performed using the MATLAB [22], MetaboAnalyst [23], and EZR [24]. First, we used Welch’s t-test to examine the total number of metabolites for MDD with and without diabetes. Next, all metabolites, which metabolomics analysis assigned a candidate compound to the 496 peaks were evaluated using principal component analysis (PCA) [25]. Thereafter, we used naive partial least squares (PLS) analysis [26]. We assessed the separation between groups by PCA and naive PLS using one-way analysis of variance (ANOVA). We extracted the top metabolites with the highest factor loadings. The relationship of individual metabolites with antidepressants (imipramine equivalents) was examined using multiple regression analysis. Age and body mass index (BMI) were corrected as covariates in our multiple regression analysis. We then calculated the pathway impact and match status [21] for individual metabolites specifically, the top 30 positive and negative factor loadings of the first principal component of naive PLS. Thereafter, the potential of blood metabolites to discriminate between patients with MDD with type 2 diabetes and those with MDD without type 2 diabetes was evaluated using receiver operating characteristic (ROC) curve analysis. We targeted metabolites that were detected in all 46 samples as candidate biomarkers and were statistically significant in Welch’s t-test or naive PLS.
Continuous variable data are expressed in terms of mean (standard deviation) or
median (interquartile range) values. The tests were two-tailed, and p
values
Table 1 showed the demographic and clinical characteristics of the patients with MDD and HCs. In the MDD group, 13 patients had type 2 diabetes mellitus, while 27 did not. Patients with MDD with type 2 diabetes tended to be older, overweight and had milder depressive symptoms than those without type 2 diabetes.
| HCs | MDD Total | MDD DM (-) | MDD DM (+) | |
| (n = 6) | (n = 40) | (n = 27) | (n = 13) | |
| Age, years | 44.6 (4.16) | 56.6 (14.9) | 52.3 (13.9) | 65.6 (13.1) |
| Sex, male (%) | 2 (33%) | 17 (43%) | 11 (39%) | 6 (46%) |
| BMI, kg/m |
22.4 (4.76) | 24.0 (5.75) | 22.9 (5.33) | 26.1 (6.18) |
| DM family history (%) | - | 13 (33%) | 8 (30%) | 5 (38%) |
| HbA1c (%) | - | 5.98 (0.98) | 5.54 (0.47) | 7.02 (1.17) |
| MDD family history (%) | - | 8 (20%) | 6 (22%) | 2 (15%) |
| MADRS score, point | - | 12.4 (6.17) | 13.2 (6.18) | 10.7 (6.04) |
| Past depressive episode, number | - | 2 [1–2] | 2 [1–2] | 2 [1–2] |
| Disease period, years | - | 8.5 [3–32] | 3 [0–5] | 2 [1–19] |
| Imipramine equivalence, mg/day | - | 112 [75–206] | 123 [70.4–188] | 82.3 [76–123.5] |
| Antidepressant, number of cases | - | Venlafaxine (8) | Mirtazapine (3) | |
| Escitalopram (7) | Vortioxetine (3) | |||
| Mirtazapine (4) | Duloxetine (2) | |||
| Duloxetine (3) | Escitalopram (2) | |||
| Trazodone (1) | Trazodone (1) | |||
| Vortioxetine (1) | Sertraline (1) | |||
| Drug free (4) | Drug free (1) | |||
| Diabetes drug, number of cases | - | - | Metformin (6) | |
| Sitagliptin (5) | ||||
| Febuxostat (1) | ||||
| Pioglitazone (1) | ||||
| Glibenclamide (1) | ||||
| Acarbose (1) | ||||
| BMI, body mass index; HbA1c, Hemoglobin A1c; HCs, healthy controls; MADRS, Montgomery-Asberg Depression Rating Scale; MDD, major depressive disorder; MDD DM (-), major depressive disorder without diabetes mellitus; MDD DM (+), major depressive disorder with diabetes mellitus. Data are expressed in terms of mean (standard deviation) or median [interquartile range] values. | ||||
Welch’s t-test revealed that 22 metabolites showed statistical
differences between MDD with and without type 2 diabetes (Table 2). We evaluated
all metabolites using PCA and created two-dimensional plots for the first and
second principal components. PCA revealed no clear separation among the three
groups (first principal component mean
| Name | HCs | MDD DM (-) | MDD DM (+) | p value |
|---|---|---|---|---|
| 2-Hydroxyoctanoic acid-3 | 1.7 |
1.0 |
2.6 |
0.031 |
| 8-Hydroxyoctanoic acid-3 | ||||
| 2-Methylserine | N. D | 1.7 |
4.5 |
0.033 |
| 4-Hydroxyphenethyl alcohol-H |
6.2 |
6.0 |
8.1 |
0.004 |
| Aspartame | 1.0 |
1.1 |
5.8 |
0.023 |
| Citric acid | 8.3 |
7.2 |
8.7 |
0.024 |
| Cystine | 1.3 |
1.4 |
1.8 |
0.008 |
| Glutamyl-glutamic acid (Glu-Glu) | 2.1 |
3.0 |
1.5 |
0.043 |
| Glucurone | 5.4 |
2.6 |
4.7 |
0.010 |
| Glutathione (GSSG)_divalent | 1.3 |
4.2 |
1.8 |
0.031 |
| Glycyl-L-aspartic acid (Gly-Asp) | 4.9 |
4.3 |
2.6 |
0.020 |
| Glycerol 3-phosphate | 4.0 |
3.0 |
2.1 |
0.015 |
| Glycerophosphocholine | 9.9 |
1.3 |
8.3 |
0.005 |
| Guanidoacetic acid | 6.8 |
7.3 |
5.8 |
0.002 |
| Hypotaurine | 1.3 |
2.5 |
1.5 |
0.033 |
| Muscimol | 1.4 |
1.5 |
2.1 |
0.002 |
| myo-Inositol 1-phosphate | 4.0 |
1.8 |
5.4 |
0.013 |
| myo-Inositol 3-phosphate | ||||
| myo-Inositol 2-phosphatea | 2.4 |
1.0 |
4.9 |
0.016 |
| N-Acetyllysine | 2.3 |
4.4 |
2.3 |
0.048 |
| N-Acetylmethionine | 1.7 |
4.5 |
2.5 |
0.044 |
| N-Acetylornithine | 7.0 |
1.7 |
1.1 |
0.042 |
| N6-Methyllysine | 1.3 |
1.2 |
2.5 |
0.043 |
| Threoninyl-Aspartate (Thr-Asp) | 3.0 |
7.2 |
4.0 |
0.027 |
| HCs, healthy control; MDD, major depressive disorder; MDD DM (-), major depressive disorder without type 2 diabetes mellitus; MDD DM (+), major depressive disorder with type 2 diabetes mellitus; N. D, not detectable. p values were determined by Welch’s t-test between MDD with and without type 2 diabetes. Data are expressed in terms of the mean (standard deviation). | ||||
 Fig. 1.
PCA results. No clear separation among the groups is observed
(first principal component mean
Two MDD patients without type 2 diabetes mellitus showed a distinctly different
distribution from the other groups. The two patients had a BMI of 18 and 15
kg/m
Since PCA did not show reliable separation, we used naive PLS. As a result,
three relatively good and distinct populations were identified (first principal
component mean
 Fig. 2.
Naive PLS results. Three relatively good and distinct
populations are identified (first principal component mean
By selecting the top metabolites in the naive PLS factor loadings for which we
found statistically significant differences, we identified 30 candidate biomarker
metabolites. We presented metabolites with p value
| Name | Factor loading | p value | Metabolite Pathway | Number detected | |||
| HCs | MDD | MDD | Total | ||||
| DM (-) | DM (+) | ||||||
| Positive factor loading | |||||||
| Metformin | 0.520 | - | 0 | 0 | 6 | 6 | |
| 4-Hydroxyphenylacetaldehyde | 0.478 | Aromatic amino acids (phenylalanine and tyrosine metabolism) | 4 | 10 | 12 | 26 | |
| 2-Hydroxyoctanoic acid-3 | 0.472 | - | 6 | 27 | 13 | 46 | |
| 8-Hydroxyoctanoic acid-3 | |||||||
| Glucurone | 0.433 | 0.003 | - | 6 | 26 | 13 | 45 |
| Muscimol | 0.420 | 0.004 | - | 6 | 27 | 13 | 46 |
| N6-Methyllysine | 0.391 | 0.007 | - | 6 | 27 | 13 | 46 |
| Citric acid | 0.387 | 0.008 | Energy storage by the TCA cycle, energy conversion by the TCA cycle | 6 | 27 | 13 | 46 |
| 3,4-Dihydroxyphenylglycol | 0.377 | 0.010 | Aromatic amino acids (phenylalanine and tyrosine metabolism) | 6 | 14 | 12 | 32 |
| 10-Hydroxydecanoic acid | 0.371 | 0.011 | - | 6 | 20 | 12 | 38 |
| Cystine | 0.373 | 0.011 | Choline metabolism and methionine cycle | 6 | 27 | 13 | 46 |
| O-Acetylcarnitine | 0.363 | 0.013 | Choline metabolism and methionine cycle | 6 | 27 | 13 | 46 |
| 2,5-Dihydroxybenzoic acid | 0.362 | 0.014 | - | 5 | 12 | 9 | 26 |
| 2,3-Dihydroxybenzoic acid | |||||||
| Phenol | 0.348 | 0.018 | - | 6 | 16 | 12 | 34 |
| Pyrophosphate | 0.333 | 0.024 | - | 1 | 4 | 6 | 11 |
| Glucosamine-1 | 0.319 | 0.031 | - | 6 | 27 | 13 | 46 |
| Galactosamine-1 | |||||||
| Erythrose 4-phosphate | 0.311 | 0.035 | Glucose metabolism/gluconeogenesis | 0 | 1 | 3 | 4 |
| 2-Aminobutyric acid | 0.305 | 0.039 | - | 6 | 27 | 13 | 46 |
| 2-Aminoisobutyric acid | |||||||
| 3-Hydroxybutyric acid | 0.300 | 0.043 | Energy conversion by the TCA cycle | 6 | 27 | 13 | 46 |
| Uric acid | 0.295 | 0.046 | Nucleic acid metabolism (purine metabolism - adenosine), nucleic acid metabolism (purine metabolism - guanosine) | 6 | 27 | 13 | 46 |
| Alanine | 0.292 | 0.049 | Energy conversion by the TCA cycle | 6 | 27 | 13 | 46 |
| Negative factor loading | |||||||
| Guanidinoacetic acid | –0.405 | 0.005 | Glutamate metabolism and urea cycle | 6 | 27 | 13 | 46 |
| Glycerophosphocholine | –0.348 | 0.018 | Choline metabolism and methionine cycle | 6 | 27 | 13 | 46 |
| Myo-Inositol 2-phosphate | –0.335 | 0.023 | - | 6 | 23 | 10 | 39 |
| Flavin adenine dinucleotide (FAD) divalent | –0.334 | 0.023 | Coenzyme metabolism | 1 | 17 | 4 | 22 |
| Myo-Inositol 1-phosphate, | –0.316 | 0.032 | - | 6 | 25 | 12 | 43 |
| Myo-Inositol 3-phosphate | |||||||
| N-Acetylglucosamine 1-phosphate | –0.313 | 0.033 | Carbohydrate metabolism | 6 | 26 | 11 | 43 |
| N-Acetylornithine | –0.313 | 0.034 | Glutamate metabolism and urea cycle | 3 | 27 | 13 | 43 |
| N-Acetylglucosamine 6-phosphate | –0.297 | 0.045 | Carbohydrate metabolism | 2 | 16 | 4 | 22 |
| Threonine-Aspartic acid (Thr-Asp) | –0.292 | 0.049 | - | 6 | 26 | 13 | 45 |
| Hypotaurine | –0.293 | 0.049 | Choline metabolism and methionine cycle | 6 | 27 | 13 | 46 |
| Demographic data | |||||||
| Age | 0.243 | 0.10 | - | 6 | 27 | 13 | 46 |
| BMI | 0.179 | 0.24 | - | 6 | 27 | 13 | 46 |
| BMI, body mass index; HCs, healthy controls; MDD, major depressive disorder; MDD DM (-), major depressive disorder without type 2 diabetes mellitus; MDD DM (+), major depressive disorder with type 2 diabetes mellitus; TCA, tricarboxylic acid cycle. | |||||||
Top five positive factor loading were as follows: metformin (factor loading =
0.520, p value
We found that the background factors of age (factor loading; 0.243, p value = 0.10, number detected = 46) and BMI (factor loading; 0.179, p value = 0.24, number detected = 46) did not contribute much to the differences between groups compared to top factor loading metabolites.
We examined the relationship of individual metabolites in the top factor loading metabolites with antidepressants (imipramine equivalents). Alanine was significantly negatively correlated with imipramine equivalents (standard partial regression coefficient = –0.349, 95% confidence interval: –0.659 to –0.039, standard error = 0.152, t value = –2.295, p value= 0.028; Fig. 3A). N-Acetylglucosamine 6-phosphate was significantly negatively correlated with imipramine equivalents of antidepressants dose (standard partial regression coefficient = –0.530, 95 % confidence interval: –1.038 to –0.023, standard error = 0.236, t value= –2.240, p value = 0.042; Fig. 3B). These p values were adjusted for age and BMI.
 Fig. 3.
Relationship between top factor loading metabolites and imipramine equivalence of antidepressants dose in patients with MDD. (A) Alanine is significantly negatively correlated with imipramine equivalents (standard partial regression coefficient = –0.349, p = 0.028). (B) N-acetylglucosamine 6-phosphate is significantly negatively correlated with imipramine equivalents (standard partial regression coefficient = –0.530, p = 0.042). These p values were adjusted for age and BMI.
Among the top 30 positive factor loadings of the first principal component, 14 metabolites were broadly classified into 12 metabolic pathways (Fig. 4A): energy conversion by the TCA cycle (fatty acid catabolism and branched chain amino acid metabolism), six cases; choline metabolism and methionine cycle, three cases; nucleic acid metabolism (purine metabolism - adenosine), two cases; nucleic acid metabolism(purine metabolism - guanosine), two cases; energy storage by the TCA cycle, two cases; aromatic amino acid metabolism (phenylalanine and tyrosine), one case; glucose metabolism/gluconeogenesis, one case; and glutamate metabolism and urea cycle, one case. Among the top 30 negative factor loadings of the first principal component, 20 metabolites were broadly classified into 12 metabolic pathways (Fig. 4B): glutamate metabolism and urea cycle, four cases; choline metabolism and methionine cycle, three cases; carbohydrate metabolism, three cases; coenzyme metabolism, two cases; and glucose metabolism/gluconeogenesis metabolism, one case. Other metabolites could not be classified in the 12 broadly defined pathways.
 Fig. 4.
Distributions of the number of cases of the factor loadings of the first principal component in naive PLS. (A) Among the top 30 positive factor loadings of the first principal component, 14 metabolites were classified into metabolic pathways. (B) Among the top 30 negative factor loadings of the first principal component, 20 metabolites were classified into metabolic pathways.
We then calculated the pathway impact and match status [21] for individual metabolites; specifically, for those among the top 30 positive and negative factor loadings of the first principal component of naive PLS, we performed pathway analyses that also included more detailed sub-items. Synthesis and degradation of ketone bodies was the high impact pathway in top 30 for positive factor loading (Table 4; Fig. 5A), and taurine and hypotaurine metabolism were extracted as high impact pathways in top 30 for negative factor loading (Table 4; Fig. 5B). We showed differences between groups of matched metabolites involved in pathway impact (Fig. 6A,B)
| Name | Pathway impact | p value | Match Status | Matched Metabolites |
|---|---|---|---|---|
| Positive factor loading | ||||
| Synthesis and degradation of ketone bodies | 0.600 | 0.002 | 2/5 | 3-Hydroxybutyric acid |
| Acetoacetic acid | ||||
| Valine, leucine, and isoleucine biosynthesis | 0.000 | 0.005 | 2/8 | Isoleucine |
| Valine | ||||
| Valine, leucine, and isoleucine degradation | 0.000 | 0.015 | 3/40 | Acetoacetic acid |
| Valine | ||||
| Isoleucine | ||||
| Butanoate metabolism | 0.111 | 0.016 | 2/15 | 3-Hydroxybutyric acid |
| Acetoacetic acid | ||||
| Tyrosine metabolism | 0.025 | 0.017 | 3/42 | 3,4-Dihydroxyphenylglycol |
| 4-Hydroxyphenylacetaldehyde | ||||
| Acetoacetic acid | ||||
| Aminoacyl-tRNA (ribonucleic acid) biosynthesis | 0.000 | 0.025 | 3/48 | Valine |
| Alanine | ||||
| Isoleucine | ||||
| Negative factor loading | ||||
| Taurine and hypotaurine metabolism | 0.714 | 0.002 | 2/8 | Taurine |
| Hypotaurine | ||||
| Glycerophospholipid metabolism | 0.129 | 0.045 | 2/36 | Glycerol 3-phosphate |
| Glycerophosphocholine | ||||
| Retinol metabolism | 0.216 | 0.153 | 1/17 | Retionate |
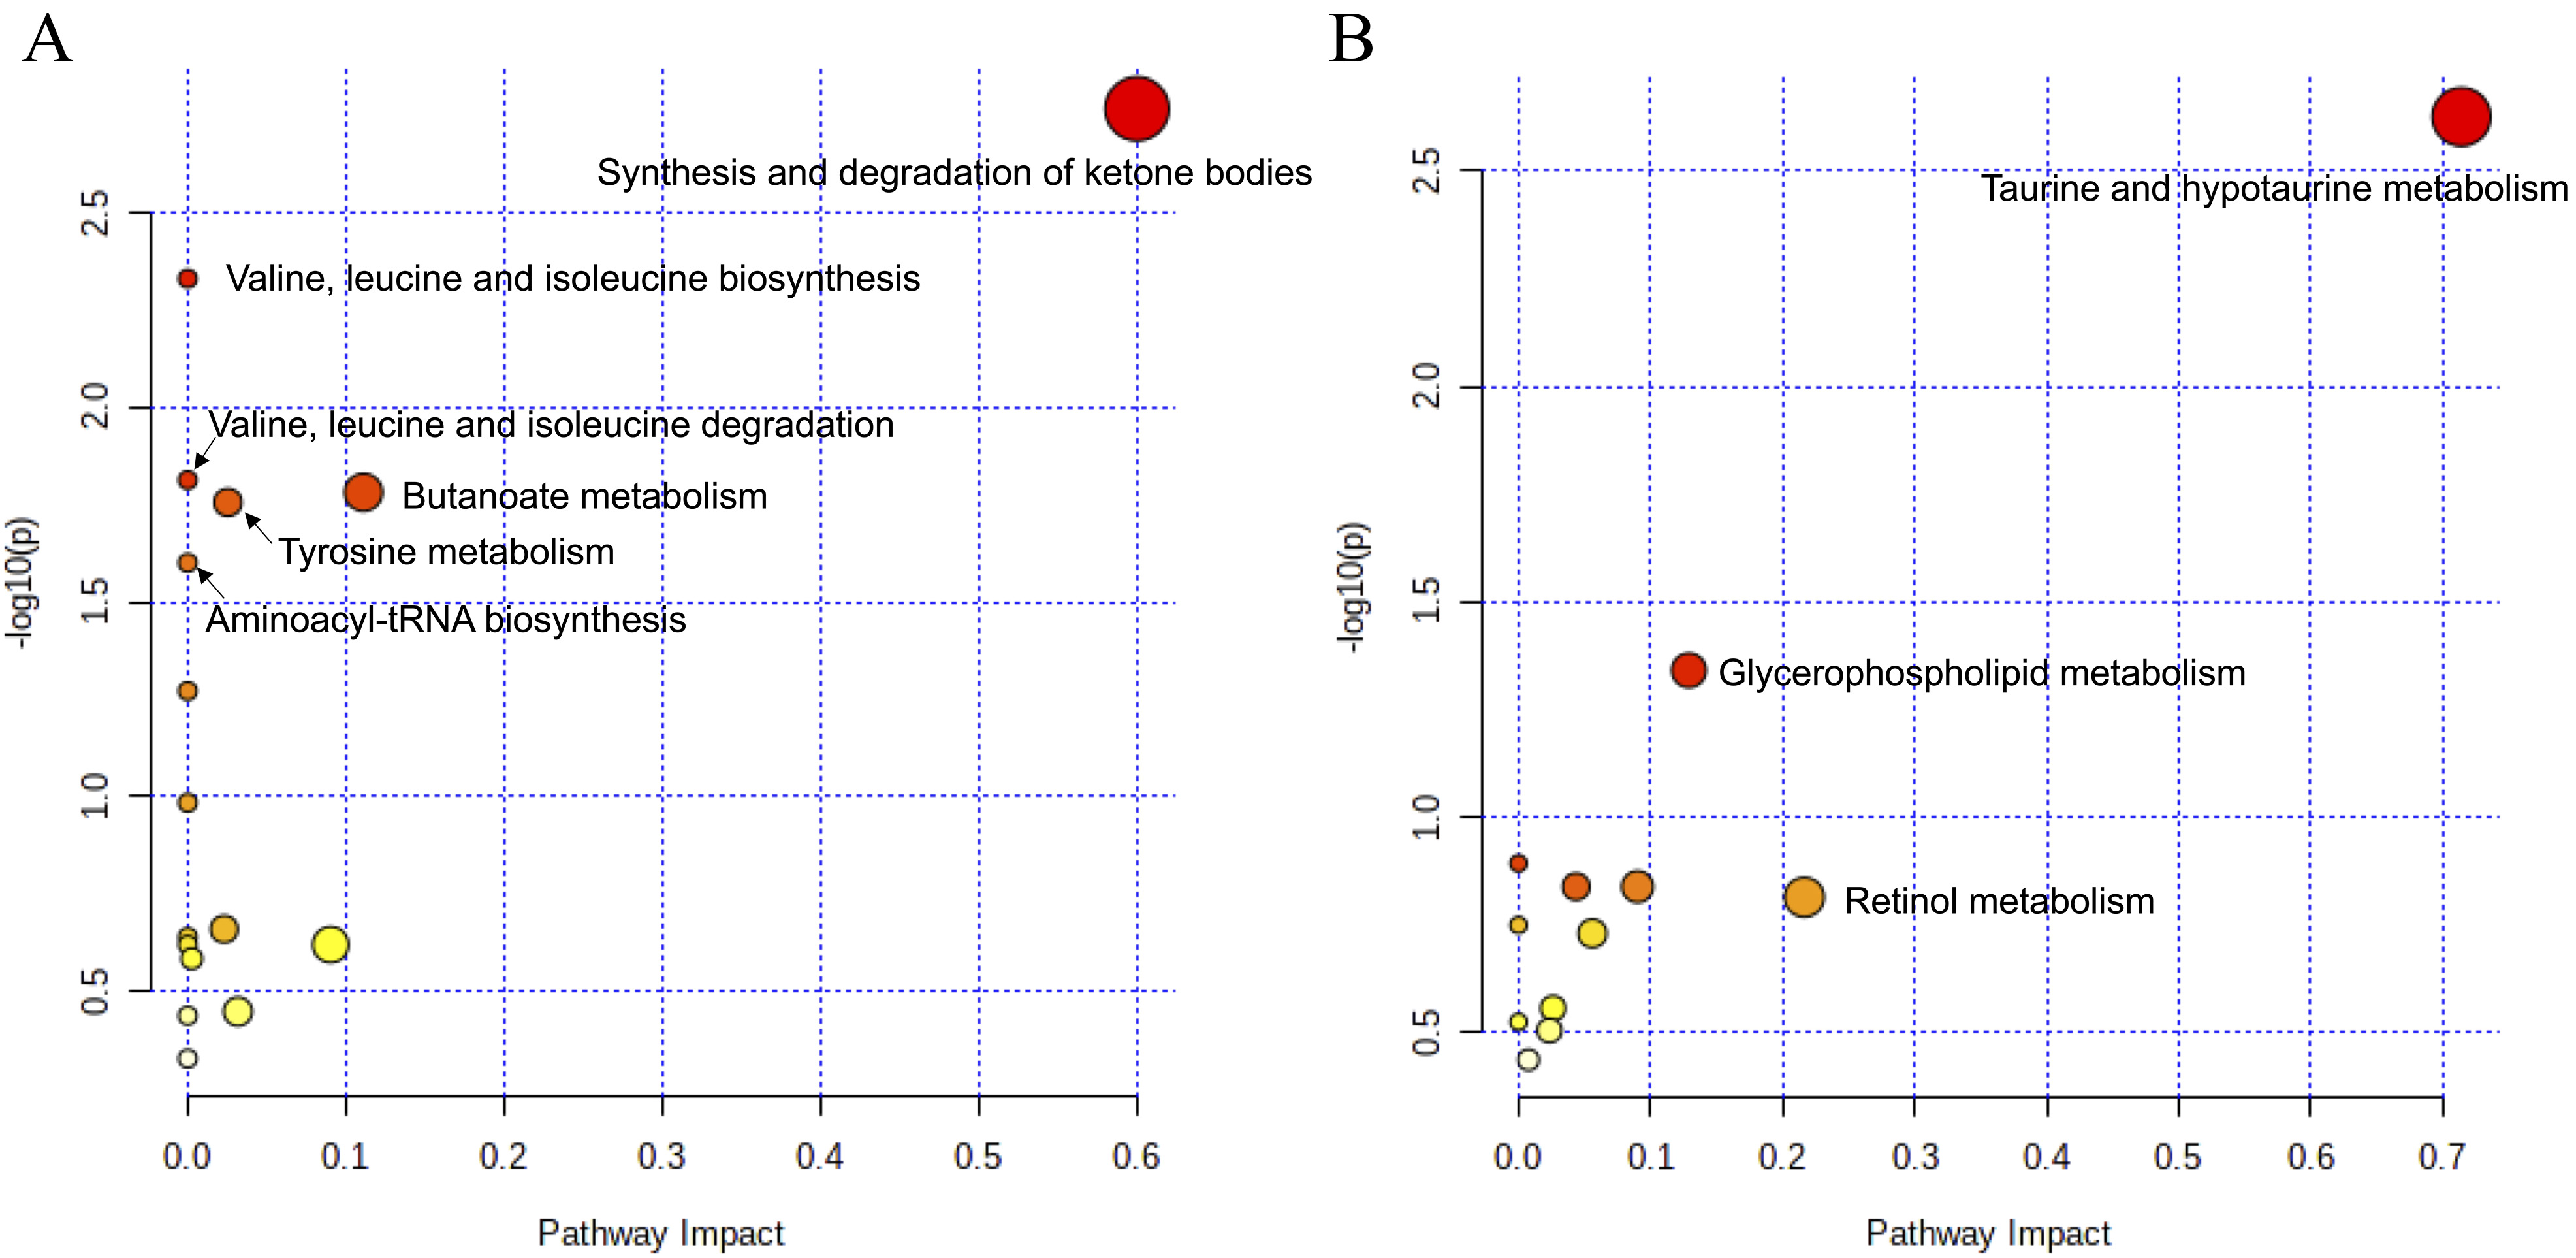 Fig. 5.
Pathway impact analysis. (A) Analysis of the top 30 positive factor loadings of the first principal component. Synthesis and degradation of ketone bodies was the high impact pathway in top 30 for positive factor loading (B) Analysis of the top 30 negative factor loadings of the first principal component. Taurine and hypotaurine metabolism were extracted as high impact pathways in top 30 for negative factor loading.
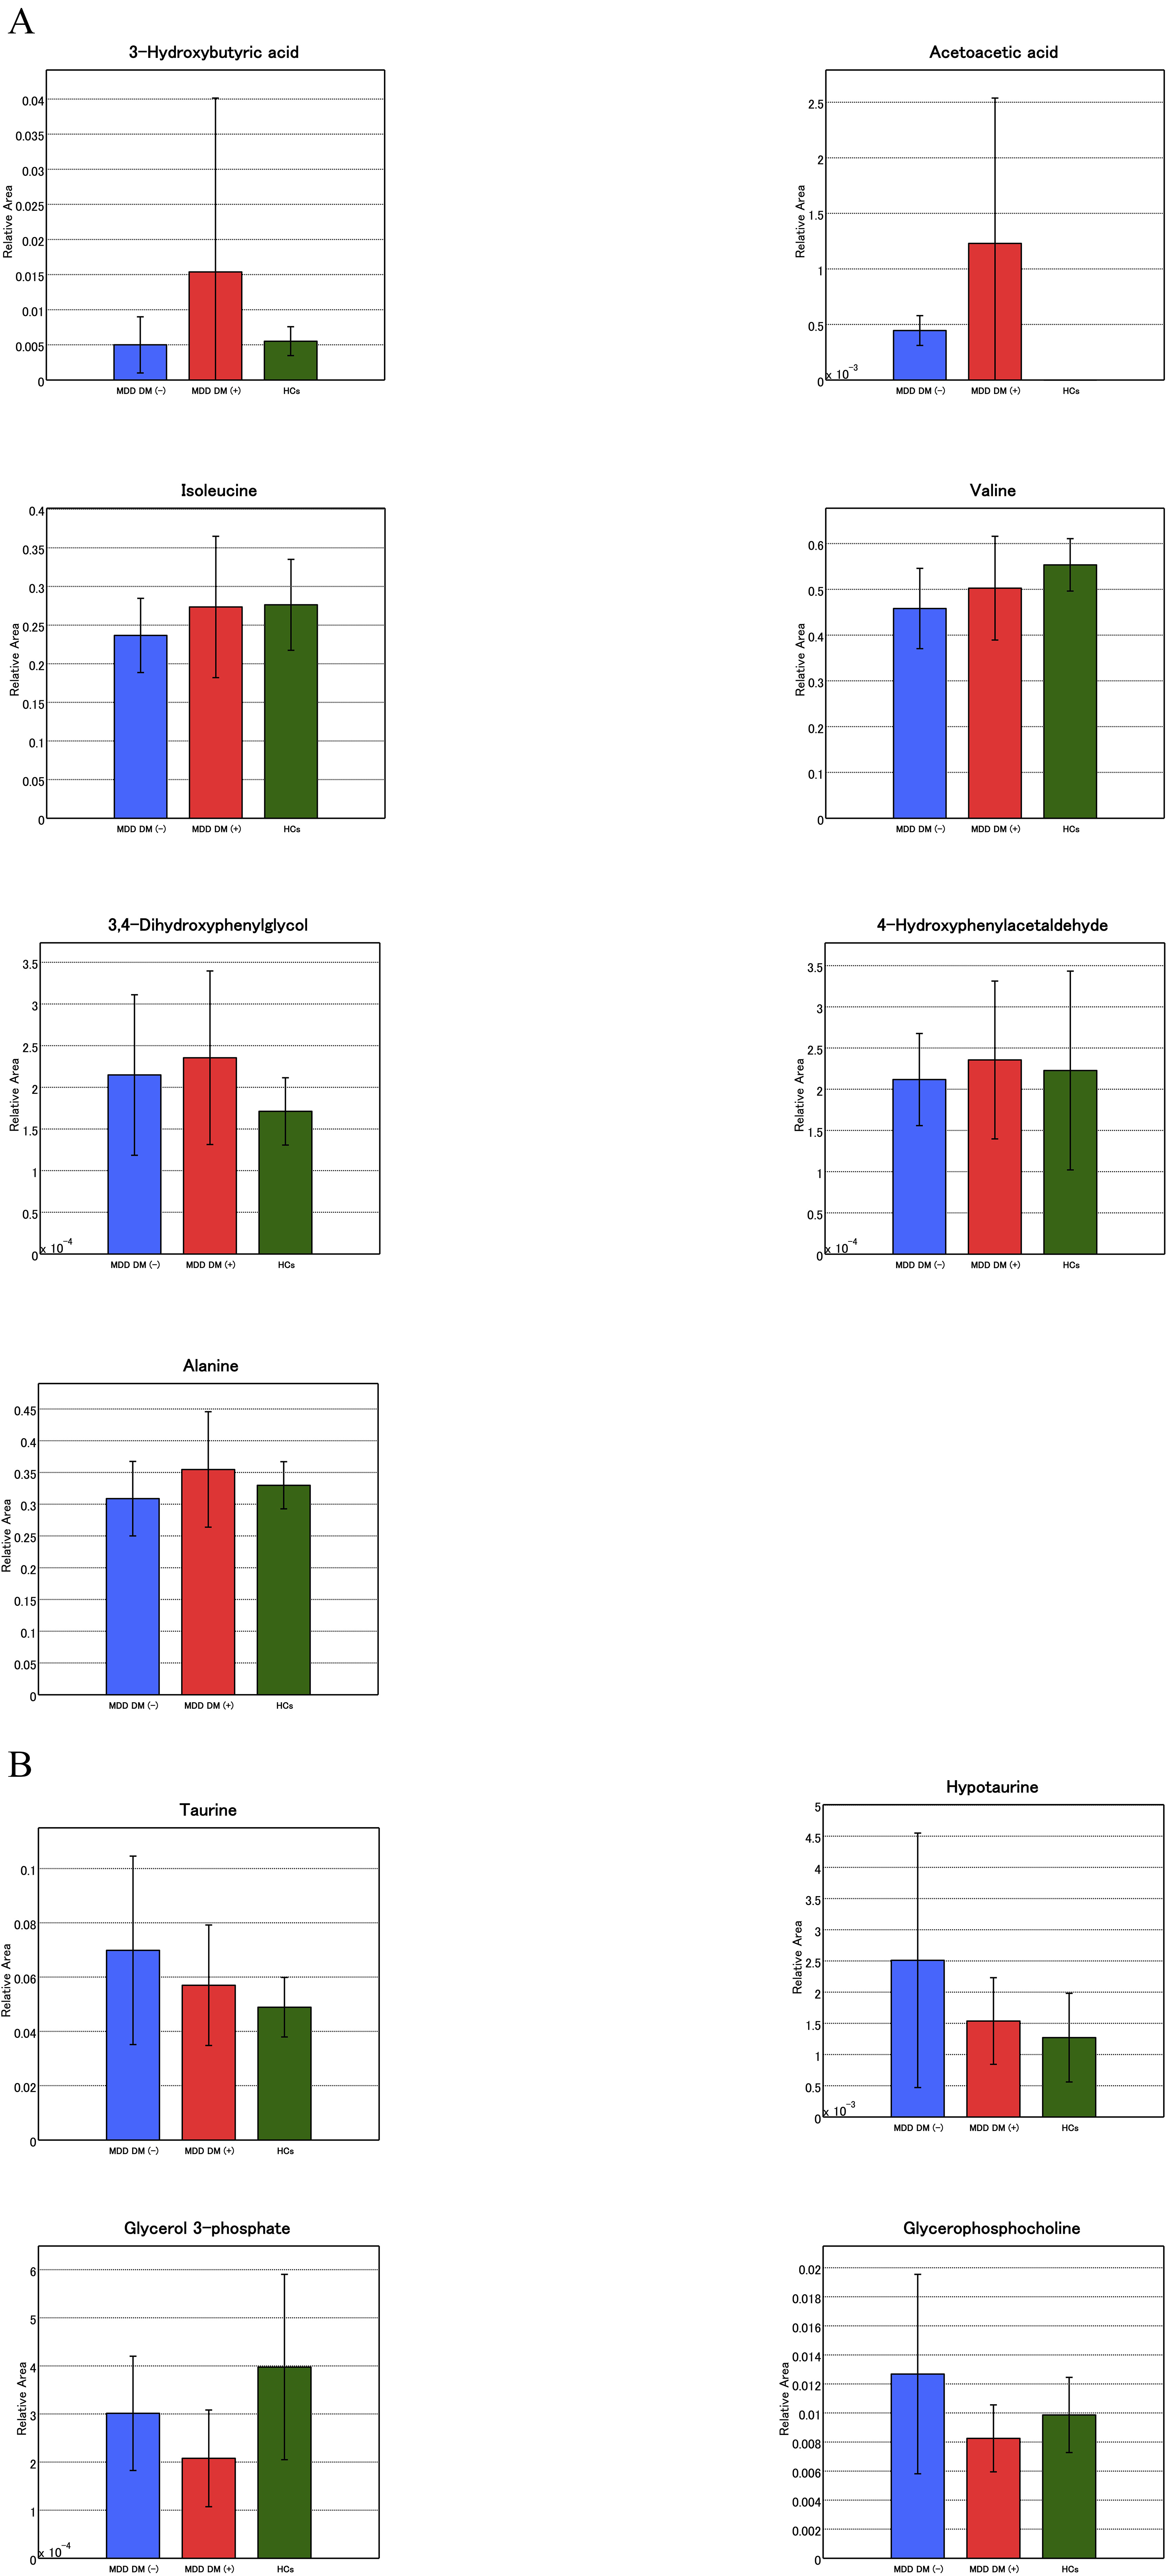 Fig. 6.
Differences between groups of matched metabolites involved in pathway impact. (A) Analysis of the top 30 positive factor loadings of the first principal component. (B) Analysis of the top 30 negative factor loadings of the first principal component.
We performed ROC curve analysis to evaluate the sensitivity and specificity of the candidate biomarkers for distinguishing between MDD patients with or without type 2 diabetes mellitus (Table 5; Fig. 7). We targeted metabolites that were detected in all 46 samples as candidate biomarkers and were statistically significant in Welch’s t-test or naive PLS. We also examined the sensitivity and specificity of the known diabetes mellitus biomarker HbA1c as a comparison. Among the MDD with and without type 2 diabetes groups, HbA1c was the most discriminatory variable compared to any other single metabolite.
| Name | Sensitivity | Specificity | AUC (95% CI) |
|---|---|---|---|
| Candidate biomarkers | |||
| 2-Hydroxyoctanoic acid-3 | 0.538 | 0.926 | 0.791 (0.638–0.943) |
| 8-Hydroxyoctanoic acid-3 | |||
| Muscimol | 0.692 | 0.889 | 0.815 (0.659–0.97) |
| N6-Methyllysine | 0.385 | 0.963 | 0.689 (0.506–0.873) |
| Citric acid | 0.923 | 0.481 | 0.728 (0.559–0.897) |
| Cystine | 0.846 | 0.556 | 0.771 (0.624–0.918) |
| Guanidinoacetic acid | 0.846 | 0.742 | 0.785 (0.63–0.94) |
| Glycerophosphocholine | 0.923 | 0.519 | 0.662 (0.491–0.834) |
| Hypotaurine | 1.000 | 0.333 | 0.623 (0.438–0.807) |
| Known biomarker | |||
| HbA1c | 0.727 | 1.000 | 0.944 (0.873–1.000) |
| AUC, area under the curve; CI, confidence interval; HbA1c, Hemoglobin A1c. | |||
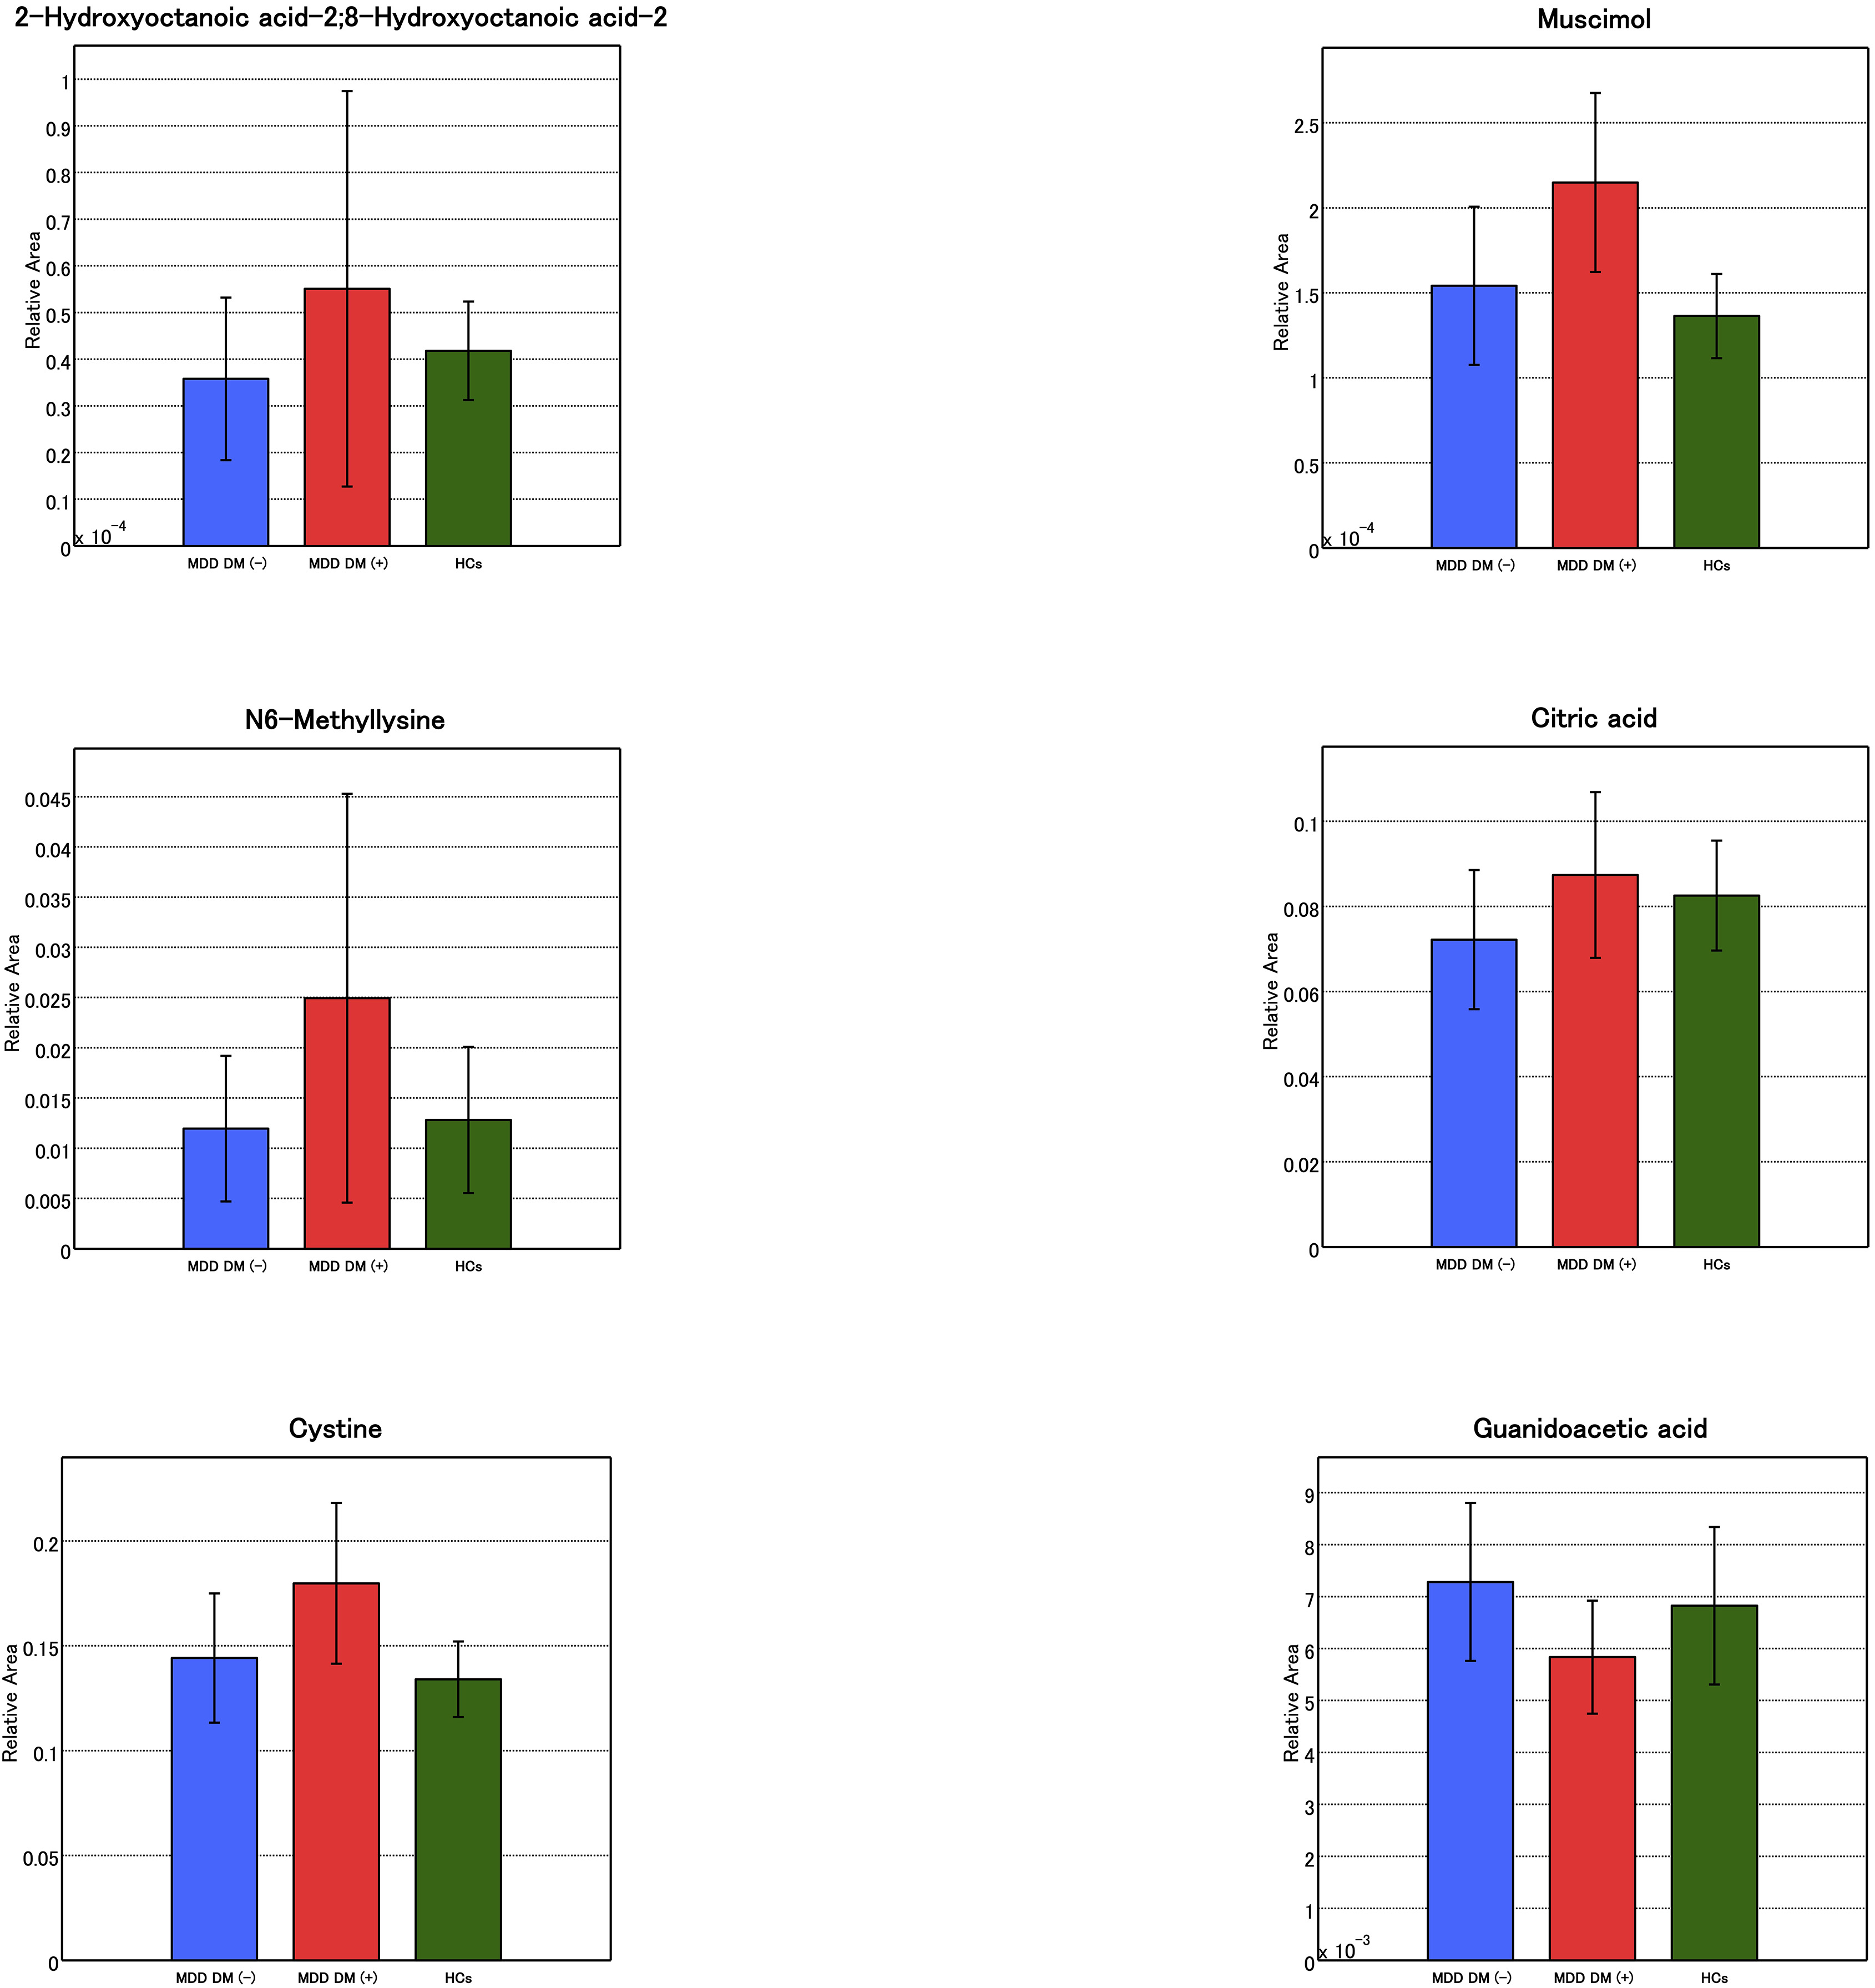 Fig. 7.
Candidate biomarkers for distinguishing between MDD patients with or without type 2 diabetes mellitus. A bar chart of the candidate biomarker is presented. Those biomarkers not illustrated here have been shown in Fig. 6.
In this study, we performed a metabolomics pathway analysis of serum samples of HCs and patients with MDD with and without type 2 diabetes mellitus. Although we could not make a distinction among the three groups using PCA method (Fig. 1), the three groups were distinguished separated using naive PLS method (Fig. 2). We further broadly identified major pathways with positive and negative association (Fig. 4) and the pathway impact for individual metabolites (Fig. 5). We also calculated sensitivity and specificity for each component of the pathway using ROC curve analysis (Table 5).
There is considerable evidence that the pathophysiology of MDD and diabetes mellitus overlaps [1]. One previous study utilized plasma metabolomics to distinguish patients with MDD and HCs [28]. Key metabolites such as amino acids, lipid/protein complexes, and some molecules related to lipid metabolism and energy metabolism contributed to discriminating between the two groups [28]. On the other hand, metabolite changes in amino acids, including branched-chain amino acids, their derivatives and aromatic amino acids, have been reported ahead of type 2 diabetes manifestation [12]. Our finding provides further insight into the metabolomic similarity and difference between patients with and without type 2 diabetes mellitus in the patients with MDD.
Energy conversion by the TCA cycle (fatty acid catabolism and branched chain amino acid metabolism) represented the highest proportion of the top 30 factor loadings characterizing the first principal component in naive PLS. The TCA cycle is a biochemical reaction circuit associated with aerobic metabolism. Acetyl-coenzyme A produced by the glycolysis and beta-oxidation of fatty acids is oxidized to produce nicotinamide adenine dinucleotide, which is used in the electron transfer system to enable efficient energy production. Glycolysis/gluconeogenesis and TCA cycle metabolites have been associated with type 2 diabetes mellitus in previous studies [29]. In one study, rodents exhibited depression-like behaviors when the TCA circuit was impaired by chronic stress [30]. These findings indicate that the metabolic balance, including fatty acid catabolism and branched chain amino acid metabolism, seems to be important in the TCA cycle, and can be partially associated with the pathophysiology of MDD. We, however, could not explain the results from only this pathway analysis according to presence or absence of type 2 diabetes mellitus. In pathway impact [21] for each of the metabolites, synthesis and degradation of ketone bodies was found to have a high impact on MDD with type 2 diabetes, whereas taurine and hypotaurine were associated with MDD without type 2 diabetes mellitus. According to the distinction between groups in naive PLS method and different pathway impact of individual metabolites, the presence or absence of concomitant type 2 diabetes mellitus may alter the metabolic pathways of MDD. Although this study cannot conclude that the presence or absence of type 2 diabetes is responsible for metabolic changes in patients with MDD, this exploratory study may provide an elementary basis and shed light on the influence of type 2 diabetes on pathophysiology of MDD. In addition, negative correlations were observed between alanine or N-Acetylglucosamine 6-phosphate, and imipramine equivalence of antidepressants dose in MDD patients. This indicates that these metabolites could be influenced by treatment with antidepressants. It must be considered that several medications, including antidepressants affect metabolomics pathway and alter the metabolites distributions in patients with MDD.
In the present study, we found a panel of biomarkers consisting of blood metabolites that could discriminate between MDD with type 2 diabetes and MDD without type 2 diabetes. Serum muscimol showed the highest area under the curve; however, this is not an endogenous metabolite and should therefore be excluded from the biomarker candidates. Similarly, metformin, which is of drug origin should also be excluded. Among those with MDD with and without type 2 diabetes mellites, HbA1c, which is a known biomarker, was the most discriminatory variable compared to any other single metabolite. This suggests that in this study for a single metabolite, no other biomarker was more discriminatory of the main etiology of MDD with and without type 2 diabetes than blood HbA1c levels. The role for candidate biomarkers of MDD with type 2 diabetes and without type 2 diabetes mellitus remained undiscovered in this study, which must be elucidated in future studies.
This study had several limitations, including the differences in age and BMI between the groups. The small number of cases, especially in the HCs group, was also a major limitation, as MDD and diabetes are not considered to have a single cause and the pathology is complicated. Although we explored pathways for top positive and negative 30 metabolites factor loadings (60 metabolites in total), there was no specific index for these numbers. Metabolomic changes in two patients with MDD without diabetes mellitus varied considerably, while two had low BMI and were underweight, but the definite reasons for this are unclear because age and BMI factor loading was small (Table 3). This may suggest diversity in MDD. We collected non-fasting blood sample. Drugs can influence metabolites, specifically alanine and N-Acetylglucosamine 6-phosphate. Furthermore, we did not compare metabolites between otherwise healthy individuals with type 2 diabetes mellitus and patients with MDD. Thus, it is unclear whether MDD or type 2 diabetes mellitus had a stronger impact on the pathway. Other limitations included a low mean MADRS score among patients with MDD; uneven disease severity in the groups; use of multiple tests, which could cause type one error; and the differences in the numbers of included metabolites in each pathway.
Patterns of serum metabolites could be different among the MDD with type 2 diabetes mellitus, MDD without type 2 diabetes mellitus, and HCs groups. Specifically, comorbid type 2 diabetes mellitus could affect metabolomics pathway and alter the distribution of serum metabolites in patients with MDD. These findings could shed light on the influence of the type 2 diabetes on the pathophysiology of MDD.
ANOVA, analysis of variance; AUC, area under curve; BMI, body mass index; CE-FTMS, capillary electrophoresis coupled with Fourier transform mass spectrometry; CI, confidence interval; DM, diabetes mellitus; GABA, gamma-aminobutyric acid; HbA1c, hemoglobin A1c; HCs, healthy controls; KEGG, Kyoto Encyclopedia of Genes and Genomes; MDD, major depressive disorder; MADRS, Montgomery Asberg Depression Rating Scale; PCA, principal component analysis; PLS, partial least squares discriminant analysis; ROC, receiver operating characteristic; RNA, ribonucleic acid; TCA, tricarboxylic acid.
NO, TH and RY designed the research study. NO and TH performed the research. AI, TN and RF provided help and advice on data curation. NO and AI analyzed the data. NO, RI, HT and YK wrote the manuscript. YH, MH and RY contributed to writing review, editing and supervisions. All authors contributed to editorial changes in the manuscript. All authors read and approved the final manuscript.
This study was conducted in accordance with the Declaration of Helsinki, and the protocol was approved by the Ethics Committee of University of Occupational and Environmental Health, Kitakyushu, Japan (20 July 2018; UOHECRB21-057). Informed consent was obtained from all subjects involved in the study.
We would like to thank Human Metabolome Technologies Inc. (HMT; Tsuruoka, Japan) for their help with the analysis of the samples and statistical analysis.
This research was funded in part by Ministry of Health, Labor, and Welfare of Japan, grant number 18K07576.
The authors declare no conflict of interest.
References
Publisher’s Note: IMR Press stays neutral with regard to jurisdictional claims in published maps and institutional affiliations.