


1 Department of Pharmacology, School of Pharmaceutical Science, Ohu University, 963-8611 Fukushima, Japan
2 Department of Cellular Pathology, Institute for Developmental Research, Aichi Developmental Disability Center, 480-0392 Aichi, Japan
Academic Editor: Drozdstoy Stoyanov
Abstract
Background: High salt intake increases the active coping behavior during psychological stress. Acute fear-related severe stress enhances passive coping behavior during subsequent inescapable stress. Methods: We investigated the effect of high salt intake (2%) for 5 consecutive days on the coping behavior in C57BL6 mice which employing the tail suspension test (TST) at 1 h after the exposure to inescapable innate fear using 2,5-dihydro-2,4,5-trimethylthiazoline (TMT), a synthetic component of fox feces. By using a different mouse group, to investigated whether anxiety-like behavior was correlated with coping behavior during the TST, we performed the elevated-plus maze (EPM) test at 1 h before the TST without TMT. Results: Both the distance traveled and the number of entries in the central zone of test box during TMT were negatively correlated with freezing time in both sodium- and water-intake mice. Sodium-intake increased the preference for central zone during TMT exposure, but did not change fear sensitivity and locomotor activity. Sodium-intake also prevented that TMT-induced increase in the immobility time during TST. The immobility time during TST was positively correlated with freezing time during TMT exposure in sodium-intake, but not in water-intake mice. Furthermore, the immobility time during TST in sodium-intake mice correlated with the distance traveled and with the number of entries in the central zone during TMT. Sodium intake also increased the number of entries and the time spent in the open arm of the EPM, indicating that high salt intake had an anxiolytic effect. However, neither the number of entries nor the time spent in the open arm of the EPM were correlated with immobility time during TST in sodium-intake mice. Conclusions: We conclude that a high salt intake induces active coping behavior after experiencing fear stress by enhancing stress resilience rather than by reducing the anxiety level.
Keywords
- active coping behavior
- anxiety
- high salt intake
- inescapable innate fear stress
- stress resilience
Excessive salt intake, particularly of sodium, is thought to increase the risk of developing disease, e.g., hypertension [1], stroke [2] and renal disease [3], those are due to an increase in the sympathetic nerve activity by the physiological osmotic stress [4]. In addition, high salt intake also increases the risk of gastric cancer by shifting mucin production from glandular to surface mucous cells [5]. There is also disagreement regarding the role of high salt intake on psychiatric diseases, such as depression and anxiety, which are frequently comorbid with cardiovascular diseases [6, 7]. Moreover, high dietary salt intake promotes neuroinflammation in the stress-associated brain regions and increases behavioral hyperresponsivity to acute psychological stress in mice [8]. In consistent, high salt intake has been suggested to increase the stress responsivity and contributes to the development of stress-related psychiatric disorders in humans [9]. However, it has also been suggested that restricted salt intake in patients with cardiovascular disease might be associated with mental distress [10]. High dietary sodium intake and depression show a consistent inverse relation [11]. In humans, dysregulation of the hypothalamic–pituitary–adrenal (HPA) axis is induced by excessive secretion of cortisol and this is thought to be a risk for major depressive disorders [12, 13]. Because antidepressants have been shown to improve HPA axis activity [14, 15], HPA axis is a target for therapy of major depressive disorders [16, 17]. A 5-day salt loading period in mice reduced the expression of corticotropin-releasing hormone (CRH) in the paraventricular nucleus of the hypothalamus (PVN) and decreased the plasma corticosterone level during the recovery period of restrained stress [18]. In addition, excess sodium causes hypernatremia, promotes anxiolysis, and attenuates stress-induced activation of the HPA axis in mice [19]. Therefore, the role of high salt intake on the mental disease is still controversial.
Accumulating evidence has shown that high salt intake increases active coping behavior against acute stress in rodents, by promoting neuronal inflammation [8, 20]. Resilience to stress-promoted helplessness is associated with an active coping style [21]. Mice that exhibit active coping behaviors against stressors have lower glucocorticoid responses than those with more passive coping responses [22]. Stress exposure is an independent risk factor for psychiatric disorders such as depression [23] and posttraumatic stress disorder (PTSD) [24, 25]. One factor that may be related to differential resilience or vulnerability to stress is the type of strategy used to cope with the stressor, i.e., active or passive coping [26]. Active coping is related to resiliency to stress and is defined as a behavioral response that minimizes the physical, psychological or social harm of a situation [26]. Resilience is defined as the dynamic ability to adapt successfully in the face of adversity, trauma, or significant threat. It is a complex psychobiological process that protects individuals from developing PTSD or from experiencing other negative consequences of exposure to extreme stress, including depression [27, 28].
It has been demonstrated that a moderate level of electrical shock induced the shorter immobility time in untreated male rat. However, it has also been demonstrated that the severe level of fear induced by electrical shocks induced the longer immobility time during forced swimming test (FST), followed by a surge in plasma corticosterone level, thereby affecting their coping behavior against subsequent inescapable stress [29]. Reduced CRH expression in the PVN and increased the corticosterone level have been observed during recovery from exposure to restraint stress. Discordant results have been reported for plasma osmolality following intake of the same sodium concentration. Krause et al. [18] found that 2% sodium intake for 5 consecutive days significantly increased the plasma sodium concentration, whereas Mitchell et al. [20] showed that 2% sodium intake for 7 consecutive days did not alter the plasma sodium concentration. According to these reports, we hypothesized that subjecting the mice to fear-related stress before the aversive stress may clarify whether the high salt intake could affect their hypersensitivity or resilience by enhancing active coping with acute stress. Predator odor stress inoculation can be used as an effective training method to improve the active response to subsequent severe stress [30]. The immobility induced by exposure to an inescapable aversive situation such as a tail suspension test (TST), serves as an indicator of resignation of escape behavior from the aversive environment [31, 32]. Therefore, in the present study, we investigated the effect of 2% sodium intake for 5 consecutive days on the coping behavior of mice during the TST as a subsequent aversive situation which was performed 1 h after exposure to an inescapable innate fear by 2,5-dihydro-2,4,5-trimethylthiazoline (TMT), a synthetic component of fox feces used as a preceding severe fear-related stress.
Sex hormones such as estradiol and oxytocin have been suggested to contribute to affective illness [33, 34]. The most consistent sex difference reported for affective disorders is the two-fold higher lifetime prevalence of major depression (MDD) in women compared with men [35, 36]. It has been suggested that oxytocin is highly expressed within a subset of hypothalamic neurons and is anxiolytic and promotes resilience to stress [37]. In addition, estrogen has been suggested to influence body fluid homeostasis [38]. In order to focus on the effect of hypernatremia on coping behavior, only male mice were used in this study, thus excluding gender-related factors that might affect behavior during aversive and fear stress.
Adult male C57BL/6J mice (8–12 weeks old) were supplied by Charles River
Laboratories (Yokohama, Japan) and CLEA Japan (Tokyo, Japan). All mice were
housed at 25
A total of 47 male C57BL/6J mice (8–12 weeks old) were used for the TMT-induced
inescapable innate fear test (26 mice), with mineral oil (MO) used as the control
(21 mice). All mouse were habituated to the arena of the TMT test box for 15 min
one day prior to the test. Each mouse was placed in the center of an acrylic
plastic open field box arena (W: 294 mm
To evaluate the avoidance response to TMT, the mean time an individual mouse spent in the non-TMT diagonal side of the arena was compared with the time it spent in the TMT side [39]. The TMT stress-elicited freezing behavior was used as a measure of fear and was defined as the absence of any movement, except for those necessary for breathing [40]. The percentage of time spent in freezing was calculated for each mouse during the 10 min period after TMT was added to the filter paper in the corner of the box. Freezing time was analyzed every min (1 min/bin) or in two 5-min blocks (the first at 5–10 min and the second at 10–15 min).
All TSTs were performed during the light phase (12:00–16:00) of the light–dark cycle. Each mouse was individually suspended by its tail using adhesive tape placed approximately 2 cm from the tip of the tail and via two hanging hooks connected to the ceiling of the test box, which was located 42 cm above the bench top. Each mouse was suspended for 10 min and recorded with a digital video camera in the absence of an investigator. Another investigator, who did not perform the experiment measured the immobility time during the TST. This was performed after completion of the experiments and using ANY-maze software. The investigators were thus blinded to the allocated groupings. Mobility was defined as movement of the hind legs and/or other escape-oriented behaviors, including twisting of the body, but not breathing Mouse immobility was considered to represent the immobility time in this paradigm. Mice with a 2% NaCl intake that spent a shorter time immobile compared to those with water intake without escape-oriented behaviors were considered to demonstrate active coping behavior. The duration of immobility was calculated as the sum of the time periods during which the mouse was motionless for at least 2 s. Immobile behavior sensitivity was set to 70%, and the mouse needed to be immobile for 1 s to initiate scoring of immobility. Mice were returned to their home cages at the completion of the TST [41, 42]. To provide an index of learned despair, 10 min of the test session was divided into two periods, the initial 5 min (0–5 min) and the final 5 min (5–10 min) [41, 43], in addition, the immobility time for 5 min from 1 to 6 min during TST were also analyzed for evaluating the level of the behavioral despair [44].
A total of 21 male C57BL/6J mice (8–12 weeks old) were used for elevated plus
maze (EPM). EPM is a reliable measurement instrument for anxiety-like behavior in
animals and is used to evaluate emotionality in rodents [45]. The apparatus is
comprised of two open arms (300
The Student’s t-test was used for comparisons between two groups.
Two-way repeated measures analysis of variance (ANOVA) was followed by one- or
two-way ANOVA to analyze each time block. This was followed by the Bonferroni
post-hoc test for comparison of the groups. The correlation coefficient was
analyzed by Pearson’s correlation test, and Spearman’s rank correlation
coefficient analysis was performed to determine whether two variables were
significantly correlated. Fisher z-transformation was performed to test
the difference between two Pearson’s correlation coefficients. Statistical
analyses were performed using EZR (Easy R) software [47] (version 1.38; Saitama
Medical Center, Jichi Medical University, Saitama, Japan) and BellCurve software
(version 3.20, Social Survey Research Information Co., Ltd., Tokyo, Japan) [48].
All data in the bars indicate the mean
To investigate whether the 2% NaCl intake for 5 days affected the mice’s innate
fear sensitivity against TMT, we measured the percentage of freezing time before
and during TMT exposure for 5 and 10 min, respectively. Two-way repeated measures
ANOVA (NaCl
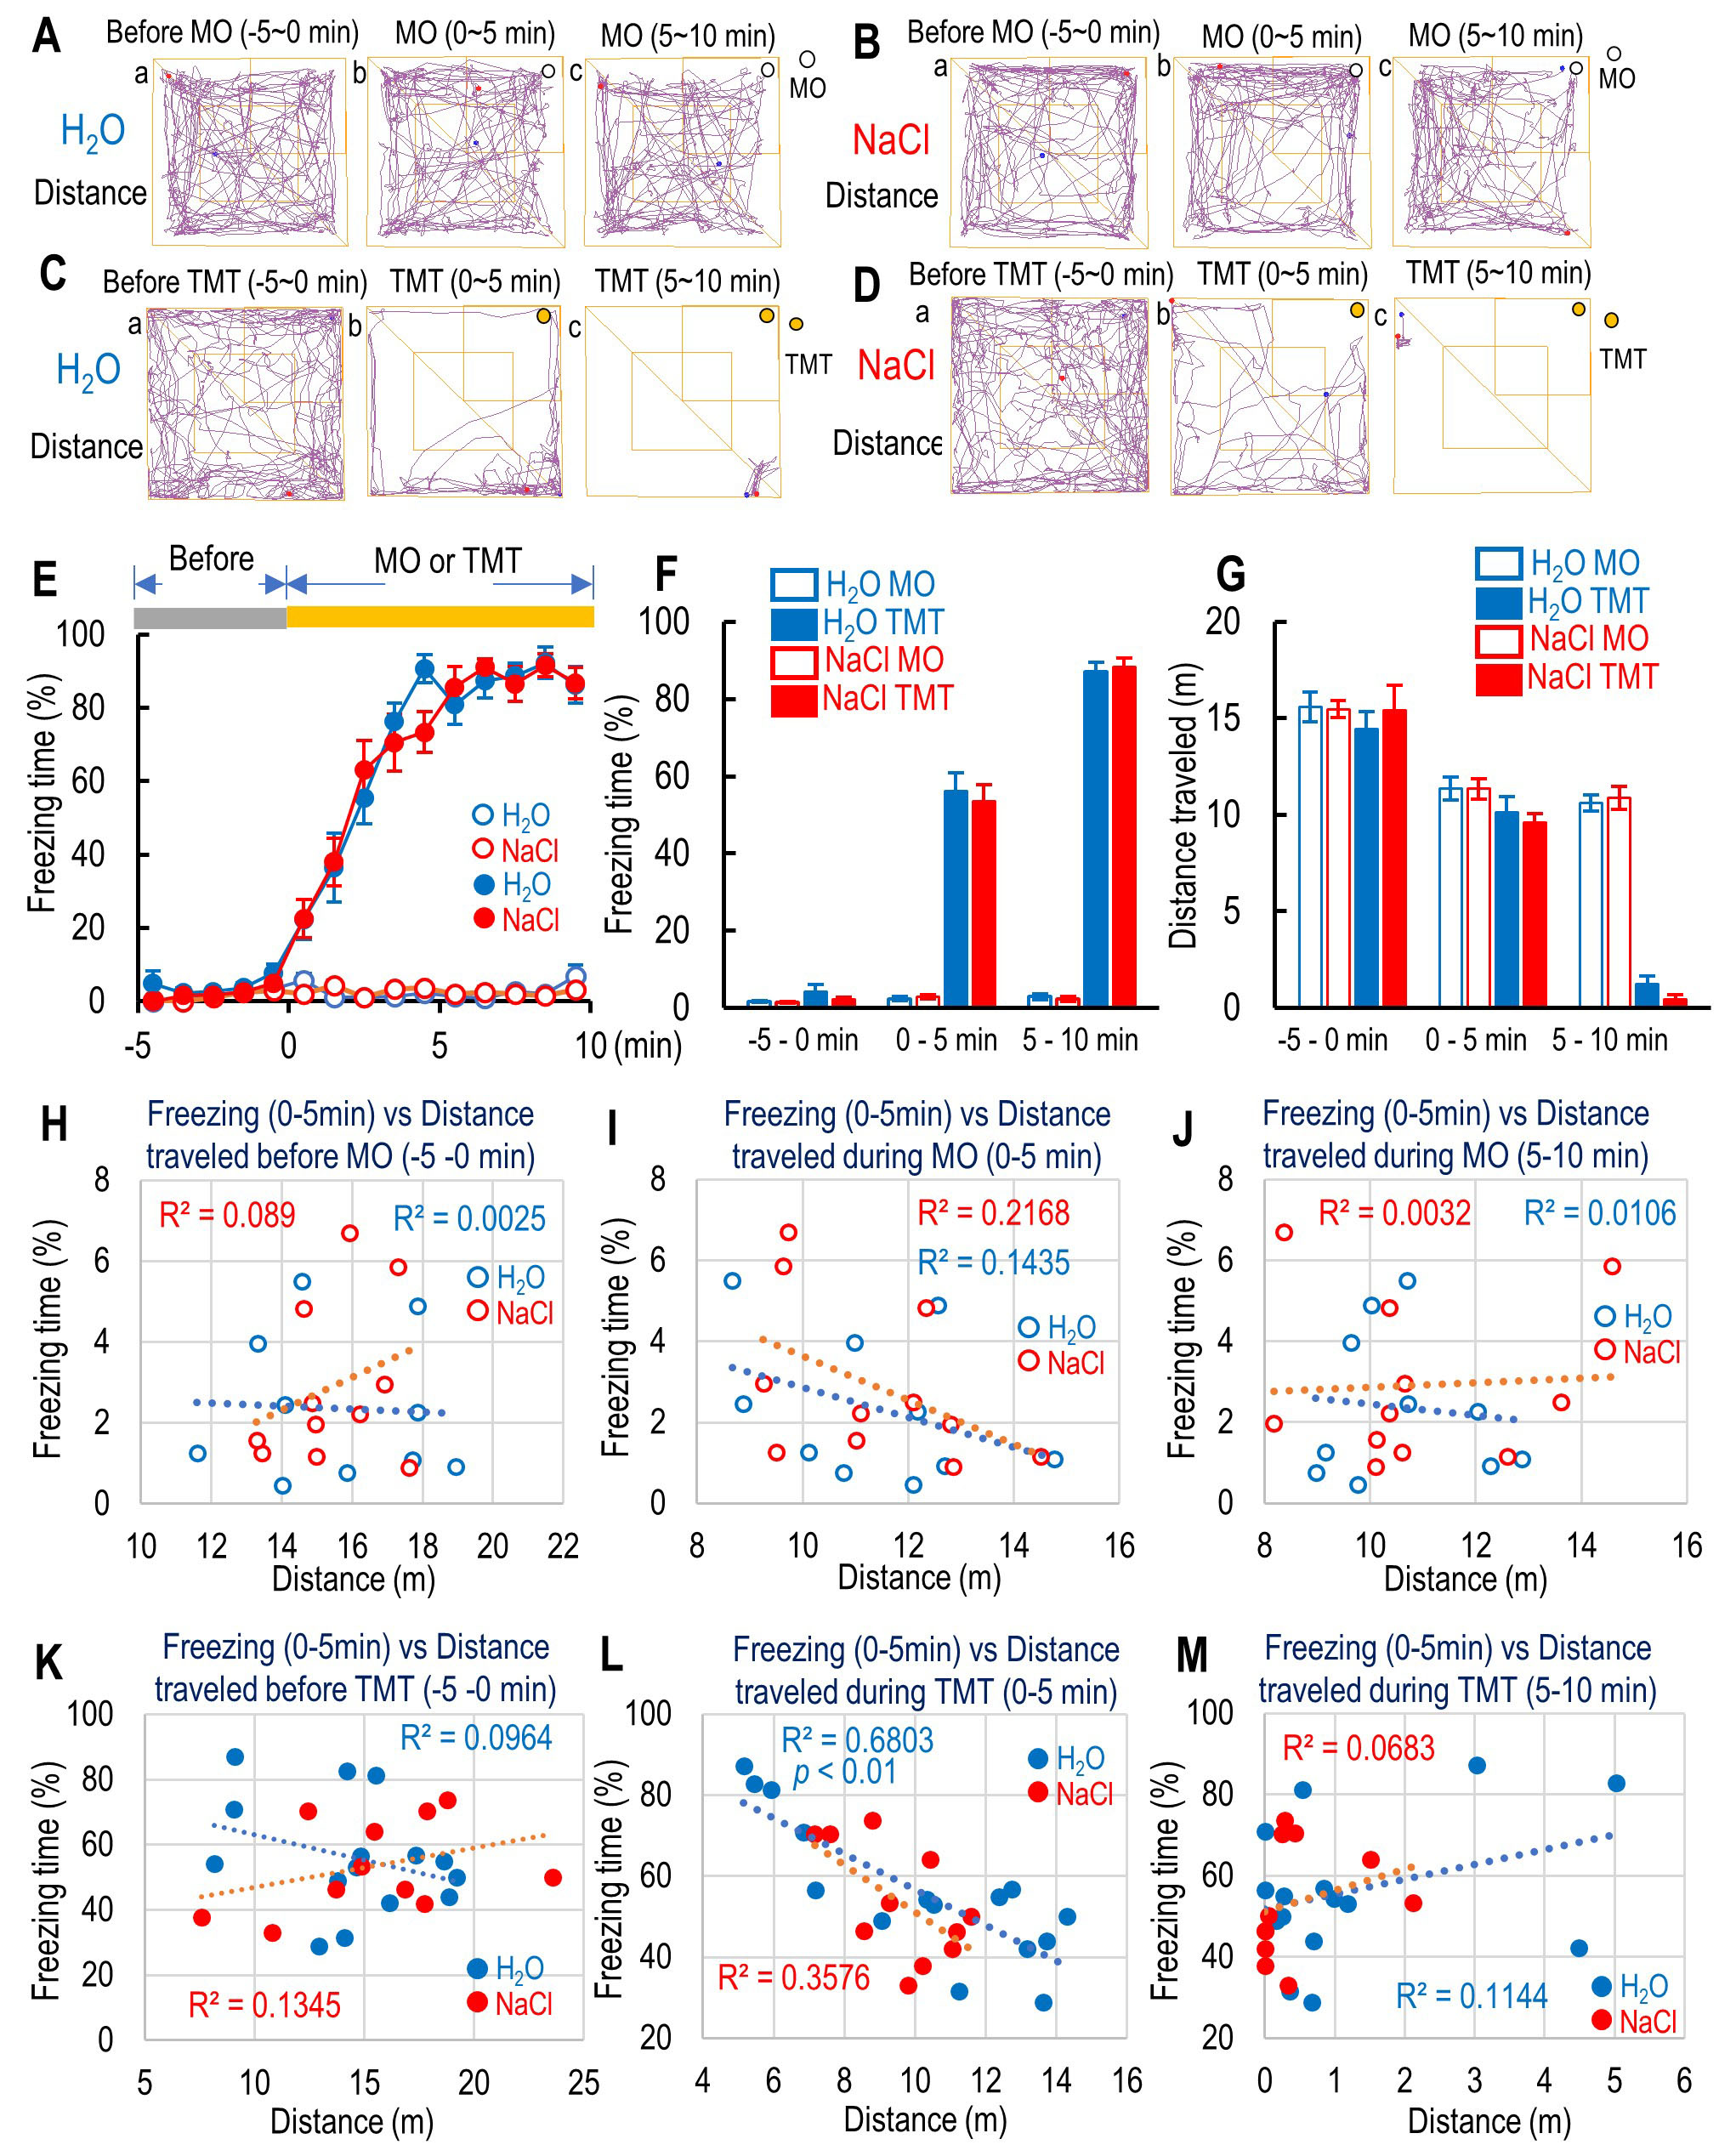 Fig. 1.
Effect of 2,5-dihydro-2,4,5-trimethylthiazoline (TMT) on the
freezing behavior and the distance traveled in the test box. (A–D) Traces of
mice moving in the box during the test under the mineral oil (MO) as a control.
Traces of mice moving in the box for 5 min before (a: –5–0 min), the first 5
min (b: 0–5 min), and the second 5 min (c: 5–10 min) during MO exposure for
H
During the TMT exposure, sodium-intake mice exhibited preference for the central
zone in the test box compared to water-intake mice, although the preference of
the central zone in sodium-intake mice were similar level with water-intake mice.
Two-way repeated measures ANOVA revealed that the distance traveled, the time
spent, and the number of entries in the central zone were affected by TMT
exposure (distance traveled in the central zone: F(3, 140) = 31.19,
p = 7.20
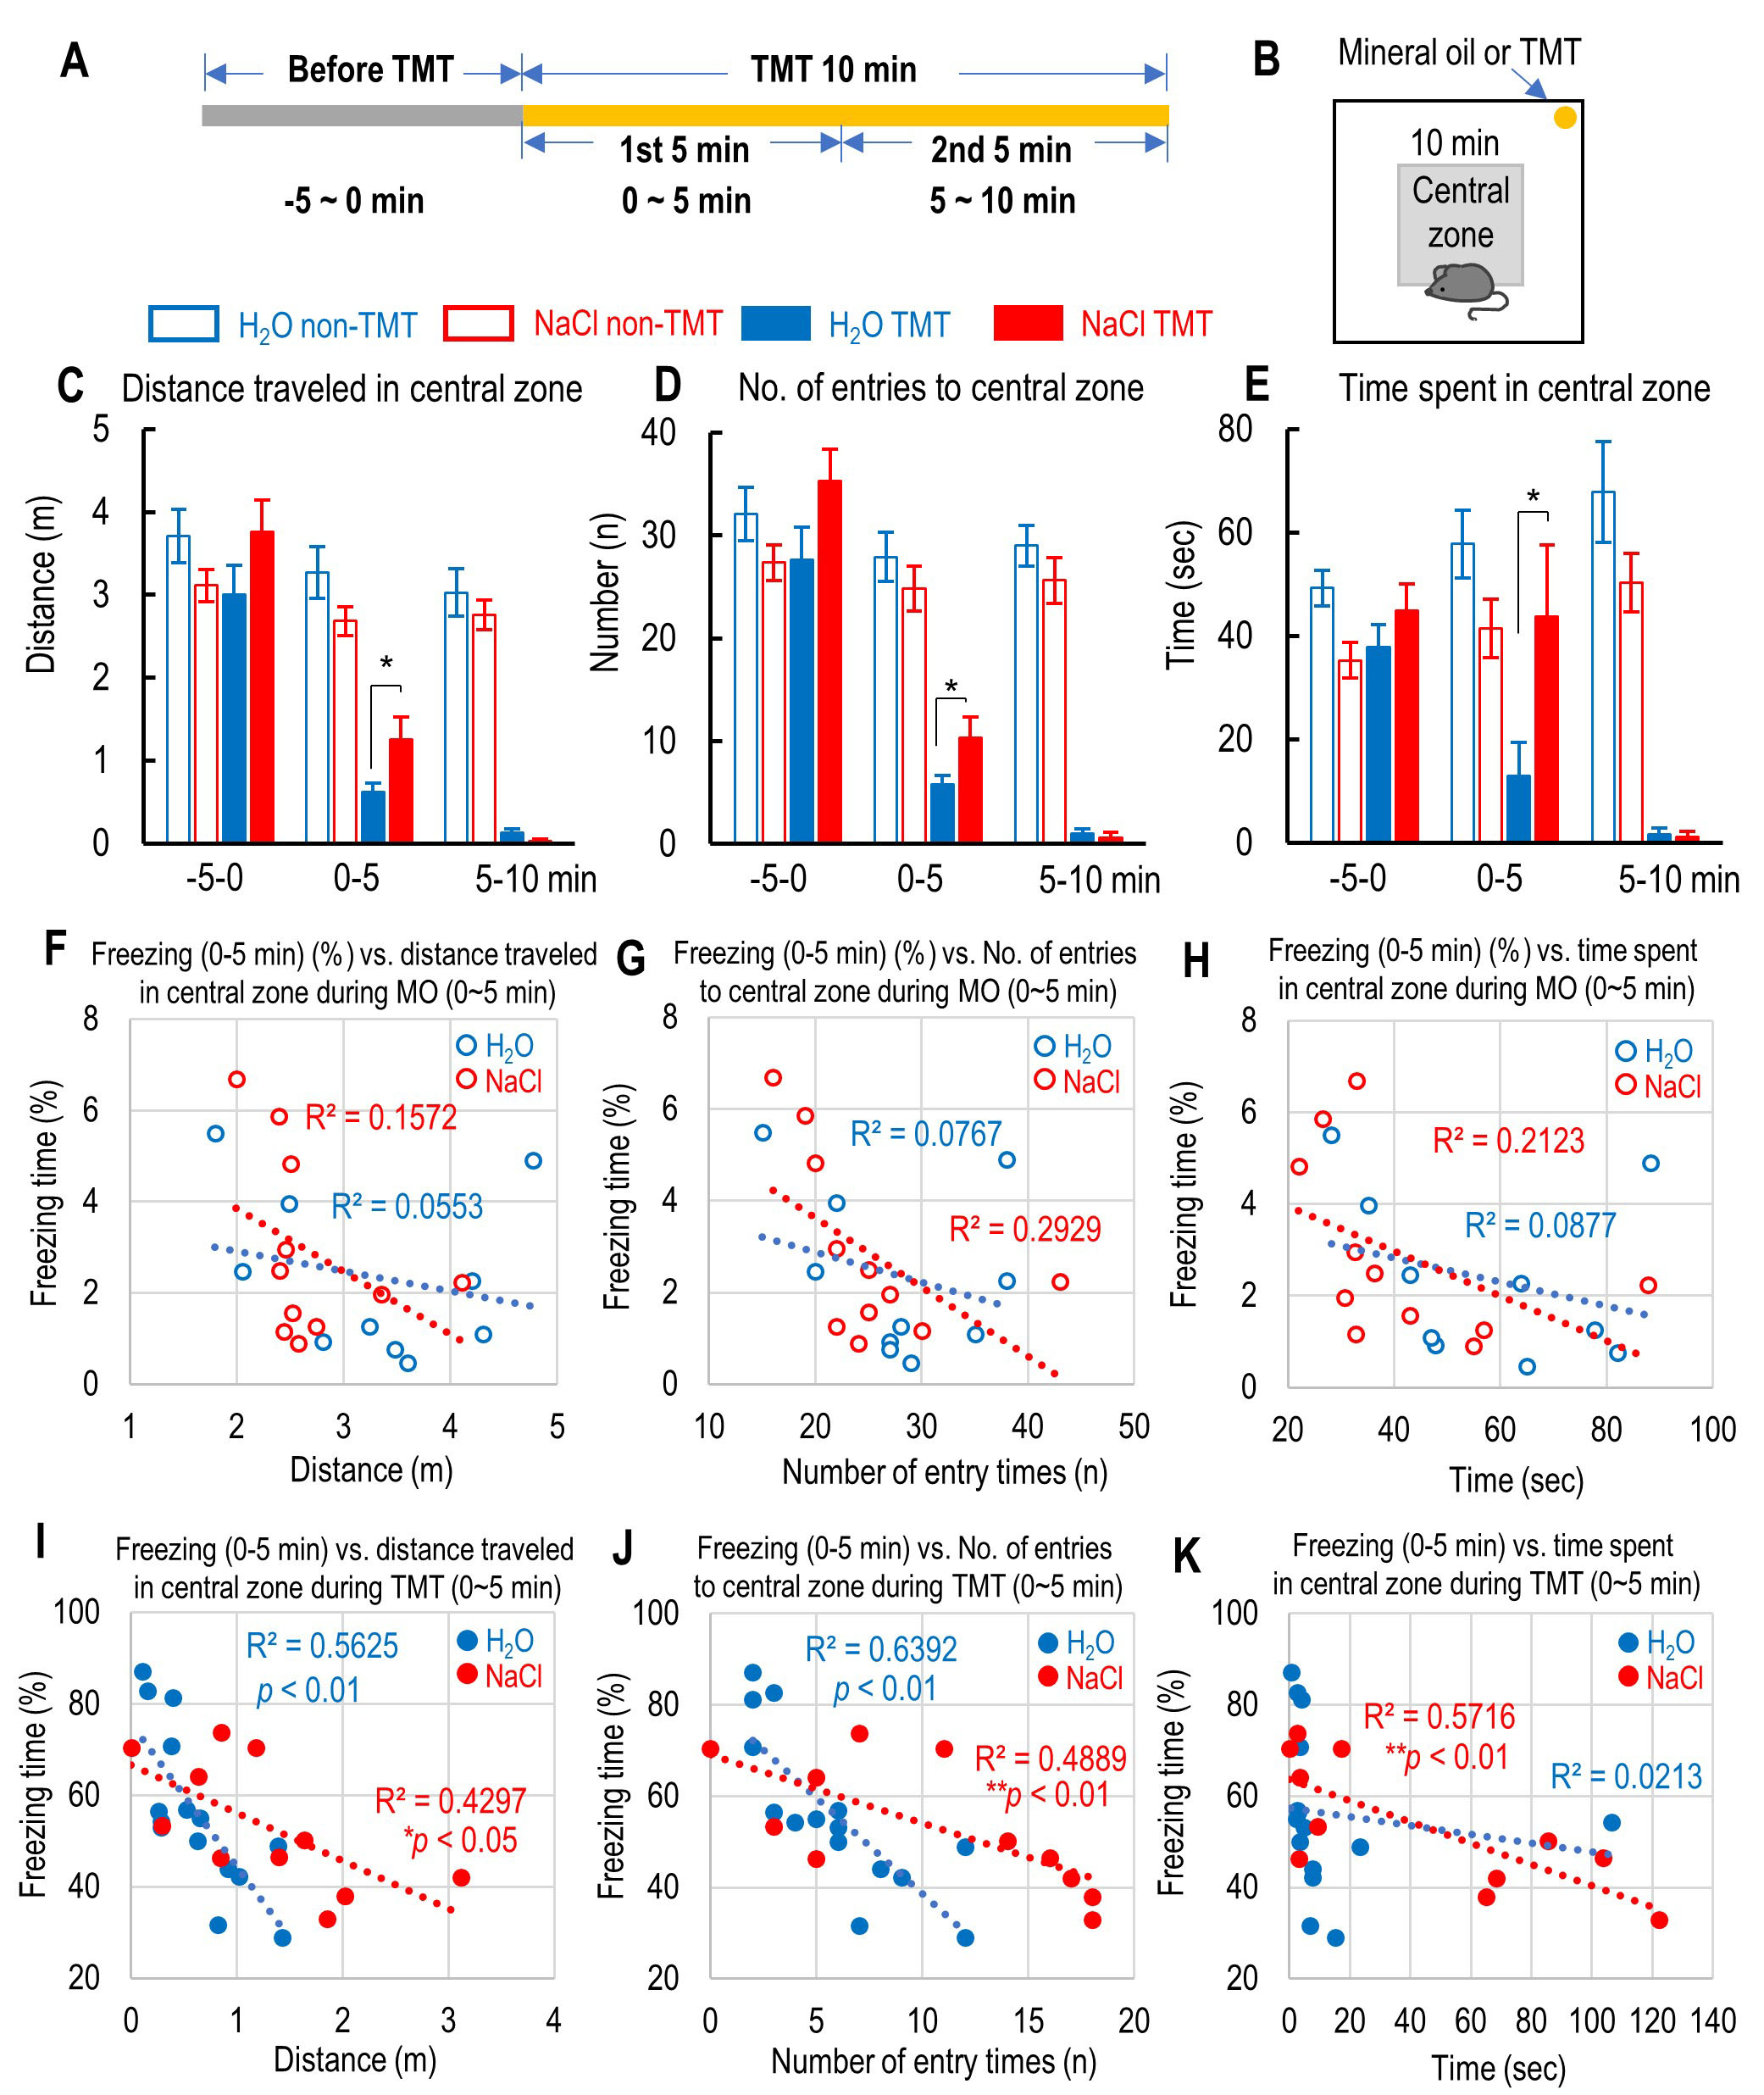 Fig. 2.
The effect of 2% NaCl intake on the central preference and the
correlation between freezing time and the central preference during inescapable
innate fear caused by 2,5-dihydro-2,4,5-trimethylthiazoline (TMT) exposure. (A)
Schedule of the time course before and during the first and second 5 min of TMT
exposure. (B) The location of the central zone and mineral oil (MO) or TMT in the
test box. (C–E) Distance traveled (C), number of entries (D), and time spent (E)
in the central zone in the test box before and during the first and second 5 min
of MO or TMT exposure. (F–H) Correlation between the percent of freezing time
during the first 5 min of MO exposure and the distance traveled (F), number of
entries (G), and time spent (H) in the central zone in the test box for both
water- and sodium-intake mice. (I–K) Correlation between the percent of freezing
time during the first 5 min of TMT exposure and the distance traveled (I), number
of entries (J), and time spent (K) in the central zone in the test box for both
water- and sodium-intake mice. All the data are mean
We next investigated whether the NaCl intake affected mice’s active coping
behavior during the TST as an aversive situation for the mice. The immobility
time during TST in each group gradually increased, and the two-way repeated
measures ANOVA revealed that the TMT and NaCl affected the immobility time during
TST (F(3, 469) = 10.65, p = 2.31
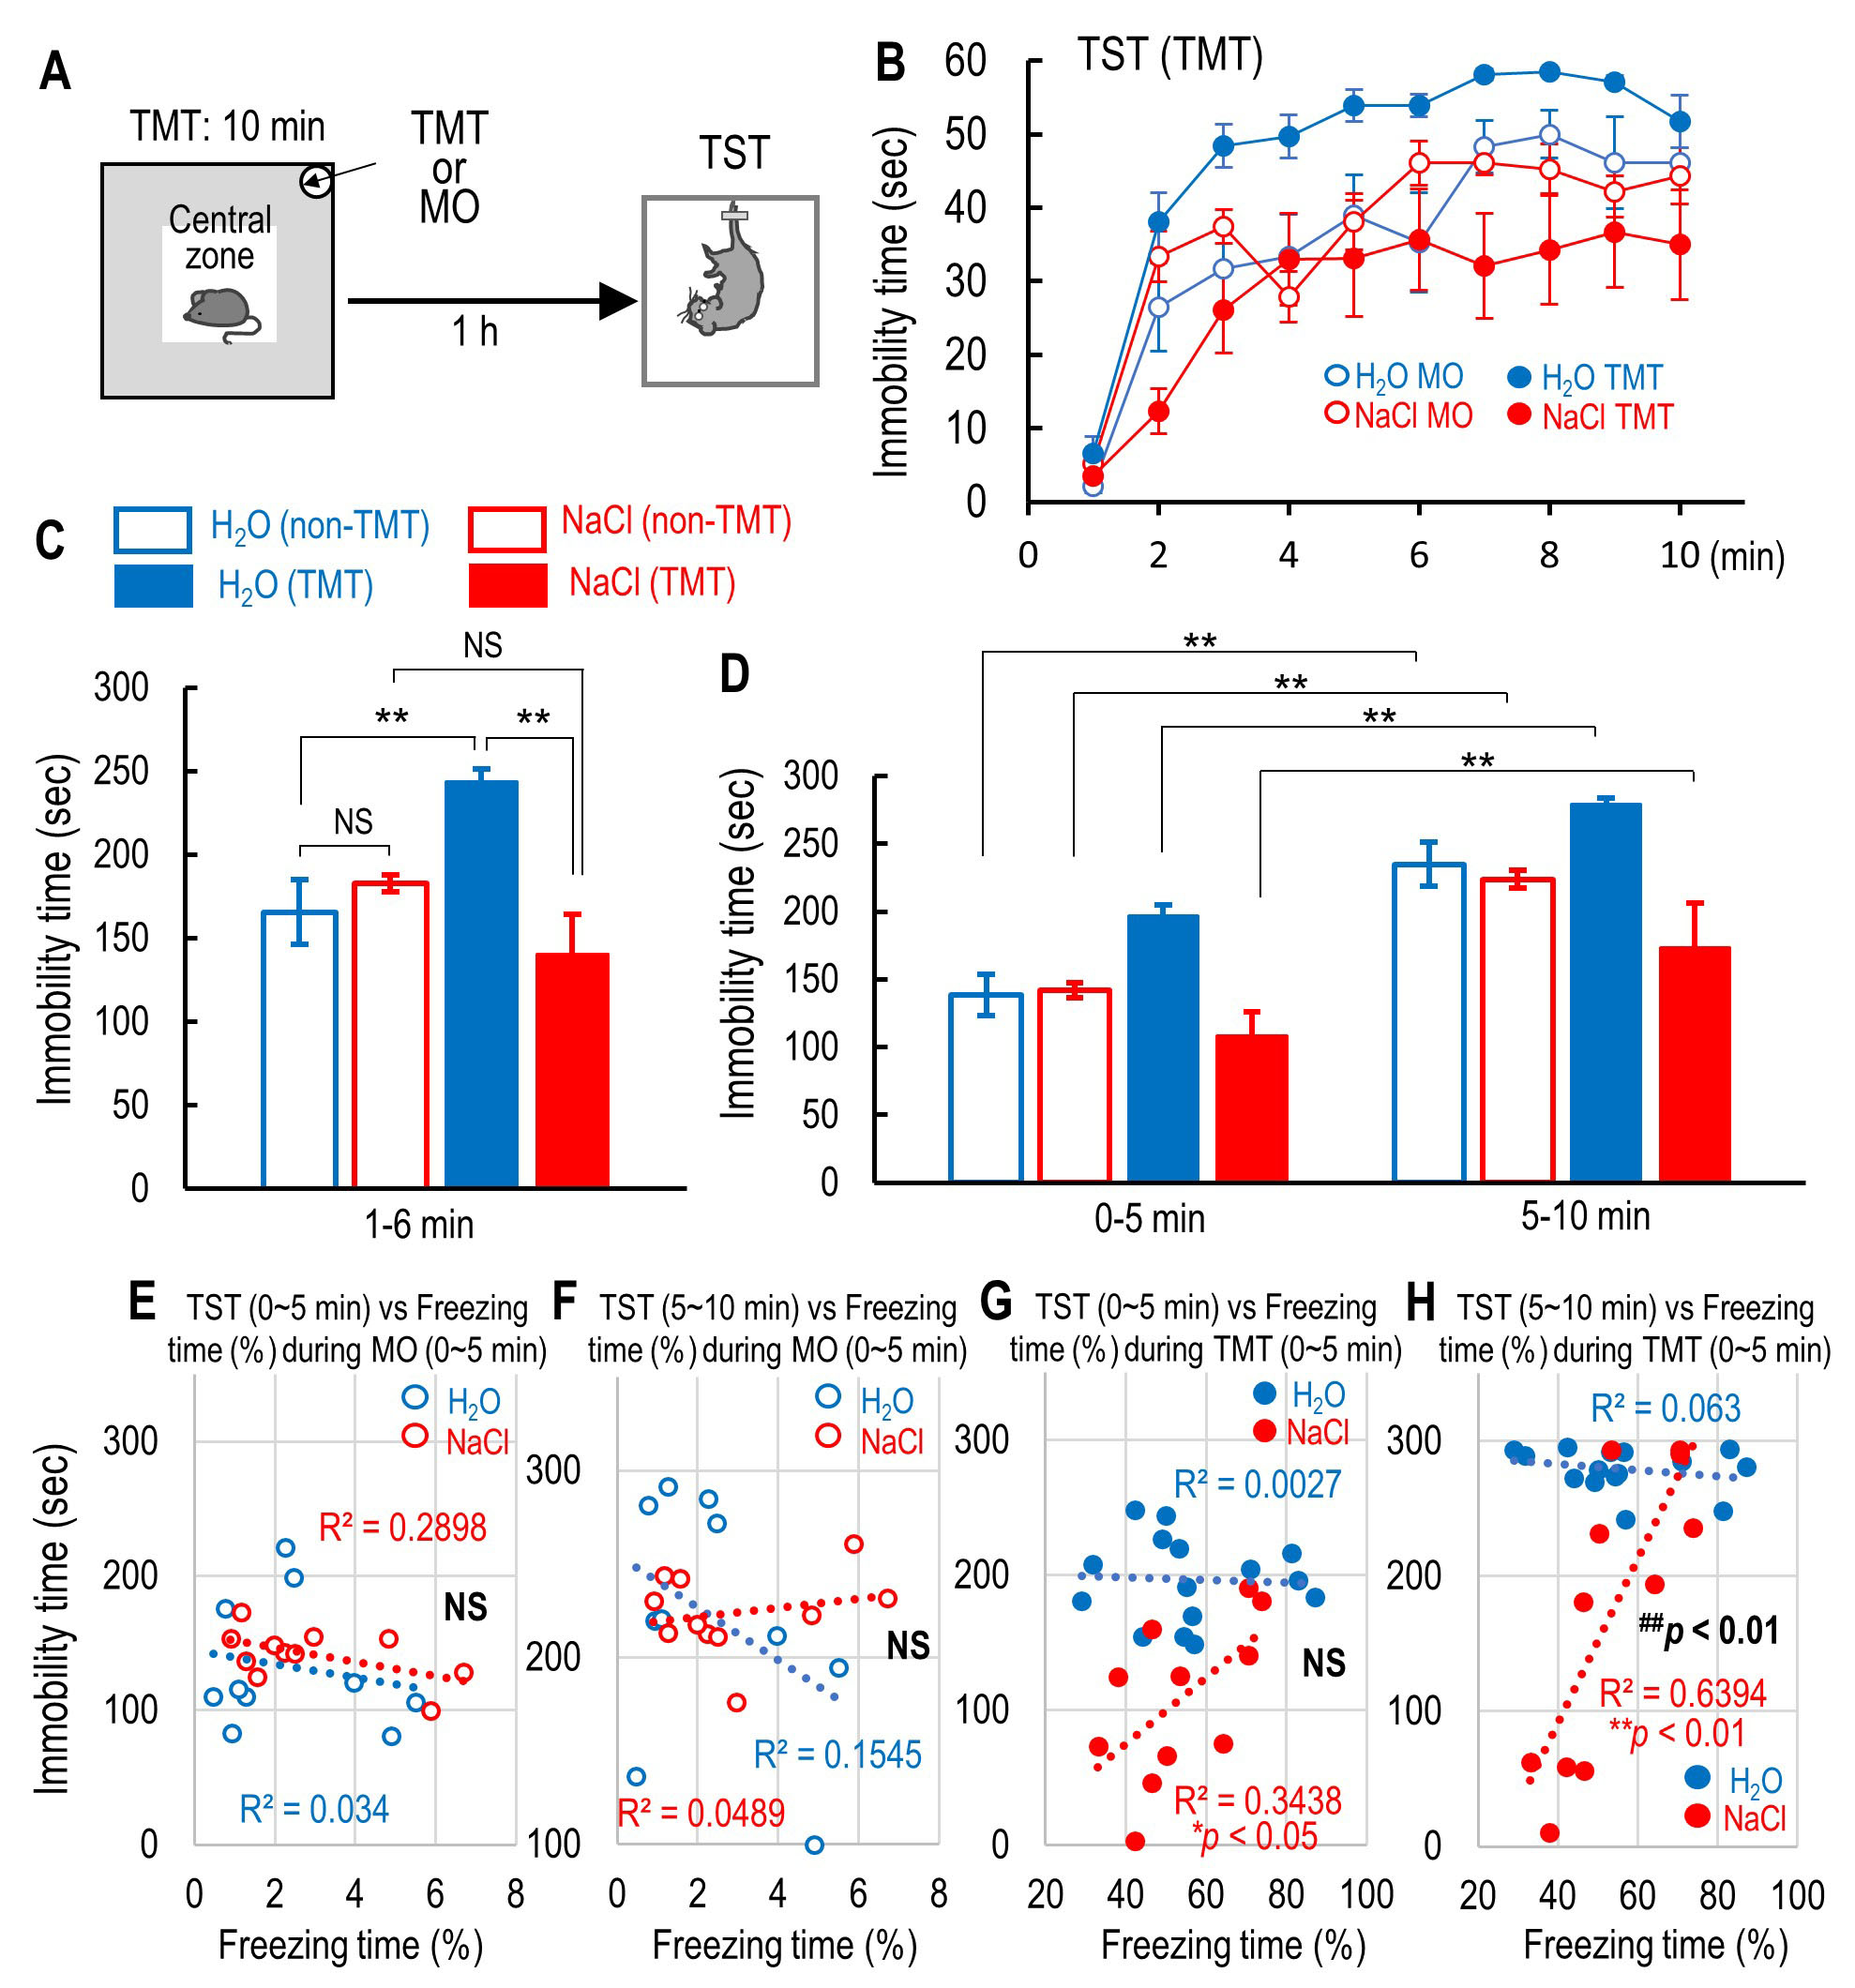 Fig. 3.
The effect of 2% NaCl intake on the immobility time
during tail suspension test (TST) and the correlation between the immobility time
during TST and the freezing time during the first 5 min of mineral oil (MO) or
2,5-dihydro-2,4,5-trimethylthiazoline (TMT) exposure. (A) Schematic drawings
indicate the location of the central zone and the MO or TMT and the schedule of
TST. (B) The time course of immobility time for 10 min of the tail suspension
test (TST) in H
Because the freezing time during the first 5 min of exposure to TMT was
correlated with the central preference, such as distance traveled, the number of
entries, and the time spent in the central zone (Fig. 2I–K), we investigated
whether the immobility time during TST was correlated with the preference of the
central zone during the first 5 min of exposure to TMT to induce innate fear. The
immobility time during both the first and last 5 min of TST in all groups was not
correlated with any preference for the central zone during MO exposure (distance
traveled: H
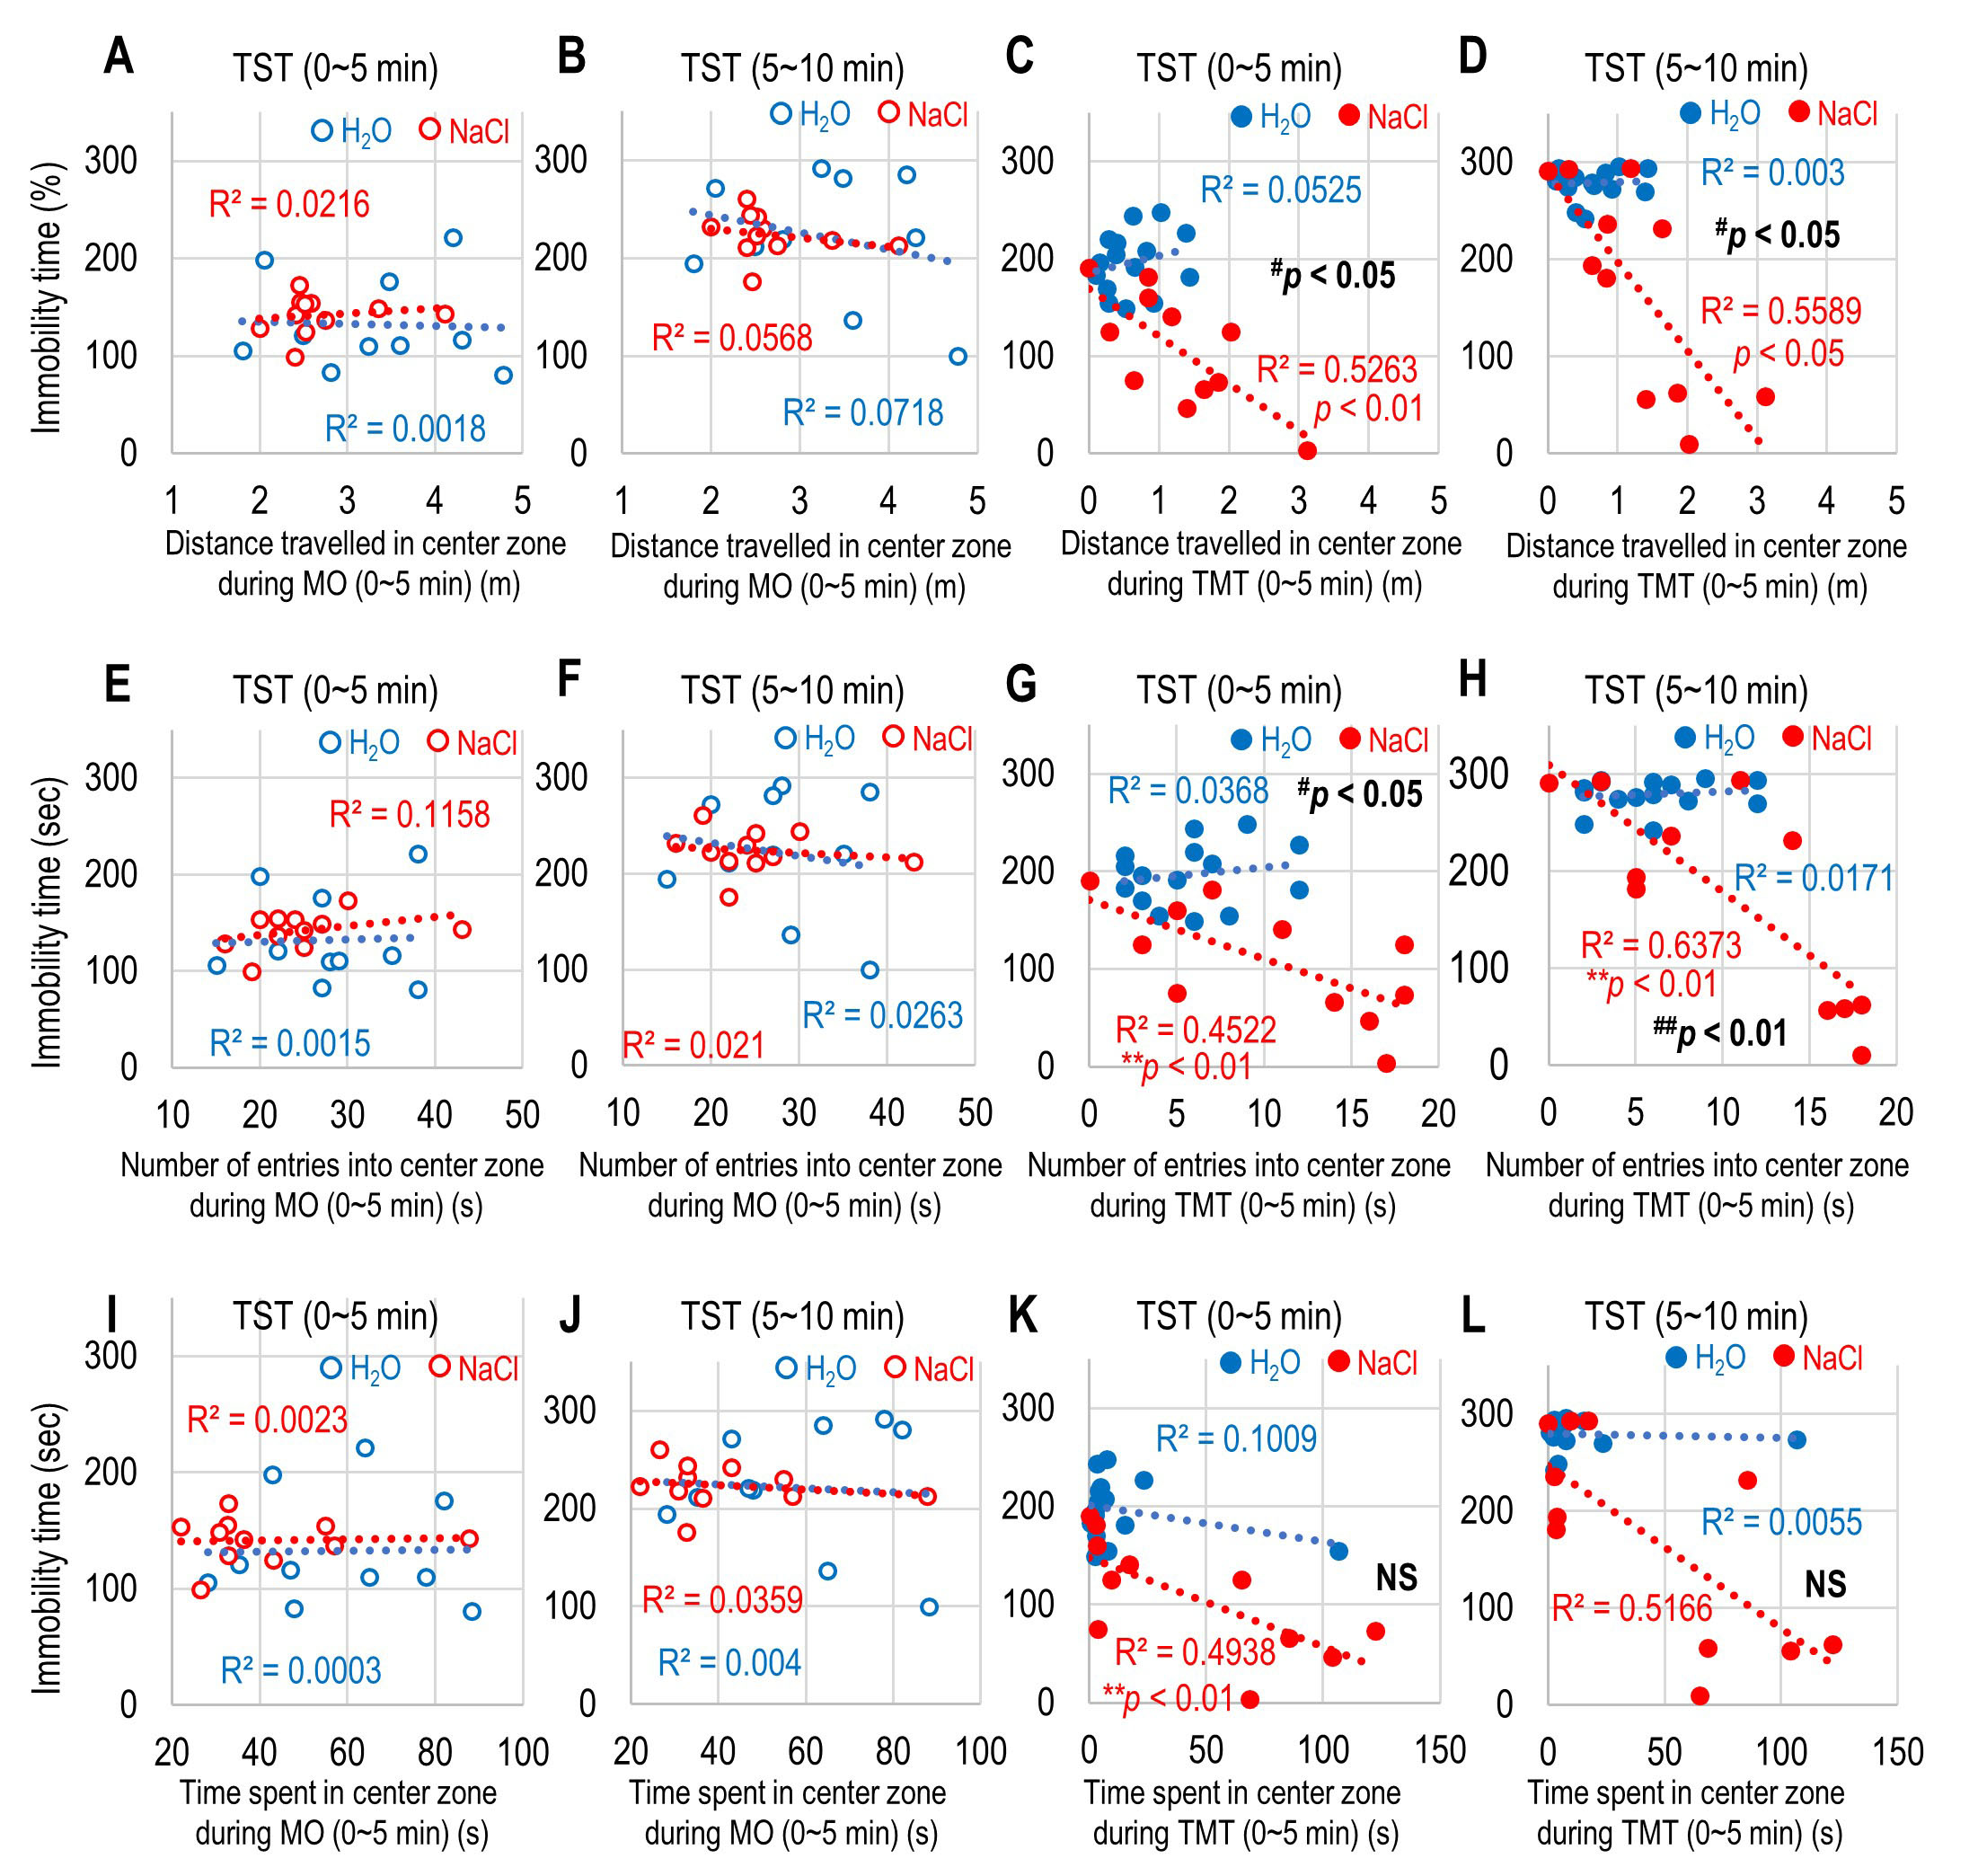 Fig. 4.
Correlation between immobility time and preference of the
central zone during mineral oil (MO) and 2,5-dihydro-2,4,5-trimethylthiazoline
(TMT) exposure. (A–D) Correlation between the distance traveled in the central
zone during the first 5 min of MO and the immobility time during the first 5 min
of tail suspension test (TST) (A), during the first 5 min of MO and the
immobility time during the second 5 min of TST (B), during the first 5 min of TMT
and the immobility time during the first 5 min of TST (C), and during the first 5
min of TMT and the immobility time during the second 5 min of TST (D). (E–H)
Correlation between the number of entries in the central zone during the first 5
min of MO and the immobility time during the first 5 min of TST (E), during the
first 5 min of MO and the immobility time during the second 5 min of TST (F),
during the first 5 min of TMT and the immobility time during the first 5 min of
TST (G), and during the first 5 min of TMT and the immobility time during the
second 5 min of TST (H). (I–L) Correlation between the time spent in the central
zone during the first 5 min of MO and the immobility time during the first 5 min
of TST (I), during the first 5 min of MO and the immobility time during the
second 5 min of TST (J), during the first 5 min of TMT and the immobility time
during the first 5 min of TST (K), and during the first 5 min of TMT and the
immobility time during the second 5 min of TST (L) for H
The sodium-intake mice exhibited a central preference in the test box during the
TMT exposure. It has been suggested that decreased levels of anxiety increase
exploratory behavior in the open field box, while increased anxiety levels result
in less locomotion and staying close to the walls of the open field box for
longer [49, 50], although this is controversial because higher preference of the
central zone does not correlate with anxiety levels in mice. Therefore, we
examined whether NaCl intake affected the anxiety level using the EPM [45, 51]
and whether the NaCl intake produced a correlation between anxiety level and
immobility time during TST. The distance traveled in the open arm in
sodium-intake mice was similar to that of water-intake mice (NaCl-intake
mice; t(17) = 1.4026, p = 0.1787 vs. H
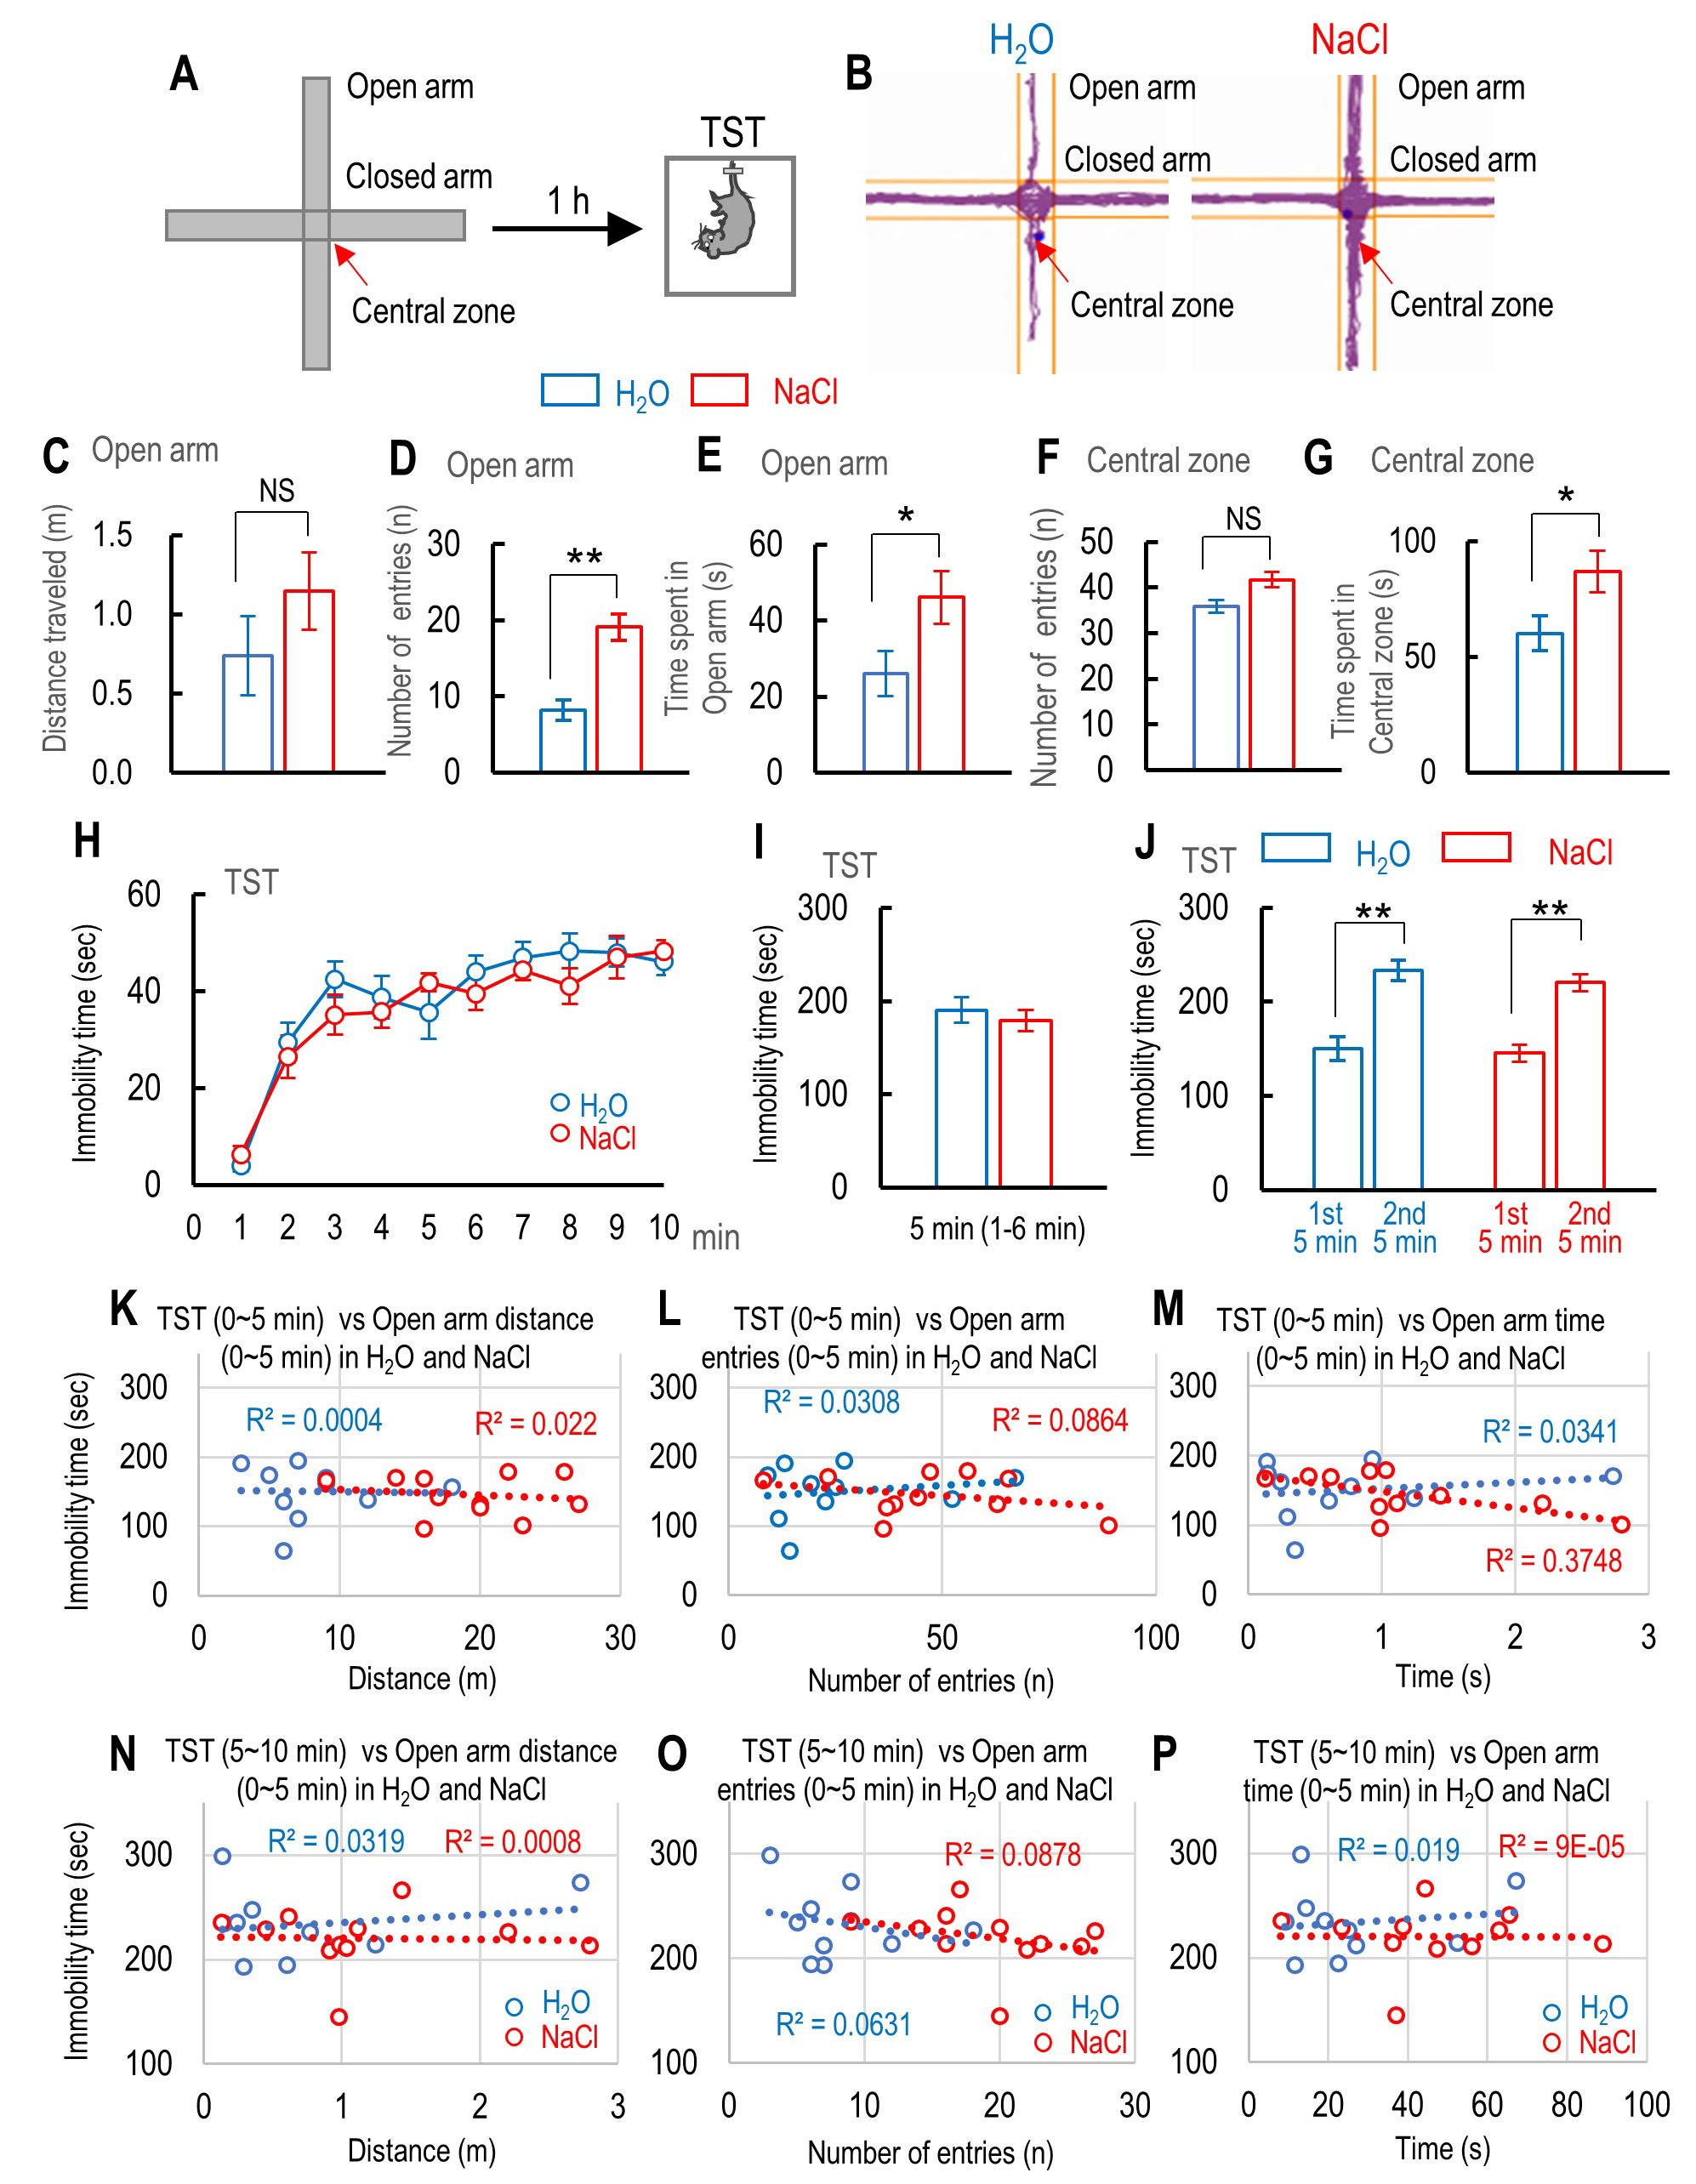 Fig. 5.
The effect of 2% NaCl intake on mouse anxiety levels while
using the elevated plus maze (EPM) and the correlation between immobility time
during tail suspension test (TST) and the anxiety level. (A) Schematic drawing
shows the EPM and the schedule of TST. (B) Traces of water- and sodium-intake
mice moving on the EPM. (C–E) Comparison between water- and sodium-intake mice
in terms of distance traveled (C), number of entries (D), and time spent (E) in
the open arm of the EPM. (F, G) Comparison between the number of entries (F) and
time spent (G) in the central zone of the EPM for water-intake mice (n = 10) and
sodium-intake mice (n = 11). (H) The time course of immobility time during 10 min
of TST for water-intake mice (n = 10) and sodium-intake mice (n = 11). (I)
Immobility time during the first 6 min, except the first 1 min, of TST for
water-intake mice (n = 10) and sodium-intake mice (n = 11). (J) Summary of
cumulative immobility time during the first (0–5 min) and last 5 min (5–10 min)
1 h after exposure to inescapable innate fear for water-intake mice (n = 10) and
sodium-intake mice (n = 11). (K–M) Correlation between immobility time during
the first 5 min of TST and the distance traveled (K), number of entries (L), and
time spent in the open arm of the EPM (M) for water-intake mice (n = 10) and
sodium-intake mice (n = 11). (N–P) Correlation between immobility time during
the second 5 min of TST and the distance traveled (N), number of entries (O), and
time spent in the open arm of the EPM (P) for water-intake mice (n = 10) and
sodium-intake mice (n = 11). Statistically significant differences between two
Pearson’s correlation coefficients by Fisher’s r-to-z transformation (
The role of salt intake in psychiatric disease remains controversial. Because patients with cardiovascular disease often have mental illnesses such as major depressive symptom [52, 53], high salt intake has been suggested to be a risk factor for psychiatric diseases [6, 8]. In contrast, it has been reported that low daily salt intake is a significant risk factor for mental distress [10] and that higher intake may protect people from depression [11, 54]. This suggests that having a restricted or low salt intake to prevent the aggravation of cardiovascular diseases may cause depressive symptoms [54]. High dietary salt intake is thought to promote neuroinflammation, which can cause depression-like behaviors in rodents [8]. We previously reported that an increase in proinflammatory cytokines was associated with despair behaviors [44, 55]. Therefore, if high salt intake increases the level of cytokines in the brain, this could induce depression-like behavior. Chronic salt intake has been shown to increase active coping behavior during inescapable stress by FST [8, 20]. In the present study, we observed that immobility time during the TST shortened in mice with 5 consecutive days of 2% NaCl intake compared to those with water intake. TST is similar to FST because mice generally struggle to escape when subjected to tail suspension as an inescapable stress. However, if they have learned they are in an inescapable situation, most mice stop struggling and exhibit despair-like behavior [56]. Immobility time has been widely used to evaluate whether antidepressant drugs affect despair-like behavior [31]. In the present study, mice with a 2% NaCl intake exhibited shorter immobility time in the first 5 min period, except for the first 1 min (1–6 min), indicating their despair behavior was decreased by the 5 days of sodium intake. However, their immobility time during the second 5 min period of the TST was longer than that of the first 5 min. We have previously suggested that immobility time during the second 5 min period of the TST was longer due to the induction of learned despair [41, 43]. The present results indicate that despair behavior was reduced in mice with a 2% NaCl intake for 5 consecutive days, but that learned despair was not affected. Therefore, active coping against the aversive situation during the TST can reduce despair-like behavior, and a high salt intake can have a similar effect to an antidepressant.
The role of high salt intake in the development of psychiatric diseases is still controversial. High salt intake is a risk factor for multifaceted cardiovascular diseases [57] such as hypertension [1] and renal disease [2]. Mental diseases are common in patients with coronary heart disease and may be associated with a substantial increase in cardiovascular morbidity and mortality [58]. It has been suggested that excessive salt intake causes stress-related psychiatric disorders by increasing one’s sensitivity to psychological stress through the activation of stress-sensitive vasopressin neurons and neuronal inflammation in the PVN [8, 20]. Therefore, researchers have raised the possibility that active coping behavior in high salt–intake mice might result in their hyper-responsivity to acute stress [6, 8, 20]. In contrast, acute hypernatremia inhibits neuronal inputs to CRH neurons in the PVN and blunts stress-induced activation of the HPA axis [59]. Moreover, chronic high salt intake for 5 days suppresses the expression of CRH in the PVN during the recovery period after restrained stress [18]. Secretion of CRH from the PVN drives HPA axis activity via adrenocorticotropic hormone (ACTH) and enhances the secretion of cortisol by the adrenal gland cortex. It has been suggested that both CRH secretion and increased levels of cortisol contribute to the signs and symptoms of depression [60]. Therefore, it is conceivable that high salt intake suppresses the secretion of CRH from the PVN during inescapable stress and may prevent the development of depressive-like symptoms in mice. The predator odor of TMT also increases the level of CRH and of corticosterone in mice [61, 62].
In the present study, it is possible the observed increase in immobility time during the TST 1 h after exposure to TMT was because the corticosterone was increased by TMT, thereby activating the glucocorticoid receptor and inducing dysregulation of the HAP axis [63, 64]. The main findings of the present study are that central preference during TMT exposure was negatively correlated with the immobility time during TST. Furthermore, the freezing time during the first 5 min of TMT exposure was correlated with immobility time during the TST. These results indicate that central preference during inescapable innate fear stress in mice with a 2% NaCl intake for 5 consecutive days induced active coping behavior. Additionally, the shorter immobility time during the TST indicates that the active coping behavior was improved by 2% NaCl intake for 5 days, whereas despair-like behavior during the TST was suppressed by 2% NaCl intake. Active coping is a qualitative factor of resilience and is defined as the ability to cope mentally or emotionally with a crisis and quickly return to pre-crisis status [65]. Active coping strategies and resilience are associated with the maintenance of psychological adjustment [66]. The preference by mice to enter the central zone during their exposure to inescapable innate fear suggests their resilience was increased by intake of 2% NaCl for 5 days, thus allowing active coping behavior against fear and aversive situations. The correlation coefficients between immobility time during the TST and both the distance traveled and the number of entries in the central zone during TMT exposure were significantly different between mice with 2% NaCl intake for 5 days and control mice. Therefore, we suggest that 2% NaCl intake for 5 days gave mice the resilience to adapt to fear and to inescapable stress by enhancing their active coping behaviors.
It has been demonstrated that low dietary sodium causes anxiogenic effects in rats. In the present study, we found that 2% NaCl intake for 5 days increased the distance traveled, the number of entries, and the time spent in the open arm of the EPM. This indicates that high sodium intake reduced the anxiety level compared to control mice. Therefore, 2% NaCl intake has an anxiolytic effect. However, behaviors that indicated a lower anxiety level, such as the distance traveled, the number of entries, and the time spent in the open arm, were not correlated with the immobility time during the TST. It has been suggested that lower levels of anxiety lead to increased exploratory behavior and that increased anxiety induces less locomotion and a preference to stay close to the walls of the field [49]. However, inconsistent results were observed in mice with a lower anxiety level during an open field test [49]. Therefore, taken together, the correlation between central preference and immobility time was not due to a lower anxiety level, but might be due to increased resilience for inducing active coping behavior during inescapable innate fear stress. Because excessive salt intake is a risk factor for cardiovascular disease, the American Heart Association (AHA) recommends a daily intake of less than 3.75 g for the general population [67], with moderate range for dietary sodium (3–5 g/day). These intake levels are associated with the lowest risk of cardiovascular disease and mortality [68]. In the present study, we used C57BL6 mice to investigate the effect of 2% NaCl intake. It has been demonstrated that a 2% NaCl intake for 7 consecutive days did not change serum osmolality compared to water-intake mice [20]. However, another group reported that 2% NaCl intake for 5 consecutive days increased the blood sodium concentration. Therefore, the effect of a short-term high salt diet on mental health and cardiovascular disease requires further investigation. In particular, we need clarify whether the active coping behavior in an aversive environment correlate with the blood sodium concentration. Furthermore, we should investigate what the lowest level of blood sodium concentration can lead to active coping behavior in the future.
A NaCl intake of 2% for 5 days resulted in a negative correlation between central preference during inescapable innate fear stress and immobility time during a TST-induced aversive situation. The results of EPM indicate that a 2% NaCl intake decreases mouse anxiety levels. However, none of the behaviors related to anxiety in the EPM was correlated with immobility time during the TST. This indicates that the central preference of sodium-intake mice increases their resilience to innate fear stress and leads to active coping behavior that prevents depression-like behavior. Although excessive salt intake poses a risk for the development of cardiovascular disease, an appropriate amount of intake is important for acquiring resilience and for the induction of active coping to deal with daily stress, thus preventing the development of mood disorders.
AHA, American Heart Association; ANOVA, Analysis of variance; CRH, Corticotropin-releasing hormone; EPM, Elevated plus maze; FST, Forced swimming test; HPA, Hypothalamic–pituitary–adrenal; MO, Mineral oil; NS, no significant; PTSD, Posttraumatic stress disorder; PVN, Paraventricular nucleus of hypothalamus; SEM, Standard error of the mean; TMT, 2,5-dihydro-2,4,5-trimethylthiazoline; TST, Tail suspension test.
KS and TMat conceived and designed the experiments. RH and TMur designed the behavioral study and performed the experiments. RH, TMur, RK and KS performed the experiments and analyzed the data. TMat and KS wrote the first draft of the manuscript. RH, TMur, RK, and TMat reviewed and critiqued the manuscript. RH, TMur, RK, TMat, and KS analyzed and interpreted the data. All authors read and approved the final manuscript.
The study was conducted according to the guidelines of the Declaration of Helsinki and was ap-proved by the Institutional Animal Care and Use Committee of Ohu University, which complies with the criteria mandated by the Japanese Law for the Humane (No. 2018-29, 2019-39, and 2020-17). This study was carried out in compliance with the ARRIVE guidelines.
The authors thank Miho Moriya and Takahiro Suda for technical support for mouse behavioral studies. We gratefully acknowledge the help of past and present members of the laboratory.
This work was supported by the Salt Science Research Foundation (Grant number: 1923; K. Seki) and the Grant-in-Aid for Scientific Research (C) from the Japan Society for the Promotion of Science (JSPS) (grant number JP19K06959; K. Seki and T. Matsuki); and the research grant by the School of Pharmaceutical Science, Ohu University (K. Seki). The funding source had no role in any process of our study.
The authors declare no conflict of interest.
Publisher’s Note: IMR Press stays neutral with regard to jurisdictional claims in published maps and institutional affiliations.