

 , Barbara Homann 1
1 Department of Neurology, Medical University Graz, 8036 Graz, Austria
2 Department of Public Health, St. Elisabeth University of Health and Social Schiences, 81000 Bratislava, Slovakia
Academic Editor: Gernot Riedel
Abstract
Objective: Vitamin D (VitD) has been shown to influence several cellular processes in the brain. The extent to which VitD plays a role in the pathomechanism of neuronal loss and dysfunction in basal ganglia diseases (BGDs) is still debated. There is yet to be a comprehensive study that provides an overview of all of the most relevant BGDs. Methods: PubMed, and Google Scholar were systematically searched for observational studies that investigated the association between serum VitD levels and BGDs up to March 2022. Results: We extracted 60 studies, but with a great variety of design and quality. VitD deficiency appears to be common in most BGDs, but only in Parkinson’s disease (PD) has a causal association been fully examined. There is some evidence that low VitD serum levels influence symptom severity, most notably in restless legs syndrome (RLS), PD, and tic disorders. The effects of vitamin D supplementation were studied in three BGDs, with results mostly favorable for RLS, ambiguous for tics, and mostly unfavorable for PD. Conclusions: There are still various elements of BGDs with insufficient, ambiguous, or altogether absent evidence, and further high-quality research is required. However, there appears to be sufficient scientific justification already to recommend that practitioners treating BGDs check serum VitD levels and supplement as appropriate.
Keywords
- basal ganglia diseases
- movement disorders
- vitamin D
- deficiency
- insufficiency
- disease severity
- risk factor
- biomarker
- supplementation
Basal ganglia disorders (BGDs) are slowly progressive incurable conditions that impact motor functions such as movement, muscle control, and balance, as well as nonmotor functions such as mood, behavior and cognition [1]. BGDs are among the most common neurological diseases, with a prevalence in the 50+ year-olds of 28% [2]. Though psychiatric symptoms can be as troubling and distressing as are abnormal movements, traditionally, the focus has been on motor abnormalities [1]. Accordingly, BGDs are classified into hypokinetic with Parkinson’s disease (PD), and hyperkinetic with essential tremor (ET), restless legs syndrome (RLS), dystonia, chorea, and tic disorders (TDs) as its most common representatives [2].
The BG are a set of intricately interconnected subcortical nuclei [3], including the substantia nigra, the dorsal striatum (caudate nucleus and putamen), the ventral striatum (nucleus accumbens and olfactory tubercle), the globus pallidus, the ventral pallidum, and the subthalamic nucleus [4]. Functionally, the BG are recognized as components of parallel, reentrant cortico-subcortical circuits that originate in distinct cortical areas, transit the BG and thalamus, and terminate at their respective areas of origin in the frontal lobe [5]. As mentioned above, these circuits run parallel but separate from one another so that failure of different locations of the BG output nuclei or connected pathways would result in varied patterns of symptomatology [1]. This explains the heterogeneity within the group and the individual disease.
The treatment of BGDs is purely symptomatic, and its effectiveness often diminishes over time. To date, there are no drugs that have prophylactic or progression-retarding properties. This has prompted the search for novel pharmacological and non-pharmacological strategies [6] that can improve brain pathology. VitD has been described as one of the promising candidates. It is a prohormone that, concerning the CNS, performs various pleiotropic tasks, including ensuring healthy neural development, appropriate adult brain trophism, and slowing the aging process [7]. For these tasks, VitD, as recently discovered, may perform both enzymatic activation and inactivation locally within the CNS [8].
VitD receptors (VDRs) are found throughout the embryonic and adult brain, and evidence indicates that both the mRNA encoding the VDR and the protein itself are present in the CNS [9]. VDRs are also abundant in neurons and glia in areas of the BG circuits such as in the substantia nigra, caudate, putamen, thalamus, and hypothalamus [7]. Of the many functions, VitD displays there, the furthering of synaptic plasticity and neurotransmission seems the most essential [10, 11]. This is mainly achieved by decreasing the creation of pro-inflammatory cytokines and the oxidative stress load [12]. Neuronal loss and dysfunction are complex, poorly understood processes that can be caused by aggregation of misfolded proteins, mitochondrial damage, excitotoxicity, and misguided autonomous pathways [13]. VitD is thought to play a role in many of these mechanisms. All these facts support the widespread notion that VitD is a crucial factor in reducing neurodegeneration and other neuropathological processes that lead to the development of BGDs.
Unfortunately, even though abundant surveys are available for PD, there is no systematic investigation of the role of VitD in all of the most important BGDs. Of particular interest should be to provide insight into the prevalence of VitD deficiency, VitD as a risk factor and potential biomarker, the association of VitD and symptom severity, and finally, the effect of VitD supplementation. To clarify for which BGDs there is sufficient evidence, ambiguity, and data are entirely lacking could guide researchers in future investigations and would give physicians a basis for evidence-based decision-making.
A standard search protocol guided the ascertainment of publications investigating the association of VitD and BGDs until March 1, 2022 in PubMed and Google Scholar. The following Medical Related Subjects (MeSH) were used to specify the literature search: vitamin D or ergocalciferol; AND Parkinson’s disease; restless leg syndrome or RLS; tic or Tourette; chorea or Huntington; tremor or essential tremor; dystonia; myoclonus; athetosis; ataxia; stereotypies; and ballism. If there was any uncertainty about whether a recognized article should be included, the text was examined by the second author. If the opinion of the two matched, the publication was in- or excluded accordingly. Where no agreement could be reached, it was omitted.
Furthermore, the bibliographies of the indicated articles were examined for other relevant research. By comparing author names, interventions, publication dates, sample sizes, and findings, dual publications were identified for exclusion.
Screening 796 papers, identified using the above-mentioned systematic search technique, by titles and abstracts, we removed 744 that did not match the inclusion criteria. We further deleted two duplicate publication after full-text reading but gained seven from bibliographies and three from other sources. This left us with 60 scientific papers to include for our survey (Fig. 1)
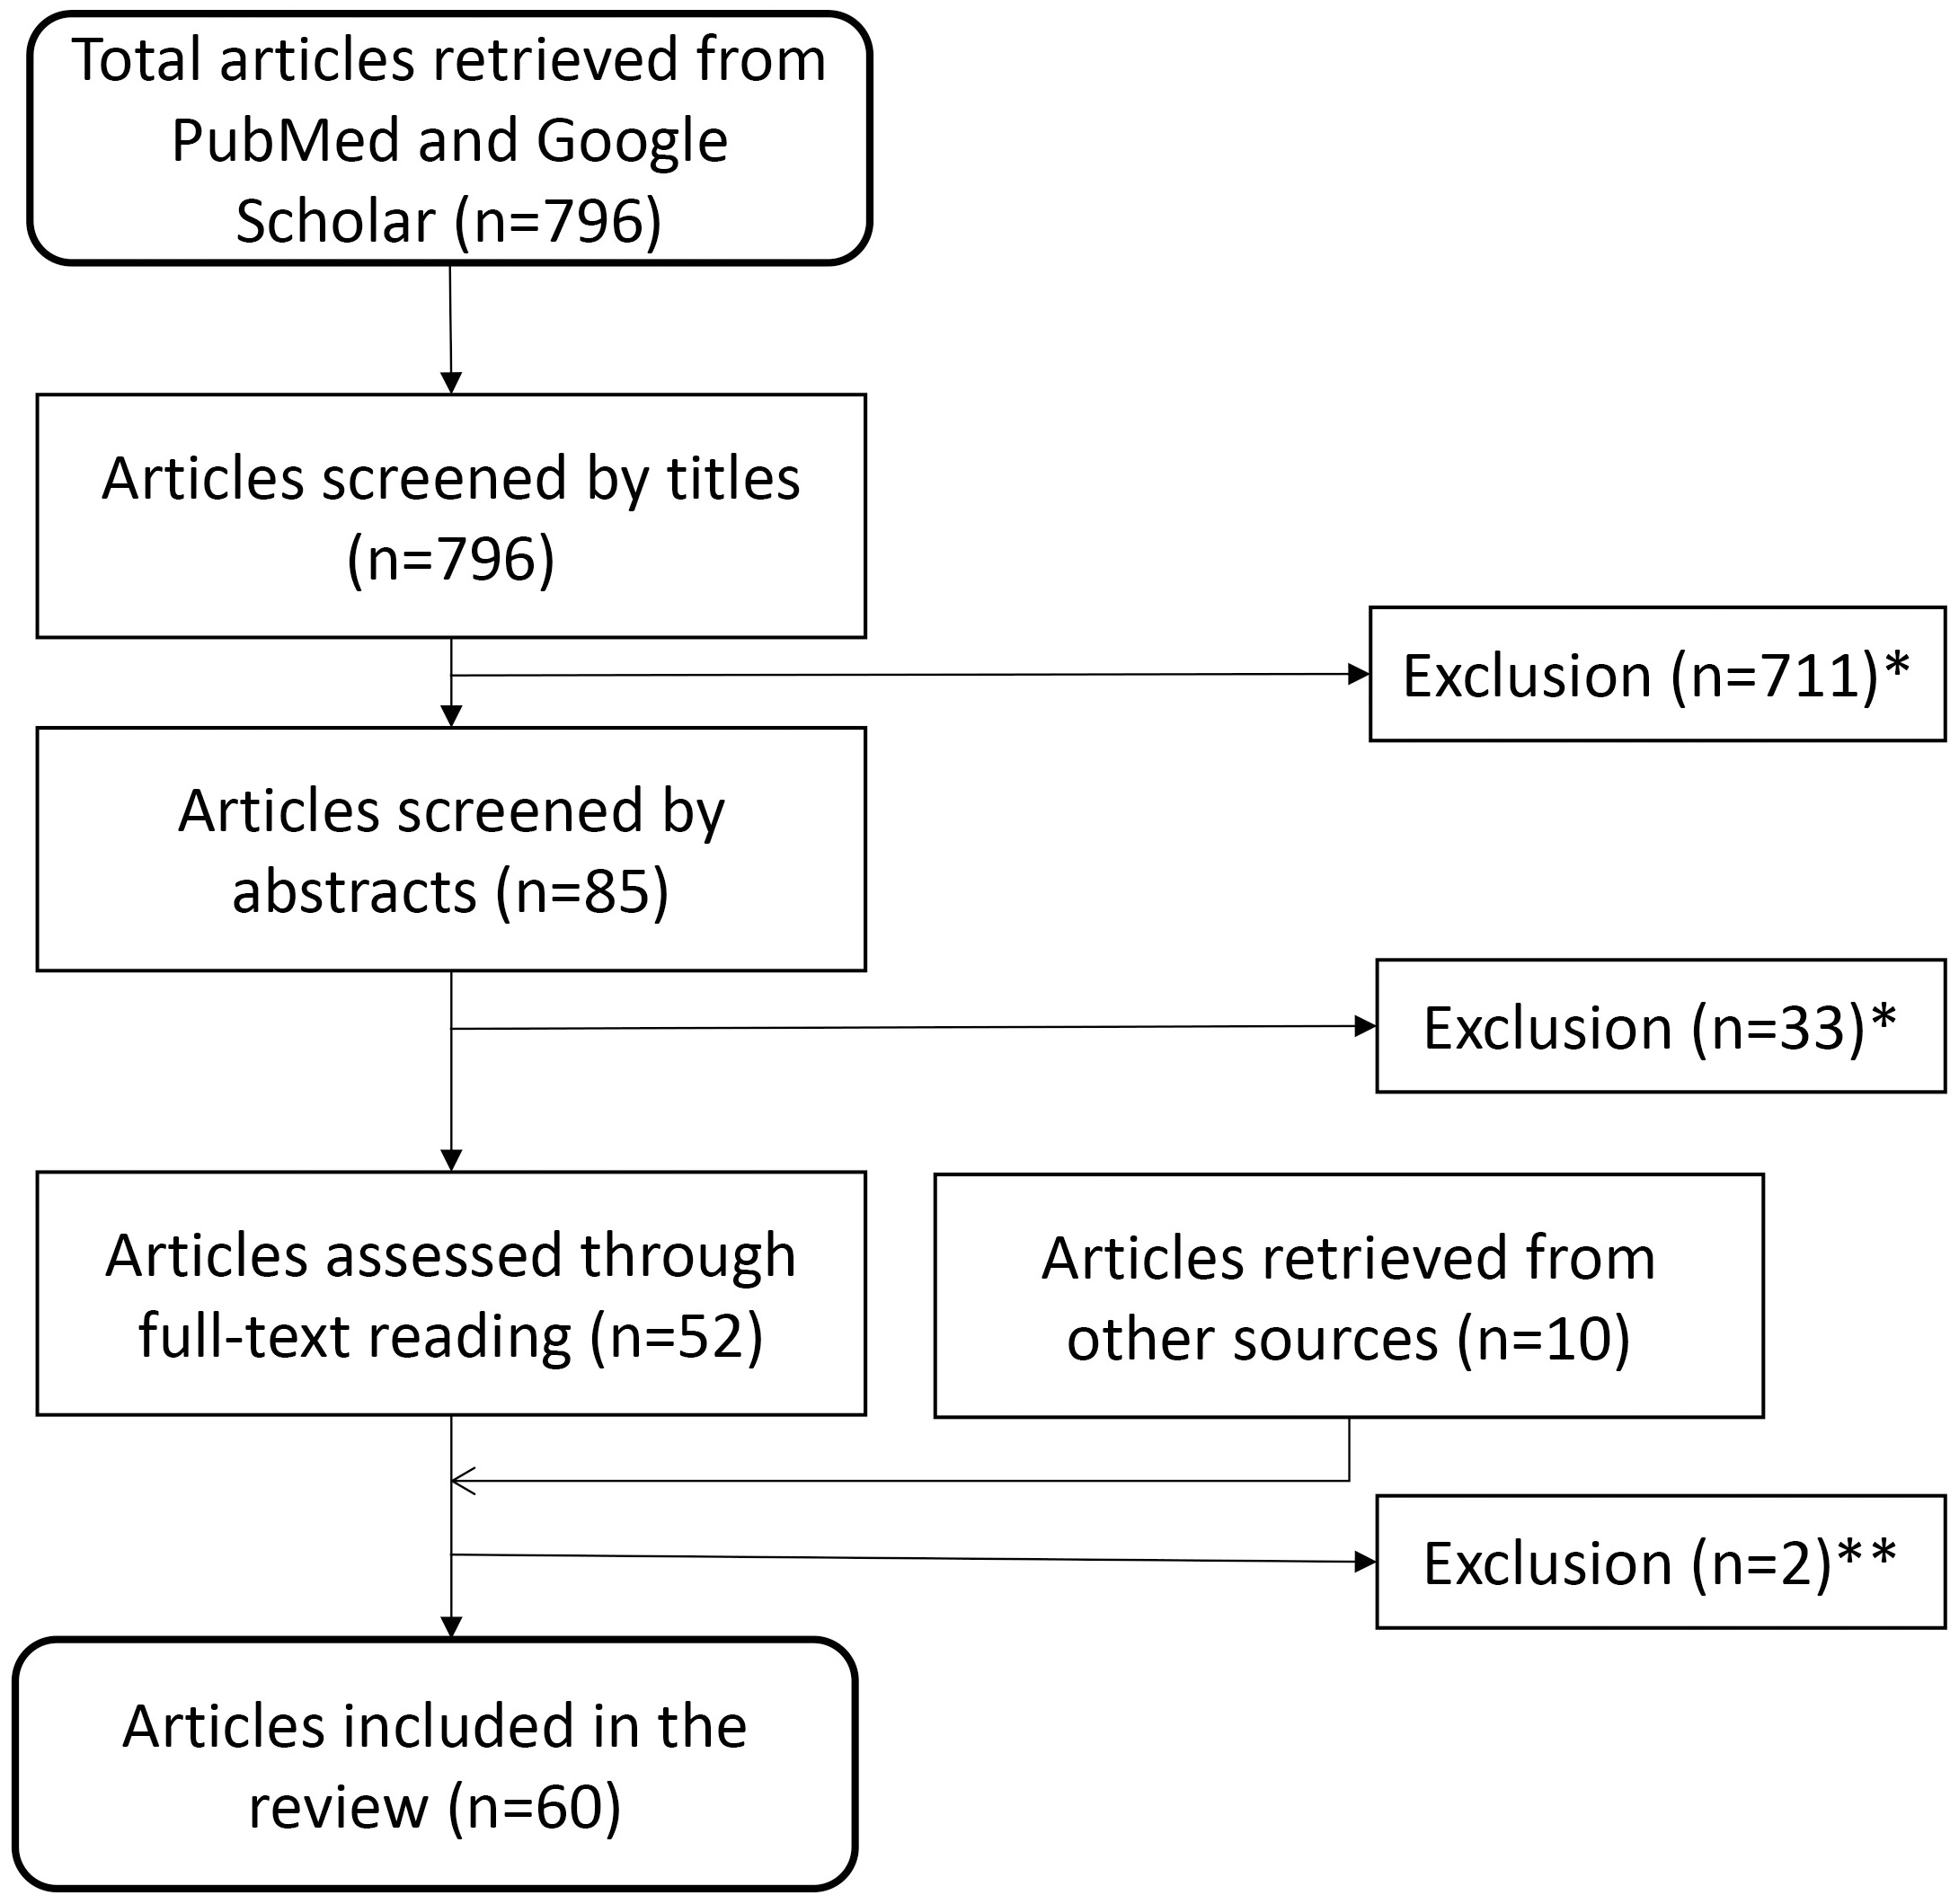 Fig. 1.
Flow diagram for identification of relevant studies. This diagram depicts the path from the 796 articles retrieved initially, through exclusion and additional inclusion, to the 60 articles used in the survey. Reasons for exclusion: *studies not related to search topic, non-human (i.e., animal) studies, or no new data presented (editorials, reviews etc.) or **duplicate or retracted publications.
Parkinson’s disease (PD) is a disabling, slowly progressive disease characterized by dyskinesia, tremor, rigidity, and postural instability. In addition, nonmotor symptoms such as autonomic, sensory, or psychomotor symptoms also occur in most patients. PD is the second most frequent neurodegenerative disease, with a 1% prevalence in 60+ years olds [14].
Fifteen observational studies [15, 16, 17, 18, 19, 20, 21, 22, 23, 24, 25, 26, 27] and two meta-analysis [28, 29] have investigated the link between VitD and PD and, except for two [18, 28], have consistently reported low serum VitD levels in PD patients [15, 23, 30, 31, 32, 33, 34, 35] (Appendix Table 1).
Luo et al. [29] included in his meta-analysis 15 studies with 2436 PD
patients and 2567 age matched controls demonstrating a lower serum in patients
(WMD –3.96, 95% CI –5.00, –2.92), especially in higher latitude regions (WMD
–4.20, 95% CI –5.66, –2.75). There are four studies by Sato et al. [32]
that were recently retracted, however when those were removed from the
calculation the result did not change (WMD –3.96, 95% CI –5.00, –2.92,
I
There have been 14 studies on VitD and disease severity, with a total of 1833 PD patients included (Appendix Table 2). The severity of PD motor symptoms was primarily assessed using the motor subscore of the Unified Parkinson’s Disease Rating Scale (UPDRS III) or the Hoehn and Yahr stage (H&Y). Suzuki, for example, reported a significant inverse relationship between blood VitD levels and UPDRS III scores in 137 PD patients [36]. Accordingly, VitD levels were highest in people with H&Y stages 1–1.5 (mean 23.9 ng/mL) and lowest in participants with H&Y stages 4–5 (mean 14.5 ng/mL), with a dose-response relationship. The Harvard-Biomarker-Study by Ding et al. [16] used data from 388 PD patients and found comparable patterns for UPDRS results. After controlling for age, gender, race, and VitD supplementation, the UPDRS total score was negatively associated with serum VitD level (p = 0.02). However, there was no correlation between VitD level and H&Y stage in this investigation. In an add-on to a longitudinal study following neuropsychiatric function in PD patients, Peterson et al. [37] also included an assessment of VitD serum levels and disease severity. This revealed that in 286 persons with PD, there was a significant association between VitD and both H&Y stage (r = 0.191, p = 0.0013) and UPDRS III scores (r = 0.242, p = 0.0025). Peterson et al. [30] included 40 PD patients in cross-sectional, observational research on balance and falls. Their VitD concentration exhibited a significant negative connection with the severity of their PD symptoms as measured by the UPDRS III (r = 0.33; p = 0.04). When age was taken into account, this link was maintained. However, there was no significant correlation between VitD concentration and H&Y stage (r = 0.39; p = 0.69). Two other studies to assess bone health and VitD status in PD also looked at disease severity. Senel et al. [38] found a strong negative link between VitD levels and the H&Y stages in 19 consecutive PD patients (r = 0.69, p = 0.01). In line with this, VitD levels in 52 PD patients in Serdarolu Beyazal’s study had a significant negative correlation with UPDRS II and III scores, as well as H&Y stages [21]. Finally, and in contrast with the previous findings, the prevalence of VitD insufficiency in 108 subjects with early PD of Chitsaz’s research project was not associated with H&Y stage or UPDRS III scores even after multivariate adjustment for possible confounders [39].
The little data available linking non-motor symptoms to VitD insufficiency is
limited to two investigations on psychiatric, one on sensory and two on autonomic
dysfunction. In the aforementioned paper Peterson et al. [37] showed in
286 PD patients that higher serum levels are connected with better scores in
neuropsychiatric tests, particularly verbal fluency and verbal memory (t
= 4.31, p
Orthostatic hypotension (OH), the paper by Jang et al. [43] states, was
inversely related to lower blood concentrations of Vit D (OR, 0.54; [CI],
0.59–0.86; p
However, data to prove a causal association has been a source of contention. Without this, it is possible that VitD deficiency is a result rather than a cause. Fortunately, there are two longitudinal studies and a genetic investigation to shed more light onto the situation.
Knekt et al. [45] investigated the link between VitD levels in midlife
and the likelihood of developing PD later in life using the Finnish National
Drug-Reimbursement Database. Within the 29-year follow-up period, 1.6% of the
3173 included were diagnosed with PD. Compared to those with insufficient levels,
the risk for PD patients with adequate serum VitD was 65% lower. The relative
risk of the highest vs. lowest quartiles was 0.33 (95% CI, 0.14–0.80). In
contrast, Shrestha et al. [46] reported no link between serum VitD
concentrations and PD risk in their US population-based prospective cohort
analysis of 15,792 people. After a median of 17 years of follow-up, 0.42% of
patients developed PD. The mean serum VitD concentrations in individuals who got
PD and those who did not were similar (25.6
For PD, there are currently two VitD biomarker studies available. Lawton
et al. [48] recently evaluated four biomarkers, including VitD, in the
baseline blood of 624 participants from the Oxford Discovery prospective cohort
in quest of a PD biomarker as indicator for disease progression. The follow-up
time for clinic visits was 3.2
Three prospective PD supplementation trials (Appendix Table 3) and one small
meta-analysis have been conducted, however, the findings have been equivocal
[50]. Hiller et al. [51] undertook a pilot randomized, double-blind
intervention study (n = 58) to assess the effects of 16 weeks of high-dose VitD
(10,000 IU/day) on balance and other PD symptoms. Despite a rise in VitD serum
concentrations (30.2 ng/mL to 61.1 ng/mL), the Sensory Organization Test (SOT)
did not demonstrate a significant improvement in balance in the 27 VitD treated
individuals (p = 0.43). However, a post hoc analysis comparing treatment
effects in younger (age
Zou et al. [50] conducted a meta-analysis and concluded that in
patients with PD the use of vitamin D supplements was effective in increasing
VitD levels (SMD, 1.79; 95% CI, 1.40–2.18; p
Restless legs syndrome (RLS) is a disorder of the sensory-motor system. RLS is characterized by intense, unpleasant sensations, such as paresthesia and dysesthesia, in the extremities, especially the legs, and the urge to move them. Typical is deterioration at rest, in the evening, and at night, and improvement with exercise. RLS affects 5–15% of adults [2, 53].
Multiple studies suggest that VitD deficiency is common in patients with RLS.
Wali et al. [54] conducted a population-based case-control study to
assess the association between RLS and VitD levels. He discovered when analyzing
the data of 78 RLS patients and 123 controls that the likelihood of being
diagnosed with RLS was considerably greater in VitD deficient than in sufficient
subjects (OR 3.1, p
In addition, VitD seems to have disease-specific beneficial effects regarding
the severity of RLS symptoms. Balaban et al. [55] for example, reported
on a correlation between low VitD values with increased disease severity. Wali
et al. [54] also revealed an association between increased RLS severity
ratings (International Restless Legs Syndrome Study Group rating scale
(IRLSSG-RS)) and lower serum VitD levels (IRLSSG of deficient cases: 19.4
Mondello et al. [63] performed comparative proteomic analyses of the blood of RLS patients and healthy persons in search of novel potential RLS biomarkers. When they quantified 272 proteins in 12 patients with RLS and ten healthy controls, they revealed that with eight other proteins, VitD-binding protein was decreased, suggesting that these proteins may have clinical value as biomarkers and as possible treatment targets. Patton et al. [64] conducting a proteomic analysis of cerebrospinal fluid of five RLS patients and five controls with the aim of establishing whether biomarkers in the cerospinal fluid are capable of distinguishing patients with RLS from those with other neurological disorders. Their results revealed a distinctive protein profile in the RLS CSF that included among others an increased VitD binding protein, which could possibly serve as a CSF biomarker for early RLS.
Aricò et al. [65] studied the effects of VitD supplementing in 5
females with low VitD levels as part of a research to investigate RLS patients
with augmentation. At six-month follow-up visits, in parallel with VitD values
normalization (pre: 10.3 ng/mL vs. post: 30.4 ng/mL), augmentation had been
resolved in two patients, and RLS scores had improved in all (IRLS-RS pre: 19.8
vs. post: 8.6; p
There are no investigations on VitD as a risk factor or biomarker for RLS or aspects thereof.
Tics are characterized by a sudden onset of involuntary, rapid, repetitive, non-rhythmic muscle contractions (motor tics) or sound production (vocal tics). Tic Disorders (TDs) are often transient but can become a life-long chronic disorder [68]. While 10% of all people experience some form of transient TD at some point in their lives, the prevalence of the Gille de la Tourette syndrome, the most severe manifestation of the spectrum of TDs, is 1% [68].
So far, two case-control studies on VitD serum levels in TDs have been
conducted. In a recent research project, Li et al. [69] examined 132
children with TDs and 144 healthy controls. The TD group included 92 patients
with transient TDs and 40 with chronic TDs (including eight cases of Gille de la
Tourette syndrome). He discovered that the mean serum level of Vit D in the TD
group was significantly lower than in the control group (p
In another case-control study by Li et al. [71] designed to expand the
previous data, they explored in 179 children with TDs and 189 healthy children
the relationship between serum VitD level and tic severity. They discovered a
negative correlation between the serum concentration and severity of symptoms.
Bond et al. [70] however, in their before-mentioned study, found no
significant association between VitD levels and tic severity as measured by both
Yale Global Tic Severity Scale (YGTSS) (p = 0.84) and Clinical Global
Impression (CGI) (p = 0.91). However, as correctly hypnotized, lower
VitD levels were associated with significantly higher presence and severity of
comorbid ADHD; in other words, higher VitD levels were somewhat protective, i.e.,
a ten ng/mL increase in VitD level was associated with lower odds of having
comorbid ADHD within the TD cohort (OR 0.55, 95% CI 0.36–0.84, p =
0.01) and was inversely associated with ADHD symptom severity (
There are two relatively small investigations on the effect of VitD
supplementation. A study by Gemawat et al. [72] on 34 patients indicated
an improvement in frequency, duration, and intensity of tic movements at the
24-week follow-up. In an open-label study by Li et al. [73] 36 children
with chronic TDs received 300 IU/kg/d (
There are no investigations on VitD as a risk factor or biomarker for TD or aspects thereof.
Essential tremor, with a pooled prevalence including patients of all ages of 0.9% [74], is the most widespread movement disorder in Central Europe [2]. According to established diagnostic criteria, Essential tremor is characterized by postural and action tremor of the upper limbs, often also of the head, legs, and trunk.
In our literature search, we detected no systematic studies on the VitD status of Essential tremor (ET). All what we found was a case report by Calarge describing tremor as a probable, possibly even indicative symptom of VitD deficiency in children [75].
The relationship between ET and VDR polymorphism has been examined in two studies. Chen et al. [76] tried to detect genetic risk factors of ET in the Chinese population and investigated in 200 ET patients and 229 controls 12 single nucleotide polymorphisms (SNPs) in seven candidate genes for RLS including VDR. They reported an association of IL1B polymorphism with the risk of ET but, no significant differences either in the frequencies of genotypes or in the frequencies of the allelic variants of other SNPs harbored in VDR or any other of the targeted RLS genes. Sazci et al. [77] examined the rs2228570 variant of the human VDR gene in a case-control genetic association project, including 239 sporadic ET patients and 239 healthy controls. He revealed that the rs2228570 mutation of the VitD receptor gene is generally associated with sporadic ET, notably in male patients, making it a genetic risk factor for sporadic ET. Similarly, Agundez et al. [78] looked for a possible association between several common variants in these genes and the risk for ET. Genotyping 272 patients diagnosed with familial ET and 272 age-matched controls, they too confirmed that VDR rs2228570 SNVs is related to ET risk.
There are, to date, no investigations on the effect of supplementation of VitD in ET.
There are no studies on other aspects.
Huntington’s Chorea (HC) is an autosomal dominant, currently incurable, progressive and ultimately lethal neurodegenerative disorder caused by polyglutamine (CAG) repeats in the huntingtin protein [79]. The most prominent neurological symptoms are chorea, loss of coordination, and dysphagia. HC’s most common psychiatric symptoms include depression, irritability, mood swings, memory and concentration deficits, and full-blown dementia [79]. Prevalence rates among predominantly Caucasian populations in Western countries are especially high, estimated at 9.71 per 100,000 [80].
Minimal data are available on the status of VitD levels in HC [81]. Chel
et al. [81] explored VitD status in 28 institutionalized patients with
manifest HC in a cross-sectional study. Eight patients (29%) were VitD deficient
(
To date, there have been no VitD supplementation studies in HC patients conducted to explore the effects of VitD administration. There have also been no research of VitD as a risk factor or biomarker for HC or aspects thereof.
Hereditary ataxias with predominant cerebellar pathology, leading in a gradually increasing loss of fine motor coordination, are commonly attributed to movement disorders, and there is emerging evidence of basal ganglia involvement for at least some of the spinocerebellar ataxias (SCA) [82, 83, 84]. According to a systematic review of prevalence studies, roughly 1:10,000 persons are afflicted by hereditary ataxias [85].
The role of VitD in inherited ataxias has received little attention. The limited research that are available focused primarily on bone health, such as the tiny study on Friedreich’s ataxia (FRDA) [86] and a bigger one in patients with spinocerebellar degeneration (SCD) [87]. We presently have no relevant data regarding VitD status to contribute because the latter was recently withdrawn and the former cannot be regarded a BGD.
There have been no studies on VitD as a risk factor for ataxia, nor have there been any on VitD supplementation.
Myoclonus is a sudden, brief, jerky, shock-like involuntary movement caused either by a contraction of a single or several agonist and antagonist muscles (positive myoclonus) or by a transient interruption of tonic muscle activity (negative myoclonus) [88]. The lifetime prevalence of myoclonus is estimated to be approximately 10 cases per 100,000 population [89].
There are no systematic investigations on VitD status in myoclonus. However, we found one historic case report on a 98-year-old woman with myoclonia and low serum concentration of VitD and calcium, in which symptoms disappeared after supplementation [90].
The literature search did not reveal any systematic investigations on VitD supplementation in patients with myoclonus, nor are there any regarding Vit D as a possible risk factor or biomarker.
Dystonia is a movement disorder, characterized by sustained or intermittent muscle contractions causing abnormal, often repetitive, movements or postures, or both [91]. The prevalence of dystonia reported by Steeves et al. [92] in a systematic review and meta-analysis is 16.43 per 100,000.
There is but one study examining the VitD status in dystonia patients. Serefoglu
Cabuk et al. [93] investigated 20 patients with benign Blepharospam
(BEB), a common form of focal dystonia, and 20 healthy individuals. He showed
that the BEB patients had in comparison significantly lower serum levels of VitD
(BEB: 16.58
There is no investigation linking low VitD status to the development of dystonia.
In the afore mentioned study Serefoglu Cabuk et al. [93] calculated that the VitD level of his BEB patients, strongly negatively correlated with the Jankovic severity score (r = –0.375, p = 0.043).
VitD supplementation has been studied, although only in one double-blind placebo controlled study conducted by Habibi et al. [52] on patients with L-dopa induced dyskinesias, including dystonias. He randomly allocated 120 patients to receive over the course of three months VitD at a dose of 1000 IU/day orally or placebo. Dyskinesia duration improved when compared to placebo (VitD: –0.88 hours/day vs. Placebo: –0.23 hours/day), as did dyskinesia severity (VitD: –0.4 patients vs. Placebo: –0.6 patiens), although the difference did not reach levels of significance. In summary, the overall trial results were mostly unfavorable, and most importantly, there was no mention of the effect on dystonia specifically.
There are no studies on other aspects of VitD and the development of dystonia, particularly none on VitD as possible biomarker.
There have been no research on the VitD status of other BGDs, such as stereotypies, akathisia, athetosis, and ballism. There are no studies on VitD as a risk factor or biomarker, nor on the impact of supplementing in these situations.
This study reviewed the available research on VitD and its potential impact on BGDs. In particular, we investigated how VitD blood levels might be associated with BGD symptoms and clinical development and its potential application in improving clinical manifestations in BGD patients.
Specifically (Table 4), we found that VitD deficiency appears to be prevalent in all BGDs, and in addition, to be more prominent both quantitatively and qualitatively when compared to the general population. Only in PD has a causal association been thoroughly examined, with conflicting results; in HC, Myoclonus, and ET, there are some indications that there may be a link. VitD as a biomarker has been investigated in PD and RLS with promising outcomes. There is evidence that low VitD serum levels influence symptom severity, most notably in RLS and, to a lesser extent, in PD and TDs. The effects of VitD supplementation were studied in three BGDs, with the results being mostly favorable for RLS, ambiguous for TDs, and mostly unfavorable for PD.
| Disease | Deficiency | Risk Factor | Biomarker | Symptom | Treatment |
| Parkinson’s disease | A +++/− | B +/− | C + | B ++/− | A +/−−− |
| Restless Legs Syndrome | A +++ | C + | C ++ | C +++/− | |
| Tic Disorders | B ++ | C ++/− | C +/− | ||
| Huntington’s Chorea | D + | D + | |||
| Myoclonus | D + | D + | |||
| Ataxia | |||||
| Essential Tremor | D + | ||||
| Quality: A: one or more meta-Analysis; B: more than one RCT or RCS; C: one
randomized controlled trial (RCT) or one representative cohort study (RCS); D:
observational studies only.
Study-outcome: +, Favorable; ++, very favorable; +++, highly favorable; −, unfavorable; −−, very unfavorable; −−−, highly unfavorable. | |||||
Previous evaluations touched on these issues in various ways, covering some of the examined diseases such as PD [29, 94] or other movement disorders [35], but none covered BGDs entirely. Furthermore, since their publication, as can be expected in this dynamic field of research, there has been a steep increase in the number of new studies; thus, many of the prior material has become outdated. Fresh discoveries have been made, some of which contradict prior ones [18], but there have also been withdrawals of fraudulently manufactured data that previously supported the assumption of a favorable protective impact [95].
VitD’s effect has also been examined in various other neurological diseases [96]. There is general agreement that VitD insufficiency is a risk factor for disease development and poor outcome, as seen by more severe symptoms in most of the disorders studied [97]. Stroke and Alzheimer’s disease (AD) have the highest level of evidence, whereas traumatic brain injury, neuro-oncologic processes, multiple sclerosis (MS), and associated disorders have lower quality data [97]. VitD as a supplement has been researched in most neurological illnesses, including high-quality studies for MS and neuro-trauma, medium-quality for stroke and AD, and lower quality for brain tumors and CNS infections, the latter , in addition, having disappointing results [97]. VitD has also been examined as a late-stage therapy for stroke, with conflicting outcomes despite high-quality data [97]. VitD and VitD binding protein have been discussed as potential biomarkers in patients with stroke [98], MS [99], AD [100], glioblastoma [101], traumatic brain injury [102], and meningitis [103].
In the research of other neurological diseases we find similar patterns as with that of BGDs: there is an increasing quantity of articles with heterogeneity in design and quality. However, the quest to implore alternative interventions is more pressing for BGDs, because of more limited treatment options. Therefore, further research is crucial, especially in BGDs. As potential guidance for these future research projects, this survey points out that there are areas where more research is needed and where there are qualitative shortcomings in the existing research.
In this respect we also want to summarize the limitations of our review. These can mainly be divided into three categories: The first and most important challenge was considerable heterogeneity across included studies, which complicated comparisons and interpretations of our findings. There were major disparities in the research populations, including genetic, regional, and cultural background, outcomes and assessment techniques, treatment regimes, duration of study periods, and seasonality of testing. As stated in a recent scientific paper, the latter two may have a significant impact on the study’s outcome [104].
Some of the publications considered did not include critical information such as VitD levels, the daily dosage equivalent of current symptomatic BGD therapy, whether disease severity was assessed on or off medication, the type of VitD, and the VitD level evaluation technique. The laboratory assessment procedure, in particular, appears to be an essential element. Some authors even go so far as to suggest that the lack of use of globally approved measuring methodologies and materials in a not insignificant part of VitD investigations potentially undermines their findings’ reliability [100].
Finally, there was an overall variability in design and quality and only a relatively small number of studies in some of the BGDs. Also, it should be emphasized that correlations in some of the studies were somewhat low, though still significant. Due to the profound heterogeneity, we were unable to undertake a meta-analysis of the findings, and our interpretation was limited to a qualitative synthesis.
There are strengths in our review that should be highlighted. We used a highly sensitive search strategy, followed a systematic approach in our search and analysis, had a guideline for discerning views during the inclusion process, and followed reporting recommendations. Furthermore, where essential data was missing or full text was not accessible, we contacted the authors, unfortunately, not always successfully.
At this point, the implications of our study deserve some attention. The investigation began with the question of whether VitD can be the preventive or curative treatment for BGDs that has been sought for a long time or whether it can be the decisive risk factor or the reliable biomarker; with the current knowledge, the answer to that question is probably neither.
We discovered that the situation for BGDs is mixed: On the one hand, there is not enough evidence to draw definitive conclusions, and on the other, there is a lot of data suggesting that VitD deficiency can impact disease development and progression, flawed as they might be. Similar to Bivona et al.’s [105] argument for AD research, we in BGD research are also required to remember that, apart from inaccuracies in study design and execution, we are also dealing with highly complex pathological processes. Bivona’s paper elucidates that an influential factor in the evaluation of interventional studies is the lengthy latency period of AD, and most likely also of BGDs, which complicates the interpretation of the potential role of VitD in the disease. Also, in some of the BGDs, including PD and HC, and possibly in other BGDs too, the disease process begins years, if not decades, before they show symptoms. At that stage, the structural damage might be already too extensive for interventions to be successful [106, 107]. In addition, the pathological processes, as indicated, for instance, by twin, [108, 109] are most likely triggered by a multitude of factors [110, 111]. In light of the complexity of this situation, it would be unexpected if one treatment, such as VitD supplementation, could be the sole cure and, at the same time, serve as a biomarker. However, VitD might play a role in ways not yet explored. It is possible, for instance, that VitD may prove most effective when it acts in synergy with one or more other medications, in which one enhances the effect of the other, or that VitD does not exert any direct influence but merely provides the conducive environment to allow other interventions to work.
Therefore, the key implication of this study is that we must acknowledge the complexity and consequently scale back on unrealistic expectations while remaining optimistic and open to further discoveries.
When it comes to contentious matters, more data always seems helpful. However, we have learned that for such a survey, it is not so much the number as the quality. To better understand the situation and produce a valuable meta-analysis, there is a need for adequately powered trials with the state of the art study designs and standardized cut-off levels for deficiency and insufficiency. Nevertheless, more than that, standardized laboratory conditions must be observed to ensure reliable and comparable outcome measures.
It is yet to be determined if VitD reintegration could be an effective adjunct to pharmaceutical and rehabilitative therapy in BGD patients. However, given the high prevalence of VitD deficiency, that BGDs are commonly linked with falls and fractures [112], and the good side effect benefit profile, we and others [113] believe that there is adequate scientific justification already to advise practitioners to monitor VitD levels and supplement as needed.
AD, Alzheimer’s disease; BG, basal ganglia; BGDs, basal ganglia diseases; H&Y; Hoehn and Yahr; HC, Huntinton’s chorea; IRLSSG-RS; International Restless Legs Syndrome Study Group rating scale; MS, multiple sclerosis; PD, Parkinson’s disease; RLS, Restless legs syndrome; TDs, Ticdisorders; UPDRS, Unified Parkinson’s Disease Rating Scale; VDR, vitamin D receptor; VitD, Vitamin D; YGTSS, Yale Global Tic Severity Scale.
CNH and BH designed the research study. CNH performed the research. CNH and BH analyzed the data. CNH and BH wrote the manuscript. All authors contributed to editorial changes in the manuscript. All authors read and approved the final manuscript.
Not applicable.
Special thanks goes to my mother who recently died at the age of 99 and constantly supported my research in every way possible.
This research received no external funding.
The authors declare no conflict of interest.
| Authors | Year | Country | Subjects (n) | Study design | Serum Vitamin D | Prevalence of deficiency | Correlated with | Compared to Co |
| ng/mL, mean | ||||||||
| Parkinson’s disease (PD) | ||||||||
| Abou-Raya [15] | 2009 | Egypt | PD (82), Co (68) | case control | PD:40.5 |
not specified | not specified | sign. |
| Ding [16] | 2013 | USA | PD (388), Co (283) | longitudinal | PD: 28.0 |
PD: 17.6% vs. Co: 9.3% | UPDRS (total) | sign. |
| Evatt [17] | 2008 | USA | PD (100), AD (100), Co (100) | Survey (database): VitD blinded | PD 31.9 |
PD 55% vs. Co 36% or vs. AD 41%; p = 0.02 | not with disease duration or symptoms | sign. |
| Kuhn [18] | 2021 | Germany | PD (60), Co (60) | case control | PD 17, 59 |
not specified | none (UPDRS; MOCA) | not sign. |
| Liu [114] | 2014 | China | PD (229), Co (120) | case control | PD: 20.6 |
PD: 43.4% vs. Co: 26.7%; p = 0.010 | disease duration (r (spearman) = −0.124, p = 0.041). H&Y (p = 0.030) and UPDRS (p = 0.000)) | sign. |
| Ozturk [20] | 2014 | Turkey | PD (115), Co (117) | case control | mPD: 12.6 |
Deficient mPD: 89.4% vs. mCo 61.7%; p |
not applicable | sign. |
| Beyazal [21] | 2016 | Turkey | PD (52), Co (39) | case control | PD vs. Co significantly lower | not specified | UPDRS part II, UPDRS part III, and HY stage | sign. |
| Sleeman [22] | 2017 | UK | PD (145), Co (94) | Longitudinal | PD 44.1 |
PD 66.9% vs. Co 45.7%; p |
disease motor severity at 36 months. | sign. |
| van den Bos [23] | 2013 | Netherlands | PD (186), Co (802) | case control | PD 48.3 |
PD 56.2% Co 43.2% | not applicable | sign. |
| Wang [25] | 2016 | China | PD (201), Co (199) | case control | PD 20.6 |
PD 91.0% vs. Co 89.9% | not applicable | sign. |
| Wang [24] | 2015 | China | PD 478) Co (431) | case control | PD 25.59 |
PD : 71% vs. C0 54% ; |
not applicable | sign. |
| Yakşi [26] | 2022 | Turkey | PD (34) vs. Co (31) | case control | PD 16.0 |
not specified | H&Y I, II (16.4 |
not sign. |
| Yoon [27] | 2015 | South Corea | PD (81), Co (52) | case control | PD 21.8 |
PD 55.5% vs. Co 37.2%; p = 0.02 | UPDRS III not significant | sign. |
| Restless Legs Syndrome (RLS) | ||||||||
| Wali [54] | 2018 | Saudi Arabia | RLS (78), Co (123) | case control | RLS: 12.65 ng/mL vs. Co: 26.12 ng/mL, p |
RLS: 75.6% vs. Co: 42.3%, p |
disease severity IRLSSG deficient cases: 19.4 |
sign. |
| Oran [56] | 2014 | Turkey | RLS def (119.); not-def. (36) (out of 155 pts with musculoskeletal symptoms) | case control | Not specified | VitD deficiency (odds ratio [OR] 5.085, p |
Disease severity | sign. |
| Balaban [55] | 2012 | Turkey | f. RLS (36), f. Co (38) | cross sectional study | RLS: 7.31 |
higher deficiency prevalence 83% | disease severity: IRLS scores in females (p = 0.01, r = 0.47) | sign. |
| 10 -item International Restless Legs Syndrome (IRLS) Rating Scale | ||||||||
| Liu [62] | 2021 | China | RLS (57), Co (57) | cross sectional study | RLS: 16.07 vs. Co: 27.0 ng/mL; p |
RLS: 80.7% vs. Co: 1.57%; p |
Disease severity: IRLSSG ratings (r = −0.395, p = 0.002) | sign. |
| Cakir [57] | 2015 | Turkey | RLS def. (57); not-def. (45) (out of 102 pts with lower extremity pain) | cross sectional study | not specified | RLS 90.1% vs. Co 66.3%; deficient: 52.63% vs. non-deficient: 37.78%, p = 0.034 | Disease severity IRLSSG rating scale: No significant correlation | sign. |
| Almeneessier [58] | 2020 | Suadi Arabia | RLS def. (173); not-def. (390) (out of 1,136 non-pregnant women at primary health care) | cross sectional study | not specified | RLS 64% vs. non-RLS: 45%, p |
not specified | sign. |
| VitD deficiency independent predictor of RLS (OR 2.147 (1.612–2.86), p |
||||||||
| Işıkay [59] | 2018 | Turkey | RLS (8), non RLS (218) (out of 226 children with celiac disease) | Cross sectional study | RLS: 9.88 |
not applicable | Symptom severity IRLSSG (r = −0.67, p = 0.04) | sign. |
| Tic Disorder (TD) | ||||||||
| Li [69] | 2017 | China | Tics | cross-sectional study | TD: 23 |
TD 80.3% vs. Co 43.8% | not specified | sign. |
| Li [71] | 2018 | China | Tics | cross-sectional study | TDs: 22.9 |
TDs: 81.6% vs. Co: 55.6% | tic severity, after adjusting for age and BMI (adj. OR = 0.94; 95% CI 0.897–0.989; p = 0.02) | sign. |
| Li [73] | 2019 | China | Tics | cross-sectional study | TDs: 22.9 |
TDs: 81.6% vs. Co: 55.6% | not specified | sign. |
| Bond [70] | 2020 | UK | Tics | cross-sectional study | TDs: 24.3 |
TD: 31.1% vs. Co 39.8% | higher ADHD presence and severity trend with tic severity: Yale Global Tic Severity Scale (YGTSS) (p = 0.84) and Clinical Global Impression (CGI) (p = 0.91) | REVERSED sign. |
| Huntington’s Chorea (HC) | ||||||||
| Chel [81] | 2013 | Netherlands | HC inst. (28) | survey | 33 |
89% | walking disability | not applicable |
| Co, control subjects (healthy or stated otherwise); PD, Parkinson’s disease; HC, Huntington’s chorea; RLS, Restless legs syndrome; ET, Essential Tremor; TD, tic disorder; inst, institutionalized; f, female; m, male; sign., significant. | ||||||||
| Authors | Year | Country | Patients (n) | Study design | Correlation of vitamin D serum levels with: | Study outcome |
| Parkinson’s disease (PD) | ||||||
| Suzuki [36] | 2013 | Japan | 137 | cross-sectional | UPDRS III scores sign difference H&Y stages 1,2 vs. 3,4 | Confirmative for PD motor symptoms |
| Ding [16] | 2013 | USA | 388 | cross-sectional | UPDRS total score (p = 0.02) not for H&Y stage | Partly confirmative for PD motor symptoms |
| Peterson [37] | 2013 | USA | 286 | longitudinal | H&Y stage (r = 0.191, p = 0.0013) and UPDRS III scores (r = 0.242, p = 0.0025) | Confirmative for PD motor symptoms |
| Peterson [30] | 2013 | USA | 40 | cross-sectional | UPDRS III (r = 0.33; p = 0.04) not for H&Y stage | Partly confirmative for PD motor symptoms |
| Senel [38] | 2011 | Turkey | 19 | cross-sectional | H&Y stages (r = 0.69, p = 0.01). | Confirmative for PD motor symptoms |
| Beyazal et al. [21] | 2016 | Turkey | 52 | cross-sectional | UPDRS II and III scores, as well as H&Y stage | Confirmative for PD motor symptoms and activities of daily living |
| Chitsaz et al. [39] | 2013 | Iran | 108 | cross-sectional | Not for H&Y stage and not for UPDRS III scores | Not Confirmative for PD motor symptoms |
| Peterson [37] | 2013 | USA | 286 | longitudinal | verbal fluency and verbal memory (t = 4.31, p |
Confirmative for neuropsychiatric symptoms |
| Zhang [40] | 2019 | China | 182 | cross-sectional | higher depression (p = 0.020) and anxiety-scores (p = 0.009) | Confirmative for neuropsychiatric symptoms |
| Gatto [41] | 2016 | USA | 190 | Cross sectional genetic alalysis | VDR- and FokI polymorphism linked to cognitive decline (p = 0.005) | Confirmative for neuropsychiatric symptoms |
| Kim [42] | 2020 | Korea | 39 | Cross sectional | Reduced odor identification score ( |
Confirmative for sensory symptoms (olfactory impairment) |
| Jang [43] | 2015 | Korea | 55 | Cross sectional | Presence of OH (OR, 0.54; [CI], 0.59–0.86; p |
Confirmative for autonomic symptoms (Orthostatic hypotension (OH)) |
| Kwon [44] | 2016 | Korea | 51 (+20) | Cross sectional | slower gastric emptying time (GET); sign. group differences (PD delayed-GET 11.59 |
Confirmative for autonomic symptoms (impaired gastric motility) |
| Restless Legs Syndrome (RLS) | ||||||
| Wali [54] | 2018 | Saudi Arabia | 78 | case control study | International Restless Legs Syndrome Study Group rating scale (IRLSSG-RS) increased disease severity; sign. group differences (IRLSSG of deficient cases: 19.4 |
Confirmative for motor symptoms |
| Balaban [55] | 2012 | Turkey | 36 | cross sectional | increased disease severity | Confirmative for motor symptoms |
| Liu [62] | 2021 | China | 57 | cross sectional | IRLSSG ratings (r = −0.395, p =0.002), Pittsburgh Sleep Quality Index (PSQI) score (r = −0.304, p =0.022), and Hamilton Depression Rating Scale (HAMD |
Confirmative for motor and neuropsychiatric symptoms |
| Işıkay [59] | 2018 | Turkey | 8 | cross sectional | IRLSSG (r = −0.67, p = 0.04) | Confirmative for motor symptoms |
| Cakir [57] | 2015 | Turkey | 66 | cross sectional | not with IRLSSG | Not confirmative for motor symptoms |
| Tic Disorder (TD) | ||||||
| Li [73] | 2019 | China | 179 | cross-sectional | Yale Global Tic Severity Scale (YGTSS) total scores (rs = −0.32, p |
Confirmative for motor symptoms |
| Bond [70] | 2020 | UK | 320 | cross-sectional | Not with Yale Global Tic Severity Scale (YGTSS) (p = 0.84) not with Clinical Global Impression (CGI) (p = 0.91); Reduced ADHS risk with increased in VitD levels (OR 0.55, 95% CI 0.36–0.84, p = 0.01) and inverse correlation with ADHD symptom severity ( |
Confirmative for neuropsychiatric symptoms. Not confirmative for motor symptoms |
| Huntington’s Chorea (TD) | ||||||
| Chel [81] | 2013 | Netherlands | 28 | cross-sectional | Functional Ambulation Classification (FAC) scores (p = 0.023) | Confirmative for motor symptoms |
| Dystonia | ||||||
| Serefoglu Cabuk [93] | 2020 | Turkey | 20 | cross-sectional | Jankovic severity scale for essential blepharospasm (r = −0.375, p = 0.043) | Confirmative for motor symptoms |
| UPDRS, Unified Parkinson’s Disease Rating Scale; H&Y, Hoehn and Yahr stages; sign., significant. | ||||||
| Diseases | Author | year | Country | Sub-jects (n) T/C | Study design | Period | Dose (application) | Clinical effect | Other effects |
| Parkinson’s disease | Hiller [51] | 2018 | USA | 27/24 | RCT | 16 w | 10,000 IU/d (p.o.) | Balance improvement | no adverse events |
| Habibi [52] | 2018 | Iran | RCT | 12 w | 1000 IU/d (p.o.) | no improvement | |||
| Suzuki [36] | 2013 | Japan | 56/58 | RCT | 12 m | 1200 IU/d (p.o.) | stabilizing effect | no adverse events | |
| RLS | Wali [66] | 2015 | Saudi Arabia | def. pts (12) | open label | 12 w | 28,000 IU/w (p.o) or 200,000 IU/m (i.m.) | improvement | vitamin D serum level correction |
| Wali [67] | 2019 | Saudi Arabia | all pts (22) | RCT | 12 w | 50,000 IU/w (p.o.) | no improvement | ||
| Tutuncu [115] | 2020 | Turkey | def. pts (19) | SCCS | 8 w | 50,000 IU /w (p.o.) | improvement | vitamin D serum level increase | |
| Tics | Gemawat [116] | 2017 | India | all pts (34) | RCT | 24 w | not specified | improvement | |
| Li [73] | 2019 | China | 36 def. pts /84 (5–14 ys) | open lable | 12 w | 300 IU/kg/d ( |
improvement | vitamin D serum level increase | |
| Dyskinesia L-dopa-induced | Habibi [52] | 2018 | Iran | all pts (120) | RCT | 12 w | 1000 IU/d (p.o.) | no improvement | |
| RCT, randomized controlled trial; SCCS, prospective self-controlled case study;
n.s., not specified; p.o., per os; i.m., intra muscular; /d, daily; /w, weekly;
/m, monthly.
def. pts.: Vitamin D deficient patients ( | |||||||||
References
Publisher’s Note: IMR Press stays neutral with regard to jurisdictional claims in published maps and institutional affiliations.