


1 Department of Functional Neurosurgery, Sanbo Brain Hospital, Capital Medical University, 100093 Beijing, China
2 Department of Neurology, Sanbo Brain Hospital, Capital Medical University, 100093 Beijing, China
Abstract
Microvascular decompression is the first choice for treating the primary
trigeminal neuralgia to provide the most extended duration of pain freedom.
However, in microvascular decompression, we found that this kind of operation is
only suitable for some patients. It is of great value to objectively judge the
function and abnormality of the trigeminal pain conduction pathway in guiding the
operation process. This brief report investigates the value of pain evoked
potential by electrical stimulation and noceciptive blink reflex in trigeminal
neuralgia. We detected the pain evoked potential in 34 patients with trigeminal
neuralgia and 48 healthy controls treated by electrical stimulation and blink
reflex. We demonstrated no significant differences in the latencies of V
Keywords
- Trigeminal neuralgia
- Electrical stimulation
- Pain evoked potential
- Noceciptive blink reflex
Trigeminal neuralgia (TN), including primary TN and secondary TN, is the most common neuralgia in brain diseases or neuropathic pain [1]. It is characterized by recurrent electric shock, transient and severe pain in the area of facial trigeminal nerve distribution [2]. Globally, 15 out of 100,000 people suffer from trigeminal neuralgia [3]. In addition, it was reported that the prevalence rate of females was higher than that of males, the incidence rate of the right side was higher than that of the left side, and it was more common in middle-aged and older people [4]. Trigeminal neuralgia seriously affects people’s daily work and life and will have a specific impact on mental health [5].
Up to now, the main treatments for trigeminal neuralgia are drug therapy, including carbamazepine (CBZ) and oxcarbazepine (OXC) [6], gamma knife radiosurgery (GKRS) [7], percutaneous balloon compression (PBC) [8], glycerol rhizotomy (GR) [9], radiofrequency thermocoagulation (RFTC) [10], microvascular decompression (MVD) [11] and so on. Based on the vascular compression theory [12]. MVD is the first choice for the treatment of primary TN to provide the most prolonged duration of pain freedom [13]. However, in MVD, we found that this operation is only suitable for some patients but not for other patients [14]. Therefore, the microscopic endoscopic-assisted (MEA) technique was used when the conflict was not identified under microscopic view or was not certainly resolved. In patients with ineffective MVD, trigeminal nerve combing and partial sensory root section (PSRS) are used for treatment [15, 16]. Therefore, it is of great value to objectively judge the function and abnormality of the trigeminal pain conduction pathway in guiding the operation process. The purpose of this study was to investigate the clinical diagnostic value of pain evoked potential by electrical stimulation and nociceptive blink reflex (NBR) in TN.
The Ethics committee approved this work based on 34 patients with TN diagnosed
in our Hospital between March 2015, and May 2017 were included as the observation
group. There were 14 men and 20 women aged 17 to 78 years with an average age of
(54.09
Electromyography/evoked potential instrument (Oxford Medelec Synergy Plinth) and
concentric pain stimulation electrode (inomed) were used for electrophysiological
measurement. The temperature of the operation room is controlled at 22–26
Before the examination, the subjects lay on their back, closed their eyes slightly and avoided eye rotation, teeth biting and swallowing. The subjects were instructed to memorize the stimulation times to concentrate on preventing interference in the experiment.
First of all, the pain stimulation thresholds of patients were determined. From 0 to 2 mA, each stimulation was increased by 0.2 mA. One round in ascending and one round in descending was performed to determine the threshold of pain stimulation. The sharp sensory threshold was 0.2–0.6 mA, and the pain sensation threshold was 0.3–1.3 mA. More than 2 mA was easy to excite deep A-b fibers. Secondly, the time course of square wave stimulation was 0.5 ms when the electrodes were placed 1 cm above the supraorbital foramen, 1 cm below the infraorbital foramen, or 1 cm outside the mental foramen. Several consecutive string stimulations (2–5) were separated by 5 ms, each series of stimulation period was 12–18 s, and the number of times of bridging was 15. Besides, the number of times of bridging can be set according to the result. Next, record the results. Pain-related evoked potentials (PREP) were located in the central zone (CZ), and the reference electrode was located on the same side of the ear. NBR was located in the bilateral infraorbital margin. Bandwidth ranged from 1 Hz to 1 kHz, sampling frequency was 2.5 kHz and scanning time was 300 ms. The data included pain evoked potential and pain induced NBR.
The normal values of latency and amplitude of pain evoked potential and NBR was determined according to the standard of a healthy person in the control group.
Statistics for all data were performed using the software package Systat 10.2
(Systat Software Inc., San Jose, CA). The measurement data were expressed as mean
The latencies of V
| Groups | Affected side | Contralateral side | t values | P values | |
| Cases | 34 | 34 | - | - | |
| Latencies (ms) | V |
113.04 |
105.15 |
0.531 | 0.143 |
| V |
109.87 |
117.90 |
0.386 | 0.645 | |
| V |
111.95 |
111.38 |
0.657 | 0.331 | |
| R |
44.59 |
46.55 |
0.015 | 0.076 | |
| Amplitudes (mV) | V |
24.02 |
22.33 |
0.043 | 0.981 |
| V |
23.15 |
23.09 |
1.143 | 0.067 | |
| V |
26.73 |
21.93 |
0.194 | 0.952 | |
| R |
322.82 |
268.35 |
0.595 | 0.148 | |
The latencies of V
| Groups | Affected side in the observation group | Same side in the control group | t values | P values | |
| Cases | 34 | 34 | - | - | |
| Latencies (ms) | V |
113.04 |
119.48 |
0.931 | 0.354 |
| V |
109.87 |
118.75 |
1.198 | 0.234 | |
| V |
111.95 |
122.95 |
1.423 | 0.158 | |
| R |
44.59 |
42.55 |
0.412 | 0. 681 | |
| Amplitudes (mV) | V |
24.02 |
46.65 |
- | 0.0001* |
| V |
23.15 |
46.53 |
- | 0.0001* | |
| V |
26.73 |
38.60 |
- | 0.0001* | |
| R |
322.82 |
422.87 |
- | 0.0001* | |
| *P | |||||
The ROC curve analysis showed that the area under the curve (AUC), sensitivity
and specificity of the combined diagnosis of latency and amplitude of V
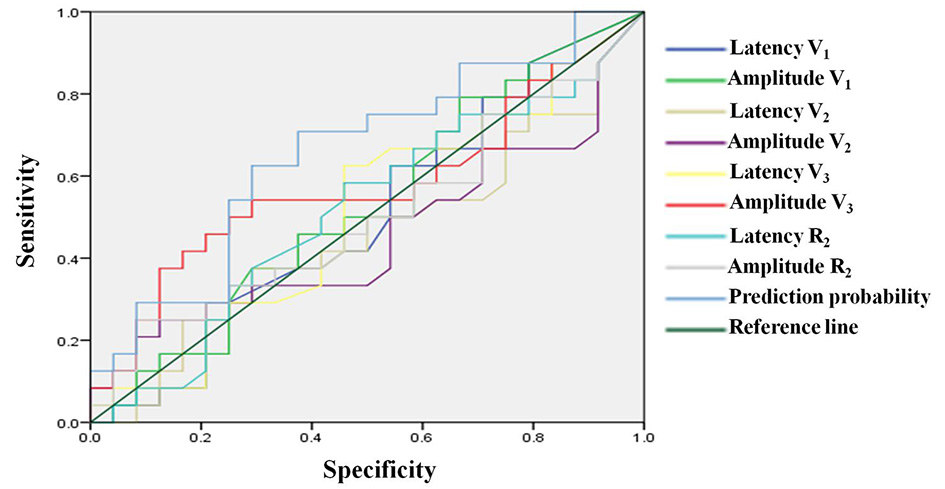 Fig. 1.
ROC curve of electrophysiological indicators for diagnosis of trigeminal neuralgia.
| Groups | Sensitivity | Specificity | Youden index | Standard error | AUC (95% CI) |
| Latency V |
0.79 | 0.29 | 0.08 | 0.085 | 0.500 (0.334–0.666) |
| Amplitude V |
0.79 | 0.33 | 0.13 | 0.084 | 0.526 (0.360–0.692) |
| Latency V |
0.38 | 0.71 | 0.08 | 0.085 | 0.455 (0.289–0.621) |
| Amplitude V |
0.25 | 0.87 | 0.13 | 0.086 | 0.453 (0.285–0.621) |
| Latency V |
0.63 | 0.54 | 0.17 | 0.085 | 0.505 (0.339–0.672) |
| Amplitude V |
0.54 | 0.71 | 0.25 | 0.085 | 0.576 (0.410–0.743) |
| Latency R |
0.08 | 0.83 | 0.17 | 0.085 | 0.516 (0.349–0.682) |
| Amplitude R |
0.25 | 0.92 | 0.17 | 0.085 | 0.503 (0.337–0.670) |
| Combined diagnosis | 0.63 | 0.71 | 0.33 | 0.080 | 0.658 (0.502–0.814) |
TN is a kind of recurrent neuropathic pain characterized by the sudden appearance, short duration, and acupuncture-like pain on one side of the face. It often involves one or more trigeminal nerves [18]. A previous epidemiological survey showed that the onset age of TN was mainly 37–67 years old, the ratio of male to female was about 1 : 3 [19]. At present, the pathogenesis of TN has not been clear, mainly including “peripheral pathogenic theory” and “central pathogenic theory”. The most popular peripheral pathogenic theory is vascular compression theory, which holds that demyelination of trigeminal nerve is the key to TN [20, 21]. According to the theory of central pathogenesis, the key to TN is the impairment of the nerve fiber network and functional connection in the spinal trigeminal nucleus, brain stem, thalamus and cerebral cortex [22, 23, 24].
Physiological examination of pain evoked potential by electrical stimulation is
a new, fast and convenient examination to judge the nerve function of patients
with pain. It can stimulate the skin of the trigeminal nerve distribution area
through a specially designed concentric electrode, which can excite the pain
nerve fibers of the corresponding area alone to objectively judge the function
and abnormality of the trigeminal pain conduction pathway [25]. Blink reflex (BR)
is a critical electrophysiological method to detect trigeminal and facial nerve
injury [26]. In addition, BR, including early response R
We found that the latency and amplitude of V
ROC curve analysis showed that the AUC, sensitivity and specificity of the ROC
curve of the joint diagnosis of the latency and amplitude of V
In conclusion, our results suggested that TN can be effectively diagnosed by combining pain evoked potential by electrical stimulation and BR. The pathogenesis of trigeminal neuralgia should be combined with peripheral pathogenicity and the theory of central pathogenicity.
TN, Trigeminal neuralgia; OXC, oxcarbazepine; GKRS, gamma knife radiosurgery; PBC, percutaneous balloon compression; RFTC, radiofrequency thermocoagulation; MVD, microvascular decompression; PSRS, partial sensory root section; BR, blink reflex; AUC, area under curve; NBR, nociceptive blink reflex.
JR and GL conceived and designed the experiments; YH, YL, XZ performed the experiments; JR, YH, YL and XZ carried out clinical studies; JR analyzed the data; JR contributed definition of intellectual content and literature research; YL, XZ contributed data acquisition; JR and YH wrote the paper. GL reviewed the paper.
The ethics committee approved this work of the Sanbo Brain Hospital, Capital Medical University. In addition, written informed consent was obtained from all individual participants included in the research.
Not applicable.
This work was supported by the Beijing Municipal Science & Technology Commission’s grants/Award Number: Z141107002514152.
The authors declare no conflict of interest.