


 , Wenfeng Zheng 2, Dongri Shan 1, Qi Yuan 3, Weidong Zhou 4
1 School of Electronic and Information Engineering (Department of Physics), Qilu University of Technology (Shandong Academy of Sciences), Jinan, Shandong Province, 250353, P. R. China
2 School of Electrical Engineering and Automation, Qilu University of Technology (Shandong Academy of Sciences), Jinan, Shandong Province, 250353, P. R. China
3 Shandong Province Key Laboratory of Medical Physics and Image Processing Technology, School of Physics and Electronics, Shandong Normal University, Jinan, Shandong Province, 250358, P. R. China
4 School of Microelectronics, Shandong University, Jinan, Shandong Province, 250100, P. R. China
Abstract
One of the challenges in brain-computer interface systems is obtaining motor imagery recognition from brain activities. Brain-signal decoding robustness and system performance improvement during the motor imagery process are two of the essential issues in brain-computer interface research. In conventional approaches, ineffective decoding of features and high complexity of algorithms often lead to unsatisfactory performance. A novel method for the recognition of motor imagery tasks is developed based on employing a modified S-transforms for spectro-temporal representation to characterize the behavior of electrocorticogram activities. A classifier is trained by using a support vector machine, and an optimized wrapper approach is applied to guide selection to implement the representation selection obtained. A channel selection algorithm optimizes the wrapper approach by adding a cross-validation step, which effectively improves the classification performance. The modified S-transform can accurately capture event-related desynchronization/event-related synchronization phenomena and can effectively locate sensorimotor rhythm information. The optimized wrapper approach used in this scheme can effectively reduce the feature dimension and improve algorithm efficiency. The method is evaluated on a public electrocorticogram dataset with a recognition accuracy of 98% and an information transfer rate of 0.8586 bit/trial. To verify the effect of the channel selection, both electrocorticogram and electroencephalogram data are experimentally analyzed. Furthermore, the computational efficiency of this scheme demonstrates its potential for online brain-computer interface systems in future cognitive tasks.
Keywords
- Brain-computer interface
- motor imagery
- signal processing
- electrocorticogram
- optimized wrapper approach
- neural coding
- evoked potentials
Brain-computer interface (BCI) is an artificial communication system between a human brain and the external world. It translates brain activities into instructions for external devices (Nguyen et al., 2018; Xu et al., 2016). Motor imagery (MI) is the mental performance of movement without muscle activities (Islam et al., 2018; Ryu et al., 2016). MI-based BCI systems (MI-BCIs) translate motor intentions of a subject into commands by classifying different tasks obtained from brain signals (Guan et al., 2019; Jafarifarmand et al., 2018). Individuals can then express ideas or manipulate devices not through language or action but via an MI-BCI. Such interfaces have been widely employed for investigations in healthy human subjects, as well as in those suffering from muscle weakness due to severe nervous system disorders. Brain signals used for BCI control reflect the overall electrophysiological properties of the primary motor cortex, namely corticocortical evoked potentials (Hamedi et al., 2016). A sensorimotor rhythm (including μ and β rhythms) recorded over a sensorimotor cortex are modulated by MI. Task-related modulations in the sensorimotor rhythms manifest as event-related desynchronization/event-related synchronization (ERD/ERS) phenomena (Pfurtscheller and Da Silva, 1999; Żygierewicz et al., 2005).
A vital issue for MI-BCIs is to effectively acquire discriminant information in the sensorimotor rhythms. Brain function activities are dynamic, irregular, transient, and nonstationary, particularly those related to cognitive and behavioral events (Faust et al., 2015; Mu et al., 2018; Thilaga et al., 2016). Temporal-frequency features provide powerful representations for analyzing non-stationary signals. To date, many such features have been proposed to identify task-related modulation in the sensorimotor rhythms including, short-time Fourier transform (STFT), independent component analysis, wavelet transform (WT), common spatial pattern (CSP), Hilbert-Huang transform (HHT) and S-transform (ST). ST is a time-frequency representation method with frequency-independent resolution (Stockwell et al., 1996).
Li et al. (2009) and Wei and Tu (2008) extracted CSP features and combined them with traditional classifiers to identify different MI tasks. Although the computational complexity is low, the accuracy of the algorithm is not ideal. Chong et al. (2010) built a BCI system based on band power (BP) features and combined with some classifiers. Still, the computational complexity of the algorithm was relatively high. Chang and Yang (2018) used the ST feature and a Bayes linear discriminant analysis (BLDA) classifier to design a BCI classification model, which achieved satisfactory classification results. However, the number of selected feature subsets was high, and its efficiency was not excellent. The ST, which provides a temporal-frequency representation with the frequency-dependent resolution, is an extension of WT (Chang and Yang, 2018; Xu et al., 2014; Zhang et al., 2016). A modified S-transform (MST) algorithm is a multi-resolution temporal-frequency representation method. It is ideal for the analysis of brain activities as it can dynamically adjust the width of a window to obtain better energy concentration in the temporal-frequency domain (Assous and Boashash, 2012; Zheng et al., 2019).
Many pattern classification methods have been widely employed at the classification stage to assess the performance of MI-BCIs, amongst others, k-nearest neighbor (KNN), Fisher linear discriminant analysis (FLDA), naive Bayes classifier, gradient boosting (GB), BLDA and support vector machine (SVM). The SVM is one of the most commonly used classifiers in feature detection (Acharya et al., 2015; Li et al., 2008). It maps the input vector to a high-dimensional feature space through an appropriate nonlinear mapping (Chang et al., 2010). It has many advantages for the classification of both small and nonlinear samples.
It is worth noting that channel selection is receiving increasing research attention due to its role in reducing the data dimension of multi-channel brain signals, thus improving the accuracy of BCI systems. Channel selection and feature selection are similar in principle (Wang et al., 2017), allowing feature selection algorithms to be applied to a channel selection procedure. Feature selection is commonly comprised of filter, wrapper, and embedded approaches (Chang and Yang, 2018; Maldonado et al., 2014).
Although many MI-BCIs have been developed, few provide fast and effective systems. Dong et al. (2017) built a BCI system by developing a hierarchical SVM method combined with the wavelet packet transform. This system has realized the classification of four types of MI tasks, but it is challenging to meet the requirements of the real-time BCI system due to low accuracy.
Jafarifarmand et al. (2018) proposed a new framework based on an artifact rejected CSP and neuro-fuzzy classifier. Although this BCI system has high classification accuracy, it does not have an advantage inefficiency. To design an efficient and feasible MI-BCI, how to obtain useful features, match appropriate classifiers, and effectively reduce feature dimensions are still open problems. The proposed framework employs MST for spectro-temporal representation, an SVM classifier with a radial basis function (RBF) kernel to identify different MI-based tasks, and introduces an optimized wrapper approach for channel selection.
MI-BCIs comprises three main steps: signal acquisition, signal decoding, and signal application (Nicolas-Alonso et al., 2015; Xu et al., 2014). Fig. 1 gives a general flowchart for an MI-BCI. In the signal acquisition stage, brain activities are recorded by both invasive (i.e., electrocorticography, ECoG) and noninvasive (i.e., electroencephalogram, EEG) techniques (Xu et al., 2014; Zhang and Wei, 2019). EEG recorded over the scalp has been broadly applied due to its noninvasiveness. ECoG has a higher signal-to-noise ratio, broader bandwidth, and better spatial resolution than EEG signals (Chong et al., 2010; Xu et al., 2014). The signal decoding stage, primarily including preprocessing, feature extraction, and classification, is the main component of a BCI system.
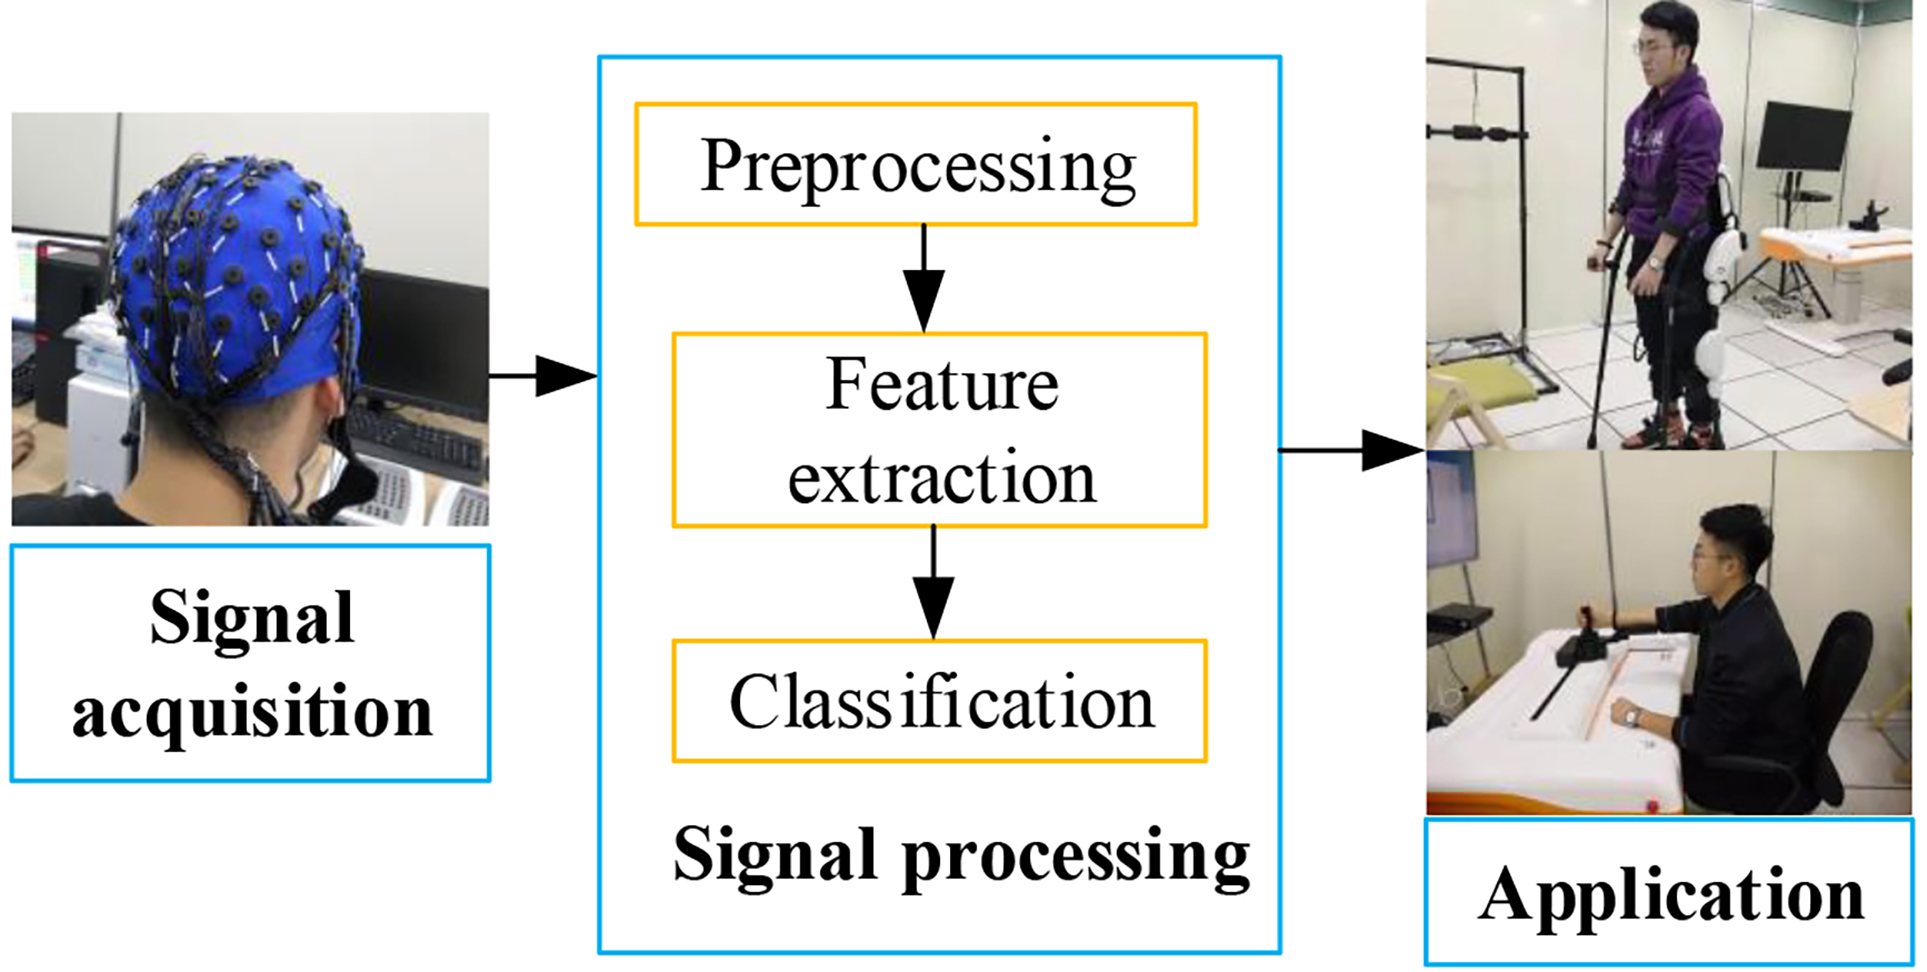 Figure 1.
A general flowchart for an MI-BCI. It generally consists of three steps: signal acquisition, signal processing, and signal application. The subject provided written informed consent for the publication of his image.
The overall system was installed on a machine with a 3.7 GHz Intel Core i7 processor, and the experiment was run in a MATLAB 2017 environment. The MST-based BCI scheme includes four major blocks: preprocessing, feature extraction, classification, and channel selection. A schematic diagram is given in Fig. 2 (Lal et al., 2004). It is preprocessing aims to downsample. Feature extraction extracts spectral characteristics associated with MI tasks by using the MST algorithm in the temporal-frequency plane. Classification identifies different MI tasks. The purpose of channel selection is to reduce the computational complexity of the algorithm.
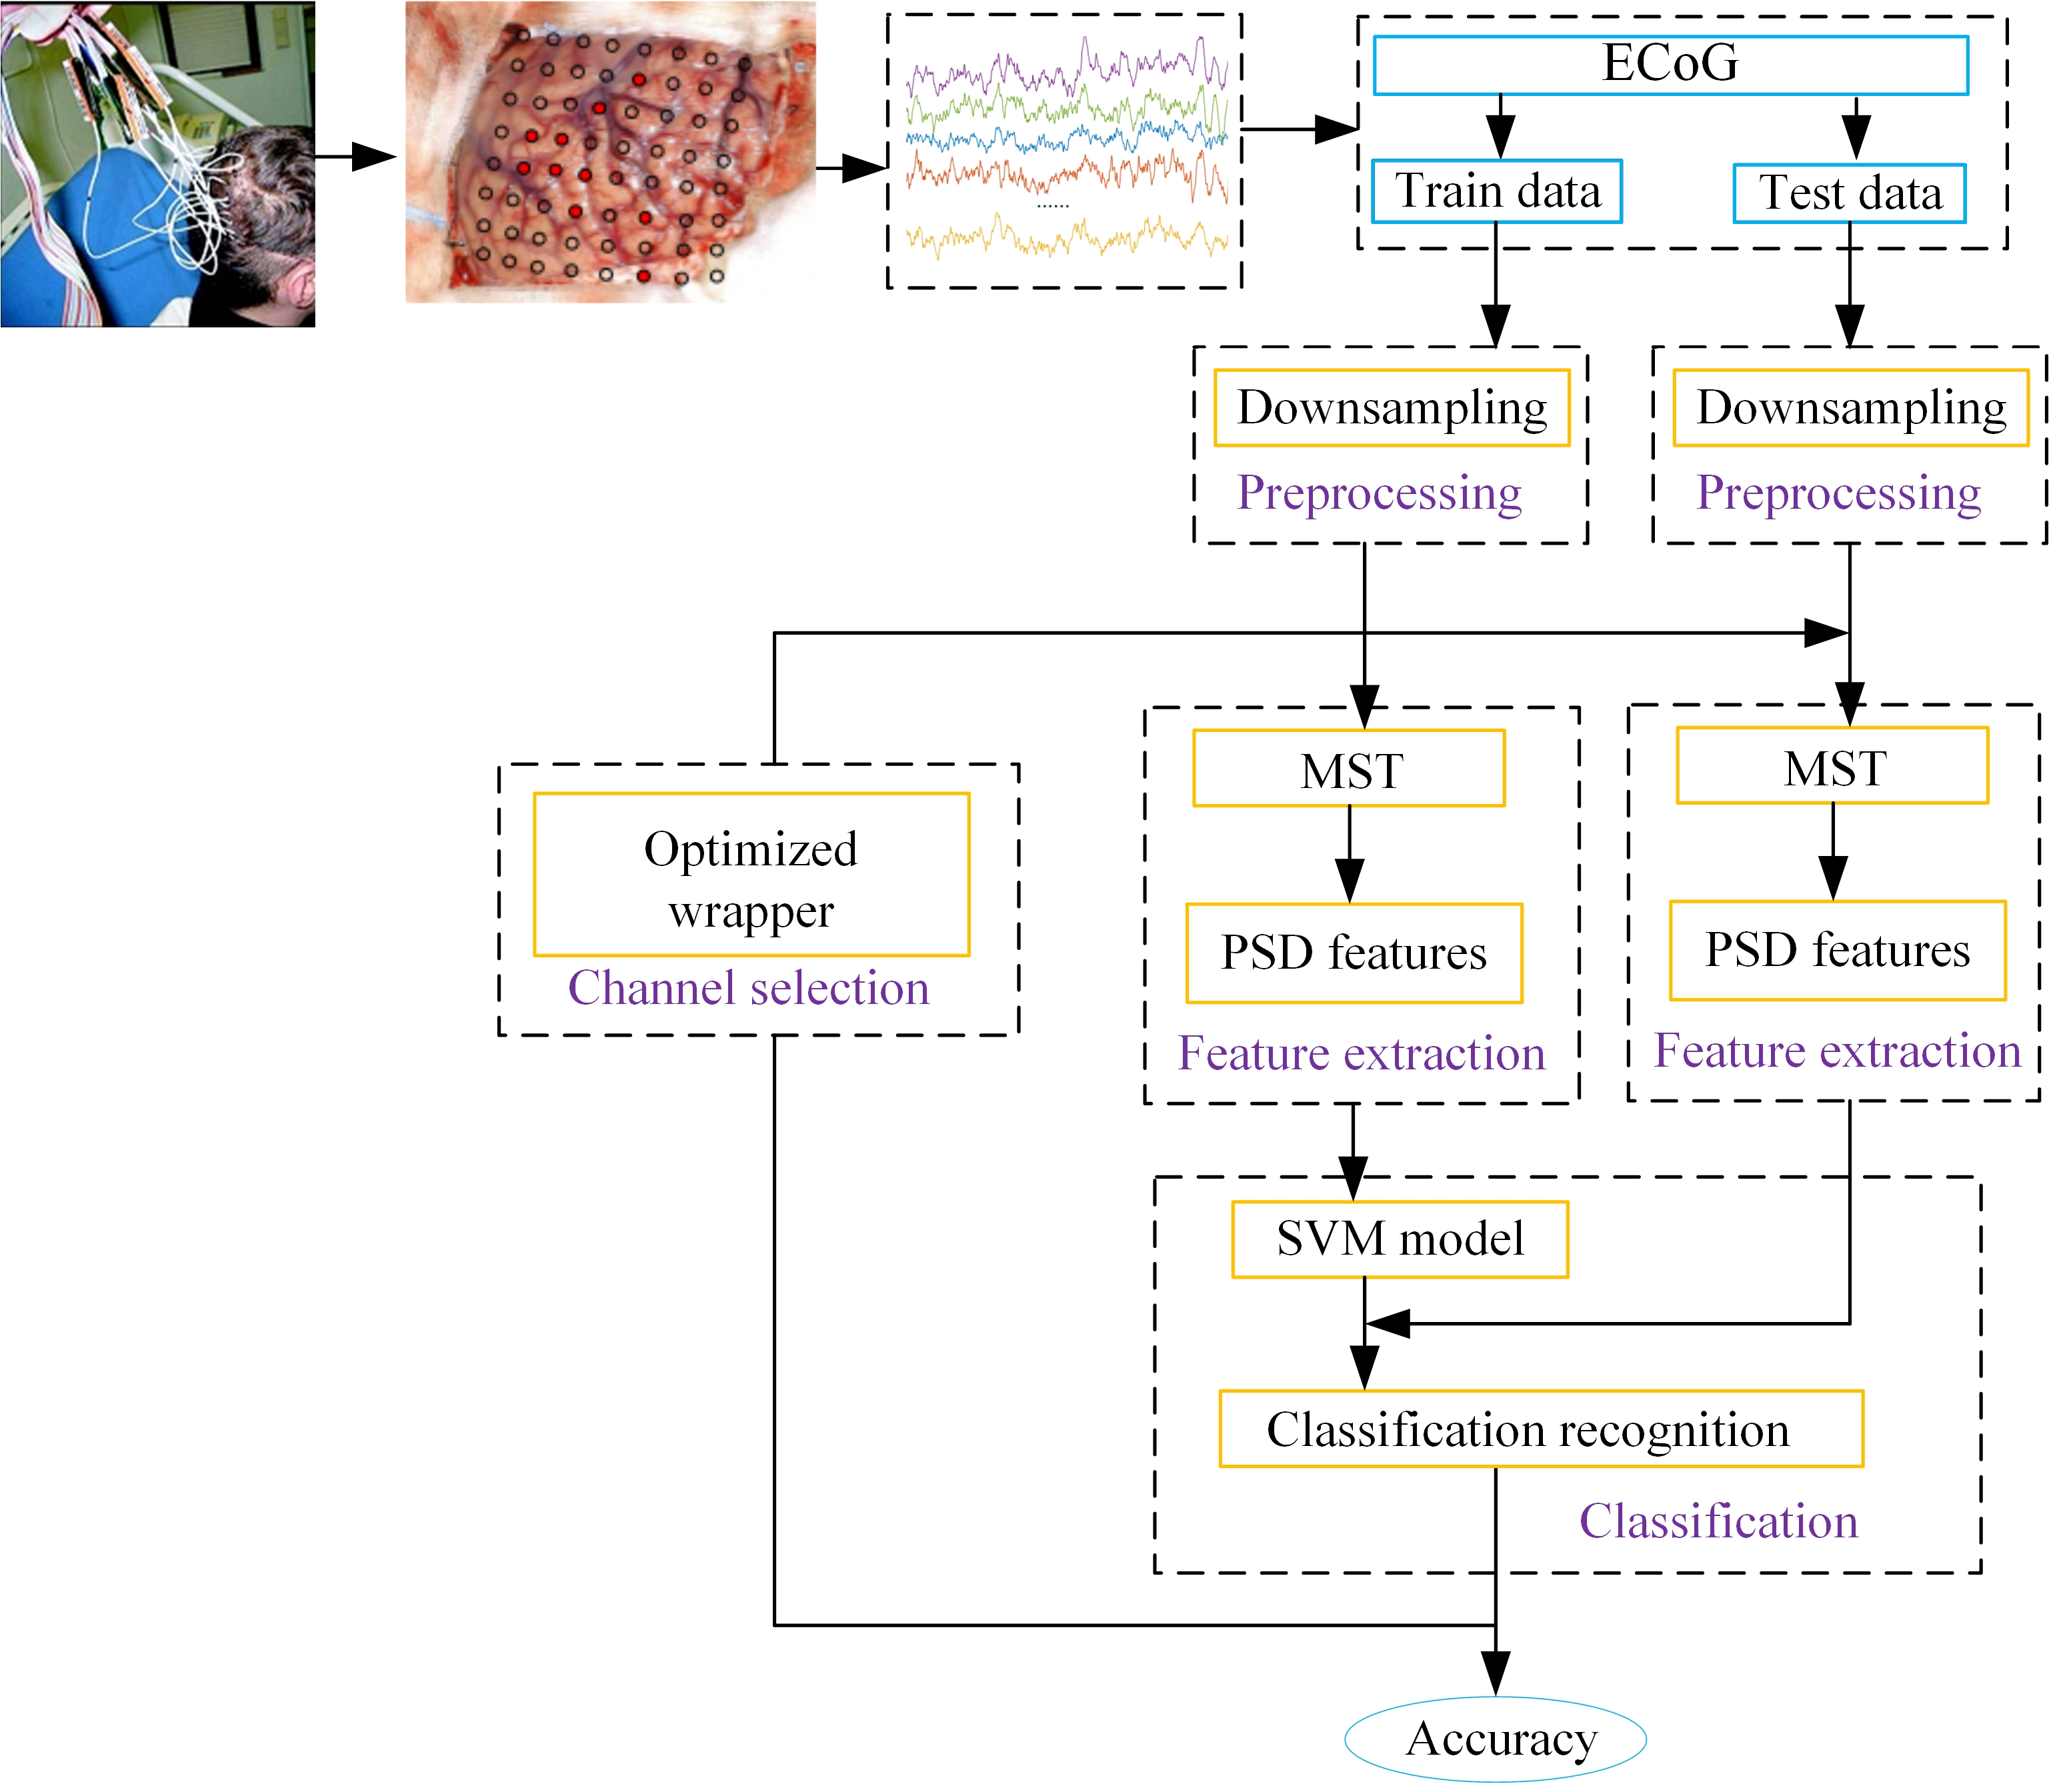 Figure 2.
Schematic diagram of the MST-based BCI system. This scheme uses an SVM to classify ECoG features extracted by the MST, and the optimized wrapper approach is applied to channel selection to implement representation selection. ECoG data was recorded by placing 64 electrodes on the location of the cerebral cortex from the motor area of an epilepsy patient. This ECoG dataset becomes an international public dataset with the consent of the subjects.
MST is employed to extract the power spectral density (PSD) features from preprocessed ECoG epochs. Channel selection is then performed by using an optimized wrapper approach to obtain the appropriate channels for MI recognition. Finally, the SVM identifies different MI tasks. The performance of the MI-BCI is defined by its classification accuracy and algorithmic complexity.
Experimental data derived from the BCI Competition III dataset I is one of the most representative public ECoG datasets. It contains ECoGs of a subject suffering from focal epilepsy. During the recording of ECoG signals, the subject performs imagined movements of either the left little finger or the tongue according to a prompt. ECoG epochs are recorded from an 8 × 8 ECoG platinum electrode grid located on the right motor cortex. Recording duration starts 0.5 seconds after the end of a visual cue to avoid visually evoked potentials (Xu et al., 2014). The cues for left little finger and tongue are random and equally probable. A timing scheme of an experiment for ECoG is given in Fig. 3 (Lal et al., 2004). The sampling rate of all recordings is 1000 Hz. To classify the two imagined movements, 278 trials were recorded on the first day as a training dataset, and another l00 trial recorded a week later to provide the test dataset. The training and test dataset are in the format of trials × channels × samples. Dataset I is analyzed to evaluate the algorithm to be tested. It is challenging for classification when the training and test data are recorded approximately one week apart. The subject might be in a different state with regard to motivation and fatigue, etc. Moreover, recording equipment may vary slightly in electrode position and impedance. Dateset I can be downloaded from http://www.bbci.de/competition/iii/desc_I.html.
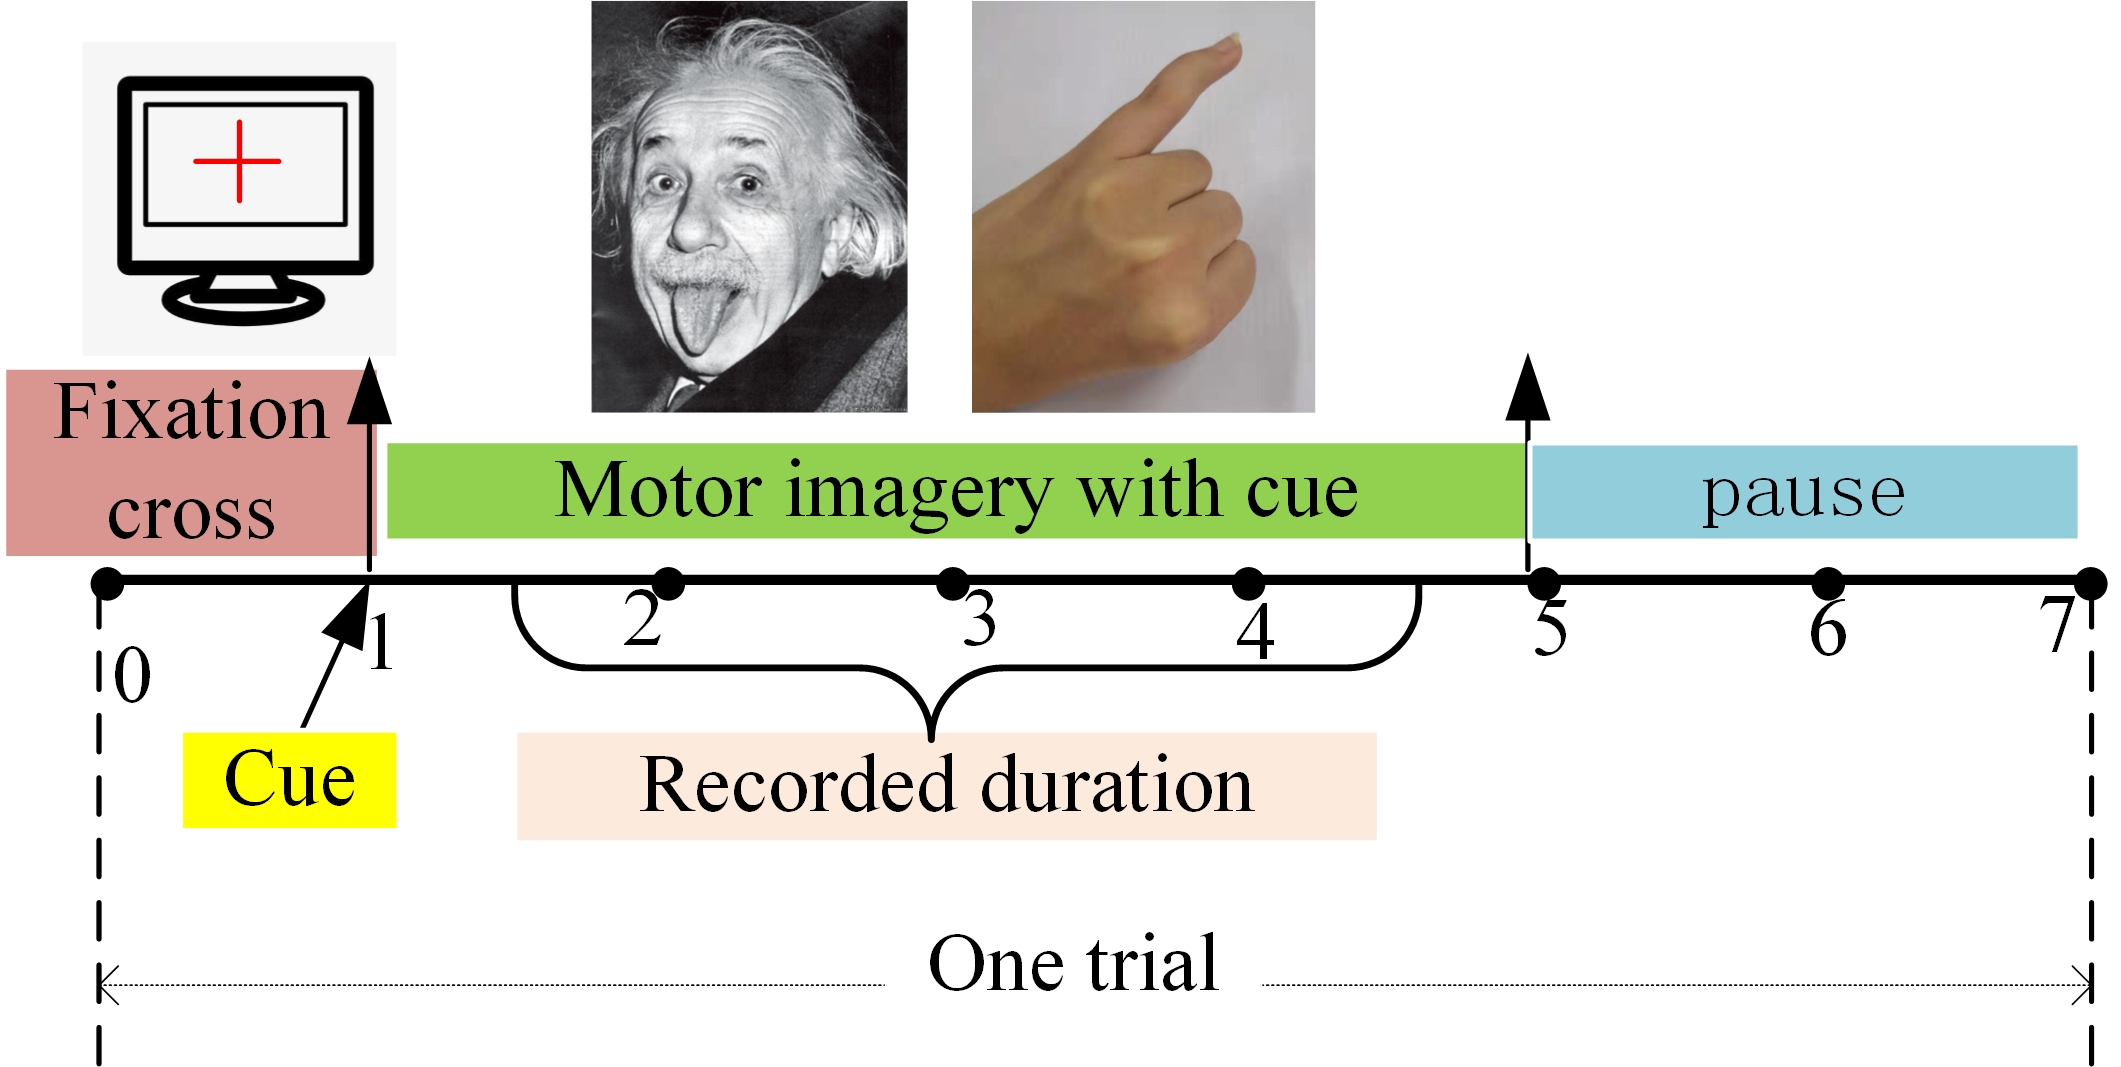 Figure 3.
Experimental paradigm for motor imagery. During the ECoG signals recording, the subject performs imagined movements of either the left pinky or the tongue according to a prompt. Recording starts 0.5 seconds after the end of a visual cue to avoid visually evoked potentials.
Here, the focus is on analyzing and processing of ECoG signals. However, to verify the effectiveness of the proposed scheme, we also tested on the EEG dataset from the BCI competition III dataset IVa. There were 280 MI trials contained in this dataset, which were divided into 224 training trials and 56 test trials. During the BCI experiment, following visual cues, subjects imagined the movement of their right hand or foot for 3.5 seconds. Data were collected from 118 channels via EEG acquisition equipment (sampling frequency 100 Hz)1(Dateset IVa can be downloaded from http://www.bbci.de/competition/iii/desc_IVa.html.).
The preprocessing procedure primarily down samples raw ECoG signals from 1000 Hz to 100 Hz. Downsampling reduces the dimension of data and improves algorithm efficiency.
Feature extraction is a critical step for decoding ECoG signals. Extracting valid feature information is essential for improving algorithm performance. Autoregressive model (AR) coefficients, BP, local binary pattern (LBP), and MST are effective feature extraction tools.
AR analysis, which describes the intrinsic spectral components of model coefficients, is a method for processing temporal signals. The p-order AR model of one-dimensional time series x(t)can be calculated as:
where x(n) is the nth sample of an ECoG epoch x(t), $m_{i}$ is the AR coefficient, e(n)represents the error term, and p is the model order.
The calculation of BP can be summarized as: first, set a frequency range with relatively concentrated energy, then calculate the power of a single time-domain signal in each frequency band.
LBP used to describe local texture features, is an operator with rotational invariance. The histogram distribution produced by the LBP operator is a feature with superior performance (Xu et al., 2016). It can be expressed as:
where riu(2)represents the invariant rotation mode, $g_{c}$ is the gray value of the central pixel, $g_{i}$ is the gray value of the neighborhood pixel (i=0,1,…,P-1),R, is the radius of the neighborhood setting, P is the number of neighboring pixels, s(x) is the sign function, and U represents the number of spatial transformations.
The PSD representations, which contain specific feature attributes, are redefined by using MST in the temporal-frequency plane to identify different MI tasks. The MST algorithm is based on STFT and WT.
Traditional signal analysis based on STFT exports temporal-frequency information from ECoG epochs. The STFT of the ECoG epochs x(t) is defined as:
Where $g(t-\tau)$ is the window function. STFT is a good signal processing technique for the analysis of non-stationary signals (Chikkerur et al., 2005). The disadvantage is that the STFT window size is fixed in the time and frequency domains. Furthermore, it does not possess concurrent high-frequency and time resolution (Del Pozo-Banos et al., 2015; Xu et al., 2019).
WT can be regarded as an extension of STFT (Taghizadeh-Sarabi et al., 2015), which provides a window that is variable in the time and frequency domains. The WT of the ECoG epochs x(t) is defined as:
Where n is the scaling factor and $\tau$ is the time-shifting factor, $ \varphi^{*}(\frac{t- \tau}{n})$ represents wavelet generating function, which has two parameters n and $\tau$.x However, WT has the shortcoming of both poor time resolution at low frequency and poor frequency resolution at high frequency.
ST has properties of the STFT and WT since it adopts both a Fourier kernel and a variable window function (Dash et al., 2003; Stockwell et al., 1996). The advantage of ST is that it not only retains the phase information of a signal but also provides a variable resolution analogous to WT (Senapati and Routray, 2011; Stockwell et al., 1996). The ST of the ECoG epochs x(t)is defined as:
where $\tau$ is the time-shifting factor, $g(\tau-t,f)$ stands for window function and is a Gaussian function with variable scale, which can be defined as
Where $\sigma_{2}$ is a function of frequency f, as in
Non-zero frequency f adjusts the window width, thus controls the resolution (Senapati and Routray 2011; Vijean et al., 2011; Xu et al., 2014).
MST, which extends ST (Assous and Boashash 2012; Chang and Yang 2018; Zhang et al., 2016), is a powerful temporal-frequency analysis tool for non-stationary and non-linear signals. MST introduces the parameters p and q into the ST Gaussian window function to flexibly adjust the resolution:
Where p and q are scale factors that determine the width and height of the Gaussian window. In the time domain, the window is wider at lower frequencies and provides excellent frequency resolution. At higher frequencies, the window is narrower and provides better time resolution (Xu et al., 2014). To extract the most valid feature information, optimal scale factors are found by regulating the window size. These factors provide better energy concentration in the temporal-frequency space.
The PSD function, which represents the distribution of signal power, is a fundamental measure in spectrum analysis (Xu et al., 2014; Zheng et al., 2019). In the algorithm described here, the PSD represents the power variation of specific frequency bands. The PSD function based on the MST is redefined as:
The PSD features of the MST are the mathematical expectation between the time-series MST and its conjugate, where E(·) represents mathematical expectation.
In this algorithm, the spectro-temporal representations from ECoG signals are extracted within the frequency range of 1-35Hz, where μ and β rhythms reveal ERD/ERS phenomena over the sensorimotor cortex. The number of extracted features is determined according to the frequency range. For each frequency, the PSD value can be calculated from the MST. For each trial, 35 MST-based feature vectors are extracted from each channel. Each trial extracts 64 × 35 features. The MST-based PSD feature matrix is given in Fig. 4.
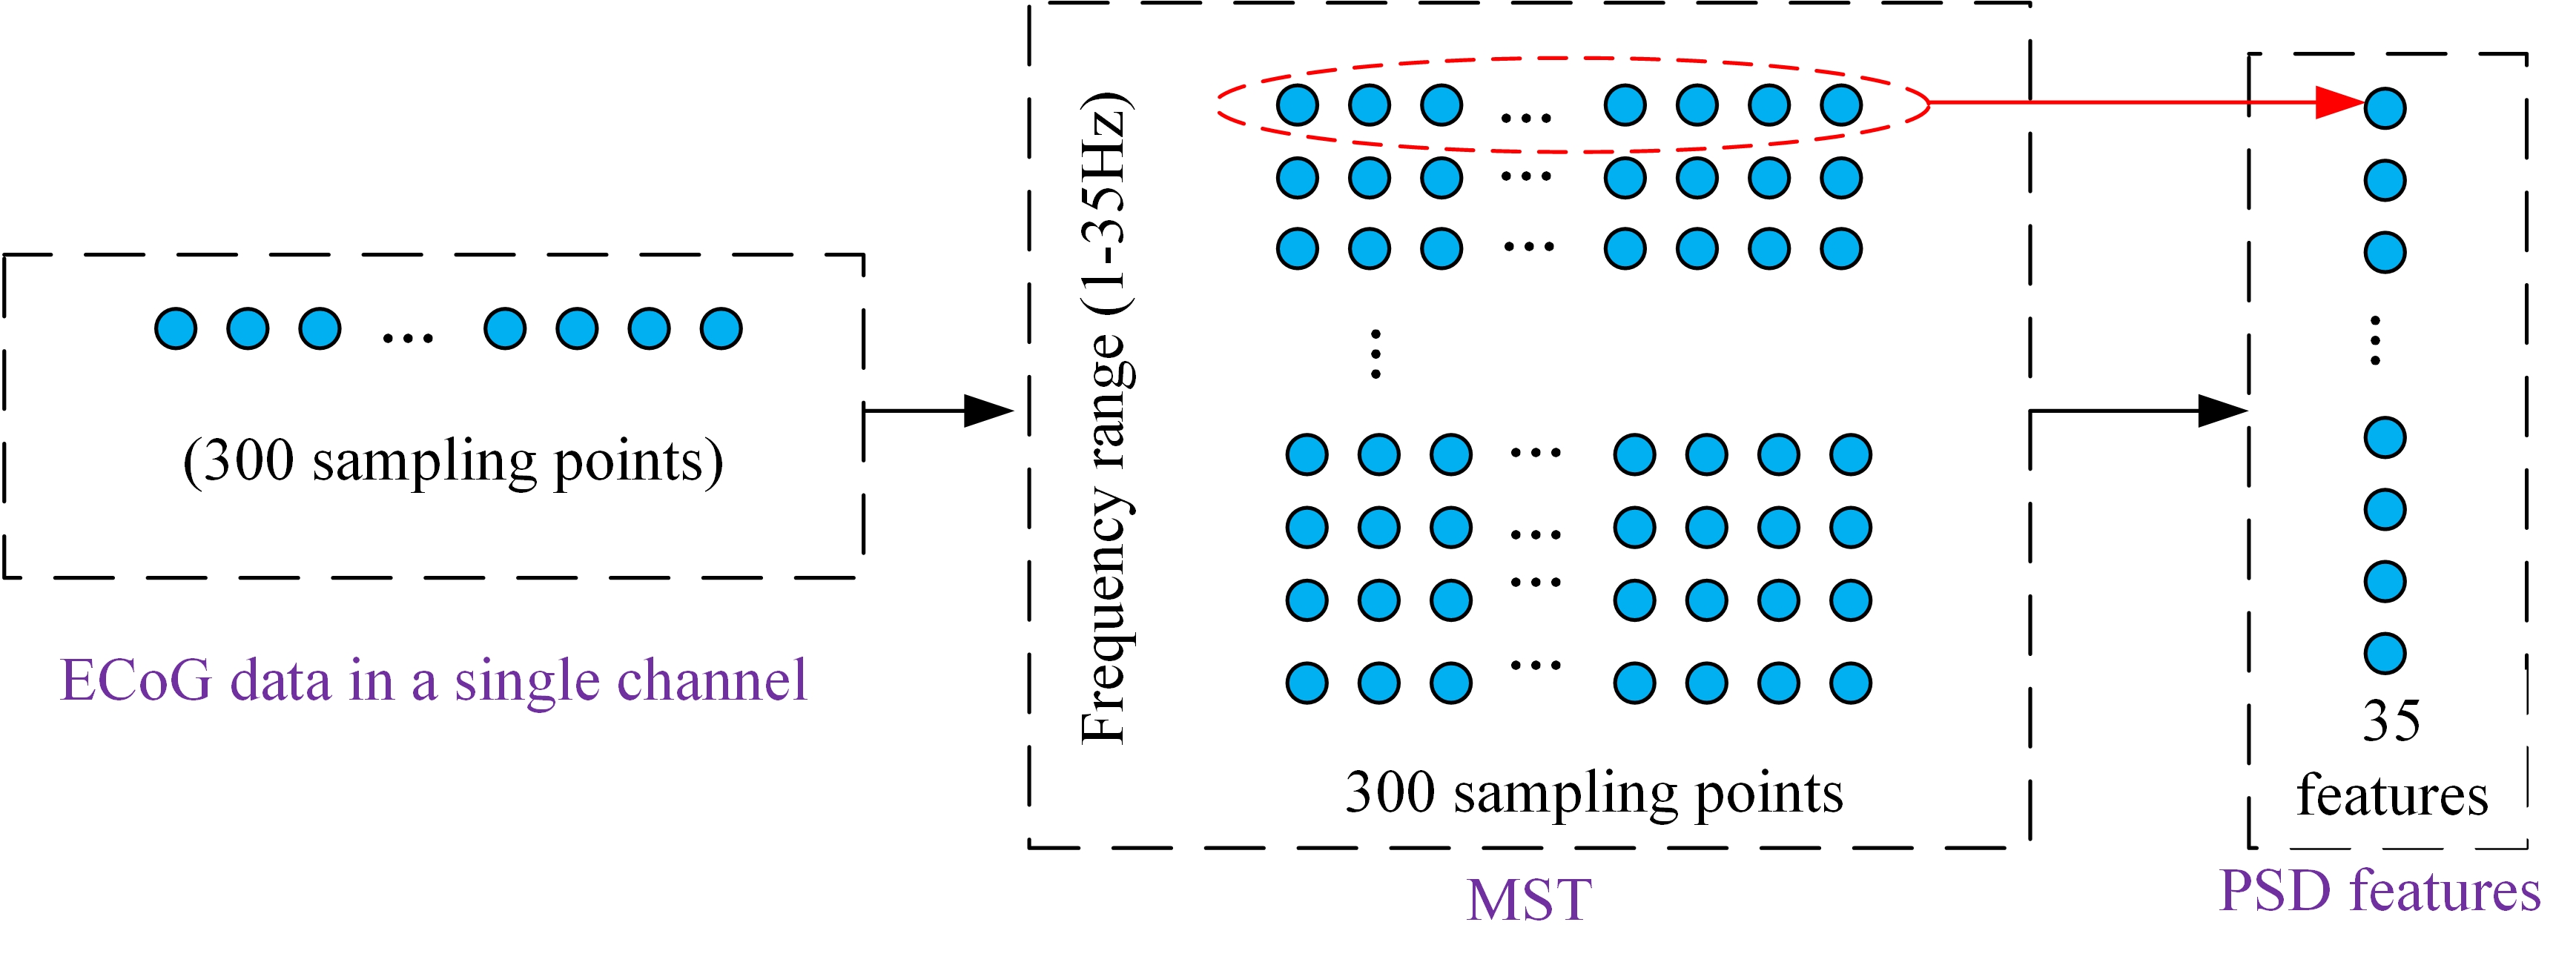 Figure 4.
Feature extraction from each channel. The PSD value can be calculated for each frequency from the MST. For each trial, 35 MST-based feature vectors are extracted from each channel. Each trial extracts 64 × 35 features.
2.4.1 SVM classifier
Spectro-temporal representations are fed into an SVM with an RBF kernel to recognize different MI tasks. The SVM constructs an optimal hyperplane by using the most significant margin to deal with the two-class problem (Bousseta et al., 2016; Liu et al., 2012). The classification function is expressed as:
Where x is the input vector, $y_{i}$ gives the category corresponding to the input$x_{i}$, b is the classification threshold, sign denotes the sign function s(x), and $ k(x_{i},x)$ is a kernel function.
The optimization goal is expressed as:
Where w is for weight and $c \sum^{n}_{i=1} \zeta_{i}$ is the total error. c is a penalty factor.
The kernel function type, the penalty factor c, and the kernel parameter g are essential elements of the training model. The parameter c denotes the ability of the classifier to punish misclassification, and the parameter g denotes a gamma distribution of the transformed data (Dong et al., 2017). The parameters that directly affect the generalization ability of the classifier balance the relationship between minimizing the training error and maximizing the margin between classes (Bousseta et al., 2016). The most suitable hyperplane is found by adjusting the parameters c and g, which plays an essential role in the classification effect of the classifier (Liu et al., 2012; Özbeyaz et al., 2011). Here, satisfactory results are obtained by using an RBF kernel function defined by:
where the g is the kernel parameter.
2.4.2 Performance evaluation
The capabilities of the MI-BCIs can be evaluated according to the classification accuracy and the information transfer rate (ITR). The classification accuracy of the proposed method can be expressed as:
Additionally, the ITR is also an essential indicator for the measurement of BCI performance (Wang et al., 2012; Zhu et al., 2019). The amount of information transmitted in one trial is calculated as:
Where N denotes MI types, and P is the classification accuracy for each task.
The channel selection strategy is provided by an optimized wrapper method that combines wrappers and cross-validation. The spectro-temporal representations of all 64 channels are concatenated to form high dimensional vectors. There is a lot of redundant and task-independent information when using all channels for feature extraction. Therefore, the channel selection process can be employed to determine the optimal channel combination without compromising classification performance. Channel selection decreases feature dimension, reduces algorithm complexity, and improves classification performance.
2.5.1 Cross-validation
Cross-validation has proved to be an effective channel selection method for BCI systems (Wang et al., 2012; Xu et al., 2014, 2016). The cross-validation accuracy of each channel can be obtained by calculating 10 times 10-fold cross-validation for each channel of the training dataset.
2.5.2 Wrapper approach
The wrapper approach, which takes classification performance as an evaluation criterion for the selected subset, is a common feature selection method (Chang and Yang, 2018; Kohavi and John, 1997). The approach aims to obtain the feature subset that is the most beneficial to the performance of a particular learning algorithm (Hossain et al., 2013; Hsu et al., 2011). The primary idea of the wrapper approach is to first determine the classifier and then select the best feature subset based on the classification effect (Sebban and Nock, 2002). Random forest (RF), SVM, and KNN are the classifiers usually chosen for the wrapper approach (Kohavi and John, 1997). The wrapper approach has two main steps: a search strategy and a classification algorithm. A search strategy employs various methods of feature subset selection. Common search strategies are forward selection and backward elimination (Huang et al., 2013). The classification algorithm tests the classification performance of a subset and judges whether the quality of the subset is better than the full channel set.
2.5.3 Optimized wrapper method
Channel selection aims to maximize the classification efficiency and accuracy for a dataset (Hsu et al., 2011; Kohavi and John, 1997). Both wrapper and cross-validation may reduce the number of channels. However, cross-validation ignores the correlation between certain channels, and the wrapper procedure has the disadvantage of being time-consuming due to the requirement of repeated training. To reduce these disadvantages and obtain the most appropriate channel combination, the optimized wrapper approach is proposed to select channels. The method adopts a combination of SVM and backward elimination search strategy based on cross-validation accuracies. The entire channel selection process can be summarized as follows:
Step 1. The training dataset is divided into a sub-training dataset and a sub-validation dataset. The classification accuracy m of all channel sub-validation dataset is calculated and set as a threshold.
Step 2. All channels are arranged into a set "H" according to the order of cross-validation accuracy from low to high.
Step 3. Set Y = H, k = 1, Y[Xk, Xk+1, … Xk+n], k+n is the number of channels. After removing a channel " Xk," the classification accuracy is calculated. If the accuracy is not reduced, delete the channel "Xk" and set Y=Y-Xk K=k+1. Otherwise, retain the channel and set " K=k+1."
Step 4. Repeat step 3 until all channels are scanned step by step.
Step 5. Set "H = Y," and repeat steps 3 to 4 until no channel is redundant.
Step 6. According to the selected channel subset, calculate the classification accuracy of the test data.
Cross-validation allows the selection of good channels. The order of subsets in terms of cross-validation accuracies can effectively reduce the number of training runs. Refilter the selected subset after scanning all channels and selecting a subset of channels. The refiltered subset helps further the reduction of the feature dimension.
Fig. 5 gives the flowchart of the optimized wrapper and wrapper methods. Fig. 5A gives the optimization course of the wrapper-based channel selection method. Fig. 5B illustrates the wrapper method.
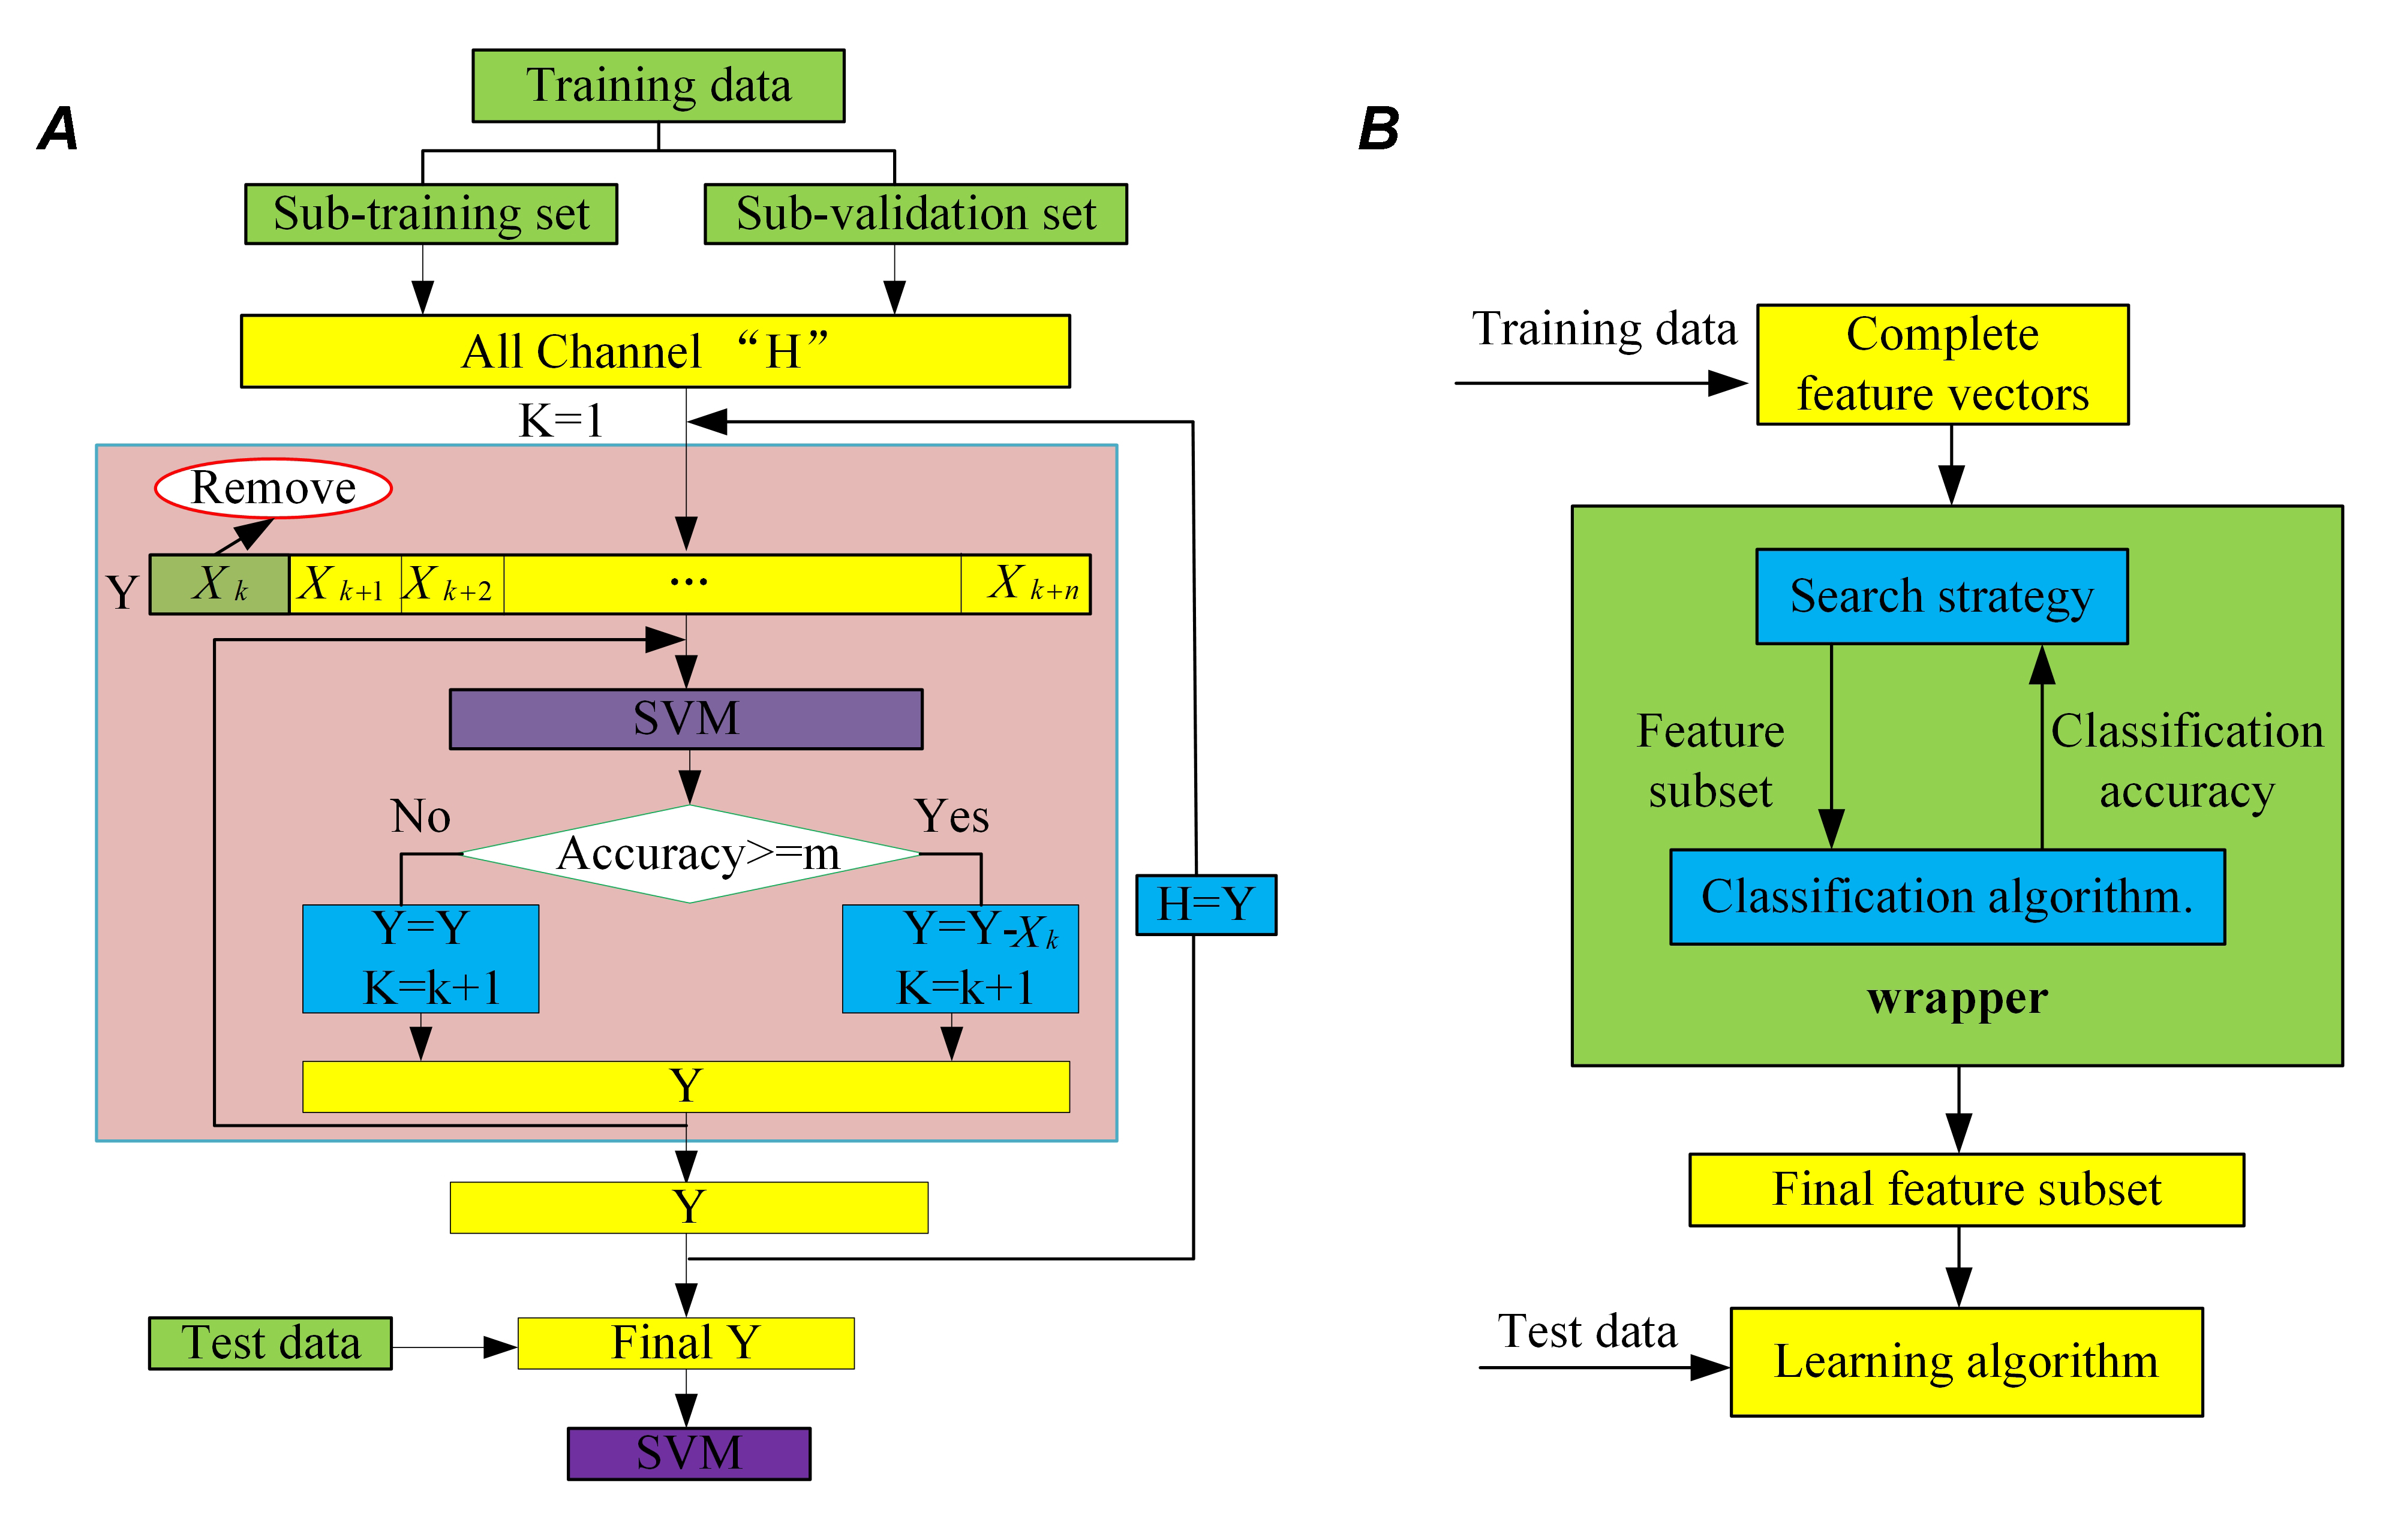 Figure 5.
Flowchart for the optimized wrapper method and wrapper method. (A) Flowchart of the optimized wrapper-based channel selection method. Xk is a channel. The classification accuracy of all channel feature vectors is m. (B) Flowchart of the wrapper method.
MI classification performance can be evaluated in terms of recognition accuracy, ITR results, and the algorithm complexity analysis. Experimental results are analyzed in detail as follows.
Table 1 lists the classification accuracies of SVM, including different kernel functions. The spectro-temporal representations, including MST, ST, AR, BP, and LBP operators, are given for comparison. The classification accuracy of 98% based on the MST algorithm is the highest. Accuracy is reduced to 92% when MST-based features are replaced by ST-based features. MST achieves more satisfactory results than AR, BP, and LBP. Additionally, it can be deduced that the RBF kernel function has the best classification performance with or without channel selection. It should be noted that channel selection is necessary to improve classification performance.
| Feature extraction | SVM kernel | Accuracy before channel selection (%) | Accuracy after channel selection (%) |
|---|---|---|---|
| MST | linear | 88 | 94 |
| MST | RBF | 94 | 98 |
| MST | polynomial | 89 | 92 |
| ST | linear | 83 | 87 |
| ST | RBF | 85 | 92 |
| ST | polynomial | 82 | 90 |
| AR | linear | 75 | 83 |
| AR | RBF | 81 | 86 |
| AR | polynomial | 80 | 86 |
| BP | linear | 60 | 71 |
| BP | RBF | 76 | 84 |
| BP | polynomial | 58 | 58 |
| $LBR^{\mathop{}_{4,1}^{riu 2}}$ | linear | 77 | 77 |
| $LBR^{\mathop{}_{4,1}^{riu 2}}$ | RBF | 88 | 89 |
| $LBR^{\mathop{}_{4,1}^{riu 2}}$ | polynomial | 82 | 84 |
| $LBR^{\mathop{}_{8,1}^{riu 2}}$ | linear | 76 | 81 |
| $LBR^{\mathop{}_{8,1}^{riu 2}}$ | RBF | 84 | 85 |
| $LBR^{\mathop{}_{8,1}^{riu 2}}$ | polynomial | 81 | 85 |
According to Eqn. 10, the best representations of ECoG epochs are provided by adjusting the scale factors. Fig. 6 shows the classification results with different descriptions. The statistical evaluation measures are computed with different scale factors in Fig. 6A. Notably, the scale factors p and q have a significant impact on the performance of the algorithm. The BCI system performance is stable and accurate when q it is 0.8, 0.9, or 1 and p ranges from 0.45 to 0.55. The algorithm is implemented using RBF-based SVM classifiers. Because of its adjustable scaling factors, the MST algorithm has greater robustness than alternative common time-frequency analyses. A comparison of true and predicted labels is given in Fig. 6B. Two types of the label are separated by category boundaries. Only two test trials (17, 62) of the 100 test trials were mispredicted.
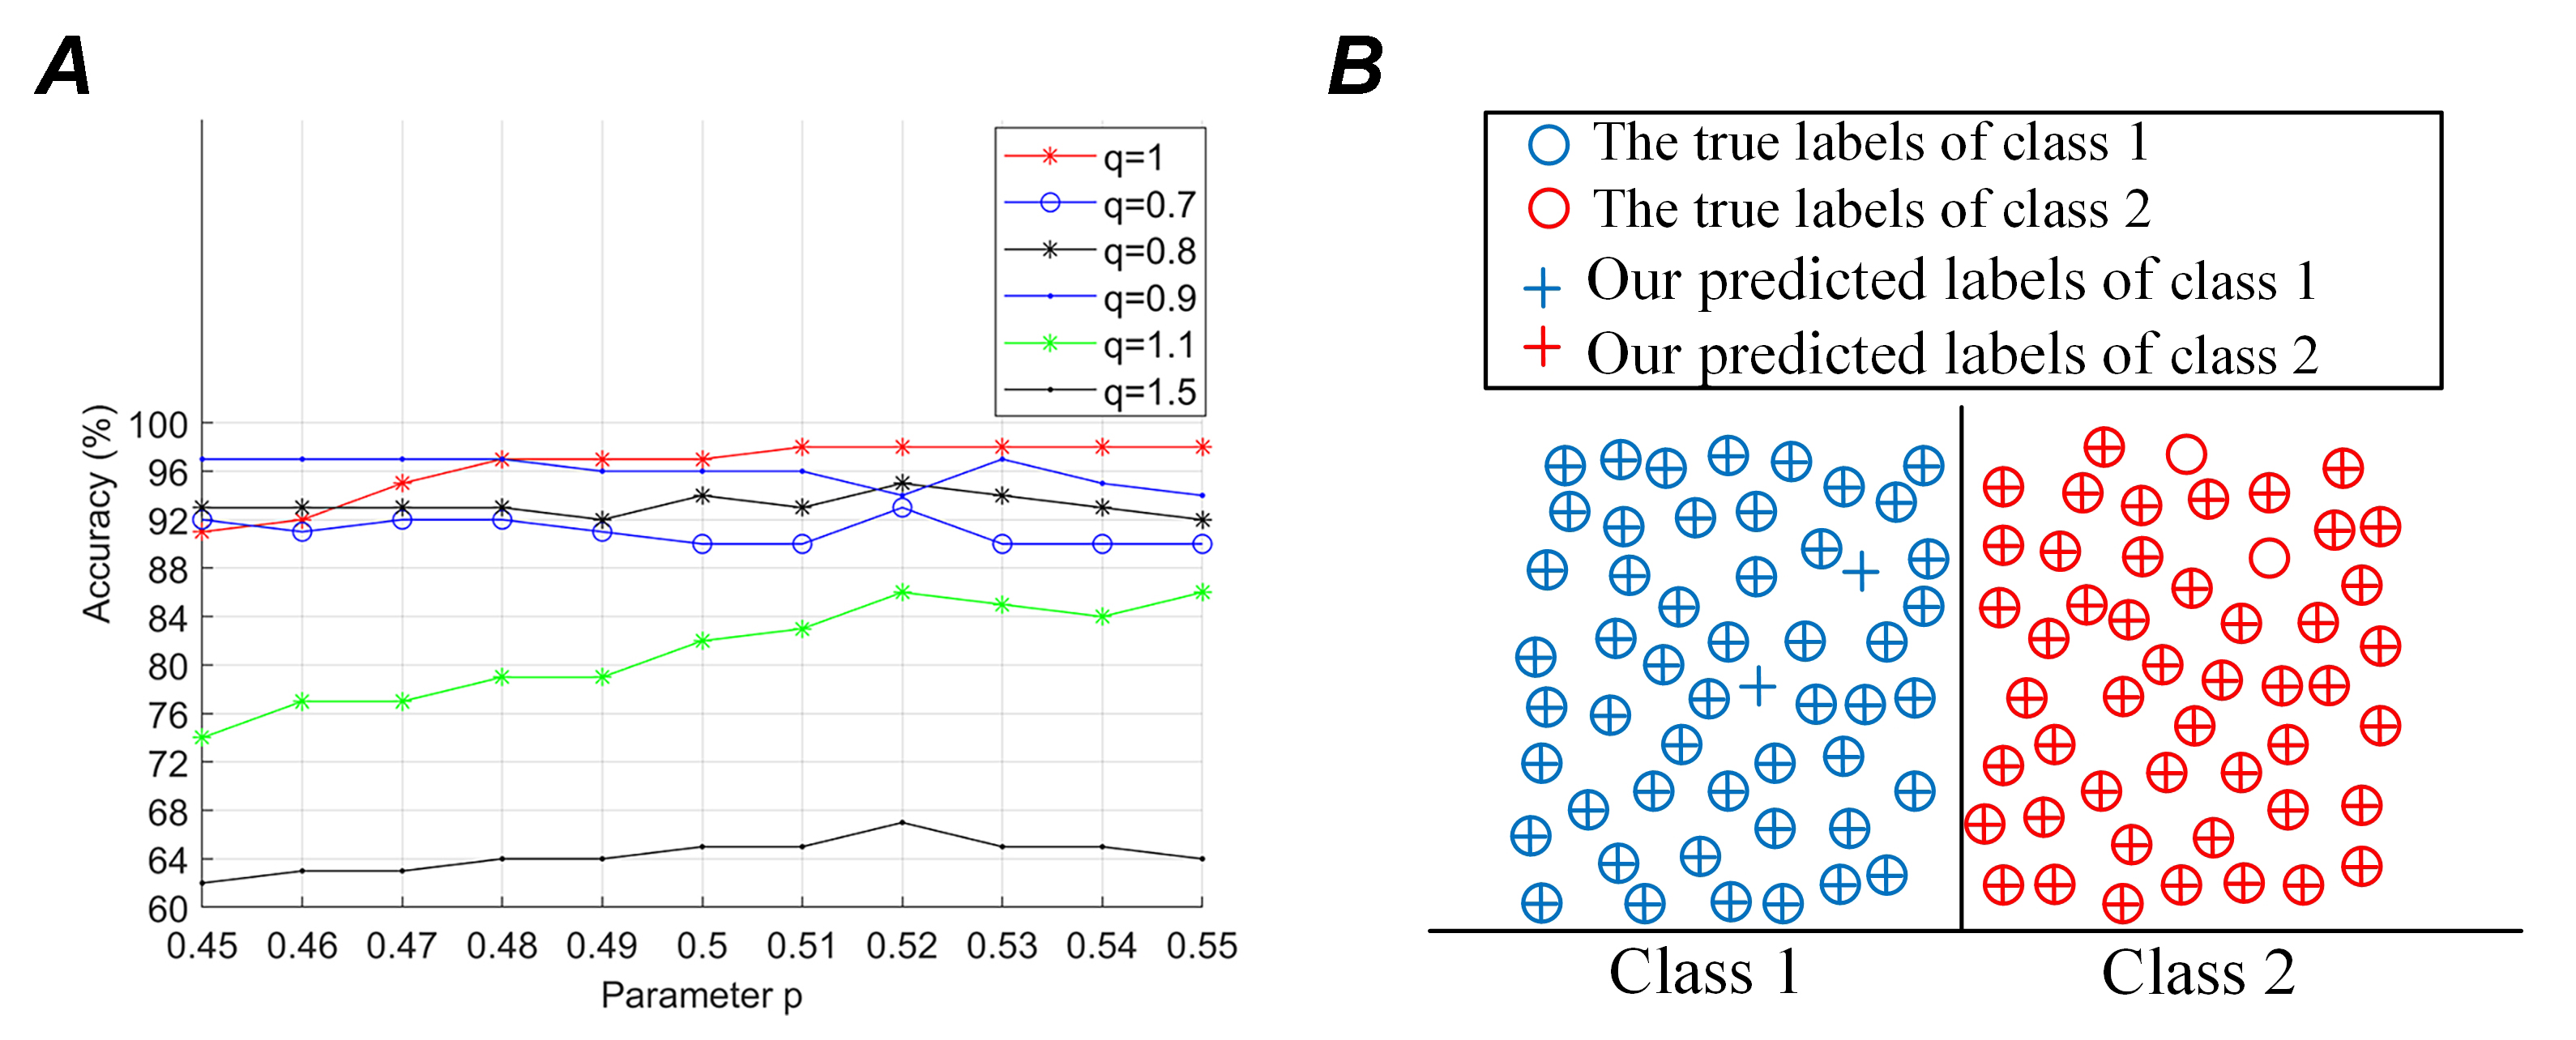 Figure 6.
Classification results with different descriptions. (A) Statistical evaluation measures computed with different scale factors. (B) Comparison between true and predicted labels. Only 2 test trials of the 100 test trials were mispredicted.
Fig. 7 plots the classification performance comparison of different classifiers based on MST features. Fig. 7A gives the classification accuracies of the MST features combined with SVM, GB, BLDA, KNN, and RF classifiers, respectively. It can be inferred that the SVM classifier achieves the highest accuracy. Fig. 7B shows the average ITR of each trial. It can be inferred that SVM obtains excellent results for both accuracy and ITR.
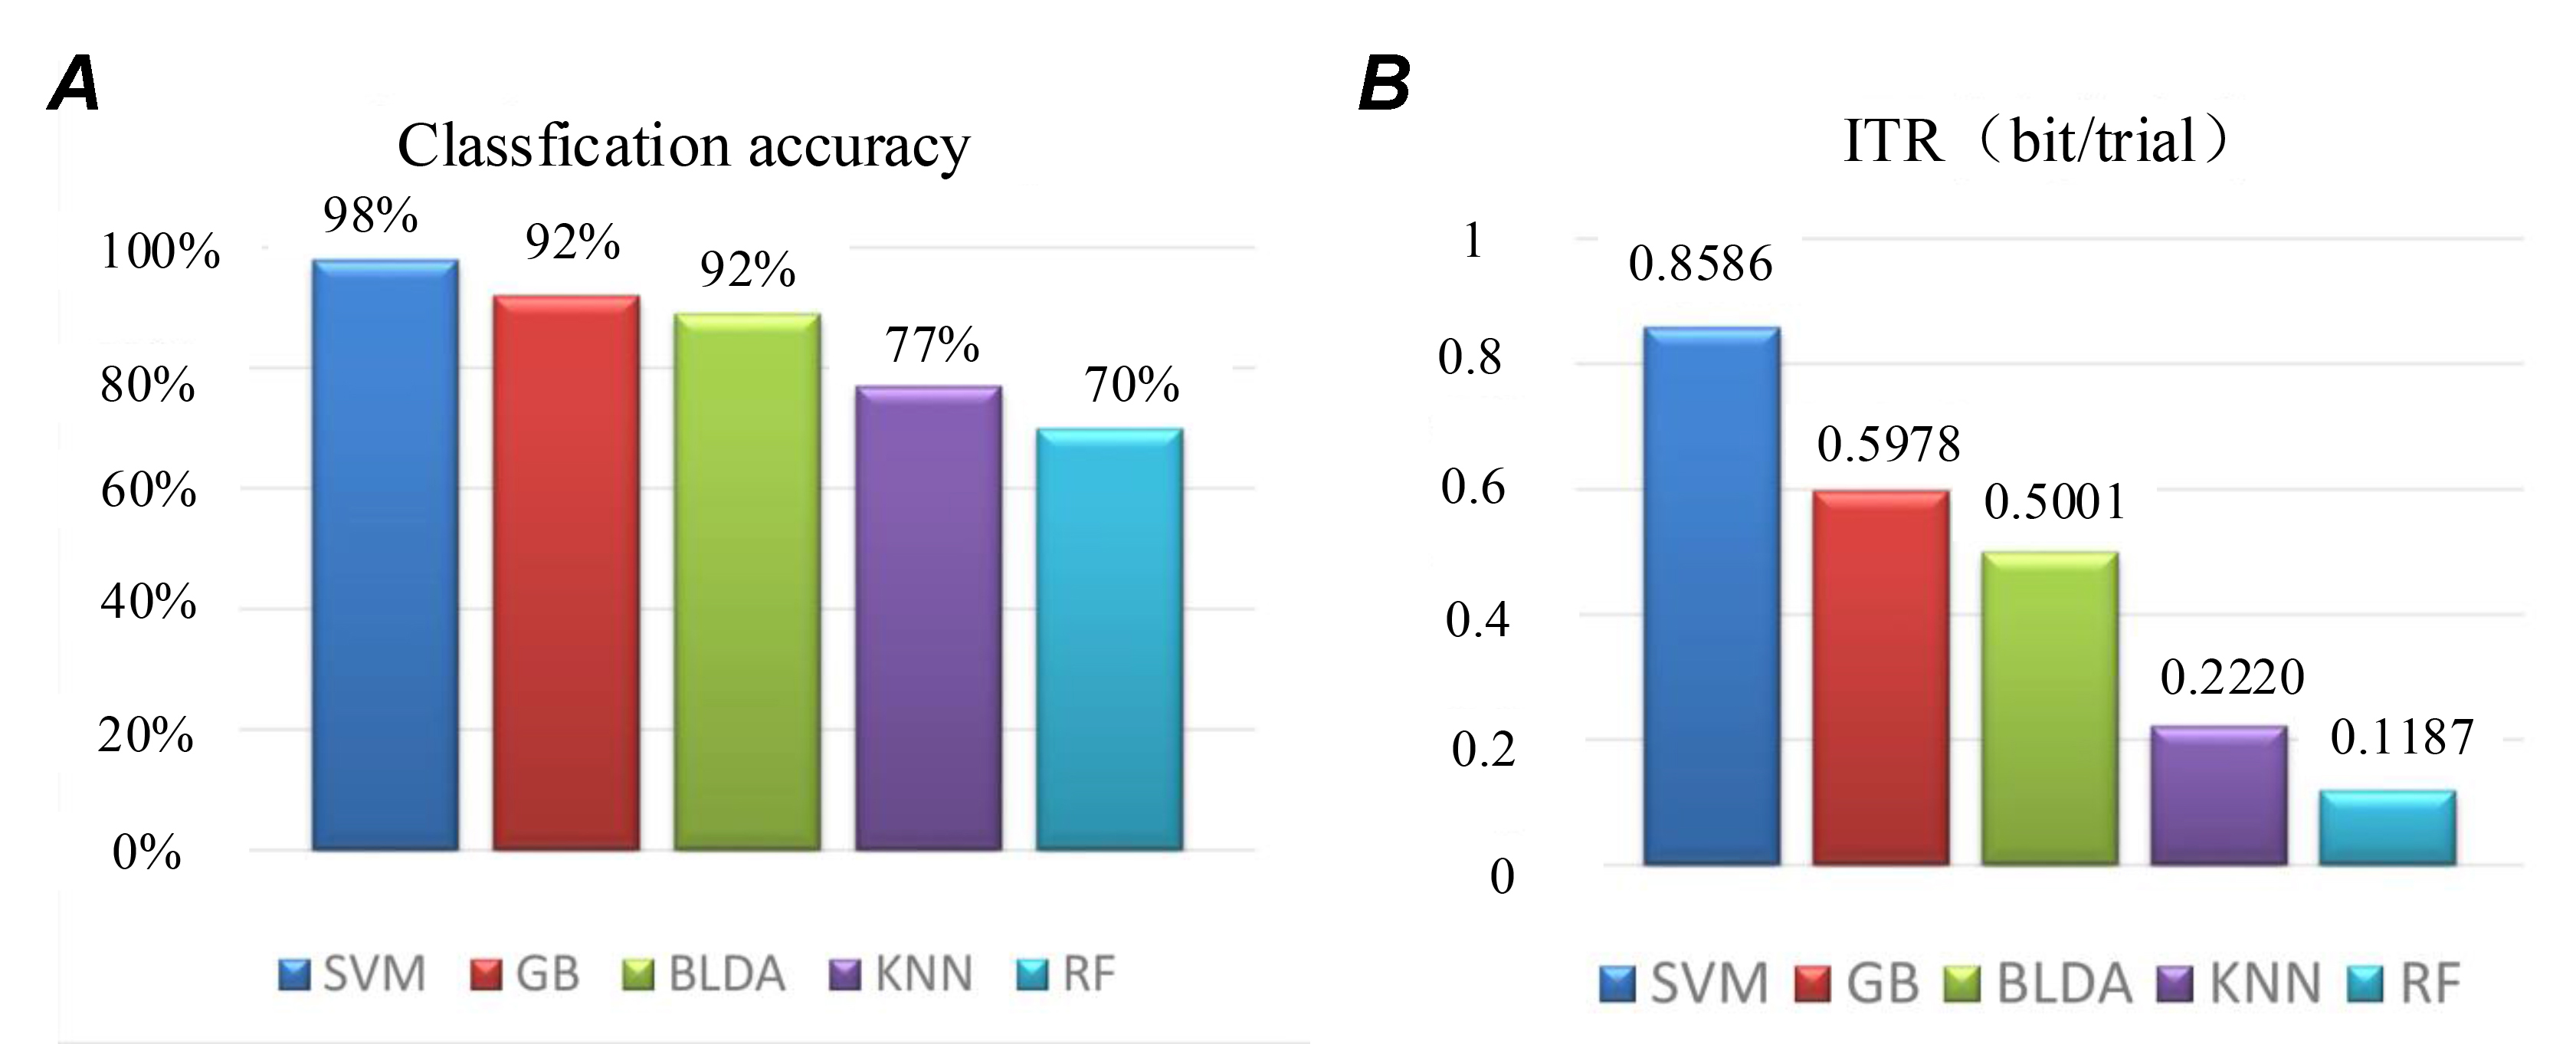 Figure 7.
Classification performance comparison of different classifiers with the same features. (A) Classification accuracies of MST feature combined with SVM, GB, BLDA, KNN, and RF classifiers, respectively. (B) Average ITR of each trial.
The use of MST to decode representations from ECoG and feed the features into the SVM classifier to recognize two-class MI patterns has been described here. Additionally, a wrapper approach has been used to select high-quality channels, with only 20% of channels in the original dataset required to be selected. This approach is key to obtaining excellent accuracy and improvements in algorithm speed.
Different MI tasks are usually recognized by distinguishing (ERD/ERS) phenomena that represent imagined movements. The ECoG signals were recorded from the right motor cortex. This motor area coincides with the functional area of the hand and tongue. However, it is uncertain which channels correspond to the functional area of the hand and tongue, respectively. Therefore, the optimized wrapper approach is used as a channel selection tool to reduce the complexity of the algorithm. Fig. 8 shows the energy distribution of ECoG signals and the generation of ERD/ERS phenomena with different MI tasks. Fig. 8A gives the average amplitudes of the raw ECoG with all channels. Fig. 8B denotes the energy distribution of all channels in the frequency domain. The PSD distributions of both left little finger and tongue imagery movement are significantly different in the frequency domain. Fig. 8C and 8D depict the ERD/ERS phenomena of ECoG epochs with channel 34 and channel 47, respectively. The calculation of ERD/ERS can be expressed as the percentage of the energy change of the given frequency band concerning the reference interval (Wang et al., 2012; Wei and Tu, 2008; Zhu et al., 2019).
Within each channel, E represents the signal energy of a specific frequency band range, and R represents the energy of the reference interval. Here, the first 30 time points of ECoG data are used as the reference interval, and the frequency band range is 1-35 Hz. The blue and the orange curves indicate the left little finger and the tongue movements, respectively. Fig. 8 illustrates that the PSD-based MST algorithm effectively identifies different MI tasks in the frequency range of 1-35 Hz. The temporal-frequency characteristics of the ST and MST in a channel are given in Fig. 9A and 9B. Among them, the MST spectro-temporal representation is plotted for the parameters P = 0.52 and q = 1. There is no overlap, and the frequency resolution is 1. It can be inferred that MST can obtain a better spectro-temporal distribution and more excellent energy concentration than ST in the time-frequency plane.
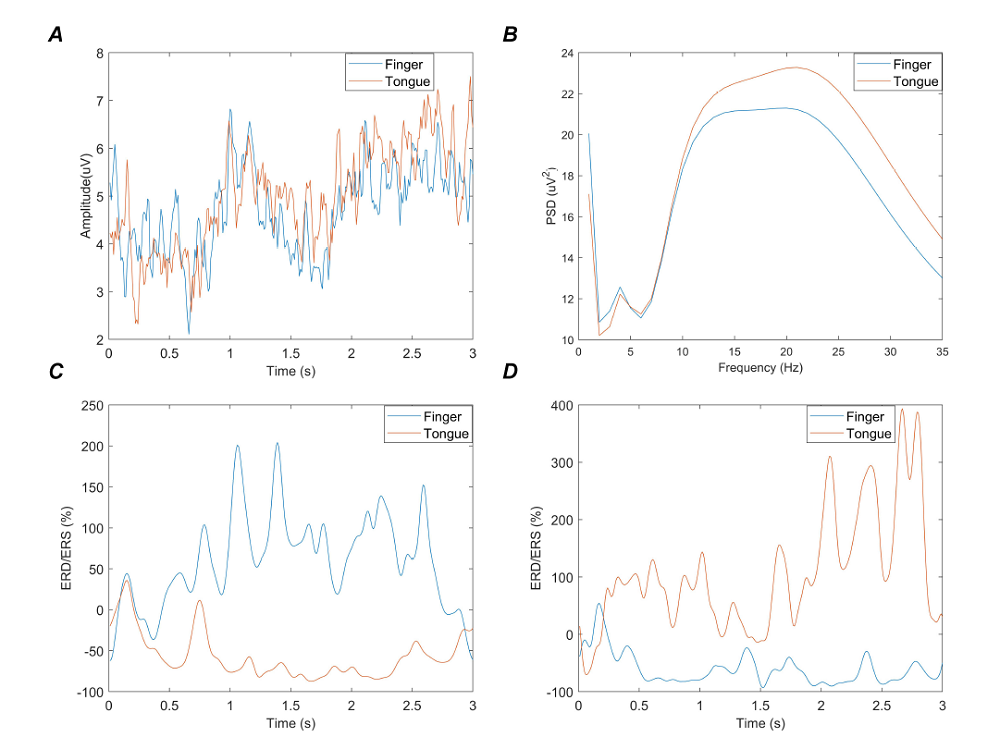 Figure 8.
Energy distribution and ERD/ERS phenomena of ECoG. The blue and the orange curves indicate the left little finger and tongue movements, respectively. (A) The average amplitude of the raw ECoG with different MI tasks. (B) Energy distribution of different MI procedures in the frequency domain. (C) The ERD/ERS analysis of channel 34. (D) ERD/ERS analysis of channel 47.
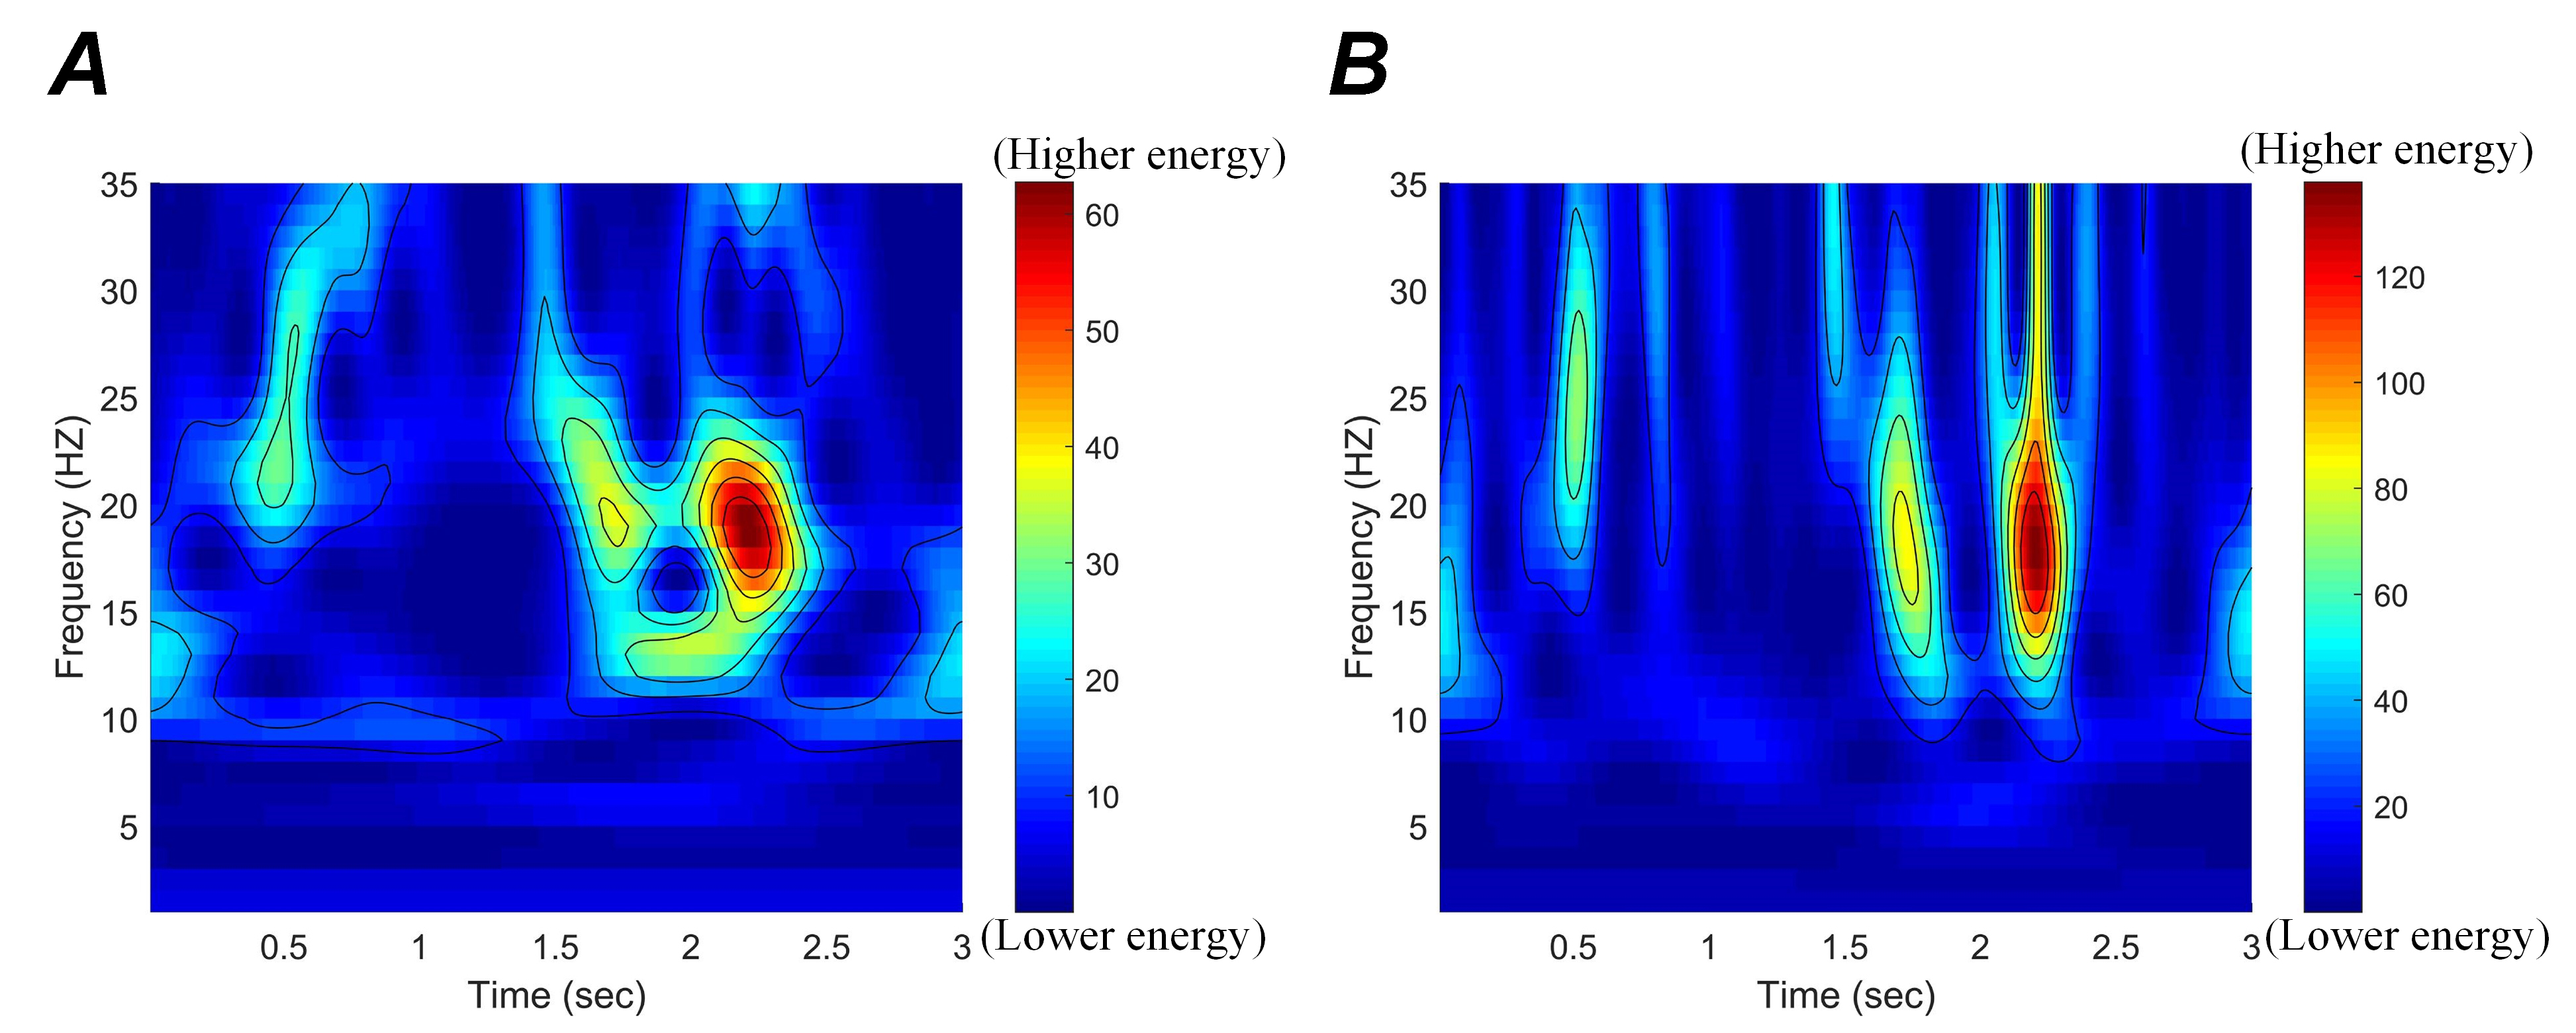 Figure 9.
Time-frequency characteristics of different representations extracted from the ST and MST. (A) Time-frequency characteristics extracted by ST. (B) Time-frequency characteristics extracted by MST. B shows a better spectro-temporal distribution and a greater energy concentration than A.
Fig. 10 illustrates the cross-validation accuracies for all 64 channels with the valid parameters P = 0.52 and q = 1 (According to Eqn. 10) and the selected channels. Fig. 10A is the histogram of average cross-validation accuracies for all channels, where the highest and lowest points of error bars represent the maximum and minimum values of channel cross-validation accuracies, respectively. Fig. 10B depicts the selected channels. Among them, channel 38 has the highest cross-validation accuracy. This channel must be located in the area where the ERD/ERS phenomena are apparent, and it is an effective channel with good discrimination.
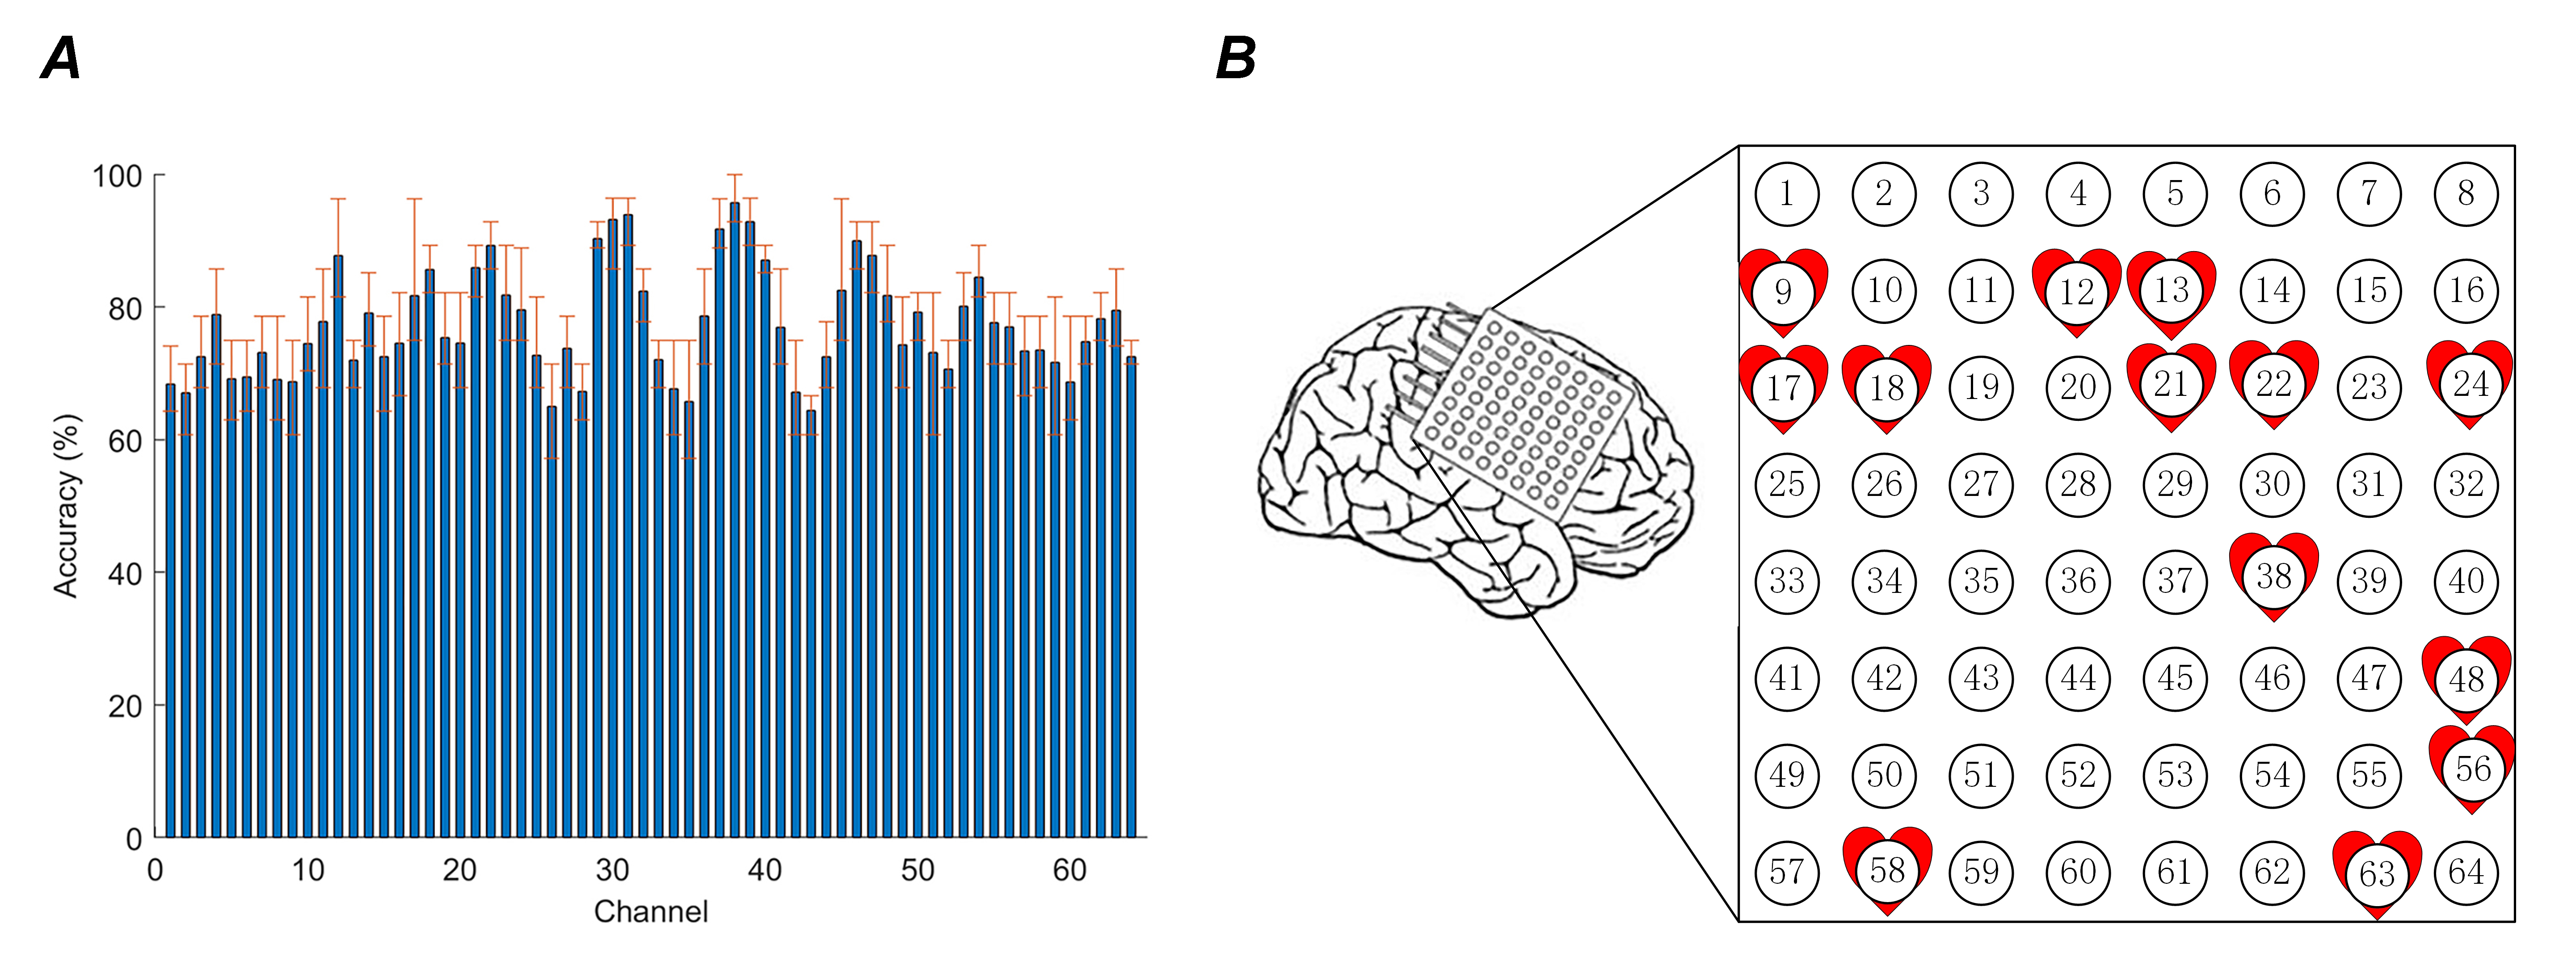 Figure 10.
Cross-validation accuracies for all 64 channels with appropriate parameters and the selected channels. (A) Histogram of the average cross-validation accuracies for all channels. (B) Channels marked in red are the selected channels. A total of thirteen channels with excellent performance are selected.
Fig. 11 illustrates the energy distribution comparison of several selected channels and discarded channels. Fig. 11A gives the average PSD curves for the discarded channel and Fig. 11B demonstrates the average PSD curves for reserved channels. For different MI tasks, the energy distribution of abandoned channels are almost coincident and difficult to distinguish, but the energy distribution of selected channels have significant differences. An optimized wrapper approach can effectively delete redundant channels and optimize classification performance. Additionally, the optimized wrapper method gradually traverses each channel according to cross-validation accuracy. Thus, this method not only preserves the advantages of the wrapper method but also reduces the time wasted by multiple cycles.
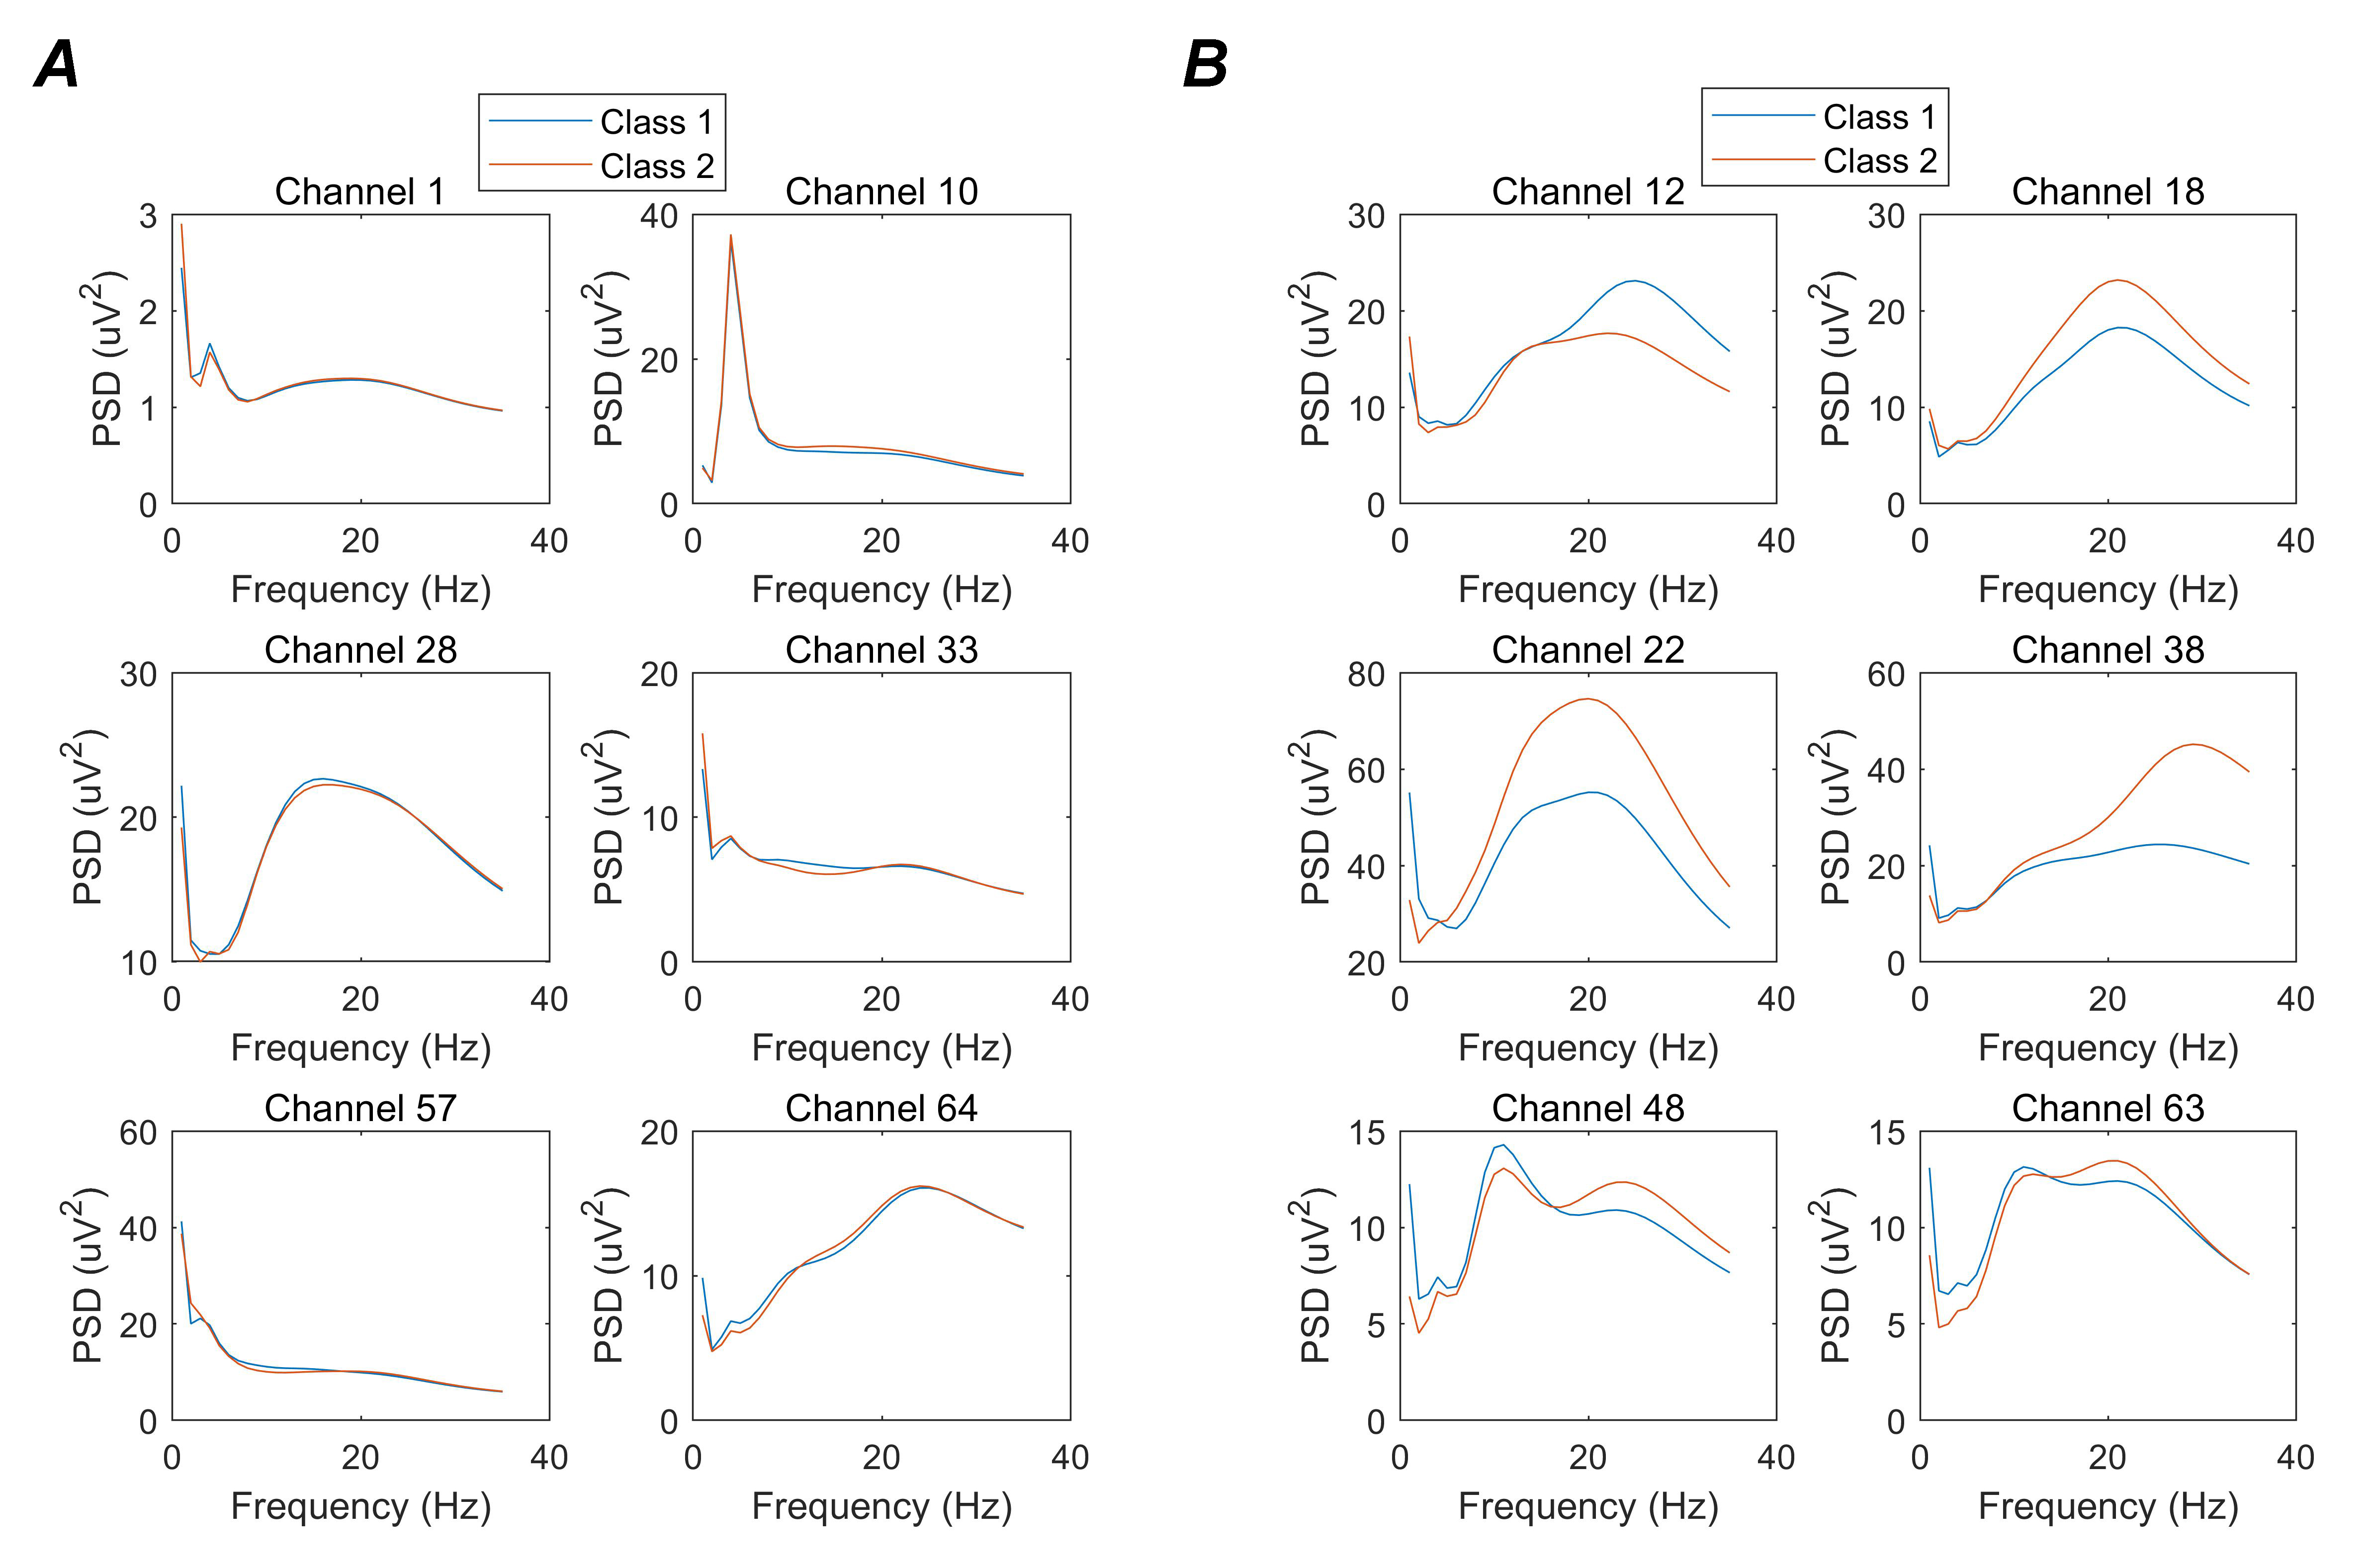 Figure 11.
Energy distribution comparison of several selected channels and discarded channels. Blue and red curves represent the imaginary finger and tongue movements, respectively. (A) Discarded channels. The two PSD curves are almost coincident and challenging to distinguish. (B) Reserved channels. The two PSD curves have significant differences.
Fig. 12 gives a comparison of the results of the ECoG and the EEG. Fig. 12 and 12B show the performance before and after the channel selection of the ECoG and the EEG. After the channel selection stage, the classification accuracy of the ECoG has increased from 94.0000% to 98.0000%, and the classification accuracy of the EEG has changed from 82.1429% to 92.8571%. The classification time of the algorithm is significantly reduced in Fig. 12B. The classification time of ECoG and EEG is respectively reduced by 66% and 30%. The classification accuracies of the ECoG and the EEG with different channel numbers are given in Fig. 12C and 12D. These figures show that the classification accuracy of the EEG reaches 92.8571% when 16 channels are selected, and the classification accuracy of the ECoG reaches 98%, with only 13 channels selected. Optimized channel selection reduces the computational burden. Additionally, there are more interference channels with EEG than ECoG, and the classification performance of EEG decreases as the number of channels is increased.
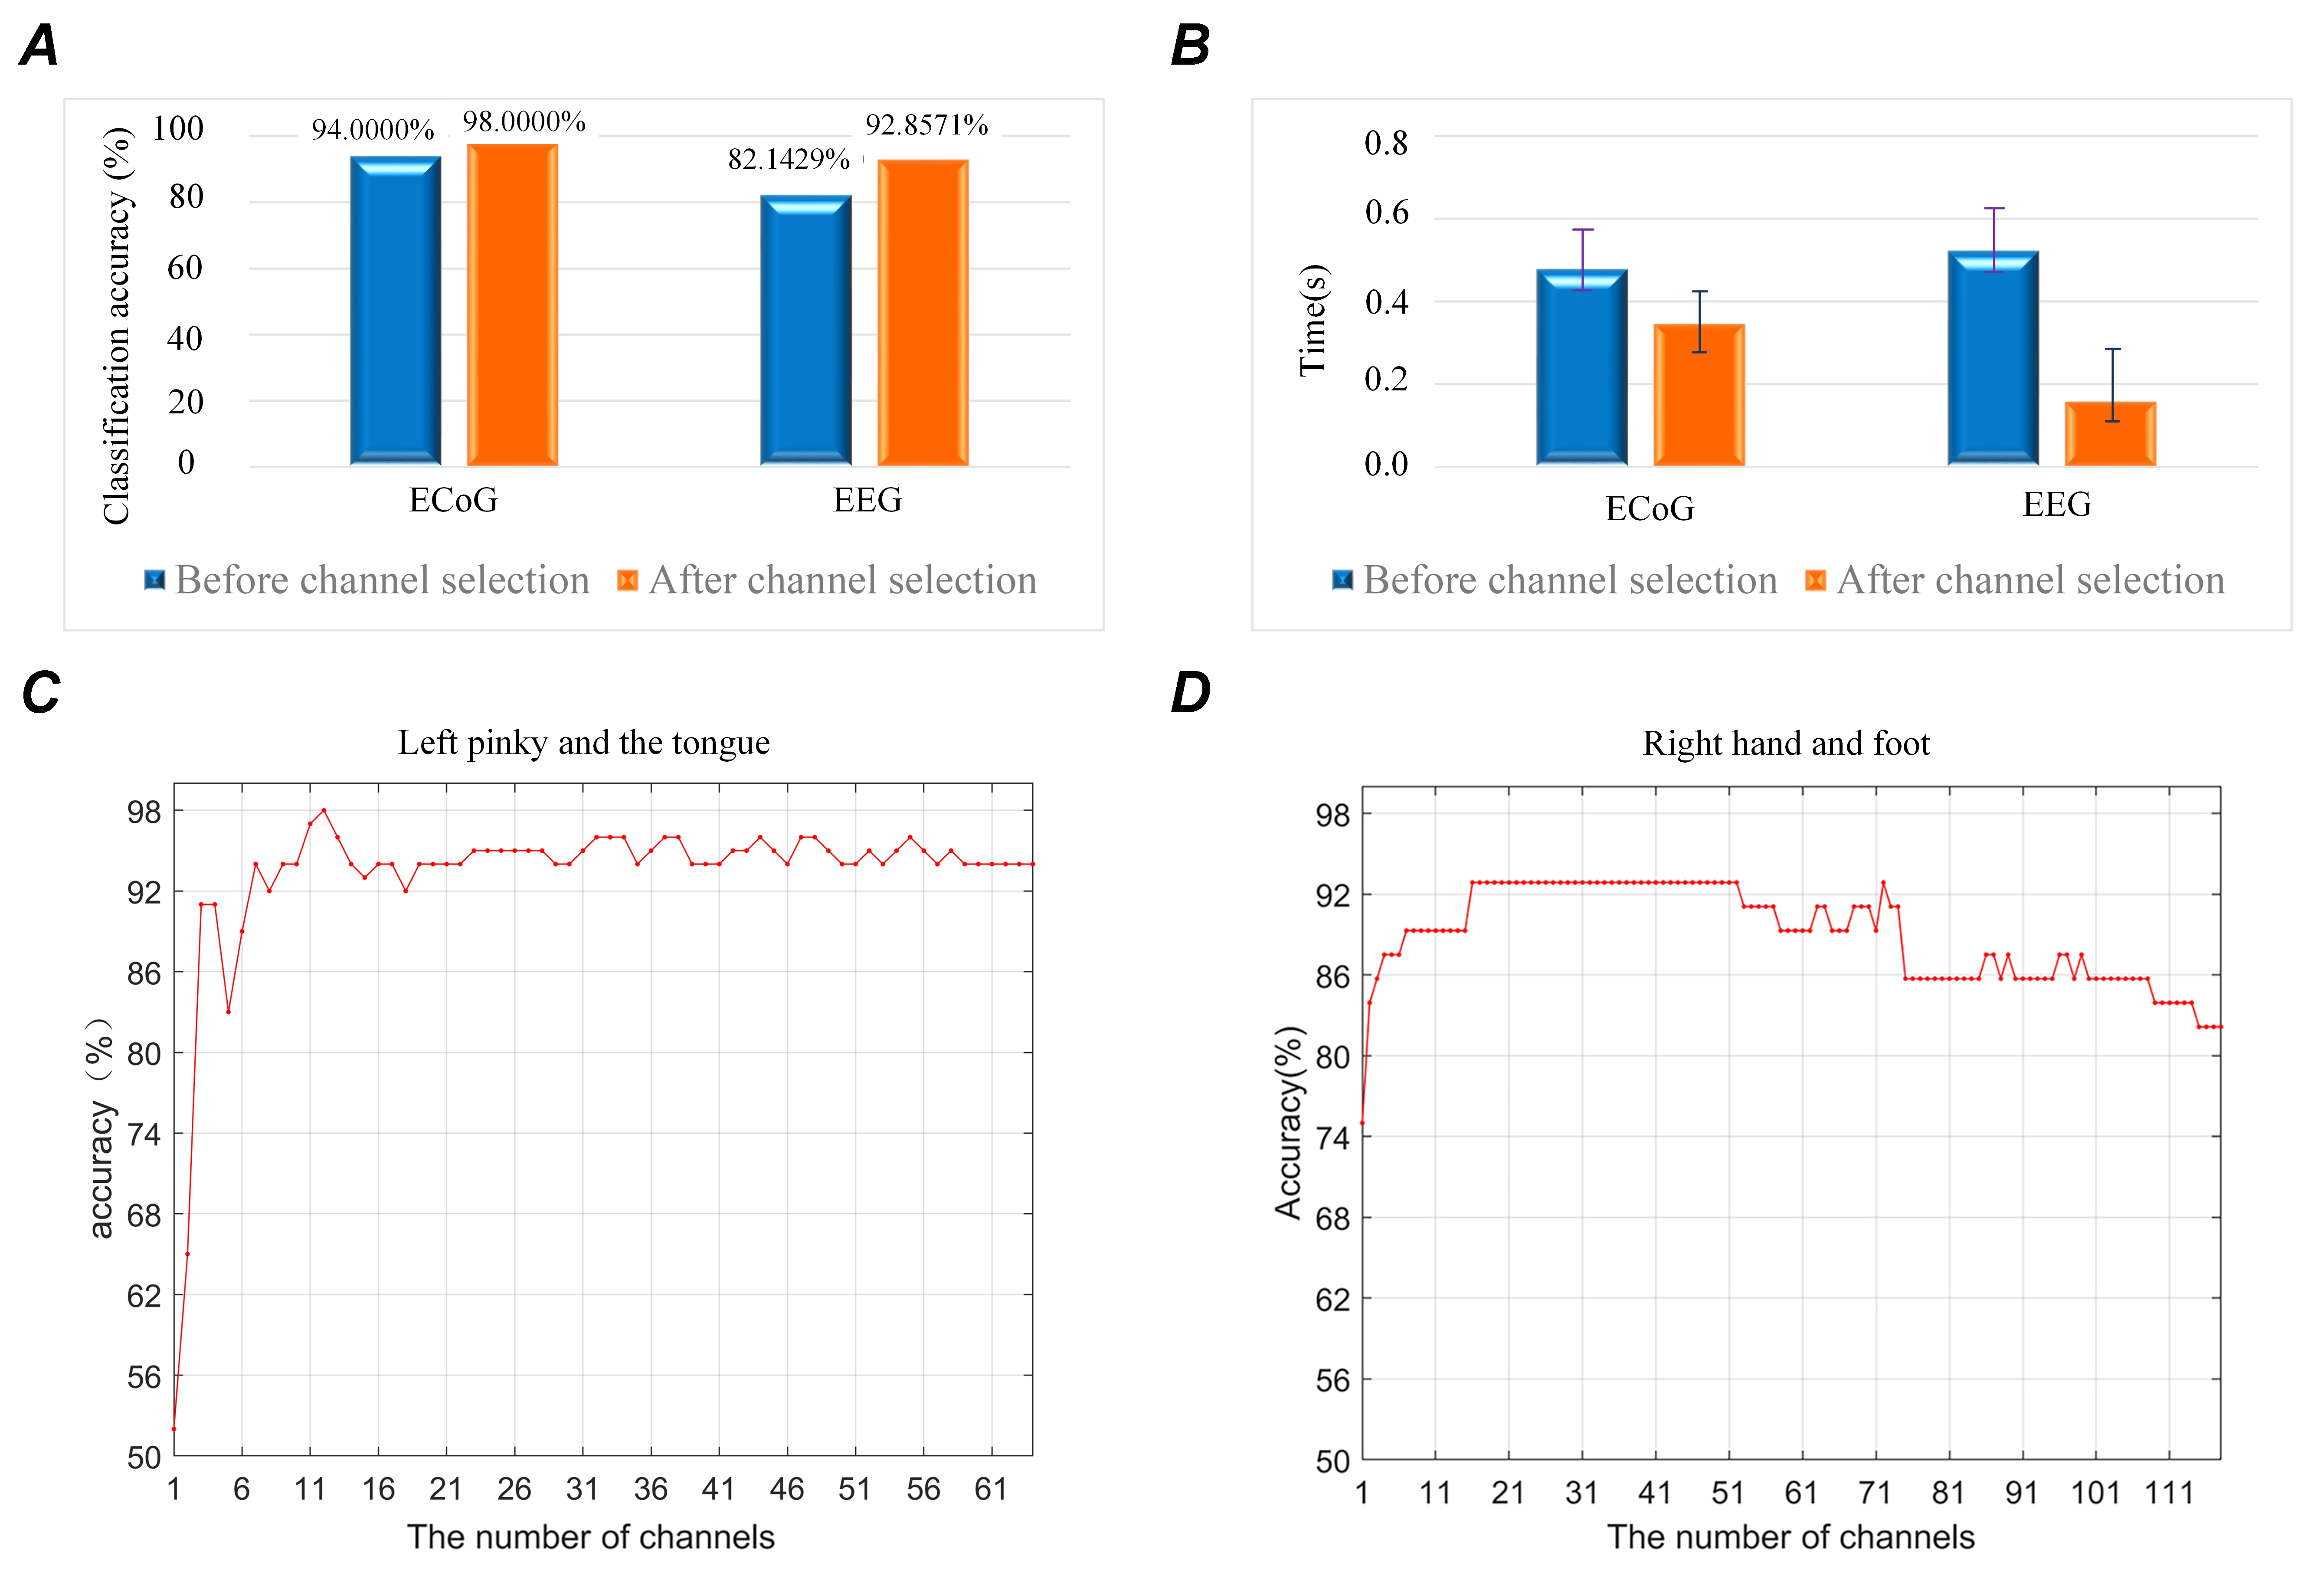 Figure 12.
Comparison of results for the ECoG and EEG. (A) Classification accuracies before and after channel selection for the ECoG and EEG. (B) Classification time before and after the channel selection of the ECoG and EEG. (C) The classification accuracy of ECoG data with different channel numbers. (D) The classification accuracies of EEG data with different channel numbers.
It is useful to compare the performance of the algorithm proposed here with other methods for recognition MI tasks with ECoG. To date, many attempts have been made to improve the performance of MI-BCIs. Table 2 provides a comparison of classification accuracy obtained by the method described here and by others for dataset I. Li et al. (2009) and Wei and Tu (2008), respectively, used the SVM ensemble and FLDA to conduct classification with CSP features. They improved the performance of the algorithms by training the classifiers and reducing the data dimensions, respectively. The algorithm complexity of these two BCI schemes is low, but the accuracy is considerably lower than that of the scheme proposed here.
| Feature extraction | Classifier | Channel selection | Number of channels selected | Accuracy (%) |
|---|---|---|---|---|
| CSP (Li et al., 2009) | SVM Ensemble | No | 64 | 84 |
| BP (Chong et al., 2010) | LDA, KNN, SVM | No | 64 | 89 |
| Wavelet variance (Yan and Guan, 2013) | PNN | Wavelet variance | 6 | 88 |
| CSP (Wei and Tu, 2008) | FLDA | GA | 7 | 90 |
| Wavelet Energy (Zhao et al., 2010) | PNN | PCA | 8 | 91.8 |
| BP (Zhao et al., 2011) | FLDA | BP | 11 | 94 |
| ST (Chang and Yang, 2018) | BLDA | GA (Feature selection) | 64 | 96 |
| Fractal and LBP (Xu et al., 2016) | GB | Cross-validation | 41 | 95 |
| MST (Xu et al., 2014) | GB | Cross-validation | 9 | 92 |
| MST (Zheng et al., 2019) | SVM | Cross-validation | 36 | 95 |
| MST | SVM | Optimized Wrapper | 13 | 98 |
Moreover, the scheme of Li et al. (2009) has a high computation burden, which can be attributed to the absence of channel selection. In the work of Chong et al. (2010), linear discriminant analysis (LDA), KNN and SVM were introduced to form a combination classifier and a lower accuracy of 89% was achieved with a BP feature. This scheme has effectively optimized the algorithm by adjusting the combined classifier. Multiple classifiers lead to higher algorithm complexity. Compared with the algorithm introduced here, the method of Chong et al. (2010) has low efficiency, high computational complexity, and low accuracy. A wavelet variance feature and probabilistic neural network (PNN) classifier have been employed to obtain 88% classification accuracy (Yan and Guan, 2013). It has extracted effective feature information and selected high-quality channels by adjusting wavelet coefficients. In that case, computational complexity was reduced by selecting 6 channels to process. Compared with the current algorithm, MST-based spectral features have better energy concentration than wavelet variance features.
Additionally, the method is more accurate. Zhao et al. (2010) achieved 91.8% classification accuracy with a relative wavelet energy feature and PNN classifier. This algorithm has improved the classification accuracy by extending the feature dimension. Principal component analysis (PCA) is introduced to reduce data redundancy and dimensionality. Although PCA reduces data dimensionality to a certain extent, the rapidity of the algorithm is relatively slow due to the expanded feature region. The BP feature and FLDA classifier gave 94% classification accuracy. Zhao et al. (2011) utilized BP to form feature vectors, introduced FLDA as a classifier, and 11 channels with distinct features were selected by using the BP feature as the channel selection tool.
In contrast, the current algorithm achieves more satisfactory classification results. The work of Chang and Yang (2018) adopted the ST feature and genetic algorithm (GA) to select 48.6% of a dataset as an efficient subset to obtain 96% classification accuracy with a BLDA classifier. It has introduced the GA algorithm to improve the performance of the scheme. MST-based features have higher energy than ST-based features compared to the scheme described here. Furthermore, the high number of selected feature subsets increased algorithmic complexity. In summary, the classification performance of these algorithms is lower than that of the algorithm proposed here.
In our previous work, fractal and LBP were combined to represent ECoG, and the accuracy of 95% was obtained with the GB classifier (Xu et al., 2016). That scheme applied nonlinear dynamics theory to MI task classification and achieved a good compromise in both classification accuracy and algorithm efficiency. The classification performance of the current scheme was very competitive at the time. The method proposed here employs time-frequency analysis to extract data features and optimizes the performance of the algorithm using an optimized wrapper method. Both have resulted in the construction of novel and effective BCI systems. Such a scheme is more straightforward because only partial features need to be extracted.
Additionally, classification accuracy has been further improved. Based on our previous work (Xu et al., 2014; Zheng et al., 2019), it was further found that the appropriate scale factors of the MST algorithm extract a higher quality representation, and the optimized wrapper method can be used to implement a channel selection. The framework proposed here has both better classification accuracy and lower algorithmic complexity. Due to its flexible window adjustment ability, the MST algorithm can effectively capture changes in brain signal rhythm. The optimized wrapped algorithm can effectively improve the efficiency of the algorithm. It will help to realize the analysis of more complex cognitive tasks by adjusting the MST algorithm window, matching the appropriate classifier, and combining with the optimized wrapped algorithm.
FX is responsible for analyzing the data, designing the algorithms, and guiding the implementation of the entire solution. WFZ was responsible for executing the experiment and optimizing it. DRS, QY, and WDZ provided help and suggestions for experiments and writing the manuscript. All authors worked together to edit and improve the manuscript.
All data involved in this research are public datasets approved by the International Ethics Committee.
This work was supported by the National Natural Science Foundation of China (Grant No. 61701270, 61701279, 81472159, 81871508 and 61773246), was supported by the Program for Youth Innovative Research Team in University of Shandong Province, China (Grant No. 2019KJN010), was supported by the Key Program for Research and Development of Shandong Province, China (Key Project for Science and Technology Innovation, Department and City Cooperation) (Grant No. 2019TSLH0315), was supported by the Jinan Program for Development of Science and Technology, in part by the Jinan Program for Leaders of Science and Technology, was supported by the Taishan Scholar Program of Shandong Province of China (Grant No. TSHW201502038).
The authors declare no conflict of interest.