


 , Margherita Lai 1, Luca Didaci 1
1 Department of Electrical and Electronic Engineering, University of Cagliari, via Marengo 2, 09123 Cagliari, Italy
Abstract
The study of inter-regional synchronization between brain regions represents an important challenge in neuroimaging. Electroencephalography, given the high temporal resolution, allows the investigation of brain activity, connectivity, and network organization in time and frequency domains. Here, some of the most common metrics used to estimate the strength of functional interaction between pairs of brain regions are compared using source reconstructed time-series from resting-state high-density electroencephalography. Results show that the investigated metrics, on the basis of their connectivity profiles, may be naturally grouped into two main clusters. In particular, this finding shows that metrics which tend to limit the effects of volume conduction/signal leakage, although based on different properties of the original signals, may be partitioned into a specific homogeneous cluster, whilst the metrics which do not correct for these effects form a separate cluster. Moreover, this effect is even clearer when the analysis is replicated at scalp level. In conclusion, although within each cluster different metrics may still capture specific connectivity profiles, this study provides evidence that the result of an arbitrary choice of metric that either does or does not correct for volume conduction and signal leakage is more relevant.
Keywords
- EEG
- connectivity
- resting-state
- clustering
- source
- classification
It is clearly accepted that neuronal oscillations and their synchronization, as measured between different brain regions, are fundamental for normal brain function. This conclusion has triggered an enormous interest in the development of quantitative techniques aimed to evaluate neuronal synchrony in electrophysiological data, namely electroencephalography (EEG) and magnetoencephalography (MEG). Analysis of the current literature, clearly shows that a large number of metrics have been proposed to quantify inter-regional synchronization. These metrics may roughly be separated into two main categories: those that estimate functional connectivity (FC) and those that estimate effective connectivity (EC). FC is defined as statistical interdependence of neuronal activity recorded from different brain regions. In contrast, EC refers explicitly to the influence that one region exerts over another [1]. Although metrics of EC allow estimation of causal interactions, thus providing information on the direction of interactions, FC metrics are still widely used to estimate whole-brain inter-regional synchronization patterns. The aim of the present paper is to compare a set of commonly used FC metrics, each one able to distinguish (and be influenced by) different aspects of signal interaction [2], so as to understand if different and specific metrics may be grouped on the basis of particular properties of their connectivity profiles. Indeed, each FC metric is based on detection of specific characteristics of the original signals, thus may present inherent advantages and disadvantages. For an exhaustive review of the different FC metrics proposed so far, refer to the recent survey by Kida et al. [2]. Nevertheless, it is not easy to identify the reasons that have motivated authors to choose one specific metric over others. Consequently, in general, it may be difficult to understand how related findings depend on the arbitrary choice of any particular metric. Additionally, it is also difficult to understand the reasons that have motivated the development of tens of new quantitative methods without proper comparison with previously proposed methods. Finally, as pointed out in a recent review [3], different research groups may employ different implementations of FC metrics, an issue that may further hinder the interpretation of results. For all these reasons, in this study, by use of an unsupervised approach, a set of FC metrics are compared that have commonly been used for source reconstructed resting-state EEG connectivity analysis, including: amplitude envelope correlation (AEC) [4], phase lag index (PLI) [5], imaginary component of coherency (iCOH) [6], phase locking value (PLV) [7], and spectral coherence (COH) [8]. It is hypothesized that distinct techniques, although based on different mechanisms of interaction and differently influenced by diverse sources of noise, may still be grouped together on the basis of common properties. The same analysis was reproduced for scalp level data as, to date, several EEG connectivity studies have still implemented this approach.
Freely available [9] and widely used [10-12] eyes-closed resting-state EEG recordings (64 channels, 109 subjects) were used in this study. Raw EEG signals (one minute long) were re-referenced to a common average reference and band-pass filtered to the alpha band (8-13 Hz). Source-reconstructed time-series were obtained by using whitened and a depth-weighted linear L2 minimum norm estimate (wMNE) [13] and projected onto 68 regions of interest as defined by the Desikan-Killiany atlas [14]. Finally, each preprocessed trace was organized into five non-overlapping epochs of 12 seconds.
To perform an exhaustive comparison, it was decided to include some of the more common metrics used to estimate functional interaction between brain regions. AEC [4] is a measure of amplitude coupling based on linear correlations of band-pass filtered envelopes performed after a symmetric orthogonalisation procedure to remove zero-lag correlations. PLI [5] is a measure that ignores zero-lag phase differences and quantifies the asymmetry of the distribution of phase differences between time series. iCOH [6] is given by the cross spectrum divided by the product of the two power spectra and is not affected by linear mixing of an uncorrelated source. The PLV [7] is a measure that quantifies the consistency of phase differences, but is affected by zero-lag. Finally, the COH [8] is given by the squared correlation coefficient that evaluates the consistency of relative amplitude and phase between pairs of signals (in each frequency band) and is strongly affected by the volume conduction effect. In particular, the set of FC metrics investigated in this study includes both metrics that do (AEC, PLI, and iCOH) and do not (PLV and COH) correct for the effects due to volume conduction and signal leakage. A summary of the main properties of the selected FC metrics is presented in Table 0. Despite the importance of their different properties, the effects potentially caused by arbitrary choice of the FC metric are still overlooked, if not ignored. All analysis was performed on five non-overlapping epochs of 12 seconds. The application of each connectivity metric generates a symmetric square (68
| FC metric | Influenced by | Signal leakage correction |
|---|---|---|
| AEC | Amplitude and phase | YES |
| PLI | phase | YES |
| iCOH | amplitude and phase | YES |
| PLV | phase | NO |
| COH | amplitude and phase | NO |
The aim was to study natural clusters without any ‘a priori’ assumptions, including any knowledge concerning cluster number. Thus, an unsupervised approach was used to reveal the existence of different groups and to understand if the grouping underlay any common properties among the different FC metrics. One of the goals of the clustering was to gain insight into the structure of the data, with no ‘a priori’ knowledge about either data distribution or group organization. The clustering procedure was based on a
To assess the clustering quality on the basis of the discovered common properties between different FC metrics, the purity evaluation measure was used. With
For each cluster, the purity value takes into account the number of data points from the most common class in the cluster. So, a value of the purity measure near unity indicates that the clustering obtained individuates a group according to the ground truth of the problem. If there is no correct clustering, a low purity value is obtained and the number of clusters given by the silhouette analysis is meaningless.
The mean global patterns of connectivity from the source analysis, obtained with the different FC metrics, averaged over all 109 subjects and the five epochs, are depicted in Fig. 2.3. Given that the connectivity matrices are shown only to disclose the global patterns of brain region interactions, the values are intentionally not set on the same scale.
As represented in Fig. 1 (left panel), the silhouette analysis for source-based connectivity showed the optimal number of clusters was
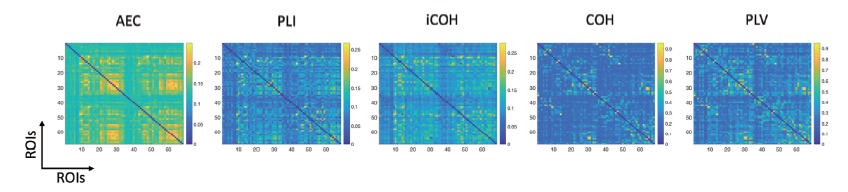 Fig. 1.
The mean global patterns of connectivity for each of the five FC metrics for source-reconstructed analysis. Brain regions are organized as front (left) to back (right) for the left and the right hemisphere, respectively. Connectivity values are intentionally not given at the same scale.
This shows FC metrics that limit the effects induced by volume conduction and signal leakage (namely AEC, PLI, and iCOH) may be grouped together to give a high clustering quality and easy discrimination from other metrics (PLV and COH), which tend to generate spurious connectivity values. In particular, the effect of this property on the consequent group separation is greater than that induced by the other properties, as phase or amplitude interaction mechanisms should characterize the different FC metric. This result suggests, as also visually depicted in Fig. 2.3, that spurious connectivity may in some way overwrite and superimpose the real functional interactions. Furthermore, this finding is strengthened by the scalp level analysis, where the effects of volume conduction and signal leakage should be even more evident. In this latter case, as shown in Fig. 1, the separation into two clusters is still more marked.
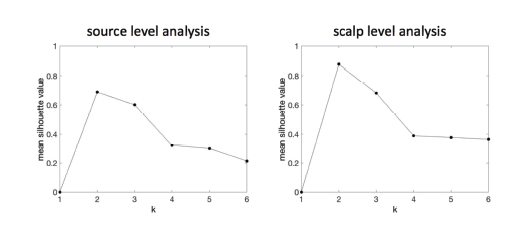 Figure.2.
Mean silhouette values for
In conclusion, this study confirms and suggests that caution should be used when interpreting the results from connectivity analysis, especially when metrics that do not limit the effects induced by volume conduction and signal leakage are implemented.
We thank our colleagues at the University of Cagliari for fruitful discussions.
Authors declare no conflict of interest.