


 , Reza Boostani 2, Karim Rastgar 3
1 Computer Engineering Department, School of Engineering, Shiraz branch, Islamic Azad University, Shiraz, 74731, Iran
2 CSE & IT Department, Electrical and Computer Engineering Faculty, Shiraz University, Shiraz, 74731, Iran
3 Department of Physiology, Shiraz University of Medical Sciences, Shiraz, 74731, Iran
Abstract
Accurate differentiation of mental fatigue levels by analysis of electroencephalogram features is still a challenge. This deficiency originates in the inability of conventional electroencephalogram features to reveal significant changes in fatigue levels. Alternatively, evaluation of the extent of alertness by characterization of the P300 component is widely done by performing a recognition task. The goal of this study is to classify pre- and post-task fatigue levels by tracking the spatial activation of their P300 sources in comparison with differentiation of P300 waveform features. To track these sources, the P300 wave was extracted from the background electroencephalogram from all channels using conventional time-locked synchronous grand averaging over all time frames and subjects. Next, standardized low resolution electromagnetic tomography and shrinking standardized low resolution electromagnetic tomography were both applied to the extracted P300 wave of all channels to estimate the activity of the P300 sources. Thirty healthy subjects were recruited and their electroencephalogram signals were recorded from thirty channels during pre-task (30 minutes), task (60-90 minutes), and post-task (30 minutes) states. During each recording period, an equal number of audio and visual stimuli were applied to the subjects who were performing both audio and visual recognition tasks. Empirical results showed a significant decrease in P300 source activation over tempo-parieto-occipital areas (secondary association area) in the post-task mental fatigue level when compared with the pre-task. It is of interest that in most channels, no significant change in the amplitude/latency of P300 was observed between the two fatigue levels.
Keywords
- electroencephalogram
- P300 sources
- source localization
- mental fatigue
- waveform features
Recently, detection of mental fatigue by analyzing electroencephalogram (EEG) patterns has been of interest[1]. However, research results continue to be unpromising. This is due to the fact that the traditional EEG features employed do not significantly change through different levels of mental fatigue. To confront this challenge, studies have changed strategy and tried to measure fatigue levels by characterizing the P300 waveform to determine how mental fatigue affects amplitude and latency[2].
P300 event-related potentials (ERPs)[2, 3] are probably the most well-known component reflecting the activities of attention, memory, and perception circuits of the brain. Several investigations have been conducted on both characterization and localization of P300 waveform sources. One of the first studies revealed that at least some parts of the waveform are generated in the hippocampal area of the medial-temporal lobe. However, subsequent investigations using scalp recordings on individuals with temporal lobectomy or severe medial-temporal lobe injury showed that the hippocampal formation does not contribute directly to P300 generation[4]. Several studies have suggested that the neuroelectric events underlying P300 generation originate from the interaction amongst frontal, hippocampal/temporal, and parietal regions[5]. Alternatively, examination of functional magnetic resonance (fMRI) images confirms involvement of the frontal, parietal, temporal, and cingulate areas in P300 genesis[6]. Nonetheless, the contribution of medial-temporal structures and hippocampus are not clearly observed in fMRI images[7].
Involvement in rigorous cognitive tasks for long periods of time leads to mental fatigue, a cognitive state accompanied by slowed information processing and increased likelihood of error. During mental fatigue, subjects cannot concentrate on particular issues and their attention is repeatedly distracted. Additionally, mental fatigue seriously affects working memory and learning/perceptual ability, leading to selective attention[8].
Cheng et al.[9] analyzed changes in the EEG of twenty-three subjects before and after mental fatigue by extracting the power spectrum of the EEG signal while also eliciting P300 amplitudes and latency. They recorded their EEG signals before and after the test and 60 minutes after a recognition test. Their results indicated that EEG spectral power showed significant differences before and after a visual recognition task. P300 latency was found to be increased simultaneously with a decrease in its amplitude, explained by degraded activity of the central nervous system. Faber et al.[10] studied the relationship between mental fatigue and attentional changes by analyzing the P300 component. They recorded EEG, reaction times, and response accuracies from 17 healthy subjects while for two hours they performed an adapted Eriksen-Flanker task. The investigators found attention was affected by mental fatigue due to a decreased ability to suppress irrelevant information (selective attention). Trejo et al.[11] studied response time and ERP amplitudes of the N100, P200, and P300 components along with the theta band power in the frontal lobe and alpha rhythms in the parietal lobe in sixteen subjects performing a continuous arithmetic task (for about three hours). Their fatigue and non-fatigue results (before and after the severe mental task) showed that mental fatigue does not have any substantial effect on the N100, P200, and P300 amplitudes or latencies. Additionally, it was observed that P300 amplitudes were larger during the fatigue interval than the non-fatigue interval.
Mockel et al.[12] studied the effect of mental fatigue on ERPs. They asked subjects to perform a Simon task[13] for more than three hours and investigated variations of mental fatigue and motivation. The variations were evaluated at several time points during an experiment divided into three blocks, each with a duration of about one hour. Ratings revealed that subjects experienced increased mental fatigue and decreased motivation during the time of the task. Overall amplitudes of the N200 and P300 components did not show any great variation. It was emphasized that the motivation (without considering the fatigue factor) to continue the task may have better explained how long subjects were able to maintain performance.
Okamura[14] examined the P300 features as reliable measures for evaluating mental fatigue in 12 healthy college students during a continuous two-hour Uchida-Kraepelin test (a questionnaire that measures task performance speed and accuracy). ERPs were measured from the Fz, Cz, and Pz channels, additionally to lactic acid and cortisol concentrations in plasma and reaction times in the oddball paradigm. Results showed a significant difference in the P300 latency before and after the task in such a way that the prolonged P300 latency was related to the amount of fatigue in brain functions. The other factors that were investigated, such as the maximum amplitude of P300, the amount of lactic acid, cortisol and the reaction time, were not significantly changed after the task.
Tanaka et al.[8] investigated magnetoencephalogram (MEG) variations in thirteen healthy subjects who performed a challenging mental task in successive trials, where each task trial lasted for about 30 minutes and subjects took a break and rested between trials. They recorded the MEG of healthy subjects before (alert state) and after the mental task and then they analyzed their MEG signals using adaptive spatial filtering methods. Results suggested a link between over-activation of the visual cortex and cognitive impairment. Trejo et al.[15] analyzed EEG-based estimation and classification of mental fatigue. They asked subjects to solve mathematical problems on a computer for about three hours. Pre- and post-task mood scales showed that fatigue and mean response time increased, but accuracy did not significantly change. They showed that mental fatigue was associated with increased EEG alpha rhythms. In another study, Gharagozlou et al.[16] analyzed EEG alpha power changes in 12 healthy male car drivers while they performed a simulated driving task. Results showed that increased alpha power in the final section of driving indicates a decrease in the level of alertness and attention and the onset of fatigue. They suggested that variations in alpha power might be a good indicator for driver mental fatigue.
Since the relationship between mental fatigue and cognitive performance is not analyzed objectively, this study was conducted to determine the effect of mental fatigue on the activation of P300 sources. Different algorithms have been proposed in the literature for localizing and estimating P300 sources when EEG signals are recorded from different channels. Source localization based on scalp potentials requires a solution to an ill-posed inverse problem. There are several possible solutions as there are many more equations than the number of scalp channels[1, 17]. It is noted that the selection of a particular solution often requires prior knowledge acquired from the overall physiology of the brain (possible location of the sources) and even the mental status of the subjects.
In an effort to solve this problem, several different localization algorithms have been proposed such as low resolution electromagnetic tomography (LORETA)[18], standardized LORETA (sLORETA)[19], focal under determined system solver (FOCUSS) [20], and shrinking LORETA-FOCUSS (SSLOFO)[21]. Mulert et al.[22] used LORETA for localization of P300 sources and their results mainly matched activation regions obtained by intracranial recordings and fMRI. Sabeti et al.[23] used both high and low resolution localization algorithms including simultaneous use of shrinking sLORETA and LORETA to better achieve the boundary and details of P300 sources. Results demonstrated that sources are distributed over a wide region of the cerebral cortex. Schimpf et al.[24] used SSLOFO to localize P300 neural generators. Their results were compatible with those obtained for functional neuroimaging studies while retaining the advantage of EEG temporal resolution.
In this study, both sLORETA and shrinking sLORETA localization schemes are used to estimate the cortical distribution of the P300 sources during two states: pre-task and post-task. To improve localization accuracy a realistic head model was employed to estimate the lead-field matrix, instead ofthe conventional spherical model. Moreover, the proposed localization method is an inverse constraint problem which uses prior physiological knowledge to mark subspaces where sources can occur. For example, focal seizure sources cannot occur at any part of the brain, similarly, P300 sources can be localized to certain subspaces of the brain which are evidently related to attention and memory circuits.
Thirty normal subjects including 20 males and 10 females, whose age ranged from 18 to 30 years (23.40 $\pm$ 3.67 years) participated in this study. All subjects were students recruited from Shiraz University, Shiraz, Iran. The study was approved by the local ethics committee of the Medical University of Shiraz. Each subject was seated upright with their eyes open and the experiment lasted for about 150 minutes. Their neck was firmly supported by the back of the chair, and their feet rested on a footstool to avoid muscle artefacts.
Each subject performed the auditory and visual recognition tasks in three successive sessions. Consequently, the subjects' mind gradually tired. This fatigue trend was divided into three periods, including pre-task (first 30 minutes), task (60-90 minutes) and post-task (last 30 minutes). Each segment contained an equal number of visual and auditory recognition tests where each test included a warning, attention, response and feedback phase.
Fig.1 illustrates the visual test. At the beginning of each test, subjects saw two up and down warning flashes. In the attention phase, a stimulus flash appeared. In the response phase, a question mark appeared and the subject was required to answer which stimulus flash had appeared by pressing the up or down button. In the feedback phase, the feedback of the answer was shown (Either right or wrong). The auditory test was the same as the visual test. However, the subject was required to distinguish between either a low or high pitched tone and background white noise. The visual and auditory tests were applied alternatively. Subjects pressed a button to start the next test. Each visual or auditory test lasted approximately seven seconds.
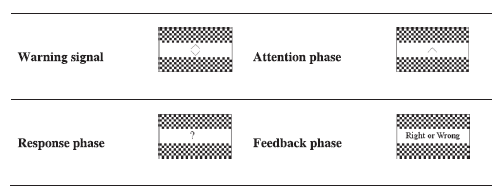 Fig.1.
Illustration of cognitive visual experiment.
Each session contained one-hundred visual tests and one-hundred auditory tests. In the task segment, the subjects were punished for wrong answers where each wrong answer added four more tests to the session. Therefore, the task segment could take a long time when compared with the other two sessions. During the task seession, recognition accuracy was kept under a threshold for each subject for both visual and auditory tasks by decreasing the duration of the attention phase (the recognition task is more difficult compared to the pre-task session).
Electrophysiological data were recorded using a Synamps 32 channel neuroscan system, with a signal gain equal to 75K (150 at the headbox). For EEG paradigms, 30 electrodes (Electrocap 10-20 standard system with reference to linked earlobes) were recorded plus the vertical electrooculogram (VEOG). Eye-blink artefacts were corrected using an Infomax independent component analysis algorithm[25] and elimination of very noisy trials was performed off-line by an experienced physician after visual inspection of recordings. Additionally, EEG signals were filtered by a band pass filter (5th order Butterworth) at 0.5-45 Hz to account for very low frequency noise and up to the power line frequency. According to the international 10-20 system, EEG data were continuously recorded from 30 electrodes (Fp1, Fp2, F3, F4, FC3, FC4, C3, C4, CP3, CP4, P3, P4, O1, O2, F7, F8, FT7, FT8, T3, T4, TP7, TP8, T5, T6, Fz, FCz, Cz, CPz, Pz, Oz) with a sampling frequency of 250 Hz.
The background EEG signal can be described by the spatio-temporal integration of the brain’s neuronal activities. Additionally, when a stimulus is applied to one of the senses (e.g. auditory or visual stimulus),the corresponding sources from specific parts of the brain are activated. According to the source model [17], the linear propagation of electrical currents of the sources appear on the scalp in the form of evoked potentials. In this model it is assumed that a small active region of the brain can be represented as a current dipole source:
It was assumed the volume could be divided into $ {n}_S + 1$ regions with conductivities $ \sigma_{j} $, $ j = 1, \dots, n_S + 1$, which include the nonconducting regions outside the head. These regions are separated by a number of $ {n}_S $ surfaces ($ {S}_{j} $) each with different conductivity $ \sigma _{j} $. Using Green's theorem for solving the Poisson equation ($ \sigma.\nabla 2{V} = \nabla J^{i} $), the EEG channel potentials consisted of the summation of an infinite medium potential $ {v}_{\infty} (r)$, and the volume current effects were determined as follows:
The small triangles are obtained from segmentation of MRI anatomical data and triangulation of the corresponding surfaces. The brain template employed was adopted from the Montreal Neurological Institute (MNI) that is an averaged T1-weighted MR scan from 152 subjects[27,28]. Fig.2 depicts the brain template employed which was divided into three surfaces (brain, skull, and scalp).
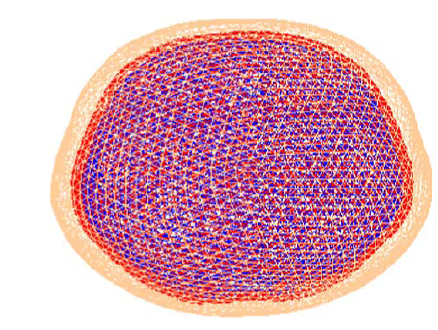 Fig.2.
Brain template includes three surfaces (brain, skull, scalp), the most internal surface shows the brain, the most external scalp.
In the next step, possible source locations were determined to calculate elements of the matrix L. As the brain model is not spherical, it is better to consider source locations based on the real shape and place in the brain. According to prior physiological knowledge, not all parts of the brain are involved in generating the P300 waveform. Thus, P300 source locations were limited to specific areas of the brain such as cortex and the limbic system. Fig.3 shows the assumed source locations in the brain.
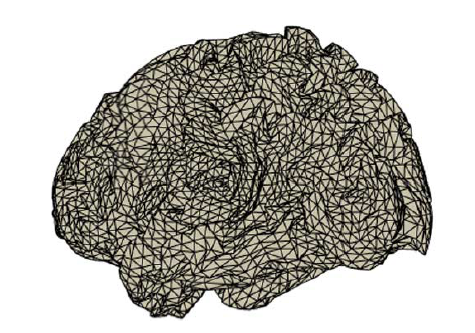 Fig.3.
Assumed source locations in the brain.
Finally, the matrix L (size: $ {n}_{e} \times m $) was calculated. To calculate the first column of L, it was assumed that the first source in location ($ {x}_{1}, y_{1}, z_{1} $) was active. Using BEM, voltages of the cortical nodes can be calculated, followed by calculation of voltages on the skull and scalp nodes. Each column of $L$ contains the potentials received by electrodes when only one source vector has unit amplitude at a single location and the other sources are set to zero. After determining the matrix $L$, the two mentioned localization algorithms are applied to estimate the neural sources of P300 by calculating the elements of the matrix S.
The goal of source localization is to estimate the location of distributed intracerebral sources to create a specific wave pattern which is added to the background scalp EEG. Source localization using the scalp EEGs requires solving an ill-posed inverse problem with several possible solutions. Selection of a particular solution often requires prior physiological knowledge of the correspondence of the mental task to brain activity. The development of efficient localization methods is required to enable physiologists to better interpret the involvement of the requisite brain plocations (cortical and subcortical) in different mental tasks. Using the following cost function, the sLORETA localization algorithm[19] gives a unique solution to the inverse problem:
|
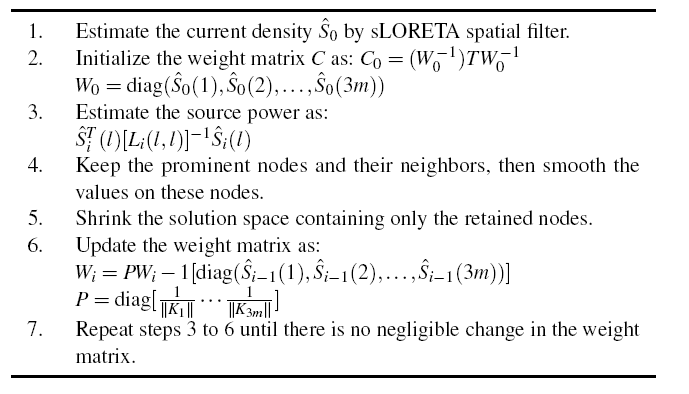
Fig.4 shows the algorithm proposed for P300 source localization.
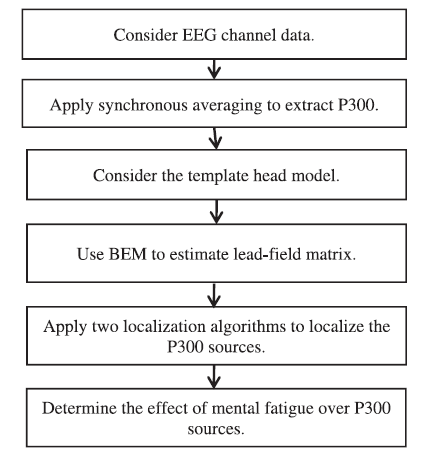 Fig.4.
Algorithm proposed for P300 source localization.
Since a weak ERP waveform is embedded in the strong background EEG, ERP extraction methods assume the background EEG to be white noise and that ERPs do not temporally change. Extraction proceeds by synchronously averaging over ERP trials multiple times (here 40 times). The background EEG is reduced while ERPs are highlighted. EEG epochs following a given stimulus are extracted from the ongoing EEG. Each ERP produces an EEG of size ${n}_{e} \times T$, where ${n}_{e}$ is the number of electrode signals and T is the number of samples of the ERP. Fig.5 shows the grand averaging process over all subjects on the Cz and Pz channels for the auditory and visual stimuli. It is shown that the P300 peak is more detectable in the visual stimulus case compared with that of the auditory case.
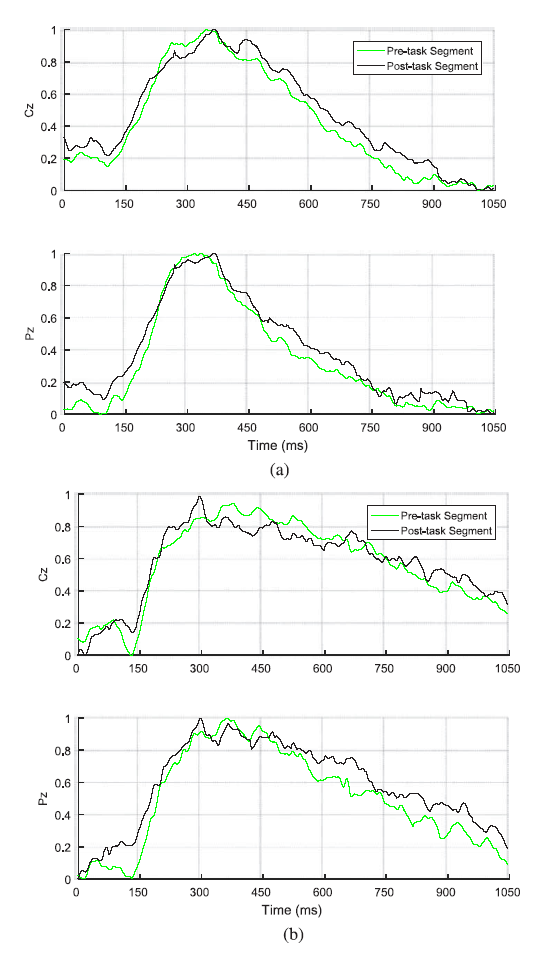 Fig.5.
Grand averaging process for Cz and Pz channels in the pre- and post-task phases for (a) visual stimulus and (b) auditory stimulus.
Latency of elicited P300 components were compared for both pre- and post-task segments. The mean $\pm$ SD of P300 component latency for pre- and post-task phases, averaged over all channels and subjects were 361.40 $\pm$ 21.26 and 432.90 $\pm$ 33.55 for visual and auditory stimuli in pre-task segment respectively, and 366.09 $\pm$ 23.95 and 432.51 $\pm$ 54.00 for visual and auditory stimuli in post-task segment respectively. Differentiation between the P300 latency in the two sessions for different channels is evaluated using the Students' t-test. A confidence level of p < 0.05 was considered statistically significant. The Students' t-test showed that there was no significant difference between P300 latency in the two sessions for two stimuli and for channels located on temporal, left frontal, parietal, and left occipital areas. However, for the right frontal and right occipital areas, there is a significant difference between P300 latency in the two sessions. Additionally, differentiation between the P300 latency for two different stimuli in the same sessions is evaluated using Students' t-test. This showed no significant difference between P300 latency for two different stimuli in the same sessions.
The probability of correct answers for the two stimulus types were compared. The mean $\pm$ SD of probability of correct answers for visual and auditory test was 90.10 $\pm$ 7.83 and 90.93 $\pm$ 9.75 in pre-task segment, and 86.24 $\pm$ 8.90 and 90.89 $\pm$ 7.02 in post-task segment. Differentiation between the probabilities of correct answers in the two states is evaluated using Students’ t-test. Evaluation showed no significant difference in the probability of correct answers between the two segments.
In this study, an EEG signal that reflects brain activity is used to determine the onset of mental fatigue. It was determined that alpha power (8-13 Hz) changed for all subjects in two sessions (pre- and post-task). The power spectrum density was used to determine the relative alpha power, ratio between absolute alpha power, and total spectral power of the signal. EEG power spectrum density was estimated with Welch’s periodogram method at 100 frequencies from 0-100 Hz. The mean $\pm$ SD of relative alpha power in the pre- and post-task phases was 0.038 $\pm$ 0.026 and 0.075 $\pm$ 0.060 respectively. Findings showed a significant increase (p = 0.015) in the relative alpha power in the post-task segment compared to the pre-task one.
Finally, two localization algorithms were employed to estimate the subspace volume of the P300 sources both in the pre- and post-task segments. These algorithms were applied to only part of the ERP interval that contains P300 activity (250-500 msec post-stimulus). These algorithms estimate the active regions corresponding to a specific EEG pattern based on the solution of the following simple equation X = LS where X is the grand averaged P300 all over the channels and subjects, S contains the P300 sources and L is the estimated lead-field matrix. The grand averaged neural sources of the P300 component were analyzed in both pre- and post-task segments.
The output of sLORETA is a blurred image of neural activity in brain which makes it difficult to accurately locate the source position. Therefore, an algorithm with a higher spatial resolution is also needed. A high-resolution method such as shrinking sLORETA is able to localize more focal sources. However, this method is not generally robust for distributed activity and may generate over-focused results. Therefore, high-resolution algorithms are not necessarily better than low-resolution algorithms. It should be emphasised that both low and high resolutions each have their own appropriate applications. Fig.6 and Fig.7 demonstrate the results of applying sLORETA (low-resolution algorithm) to the elicited ERP for the visual stimulus recognition task at all channels in both post- and pre-task segments. Results indicate that the distributed neural sources of P300 in the pre-task segment are located at the right tempo-parieto-occipital (association area), inferior frontal, and left and right cingulate gyrus.
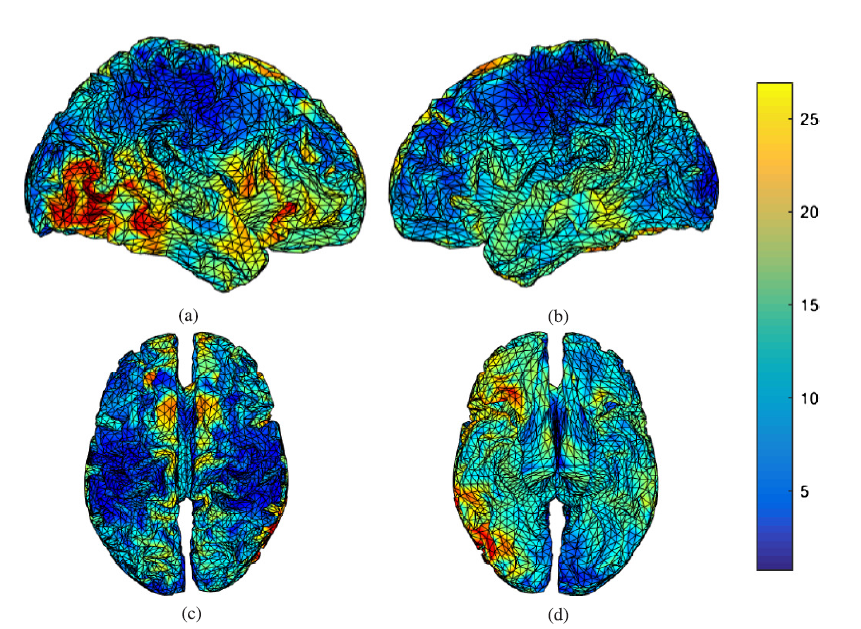 Fig.6.
P300 sources found by LORETA during a visual task in the pre-task sessions, (a) right hemispheric view, (b) left hemispheric view, (c) superior view, and (d) inferior view.
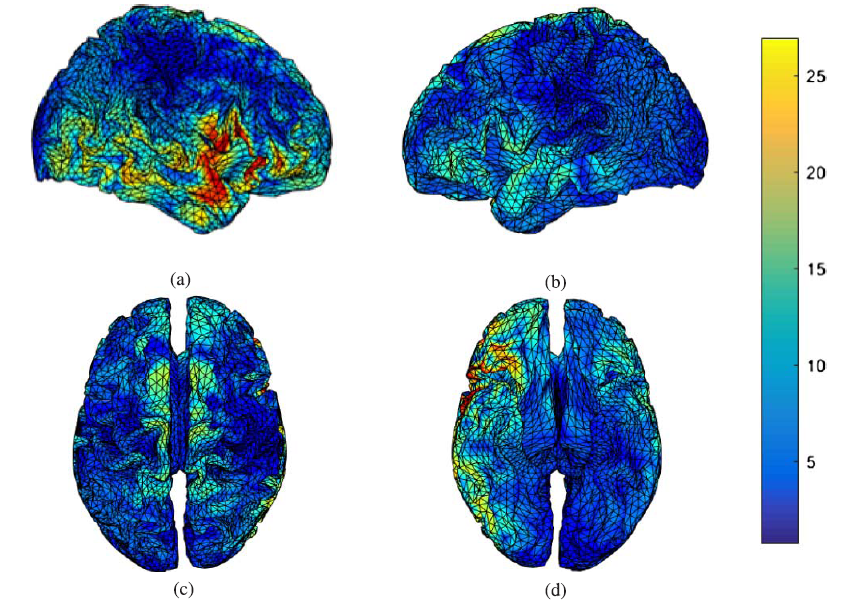 Fig.7.
P300 sources estimated by LORETA during a visual task in the post-task segment, (a) right hemispheric view, (b) left hemispheric view, (c) superior view, and (d) inferior view.
Moreover, the location of these sources moved to the right temporal and right inferior frontal regions in the post-task segment, as shown in Fig.7. Therefore, findings show that the activation of P300 sources in the brain is significantly changed when the mind experiences fatigue. In other words, the mental fatigue affects P300 sources in the brain during the visual recognition task.
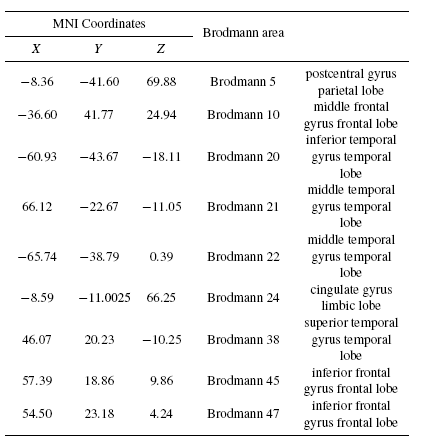
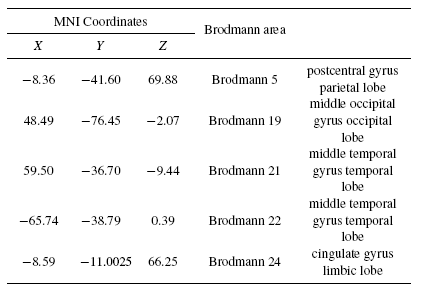
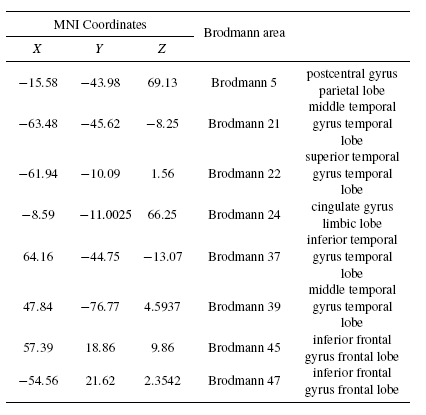
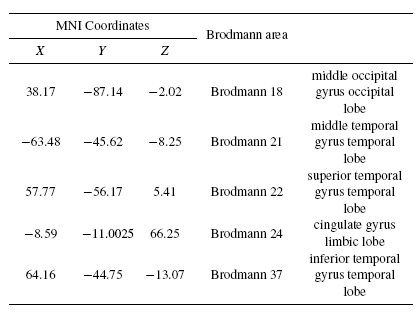
Tables 2 and 3 present the neural generators of P300 found by the shrinking sLORETA (high resolution algorithm) in both the pre- and post-task states for the visual task. As Table 2 shows, a distributed network in the brain generates P300. Some parts of frontal, temporal, and parietal particularly Wernicke's area, and cingulate are detected as P300 neural sources. Results of the shrinking sLORETA in the post-task state demonstrate that Brodmann area 45 (inferior frontal gyrus) shows a weak activity in the post-task state where it has a key role in controlling cognitive memory[29].
|
|
Fig.8 and Fig.9 present the results of applying sLORETA to the grand averaged ERP data for the auditory recognition task in both pre- and post-task segments. Fig.8 shows that the right tempoparieto- occipital (secondary association area) and the left inferior frontal area generate P300 for the auditory recognition task in the pre-task segment. Fig.9 shows that the P300 sources in the post-task session are in the right temporal, prefrontal, association area, in the left and right cingulate gyrus regions. This achievement indicates the significant variation of the strength P300 sources when the mind gets tired.
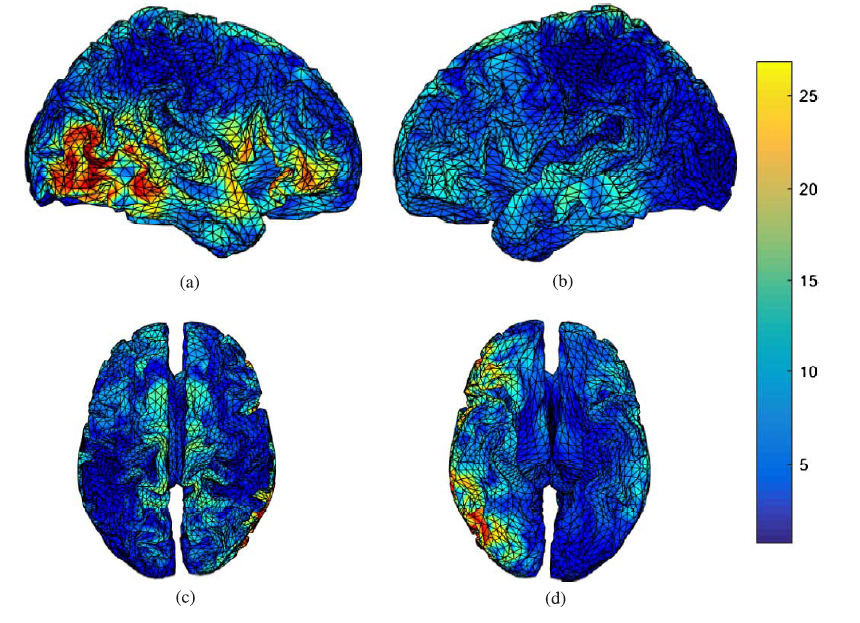 Fig. 8.
P300 sources during an auditory task in the pre-task session found by LORETA, (a) right hemispheric view, (b) left hemispheric view, (c) superior view, and (d) inferior view.
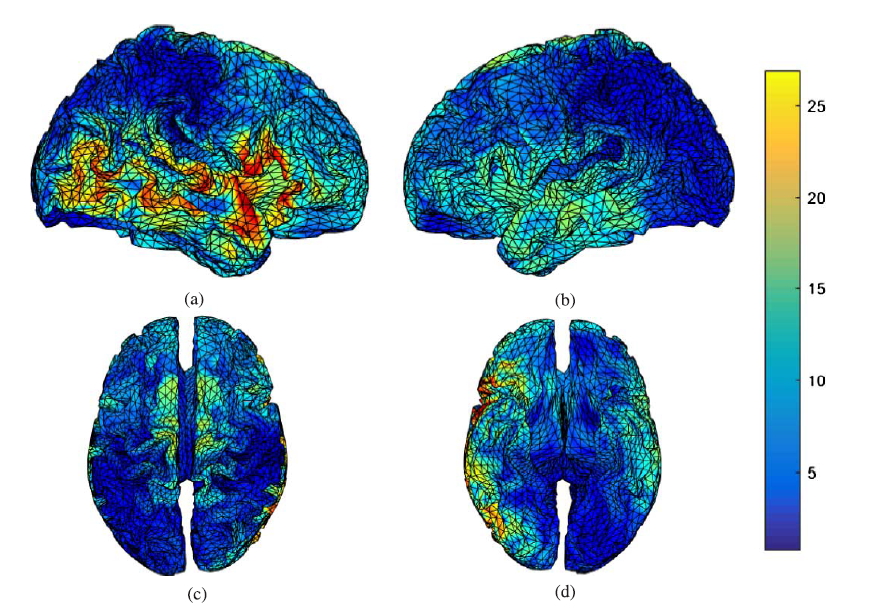 Fig. 9.
P300 sources during the auditory task in the post-task session found by sLORETA, (a) right hemispheric view, (b) left hemispheric view, (c) superior view, and (d) inferior view.
Tables 4 and 5 present the neural sources of P300 found for the auditory task by shrinking sLORETA in both the pre- and post-task states. Comparison of Tables 2 and 4 reveal that most of the sources of P300 in both visual and auditory tasks are fairly similar. Some parts of the frontal, temporal, and parietal - especially Wernicke's area - and the cingulate are detected as P300 sources. Additionally, results of shrinking the sLORETA in the post-task state illustrated that the inferior frontal gyrus shows weak activity due to post-task mental fatigue during the auditory recognition task.
|
|
Since the output of the sLORETA and shrinking sLORETA localization algorithms is a list of voxels on the cortex with assigned current strength value, the Students' t-test was applied to evaluate differences between the P300 sources of the two (pre and post-task) states[30]. The results of this test showed there were significant differences ( p< 0.05) between activation of P300 sources in the pre- and post-task states for both visual and auditory stimuli.
Interesting results are obtained by comparing effective source locations in both the visual and auditory recognition tasks. In the visual task, the P300 component is more clearly detectable. The effect of fatigue on the P300 component is shown with an insignificant increase in latency and an insignificant decrease in the probability of correct answers for the visual task. In the auditory task, none of these patterns appear. Since the P300 wave is not clear in comparison with the visual task, no increased latency and no decrease in the probability of correct answers is seen.
Results presented for this study about the pre-task session demonstrate that association areas are the main source of P300. This has repeatedly been confirmed by former reports[31,32,33]. Overall, results imply that there exist multiple sources distributed over the inferior frontal and association areas of neocortex for generation of the P300 component. It seems that activation of association areas is low in the post-task state due to a decreased rate of neural firing among inter-cerebellar connections.
No general fatigue index for humans has so far been proposed. Fatigue is a subjective experience for which intensity varies from person to person. To determine mental fatigue, some physiological changes such as eye activity, heart rate, skin electrical potential, and specially EEG activity can be used to detect cognitive states[34]. From amongst all the factors mentioned for assessing alertness level, EEG signal[35] may be the most predictive as it immediately reflects brain activity. Several studies[15, 16] have suggested the power of the alpha band as the quantitative indicator for the determination of mental fatigue. In this study, changes in alpha power were determined for all subjects in the two sessions (pre- and post-task). Findings show a significant increase in relative alpha power in the post-task session when compared with the pre-task session.
Dalebout et al.[36] analyzed the variability between subjects (inter-subject variability) and within subjects (intra-subject variability) of the P300 component in comparison with earlier ERP components (such as P1, N1, and P2). Their results showed that intra-subject variability was considerably greater for P300 than for the earlier components. Variation in P300 parameters (latency and amplitude) could be associated with experimental variables (such as intensity or task difficulty), subject trait variables (such as age or cognitive ability), subject arousal level, and measurement error. Despite the capacity of the brain for flexibility that is seen as variability, averaged responses for individual subjects are stable and repeatable. Even the P300 component generated at the highest level of brain systems appears to be repeatable within and comparable among subjects. With this assumption of repeatability of P300, grand averaging was applied over all trials and all subjects. Synchronous grand averaging over time-locked single-trial ERPs is known as the simplest scheme for extraction of the P300 component.
There are no perfect denoising methods. Therefore, a small component of stochastic additive noise such as background EEG, EOG, and electromyography effects remain. Additionally, some other detrimental factors such as fatigue-based effects which change the amplitude and latency of P300, inter- and intra-subject variability, variation of the EEG amplitude and its components (e.g. P300) from one subject to another, etc., cannot be removed. Nevertheless, by taking the grand average over all subjects and their P300 trials, such factors are definitely diminished. What actually happens is that the P300 waveform slightly varies through time for one subject or between subjects. Since no perfect P300 population template extraction exists, by ignoring slight differences in P300, grand averaging can be an acceptable method of approximation and produces reasonable results as shown here.
Subjects in this study experienced mental fatigue. However, they did not sacrifice accuracy as might be expected because of their motivation. This finding accords with a previous study by Trejo et al.[15]. They reported that behavioural activity progressively increases while alertness progressively decreases over time. They reported a progressively slowed response time, but response accuracy was unaffected, no overall slowing of the EEG in mental fatigue, while cognitive fatigue slowed central executive functions such as working memory and decision making. Additionally, Lim et al.[37] analyzed the fMRI of subjects performing a psychomotor vigilance test task for 20 minutes. They found reduced frontal-parietal activity with time and decreased cerebral blood flow in this network with a decline in task performance. They suggested that increased alpha rhythm could be a sign of withdrawal from executive and attentive processing to direct more activity to the default mode network[38,39].
Findings showed that the activation of association areas was lower in the post-task state when compared to the pre-task segment. However, this may be related to decreased brain activity. Since P300 is an endogenous ERP whose generation requires attention and discrimination of stimulus difference, slowing central executive may influence the neural sources of P300. According to previous studies[37, 39], increased default mode network activity has has been associated with prolonged reaction times and lapse of attention. However, in this study response accuracy was not significantly affected.
One defining feature of P300 is its endogenous origins. Therefore, it may not be dependent on stimulus type (the physical parameters). However, authors of several studies[40, 41] have claimed that P300 activity is not independent of the modality of the eliciting stimulus. Ji et al.[40] investigated the topographic and source location of the P300 component for both visual and auditory recognition tasks. Visual inspection along with the quantitative analysis of electrical current source density (CSD) maps revealed that for both tasks, CSDs are more asymmetric in the frontal area but more symmetric in the occipital and temporal areas. Comparison of Tables 2 and 4 show neural activation in widespread neural areas is common for both types of stimuli. There is a relatively symmetric source density in posterior regions with asymmetric current source activities in anterior regions that is concordant with previous reports[40, 42]. These findings confirm the hypothesis of multiple neural generators of the P300 component are differentially active in processing stimuli from different sensory modalities (e.g., visual and auditory modalities). Additionally, activation of postcentral gyrus (primary sensorimotor cortex) may be related to the subject response to both visual and auditory stimulus by pressing a button.
The effect of mental fatigue on the P300 waveform and its sources have not been investigated well. This study was undertaken to trace the sources of the P300 waveform that appears in response to auditory and visual recognition tasks in two different states. Applying sLORETA and shrinking sLORETA to obtain grand average EEG epochs demonstrates the variation in strength of the neural sources of P300 when the pre-task to the post-task states are compared. The variation of P300 sources through different Brodmann areas provides key information to the physiologist so as to identify effects of fatigue on the brain areas involved in cognitive information processing. Moreover, the P300 waveform elicited by grand averaging over all trials and subjects shows an insignificant difference in its latency, throughout the visual and auditory recognition task studied from the pre-task to the post-task states.
All authors declare no conflicts of interest.