


 , Nan Zheng 1,†, Di Wang 1, Ran Teng 1, Xiling Wang 2,*
 , Shanjun Tan 3,*
1 Department of Intensive Care Unit, Women’s Hospital of Nanjing Medical University (Nanjing Women and Children’s Healthcare Hospital), 211166 Nanjing, Jiangsu, China
2 Key Laboratory of Public Health Safety, Ministry of Education, School of Public Health, Fudan University, 200032 Shanghai, China
3 Department of General Surgery/Shanghai Clinical Nutrition Research Center, Zhongshan Hospital, Fudan University, 200032 Shanghai, China
†These authors contributed equally.
Abstract
Currently, vitamin D deficiency is highly prevalent among women of childbearing age. However, the relationship between vitamin D levels and muscle mass reduction in women of childbearing age remains unclear. This study aimed to investigate the association between vitamin D levels and muscle mass reduction in women of childbearing age.
This study included 3934 participants from the National Health and Nutrition Examination Survey (NHANES) 2011–2018. Weighted linear regression and weighted chi-square tests were used to compare baseline characteristics between groups for continuous and categorical variables, respectively. Weighted logistic regression analysis was employed to assess the association between vitamin D levels and muscle mass reduction.
The study population was divided into two groups, 2803 non-muscle mass reduction and 1131 muscle mass reduction participants. The quartile of appendicular skeletal muscle mass (ASM)/body mass index (BMI) for diagnosing muscle mass reduction was determined to be 0.579. Compared with the non-muscle mass reduction group, muscle mass reduction women of childbearing age had a higher prevalence of vitamin D deficiency (p < 0.001) and lower use of vitamin D supplements (p = 0.018). Serum vitamin D levels in the muscle mass reduction group were significantly lower than those in the non-muscle mass reduction group (p < 0.001). After adjusting for confounding variables, weighted logistic regression analysis revealed that insufficient (odds ratio (OR) = 1.34, 95% confidence interval (CI): 1.01–1.78, p = 0.042) and deficient (OR = 1.54, 95% CI: 1.16–2.05, p = 0.003) vitamin D levels were still associated with muscle mass reduction.
Insufficient and deficient vitamin D levels are associated with muscle mass reduction in women of childbearing age, highlighting the potential role of vitamin D in muscle mass reduction management. Vitamin D supplementation may improve muscle mass reduction in vitamin D-deficient women of childbearing age, and its effectiveness needs to be further verified by randomized controlled trials.
Keywords
- NHANES
- cross-sectional study
- muscle mass reduction
- serum vitamin D
- women of childbearing age
Vitamin D deficiency has garnered increasing global attention due to its extensive health implications [1]. Insufficient vitamin D levels not only adversely affect musculoskeletal health but also elevate the risk of various conditions, including diabetes, hypertension, obesity, and metabolic syndrome [2, 3, 4, 5, 6, 7]. Notably, the current study found 89% of women of childbearing age are vitamin D deficient [8]. Women of childbearing age, especially those during pregnancy, are prone to vitamin D deficiency due to increased vitamin D requirements and menstrual cycle-related fluctuations in hormone levels [5, 8]. Vitamin D supplementation can reduce serum anti-Müllerian hormone levels and improve menstrual cycles in patients with polycystic ovary syndrome [9, 10]. Furthermore, vitamin D is associated with the pathogenesis of endometriosis owing to its immunomodulatory and anti-inflammatory properties [11], while deficiency has been linked to preeclampsia and adverse pregnancy outcomes [12, 13]. These findings underscore the critical role of vitamin D among women of childbearing age.
Vitamin D levels play a crucial role in calcium metabolism [14]. Studies indicate that vitamin D is essential for muscle contraction, regulates intracellular water balance, and prevents muscle weakness [15]. Sarcopenia is an age-related syndrome characterized by the loss of skeletal muscle mass and strength [16]. A study found that vitamin D supplementation can improve muscle strength and balance in individuals aged 60 years and above [17]. In another review, vitamin D doses ranging from 4000 IU per day to 60,000 IU per week significantly enhanced upper and lower limb muscle strength [18]. Vitamin D supplementation can enhance mitochondrial biosynthesis and oxidative activity, thereby improving muscle mass and strength to prevent muscle mass reduction [19]. These findings indicate that vitamin D levels are associated with the development of muscle mass reduction.
While sarcopenia is traditionally recognized as an age-related disease with a higher prevalence among the elderly, a recent study found that among three age groups under 50 years old, the prevalence rates of potential sarcopenia in women were 6.3% (21–30 years old), 11.4% (31–40 years old), and 10.3% (41–50 years old) respectively [20]. This indicates that muscle mass reduction is not uncommon in women of childbearing age. Sarcopenia can lead to adverse functional, metabolic, and cognitive outcomes [21, 22]. For women of childbearing age, it may also result in poor pregnancy prognoses. A recent study showed that muscle strength is negatively correlated with adverse pregnancy outcomes such as the onset of gestational diabetes or spontaneous abortion [23]. All these findings highlight the importance of researching muscle mass reduction in women of childbearing age.
In summary, increased vitamin D requirements in women of childbearing age, especially during pregnancy, predispose to vitamin D deficiency. Vitamin D deficiency not only affects musculoskeletal health, but also leads to adverse pregnancy outcomes. It has been found that vitamin D deficiency in the elderly increases the risk of muscle mass reduction, which leads to poor prognosis. Therefore, this study aims to explore the relationship between vitamin D levels and muscle mass reduction in women of childbearing age, and to provide a reference theory for whether timely vitamin D supplementation can improve the occurrence of muscle mass reduction, thereby contributing to the health of women of childbearing age.
Data for this study were derived from the National Health and Nutrition Examination Survey (NHANES), accessible via its official website (https://wwwn.cdc.gov/Nchs/Nhanes/). We combined data from the 2011–2018 NHANES cycles for analysis. The NHANES dataset is compiled using a complex, multistage probability sampling design by the National Center for Health Statistics (NCHS), which ensures the representativeness of the U.S. population and the generalizability of the findings. The survey includes home interviews, standardized physical examinations, and laboratory tests. Ethical approval for the original NHANES design and implementation was granted by the Institutional Review Board of the Centers for Disease Control and Prevention (CDC), with informed consent obtained from all adult participants. As the data were fully anonymized, this study was deemed exempt from review by our institutional board, and we utilized only publicly available data [24].
Our analysis focused on the NHANES cycles from 2011 to 2018, which included variables critical to this study: serum vitamin D levels, muscle mass measurements, and covariates to account for potential confounders.
Blood samples were collected from participants at mobile examination centers
(MECs) by NHANES staff. Serum levels of 25-hydroxyvitamin D2 and D3 [25(OH)D2 and
25(OH)D3] were analyzed using high-performance liquid chromatography-tandem mass
spectrometry (HPLC-MS/MS). The total serum concentration of serum
25-hydroxyvitamin D [25(OH)D] concentrations, which is the sum of 25(OH)D2 and
25(OH)D3, was used to assess vitamin D status. Detailed methodologies are
accessible on the NHANES website
(https://wwwn.cdc.gov/nchs/nhanes/continuousnhanes/labmethods.aspx?Cycle=2011-2012).
Vitamin D status was classified as deficient (
Appendicular skeletal muscle mass (ASM) was measured using dual-energy X-ray absorptiometry (DEXA) in the NHANES study, which evaluates the combined lean soft tissue in the limbs. The body mass index (BMI) is calculated as BMI = weight (kg)/(height (m))2. The diagnosis of muscle mass reduction was established by calculating the ASM/BMI quartile within the study population [26, 27]. Women of childbearing age were defined as those aged 20–49 years.
We included variables that may influence the association between vitamin D and
muscle mass reduction. These variables included sex, age, ethnicity, education
level, hypertension, diabetes, hypercholesterolemia, cardiovascular disease,
activity level, dietary protein intake, and the family income to poverty line
ratio (PIR; categorized as
The complex sampling design and sampling weights were considered in the
statistical analysis following the NHANES analysis guidelines. Data were analyzed
using R 4.1.0.0 (https://www.r-project.org). Categorical variables are presented
as weighted percentages (95% confidence interval [CI]), while continuous
variables are expressed as weighted means (95% CI). Weighted linear regression
and weighted chi-square tests were employed to compare baseline characteristics
between groups for continuous and categorical variables, respectively.
Furthermore, weighted logistic regression was utilized to evaluate associations
between vitamin D levels and muscle mass reduction, adjusting for confounding
variables to estimate odds ratios (ORs) and 95% CIs. Model 1 adjusted for age
and race; Model 2 adjusted for age, race, education, income, alcohol use,
hypertension, diabetes, cardiovascular disease, physical activity, blood draw
season, and vitamin D supplementation. Linear correlation analysis was conducted
to explore the relationships between vitamin D levels and muscle mass reduction.
We analyzed the data and explored missing patterns, and used the multiple
imputation method to impaction the data. p values
Out of 19,849 female respondents, 13,375 were excluded due to being
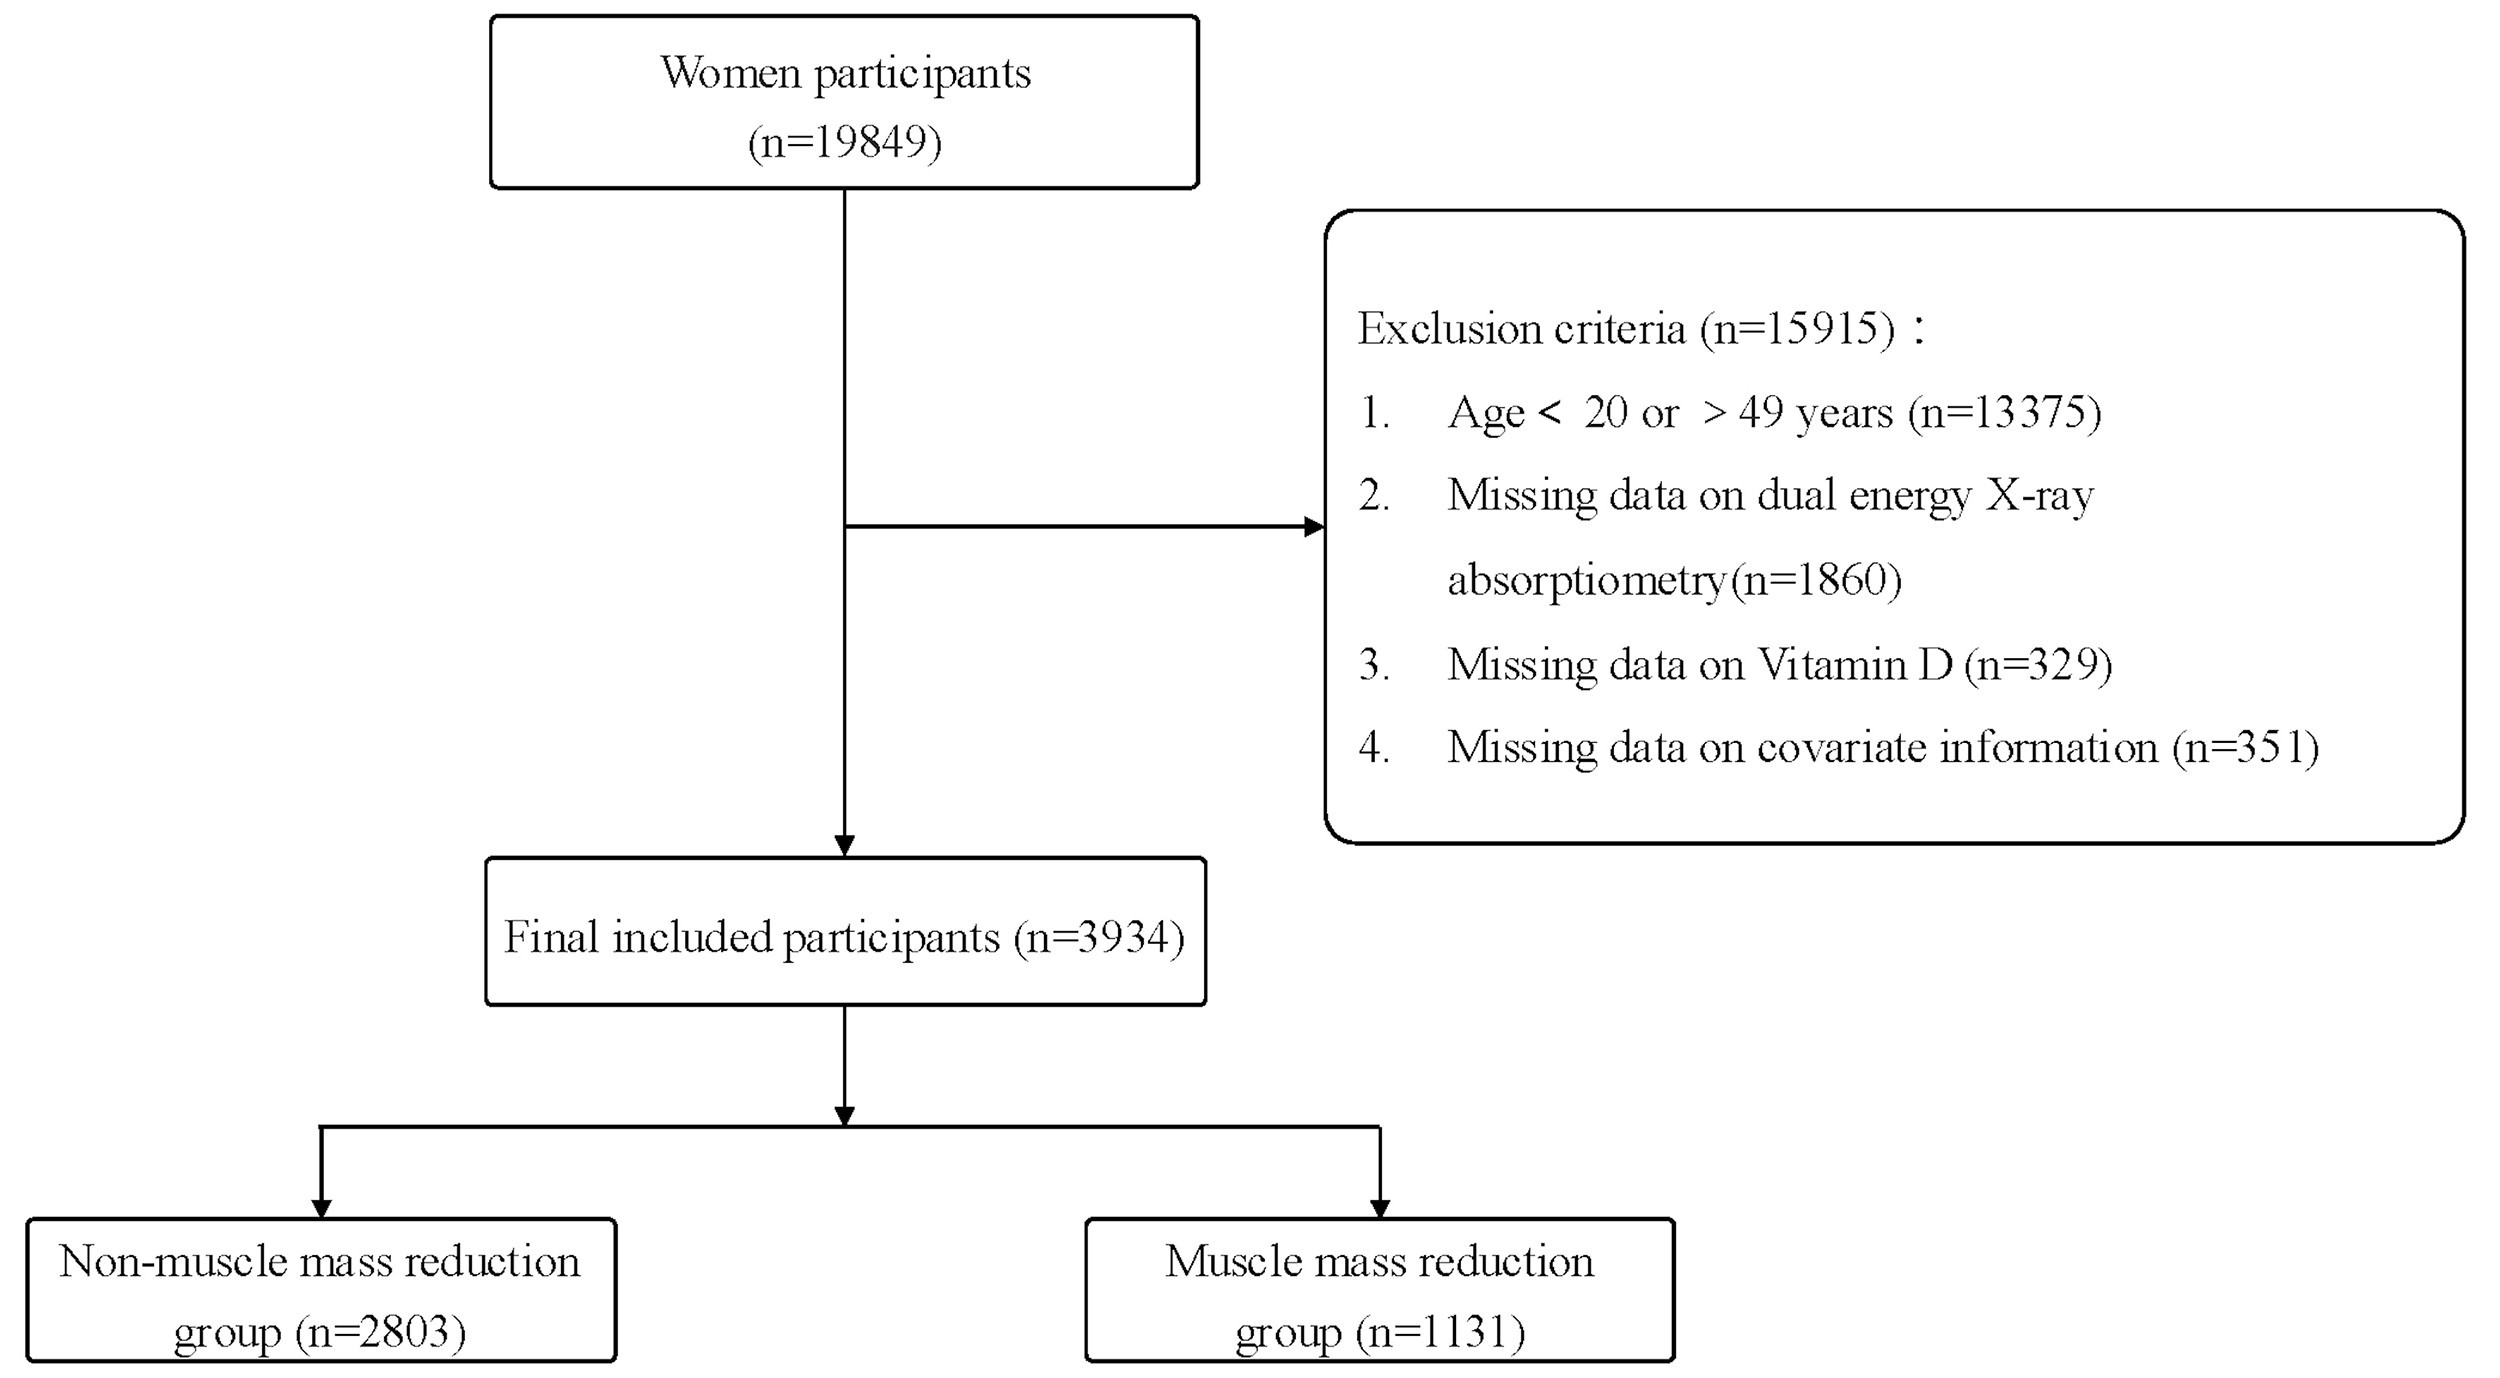 Fig. 1.
Flow of chart.
In this study, the quartile of ASM/BMI for diagnosing muscle mass reduction was
determined to be 0.579. Based on this quartile, the study population was
categorized into two groups: 2803 non-muscle mass reduction subjects and 1131
muscle mass reduction participants. The weighted percentage of muscle mass
reduction in the total population was 28.7%, with a 95% CI of
[27.34~30.16]. Compared to the non-muscle mass reduction group,
women of childbearing age with muscle mass reduction exhibited several
significant differences: they were older (p
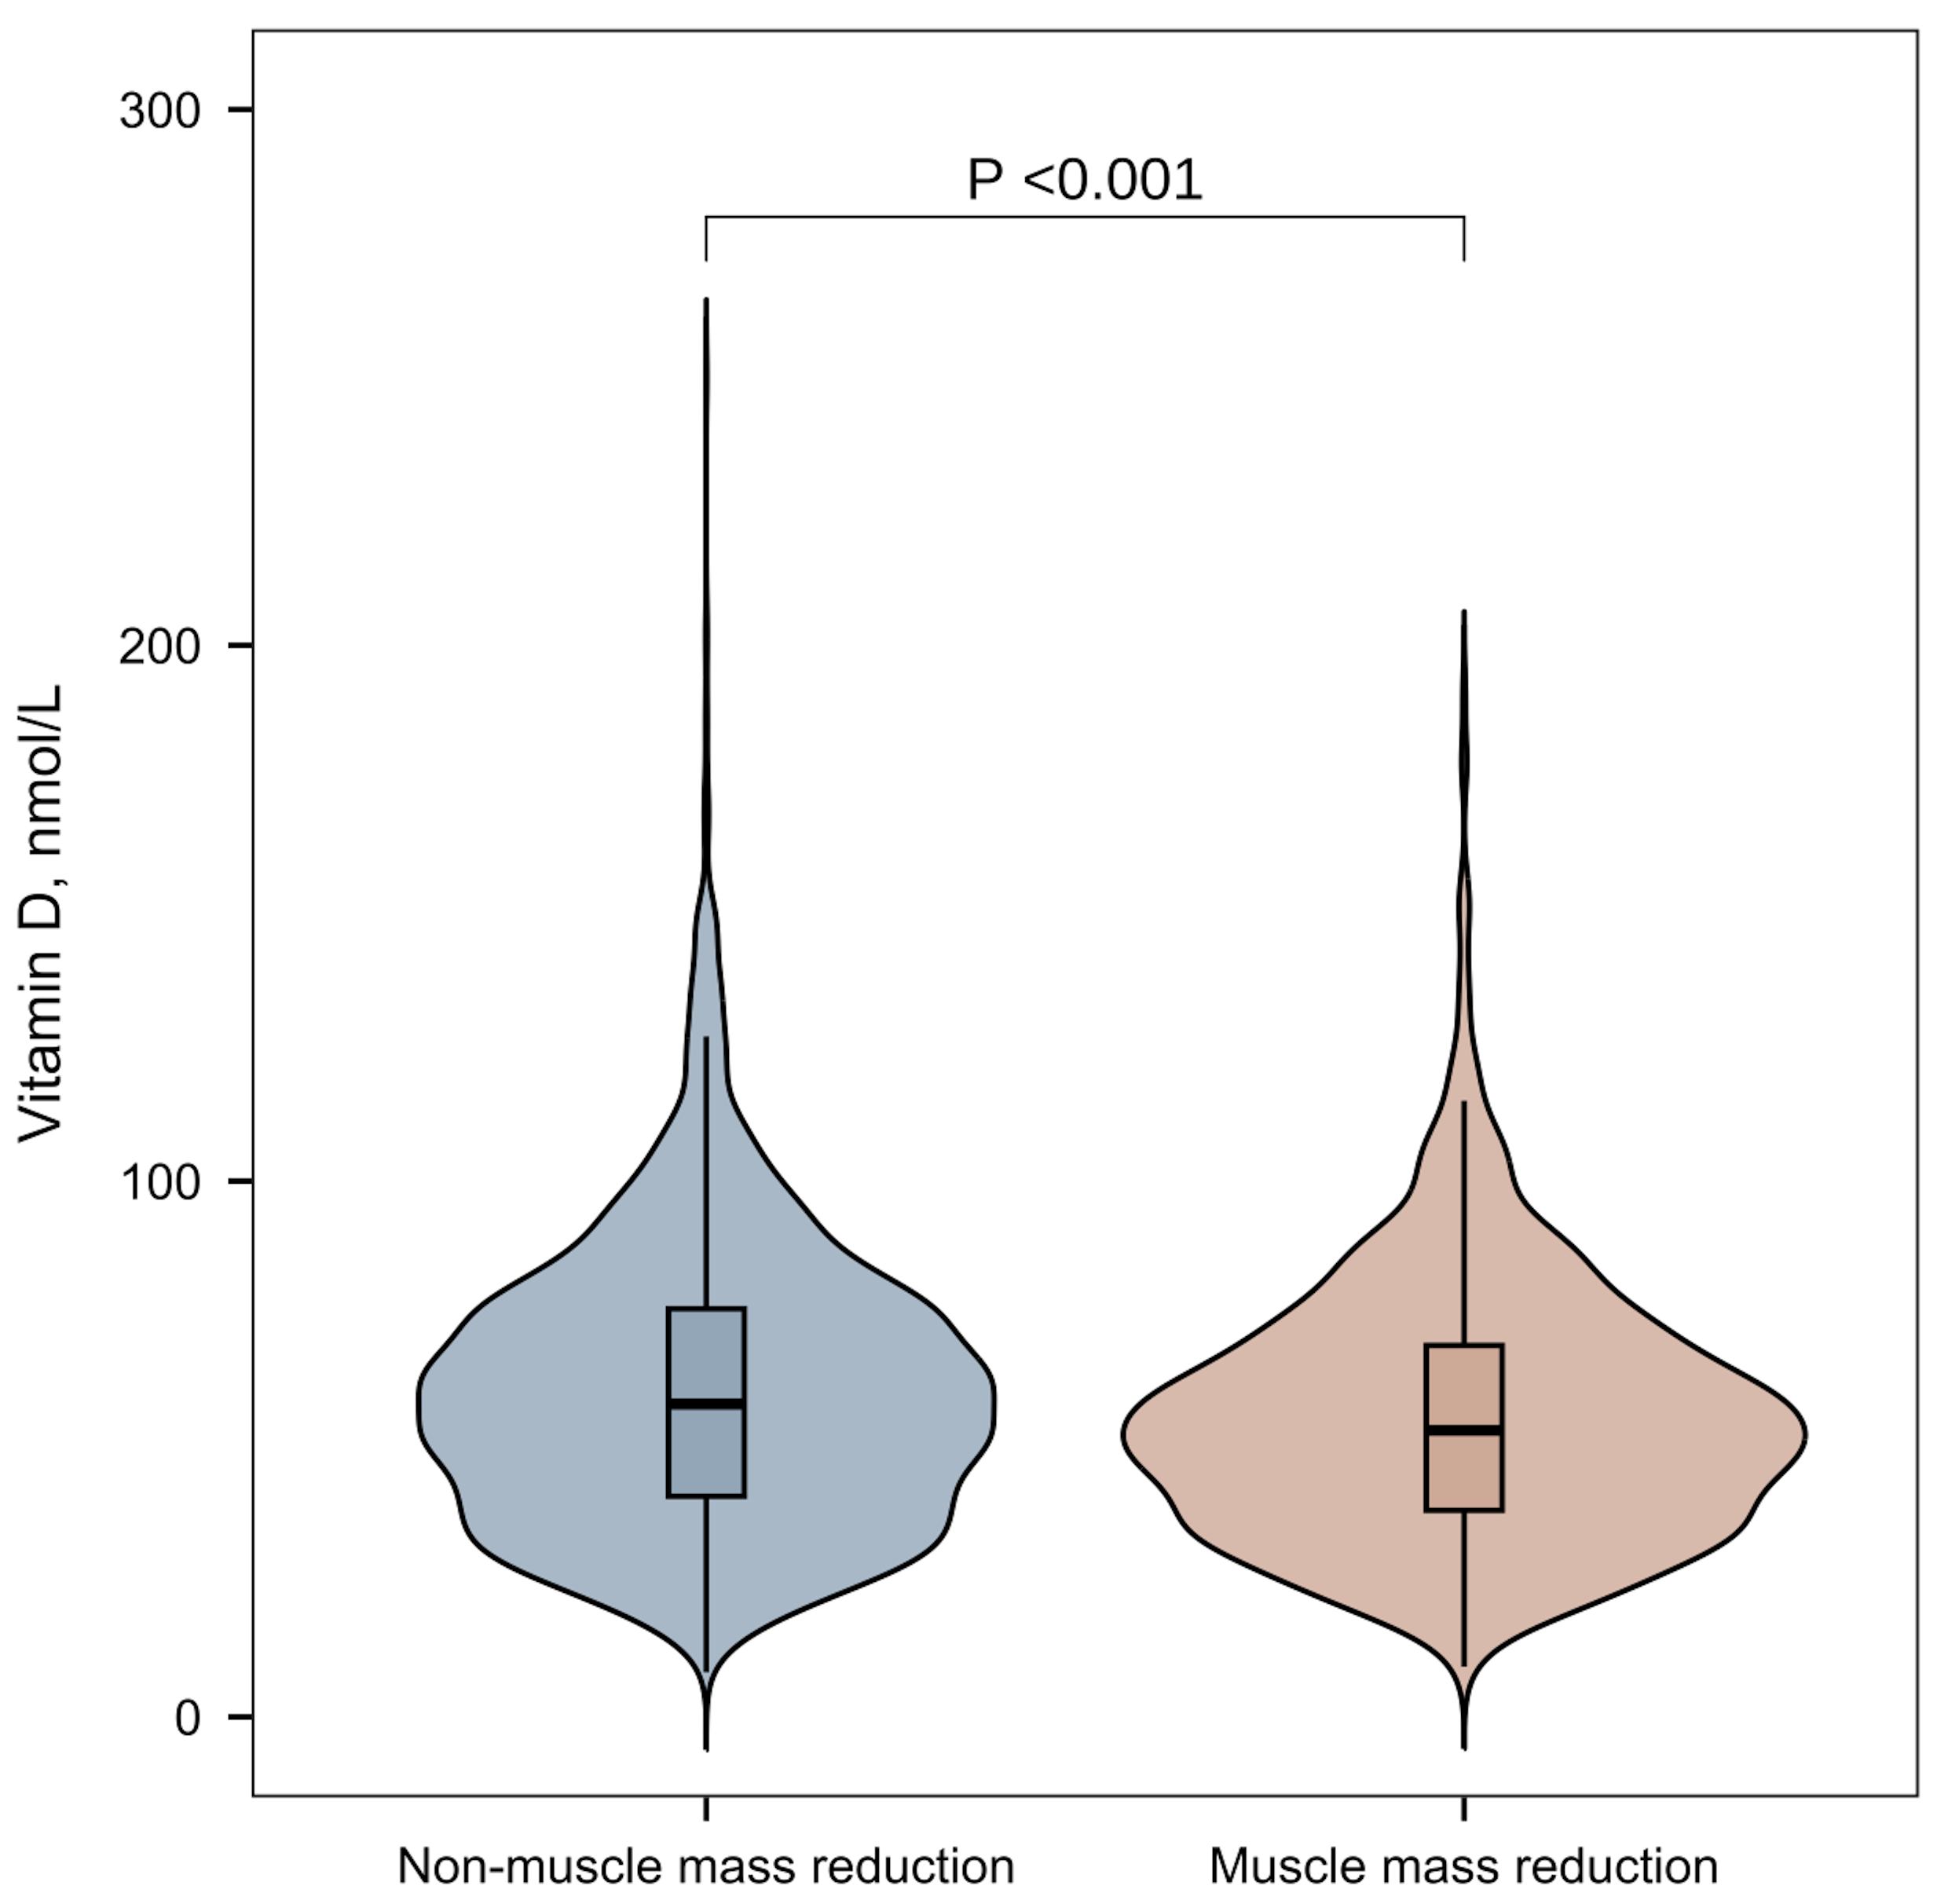 Fig. 2.
Vitamin D levels in women of childbearing age with and without muscle mass reduction.
| Characteristics | Total (n = 3934) | Non-muscle mass reduction (n = 2803) | Muscle mass reduction (n = 1131) | p value | |
| Age, year | 34.59 (34.10, 35.08) | 33.83 (33.23, 34.42) | 36.83 (36.14, 37.52) | ||
| Race and ethnicity, No. (%) [95% CI] | |||||
| Mexican American | 601 (15.3%) [14.15–16.40] | 274 (9.8%) [8.68–10.87] | 327 (28.9%) [26.27–31.55] | ||
| Other Hispanic | 387 (9.8%) [8.91–10.77] | 250 (8.9%) [7.86–9.97] | 137 (12.1%) [10.21–14.01] | ||
| Non-Hispanic White | 1397 (35.5%) [34.02–37.01] | 1070 (38.2%) [36.37–39.97] | 327 (28.9%) [26.27–31.55] | ||
| Non-Hispanic Black | 867 (22.0%) [20.74–23.33] | 723 (25.8%) [24.17–27.41] | 144 (12.7%) [10.79–14.67] | ||
| Other Race — Including Multi-Racial | 682 (17.3%) [16.15–18.52] | 486 (17.3%) [15.94–18.74] | 196 (17.3%) [15.12–19.54] | ||
| Education level, No. (%) [95% CI] | |||||
| Less than 9th grade | 185 (4.7%) [4.04–5.36] | 80 (2.9%) [2.24–3.47] | 105 (9.3%) [7.59–10.98] | ||
| 9–11th grade | 416 (10.6%) [9.61–11.54] | 249 (8.9%) [7.83–9.94] | 167 (14.8%) [12.70–16.83] | ||
| High school graduate | 717 (18.2%) [17.02–19.43] | 476 (17.0%) [15.59–18.37] | 241 (21.3%) [18.92–23.70] | ||
| Some college or associates degree | 1452 (36.9%) [35.40–38.42] | 1078 (38.5%) [36.66–40.26] | 374 (33.1%) [30.33–35.81] | ||
| College graduate or above | 1164 (29.6%) [28.16–31.01] | 920 (32.8%) [31.08–34.56] | 244 (21.6%) [19.18–23.97] | ||
| Family poverty income ratio, No. (%) [95% CI] | |||||
| 1173 (29.8%) [28.39–31.25] | 763 (27.2%) [25.57–28.87] | 410 (36.3%) [33.45–39.05] | |||
| 2761 (70.2%) [68.75–71.61] | 2040 (72.8%) [71.13–74.43] | 721 (63.7%) [60.95–66.55] | |||
| Vitamin D levels, No. (%) [95% CI] | |||||
| Deficient Vitamin D | 1508 (38.3%) [36.81–39.85] | 1030 (36.7%) [34.96–38.53] | 478 (42.3%) [39.38–45.14] | ||
| Insufficient Vitamin D | 1461 (37.1%) [35.63–38.65] | 1025 (36.6%) [34.78–38.35] | 436 (38.5%) [35.71–41.39] | ||
| Sufficient Vitamin D | 965 (24.5%) [23.19–25.87] | 748 (26.7%) [25.05–28.32] | 217 (19.2%) [16.89–21.48] | ||
| BMI (kg/m2) | 29.28 (28.86, 29.70) | 27.60 (27.22, 27.98) | 34.22 (33.44, 35.00) | ||
| ASM, kg | 18.53 (18.34, 18.73) | 19.11 (18.90, 19.32) | 16.83 (16.43, 17.22) | ||
| ASM/BMI | 0.65 (0.64, 0.66) | 0.70 (0.69, 0.71) | 0.49 (0.49, 0.50) | ||
| Dietary protein intake, (g/d) | 71.54 (70.28, 72.80) | 72.30 (70.89, 73.71) | 69.31 (66.94, 71.67) | 0.030 | |
| Alcohol intake, No. (%) [95% CI] | |||||
| Non-drinker | 2780 (70.7%) [69.24–729] | 2071 (73.9%) [72.26–75.51] | 709 (62.7%) [59.87–65.51] | ||
| Drinker | 1154 (29.3%) [27.91–30.76] | 732 (26.1%) [24.49–27.74] | 422 (37.3%) [34.49–40.13] | ||
| Comorbidity | |||||
| Hypertension, No. (%) [95% CI] | |||||
| Yes | 695 (17.7%) [16.47–18.86] | 453 (16.2%) [14.80–17.52] | 242 (21.4%) [19.01–23.79] | ||
| No | 3239 (82.3%) [81.14–83.53] | 2350 (83.8%) [82.48–85.20] | 889 (78.6%) [76.21–80.99] | ||
| Hypercholesterolemia, No. (%) [95% CI] | 0.068 | ||||
| Yes | 645 (16.4%) [15.24–17.55] | 433 (15.4%) [14.11–16.79] | 212 (18.7%) [16.47–21.02] | ||
| No | 3289 (83.6%) [82.45–84.76] | 2370 (84.6%) [83.21–85.89] | 919 (81.3%) [78.98–83.53] | ||
| Diabetes Mellitus, No. (%) [95% CI] | |||||
| Yes | 204 (5.2%) [4.49–5.88] | 113 (4.0%) [3.30–4.76] | 91 (8.0%) [6.46–9.63] | ||
| No | 3730 (94.8%) [94.12–951] | 2690 (96.0%) [95.24–96.70] | 1040 (92.0%) [90.37–93.54] | ||
| Cardiovascular disease, No. (%) [95% CI] | 0.011 | ||||
| Yes | 70 (1.8%) [1.37–2.19] | 37 (1.3%) [0.90–1.74] | 33 (2.9%) [1.94–3.90] | ||
| No | 3864 (98.2%) [97.81–98.63] | 2766 (98.7%) [98.26–99.10] | 1098 (97.1%) [96.10–98.06] | ||
| Physical activity level, No. (%) [95% CI] | |||||
| Active | 1422 (36.1%) [34.65–37.65] | 1124 (40.1%) [38.29–41.91] | 298 (26.3%) [23.78–28.92] | ||
| Insufficient | 69 (19.5%) [18.31–20.79] | 553 (19.7%) [18.26–21.20] | 216 (19.1%) [16.81–21.39] | ||
| Non-active | 1743 (44.3%) [42.75–45.86] | 1126 (40.2%) [38.36–41.99] | 617 (54.6%) [51.65–57.46] | ||
| Smoke, No. (%) [95% CI] | 0.258 | ||||
| No-smoking | 2728 (69.3%) [67.90–70.78] | 1931 (68.9%) [67.18–70.60] | 797 (70.5%) [67.81–73.13] | ||
| Former smoking | 474 (12.0%) [11.03–13.07] | 346 (12.3%) [11.13–13.56] | 128 (11.3%) [9.47–13.16] | ||
| Current smoking | 732 (18.6%) [17.39–19.82] | 526 (18.8%) [17.32–20.21] | 206 (18.2%) [15.96–20.46] | ||
| Vitamin D supplement, No. (%) [95% CI] | 0.018 | ||||
| Yes | 3693 (93.9%) [93.12–94.62] | 2641 (94.2%) [93.36–95.08] | 1052 (93.0%) [91.53–94.50] | ||
| No | 241 (6.1%) [5.38–6.88] | 162 (5.8%) [4.92–6.64] | 79 (7.0%) [5.50–8.47] | ||
| Six-month time period when the examination was performed, No. (%) [95% CI] | 0.003 | ||||
| 1 November through 30 April [% (SE)] | 1886 (47.9%) [46.38–49.50] | 1296 (46.2%) [44.39–48.08] | 590 (52.2%) [49.25–55.08] | ||
| 1 May through 31 October [% (SE)] | 2048 (52.1%) [50.50–53.62] | 1507 (53.8%) [51.92–55.61] | 541 (47.8%) [44.92–50.75] | ||
| Session time of venipuncture, No. (%) [95% CI] | 0.220 | ||||
| Morning | 1846 (46.9%) [45.36–48.48] | 1314 (46.9%) [45.03–48.73] | 532 (47.0%) [44.13–49.95] | ||
| Afternoon | 1362 (34.6%) [33.13–36.11] | 960 (34.2%) [32.49–36.01] | 402 (35.5%) [32.75–38.33] | ||
| Evening | 726 (18.5%) [17.24–19.67] | 529 (18.9%) [17.42–20.32] | 197 (17.4%) [15.21–19.63] | ||
Categorical variables are presented as weighted percentages (95% confidence interval [CI]), continuous variables are expressed as weighted means (95% CI). BMI, Body Mass Index; ASM, Appendicular skeletal muscle mass.
Among the total study population, 1508 individuals had vitamin D deficiency, with a weighted percentage of 38.3% and a 95% confidence interval (95% CI) of [36.81–39.85]. There were 1461 individuals with vitamin D insufficiency, with a weighted percentage of 37.1% and a 95% CI of [35.63–38.65]. Our study (Table 2) shows that the prevalence of vitamin D deficiency among women of childbearing age remained stable across four NHANES cycles. BMI exhibited a marginal increase over the study years, while the prevalence of muscle mass reduction showed an upward trend, although this increase was not statistically significant.
| Characteristics | Total | 2011–2012 | 2013–2014 | 2015–2016 | 2018–2018 | |
| (n = 3934) | (n = 880) | (n = 1138) | (n = 1034) | (n = 882) | ||
| Age, year | 34.59 (34.10, 35.08) | 34.48 (32.94, 36.02) | 34.57 (33.73, 35.42) | 34.97 (34.27, 35.68) | 34.30 (33.63, 34.98) | |
| Race and ethnicity, No. (%) [95% CI] | ||||||
| Mexican American | 601 (15.3%) [14.15–16.40] | 95 (10.8%) [8.75–12.85] | 173 (15.2%) [13.12–17.29] | 203 (19.6%) [17.21–22.05] | 130 (14.7%) [12.40–17.08] | |
| Other Hispanic | 387 (9.8%) [8.91–10.77] | 74 (8.4%) [6.58–10.24] | 115 (10.1%) [8.35–11.86] | 122 (11.8%) [9.83–13.77] | 76 (8.6%) [6.76–10.47] | |
| Non-Hispanic White | 1397 (35.5%) [34.02–37.01] | 328 (37.3%) [34.08–40.47] | 462 (40.6%) [37.74–43.45] | 316 (30.6%) [27.75–33.37] | 291 (33.0%) [29.89–36.10] | |
| Non-Hispanic Black | 867 (22.0%) [20.74–23.33] | 229 (26.0%) [23.12–28.92] | 209 (18.4%) [16.12–20.62] | 228 (22.1%) [19.52–24.58] | 201 (22.8%) [20.02–25.56] | |
| Other Race–Including Multi-Racial | 682 (17.3%) [16.15–18.52] | 154 (17.5%) [14.99–20.01] | 179 (15.7%) [13.61–17.84] | 165 (16.0%) [13.73–18.19] | 184 (20.9%) [18.18–23.54] | |
| Education level, No. (%) [95% CI] | ||||||
| Less than 9th grade | 185 (4.7%) [4.04–5.36] | 28 (3.2%) [2.02–4.34] | 44 (3.9%) [2.75–4.99] | 78 (7.5%) [5.93–9.15] | 35 (4.0%) [2.68–5.26] | |
| 9–11th grade | 416 (10.6%) [9.61–11.54] | 93 (10.6%) [8.54–12.60] | 144 (12.7%) [10.72–14.59] | 92 (8.9%) [7.16–10.63] | 87 (9.9%) [7.90–11.83] | |
| High school graduate | 717 (18.2%) [17.02–19.43] | 140 (15.9%) [13.49–18.33] | 218 (19.2%) [16.87–21.44] | 184 (17.8%) [15.46–20.13] | 175 (19.8%) [17.21–22.47] | |
| Some college or associates degree | 1452 (36.9%) [35.40–38.42] | 325 (36.9%) [33.74–40.12] | 412 (36.2%) [33.41–39.00] | 371 (35.9%) [32.96–38.80] | 344 (39.0%) [35.78–42.22] | |
| College graduate or above | 1164 (29.6%) [28.16–31.01] | 294 (33.4%) [30.29–36.53] | 320 (28.1%) [25.51–30.73] | 309 (29.9%) [27.09–32.67] | 241 (27.3%) [24.38–30.27] | |
| Family poverty income ratio, No. (%) [95% CI] | ||||||
| 1173 (29.8%) [28.39–31.25] | 273 (31.0%) [27.97–34.08] | 347 (30.5%) [27.82–33.17] | 294 (28.4%) [25.68–31.18] | 259 (29.4%) [26.36–32.37] | ||
| 2761 (70.2%) [68.75–71.61] | 607 (69.0%) [65.92–72.03] | 791 (69.5%) [66.83–72.18] | 740 (71.6%) [68.82–74.32] | 623 (70.6%) [67.63–73.64] | ||
| Vitamin D levels, No. (%) [95% CI] | ||||||
| Deficient Vitamin D | 1508 (38.3%) [36.81–39.85] | 354 (40.2%) [36.99–43.47] | 388 (34.1%) [31.34–36.85] | 438 (42.4%) [39.35–45.37] | 328 (37.2%) [34.00–40.38] | |
| Insufficient Vitamin D | 1461 (37.1%) [35.63–38.65] | 310 (35.2%) [32.07–38.38] | 450 (39.5%) [36.70–42.38] | 351 (33.9%) [31.06–36.83] | 350 (39.7%) [36.45–42.91] | |
| Sufficient Vitamin D | 965 (24.5%) [23.19–25.87] | 216 (24.5%) [21.70–27.39] | 300 (26.4%) [23.80–28.92] | 245 (23.7%) [21.10–26.29] | 204 (23.1%) [20.35–25.91] | |
| BMI (kg/m2) | 29.28 (28.86, 29.70) | 28.77 (28.02, 29.52) | 28.81 (28.10, 29.51) | 29.50 (28.77, 30.23) | 30.05 (28.99, 31.11) | |
| ASM, kg | 18.53 (18.34, 18.73) | 18.81 (18.42, 19.19) | 18.31 (18.02, 18.61) | 18.60 (18.18, 19.02) | 18.45 (18.03, 18.86) | |
| ASM/BMI | 0.65 (0.64, 0.66) | 0.67 (0.65, 0.69) | 0.65 (0.64, 0.66) | 0.64 (0.63, 0.66) | 0.64 (0.62, 0.65) | |
| Dietary protein intake, (g/d) | 71.54 (70.28, 72.80) | 69.97 (67.74, 72.19) | 72.45 (70.12, 74.79) | 73.45 (70.43, 76.47) | 70.07 (67.70, 72.45) | |
| Muscle mass reduction, No. (%) [95% CI] | ||||||
| No | 2803 (71.3%) [69.84–72.66] | 668 (75.9%) [73.08–78.73] | 819 (72.0%) [69.36–74.58] | 713 (69.0%) [66.14–71.78] | 603 (68.4%) [65.30–71.44] | |
| Yes | 1131 (28.7%) [27.34–30.16] | 212 (24.1%) [21.27–26.92] | 319 (28.0%) [25.42–30.64] | 321 (31.0%) [28.22–33.86] | 279 (31.6%) [28.56–34.70] | |
| Physical activity level, No. (%) [95% CI] | ||||||
| Active | 1422 (36.1%) [34.65–37.65] | 317 (36.0%) [32.85–39.19] | 393 (34.5%) [31.77–37.30] | 383 (37.0%) [34.10–39.98] | 329 (37.3%) [34.11–40.49] | |
| Insufficient | 769 (19.5%) [18.31–20.79] | 186 (21.1%) [18.44–23.83] | 235 (20.7%) [18.30–23.00] | 182 (17.6%) [15.28–19.92] | 166 (18.8%) [16.24–21.40] | |
| Non-active | 1743 (44.3%) [42.75–45.86] | 377 (42.8%) [39.57–46.11] | 510 (44.8%) [41.93–47.70] | 469 (45.4%) [42.32–48.39] | 387 (43.9%) [40.60–47.15] | |
| Smoke, No. (%) [95% CI] | ||||||
| No-smoking | 2728 (69.3%) [67.90–70.78] | 606 (68.9%) [65.80–71.92] | 778 (68.4%) [65.66–71.07] | 743 (71.9%) [69.12–74.60] | 601 (68.1%) [65.07–71.22] | |
| Former smoking | 474 (12.0%) [11.03–13.07] | 110 (12.5%) [10.31–14.69] | 130 (11.4%) [9.58–13.27] | 115 (11.1%) [9.21–13.04] | 119 (13.5%) [11.24–15.75] | |
| Current smoking | 732 (18.6%) [17.39–19.82] | 164 (18.6%) [16.06–21.21] | 230 (20.2%) [17.88–22.54] | 176 (17.0%) [14.73–19.31] | 162 (18.4%) [15.81–20.92] | |
| Alcohol intake, No. (%) [95% CI] | ||||||
| Non-drinker | 2780 (70.7%) [69.24–72.09] | 625 (71.0%) [68.03–74.02] | 790 (69.4%) [66.74–72.10] | 656 (63.4%) [60.51–66.38] | 709 (80.4%) [77.76–83.01] | |
| Drinker | 1154 (29.3%) [27.91–30.76] | 255 (29.0%) [25.98–31.97] | 348 (30.6%) [27.90–33.26] | 378 (36.6%) [33.62–39.49] | 173 (19.6%) [16.99–22.24] | |
| Comorbidity | ||||||
| Hypertension, No. (%) [95% CI] | ||||||
| Yes | 695 (17.7%) [16.47–18.86] | 148 (16.8%) [14.35–19.29] | 222 (19.5%) [17.21–21.81] | 184 (17.8%) [15.46–20.13] | 141 (16.0%) [13.57–18.41] | |
| No | 3239 (82.3%) [81.14–83.53] | 732 (83.2%) [80.71–85.65] | 916 (80.5%) [78.19–82.79] | 850 (82.2%) [79.87–84.54] | 741 (84.0%) [81.59–86.43] | |
| Hypercholesterolemia, No. (%) [95% CI] | ||||||
| Yes | 645 (16.4%) [15.24–17.55] | 149 (16.9%) [14.45–19.41] | 203 (17.8%) [15.61–20.06] | 165 (16.0%) [13.73–18.19] | 128 (14.5%) [12.19–16.84] | |
| No | 3289 (83.6%) [82.45–84.76] | 731 (83.1%) [80.59–85.55] | 935 (82.2%) [79.94–84.39] | 869 (84.0%) [81.81–86.27] | 754 (85.5%) [83.16–87.81] | |
| Diabetes Mellitus, No. (%) [95% CI] | ||||||
| Yes | 204 (5.2%) [4.49–5.88] | 41 (4.7%) [3.27–6.05] | 55 (4.8%) [3.59–6.08] | 65 (6.3%) [4.81–7.77] | 43 (4.9%) [3.45–6.30] | |
| No | 3730 (94.8%) [94.12–95.51] | 839 (95.3%) [93.95–96.73] | 1083 (95.2%) [93.92–96.41] | 969 (93.7%) [92.23–95.19] | 839 (95.1%) [93.70–96.55] | |
| Cardiovascular disease, No. (%) [95% CI] | ||||||
| Yes | 70 (1.8%) [1.37–2.19] | 18 (2.0%) [1.11–2.98] | 23 (2.0%) [1.20–2.84] | 18 (1.7%) [0.94–2.54] | 11 (1.2%) [0.51–1.98] | |
| No | 3864 (98.2%) [97.81–98.63] | 862 (98.0%) [97.02–98.89] | 1115 (98.0%) [97.16–98.80] | 1016 (98.3%) [97.46–99.06] | 871 (98.8%) [98.02–99.49] | |
| Vitamin D supplement, No. (%) [95% CI] | ||||||
| Yes | 3693 (93.9%) [93.12–94.62] | 836 (95.0%) [93.56–96.44] | 1071 (94.1%) [92.74–95.48] | 977 (94.5%) [93.10–95.88] | 809 (91.7%) [89.90–93.54] | |
| No | 241 (6.1%) [5.38–6.88] | 44 (5.0%) [3.56–6.44] | 67 (5.9%) [4.52–7.26] | 57 (5.5%) [4.12–6.90] | 73 (8.3%) [6.46–10.10] | |
| Six-month time period when the examination was performed, No. (%) [95% CI] | ||||||
| 1 November through 30 April [% (SE)] | 1886 (47.9%) [46.38–49.50] | 456 (51.8%) [48.52–55.12] | 569 (50.0%) [47.09–52.91] | 470 (45.5%) [42.42–48.49] | 391 (44.3%) [41.05–47.61] | |
| 1 May through 31 October [% (SE)] | 2048 (52.1%) [50.50–53.62] | 424 (48.2%) [44.88–51.48] | 569 (50.0%) [47.09–52.91] | 564 (54.5%) [51.51–57.58] | 491 (55.7%) [52.39–58.95] | |
| Session time of venipuncture, No. (%) [95% CI] | ||||||
| Morning | 1846 (46.9%) [45.36–48.48] | 425 (48.3%) [44.99–51.60] | 533 (46.8%) [43.94–49.74] | 468 (45.3%) [42.23–48.30] | 420 (47.6%) [44.32–50.92] | |
| Afternoon | 1362 (34.6%) [33.13–36.11] | 294 (33.4%) [30.29–36.53] | 385 (33.8%) [31.08–36.58] | 367 (35.5%) [32.58–38.41] | 316 (35.8%) [32.66–38.99] | |
| Evening | 726 (18.5%) [17.24–19.67] | 161 (18.3%) [15.74–20.85] | 220 (19.3%) [17.04–21.63] | 199 (19.2%) [16.84–21.65] | 146 (16.6%) [14.10–19.01] | |
Categorical variables are presented as weighted percentages (95% confidence interval [CI]), continuous variables are expressed as weighted means (95% CI). BMI, Body Mass Index; ASM, Appendicular skeletal muscle mass.
The relationship between vitamin D levels and the prevalence of muscle mass
reduction was further examined by adjusting for confounding variables.
Confounding factors such as age, race, education level, family income, drinking
history, hypertension, diabetes, hypercholesterolemia, cardiovascular disease,
activity level, dietary protein intake, blood collection season, and the use of
vitamin D supplements were taken into account. The results indicated that in
Model 1 (Table 3), the odds ratio (OR) for the vitamin D insufficiency group
compared to the vitamin D sufficiency group was 1.50 (OR = 1.50, 95% CI:
1.11–2.02, p = 0.009), while the OR for the vitamin D deficiency group
relative to the vitamin D sufficiency group was 1.94 (OR = 1.94, 95% CI:
1.45–2.60, p
| Variables | Model 1 | Model 2 | |||
| OR (95% CI) | p value | OR (95% CI) | p value | ||
| Vitamin D levels | |||||
| Sufficient Vitamin D | Reference | Reference | |||
| Insufficient Vitamin D | 1.50 (1.11, 2.02) | 0.009 | 1.34 (1.01, 1.78) | 0.042 | |
| Deficient Vitamin D | 1.94 (1.45, 2.60) | 1.54 (1.16, 2.05) | 0.003 | ||
| Age | |||||
| 20 |
Reference | Reference | |||
| 35 |
1.92 (1.57, 2.36) | 1.70 (1.36, 2.12) | |||
| Race and ethnicity | |||||
| Mexican American | Reference | Reference | |||
| Other Hispanic | 0.55 (0.39, 0.78) | 0.001 | 0.57 (0.39, 0.83) | ||
| Non-Hispanic White | 0.27 (0.20, 0.35) | 0.33 (0.25, 0.44) | |||
| Non-Hispanic Black | 0.16 (0.12, 0.23) | 0.15 (0.10, 0.23) | |||
| Other Race — Including Multi-Racial | 0.39 (0.28, 0.52) | 0.45 (0.31, 0.64) | |||
| Education level | |||||
| Less than 9th grade | Reference | ||||
| 9–11th grade | 0.80 (0.50, 1.28) | 0.336 | |||
| High school graduate | 0.86 (0.54, 1.39) | 0.529 | |||
| Some college or associates degree | 0.72 (0.45, 1.17) | 0.177 | |||
| College graduate or above | 0.59 (0.37, 0.95) | 0.029 | |||
| Family poverty income ratio | |||||
| Reference | |||||
| 0.81 (0.65, 1.01) | 0.064 | ||||
| Smoke | |||||
| No-smoking | Reference | ||||
| Former smoking | 0.80 (0.57, 1.11) | 0.063 | |||
| Current smoking | 0.75 (0.58, 0.97) | ||||
| Alcohol intake | |||||
| Non-drinker | Reference | ||||
| Drinker | 1.18 (0.92, 1.51) | 0.176 | |||
| Physical activity level | |||||
| Active | Reference | ||||
| Insufficient | 1.81 (1.26, 2.59) | 0.002 | |||
| Non-active | 1.73 (1.34, 2.22) | ||||
| Six-month time period when the examination was performed | |||||
| 1 November through 30 April | Reference | ||||
| 1 May through 31 October | 0.85 (0.69, 1.05) | 0.133 | |||
| Vitamin D supplement | |||||
| Yes | Reference | ||||
| No | 0.52 (0.28, 0.96) | 0.036 | |||
| Dietary protein intake | 1.00 (1.00, 1.00) | 0.263 | |||
| Hypertension | |||||
| No | Reference | ||||
| Yes | 1.55 (1.15, 2.11) | 0.006 | |||
| Hypercholesterolemia | |||||
| No | Reference | ||||
| Yes | 1.03 (0.76, 1.39) | 0.857 | |||
| Diabetes Mellitus | |||||
| No | Reference | ||||
| Yes | 2.36 (1.45, 3.86) | 0.001 | |||
| Cardiovascular disease | |||||
| No | Reference | ||||
| Yes | 1.77 (0.85, 3.72) | 0.125 | |||
Data are presented as OR [95% confidence interval]. Model 1 was adjusted for age and race. Model 2 was adjusted for age, race, education level, family poverty income ratio, whether taking vitamin D supplement, activity level, dietary protein intake, time period when the examination was performed, history of alcohol intake, smoking history, hypertension, diabetes, hypercholesterolemia and cardiovascular disease. OR, Odds Ratio; CI, Confidence Interval.
Fig. 3 shows a linear correlation between vitamin D levels and ASM/BMI (r =
0.122, p
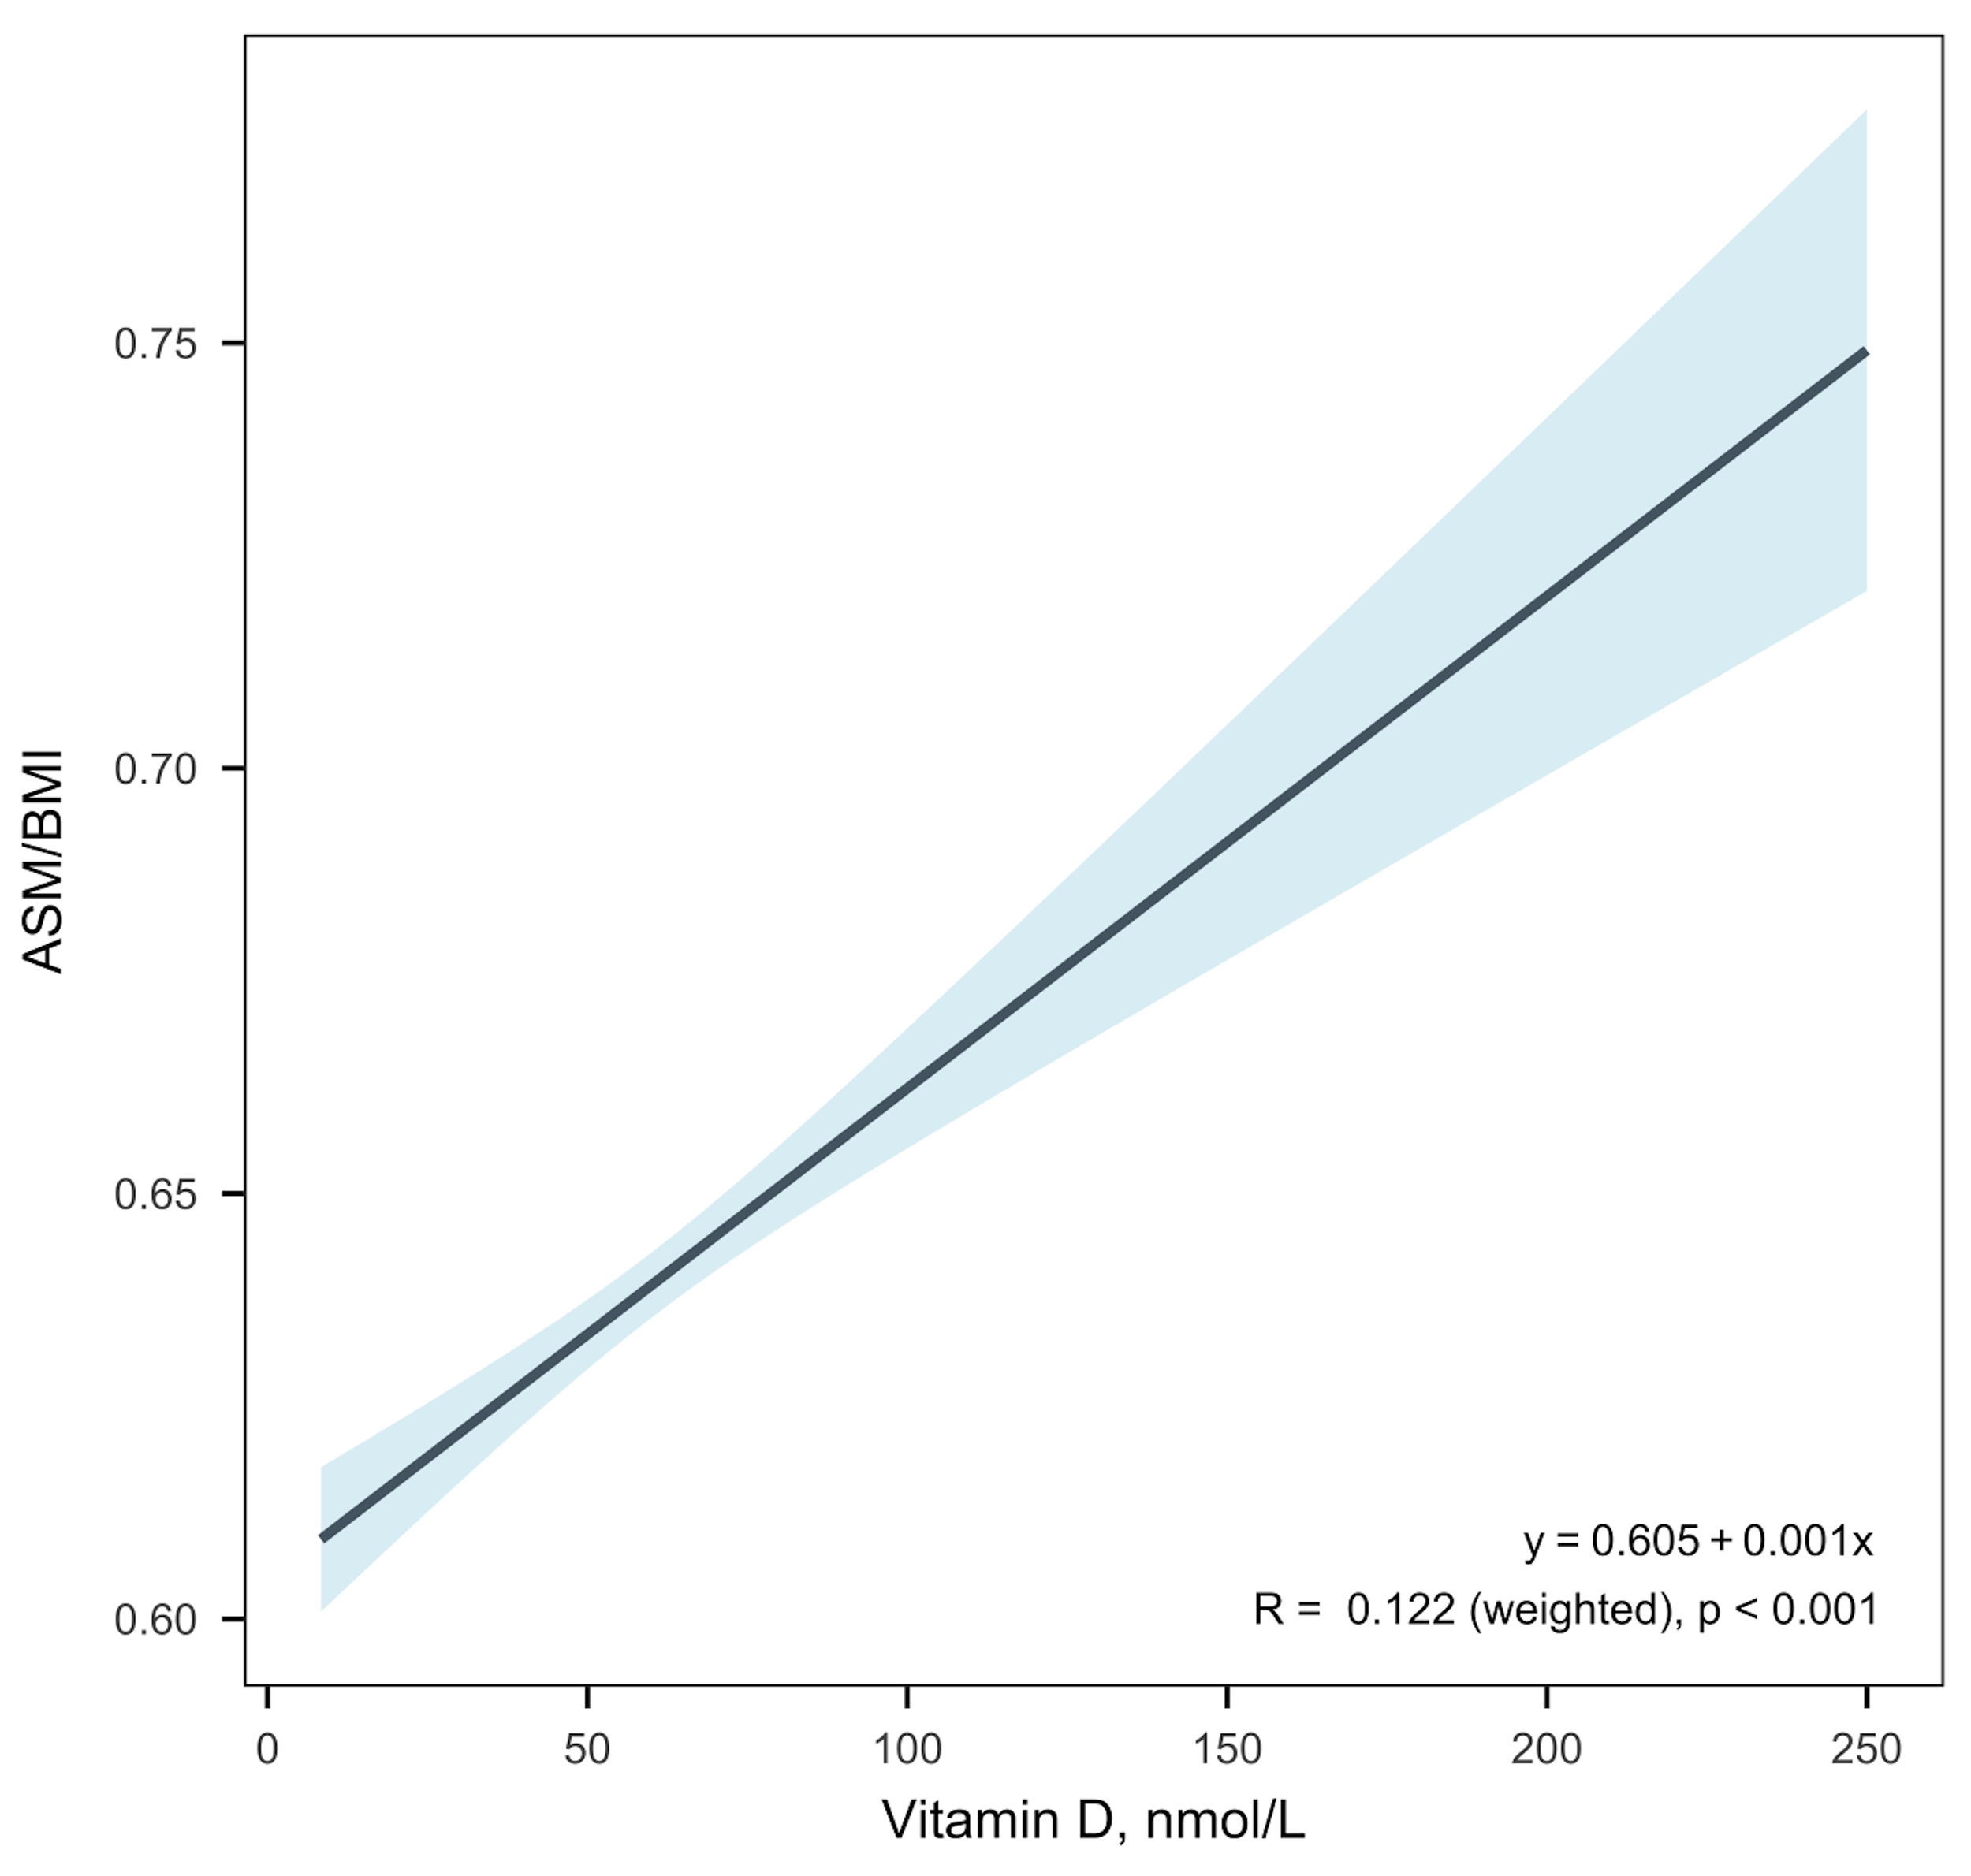 Fig. 3.
Correlation between vitamin D levels and ASM/BMI. BMI, Body Mass Index; ASM, Appendicular skeletal muscle mass.
Our study found a higher proportion of vitamin D deficiency in women of childbearing age with muscle mass reduction compared to non-muscle mass reduction. Serum vitamin D levels in the muscle mass reduction group were significantly lower than those in the non-muscle mass reduction group. After adjusting for confounding variables, weighted multivariate logistic regression analysis confirmed a close association between insufficient or deficient vitamin D levels and muscle mass reduction. Additionally, a linear correlation was observed between vitamin D levels and the ASM/BMI, highlighting the potential role of vitamin D in muscle mass reduction among women of childbearing age.
Our study found high rates of vitamin D insufficiency (37.1%) and deficiency (38.3%) among women of childbearing age, which is consistent with previous reports [29, 30, 31]. Despite the promotion of vitamin D fortified foods and supplements, there has been no significant improvement in this proportion in recent years, reflecting the lack of public awareness of the specificity of vitamin D requirements in childbearing age. Vitamin D deficiency adversely affects fat and bone metabolism and increases the risks of diabetes, metabolic syndrome, and cardiovascular disease [2, 3, 4, 6, 7]. Additionally, vitamin D plays a crucial role in vitamin D has immune regulation and exhibits anti-inflammatory functions, and is associated with endometriosis, polycystic ovary syndrome, etc., thereby impacting the health of women of childbearing age [9, 10, 11]. Furthermore, some studies have indicated that vitamin D deficiency is associated with preeclampsia, adverse pregnancy outcomes, and long-term osteoporosis in children [12, 13, 32]. These findings underscore the critical role of vitamin D in women’s health and its potential association with poor outcomes.
This study is the first to demonstrate a higher prevalence of vitamin D
deficiency among muscle mass reduction women of childbearing age. The skeletal
muscle of women of childbearing age is still in the plastic stage, with an annual
loss of about 1% of muscle mass after the age of 30 [33]. The vitamin D
requirement during pregnancy is 50%–100% higher than that of non-childbearing
women to maintain the health of maternal and child health [34]. Low serum vitamin
D concentrations correlate with muscle mass loss and reduced strength [35, 36, 37],
which in turn increases the risk of muscle mass reduction [38, 39, 40, 41]. A study in
individuals
Vitamin D plays a crucial role in regulating skeletal health by enhancing intestinal absorption of calcium and phosphate. Additionally, it influences muscle metabolism through myofiber proliferation and differentiation, thereby preventing muscle weakness [42, 43]. Deficiency in vitamin D may lead to increased muscle catabolism via the ubiquitin-proteasome system, while vitamin D receptor signaling helps to mitigate skeletal muscle atrophy through the renin-angiotensin system [44]. Furthermore, vitamin D promotes muscle protein synthesis and myogenesis, resulting in increased fiber quantity, diameter, and strength [45]. Our regression analysis confirmed that vitamin D deficiency is an independent risk factor for muscle mass reduction in women of childbearing age, even after adjusting for age and other confounding factors. This suggests that we should pay attention to skeletal muscle evaluation in women with vitamin D deficiency.
Our study found that the occurrence of muscle mass reduction in women of
childbearing age is closely related to vitamin D levels. Previous studies mainly
focused on the elderly, and there were insufficient studies on women of
childbearing age. Current research indicates that vitamin D deficiency is
positively correlated with sarcopenia in women over 50 years old [35].
Additionally, studies have established that sarcopenia in postmenopausal women is
associated with 25-hydroxyvitamin D concentration [40]. These findings align with
the results of this study. Maintaining sufficient serum 25 hydroxyvitamin D could
prevent unfavourable changes in muscle mass in both young and middle-aged adults
[33, 46]. Lower vitamin D levels in muscle mass reduction women of childbearing
age have significant clinical implications, as deficiency may exacerbate
sarcopenia by impairing muscle repair and regeneration while also increasing
inflammation [41]. Elevated levels of interleukin-6 (IL-6) and tumor necrosis
factor-
This article provides a theoretical reference for determining whether timely vitamin D supplementation can reduce the incidence of muscle mass reduction, thereby offering guidance for the health of women of childbearing age. However, the optimal dosage strategy for vitamin D in women of childbearing age requires further research, as responses may vary based on factors such as age, diet, ethnicity, and activity level. Additionally, vitamin D supplementation should not be regarded as a sole intervention for muscle mass reduction. Most current studies suggest combining resistance exercise and whey protein supplementation with vitamin D, where vitamin D serves as a supportive adjunctive measure for individuals with vitamin D deficiency [17, 44, 45, 46]. Further randomized controlled trials (RCTs) are needed to establish safe and effective protocols.
Despite these findings, certain limitations persist. The data were cross-sectional, which precludes causal inferences regarding temporal relationships. Furthermore, the analysis was limited to the NHANES cycles from 2010 to 2018, potentially underestimating the current prevalence of vitamin D deficiency among women of childbearing age in the United States. Therefore, prospective, randomized, double-blinded, multi-centered studies are required to validate these results. In addition, the use of ASM/BMI quartiles to define muscle mass reduction in this study is not a standardized diagnostic criterion, which may overestimate the prevalence. The use of this threshold may reduce comparability with other studies.
Vitamin D insufficiency and deficiency remain highly prevalent among women of childbearing age and are strongly associated with muscle mass reduction, underscoring their potential role in the management of this condition. Vitamin D supplementation may improve muscle mass reduction in vitamin D-deficient women of childbearing age, and its effectiveness needs to be further verified by randomized controlled trials.
ASM, Appendicular skeletal muscle mass; BMI, Body Mass Index; NHANES, National Health and Nutrition Examination Survey; OR, Odds Ratio; CI, Confidence Interval; IL-6, interleukin-6; TNF-
The datasets generated and analyzed in the current study are available at NHANES website: https://www.cdc.gov/nchs/nhanes.
FCX, NZ, XLW and SJT designed the research study. FCX, NZ, DW and RT collected the data. FCX, NZ, DW and RT analyzed and interpreted the data. FCX, NZ drafted the initial manuscript. XLW and SJT provided critical review and insights. All authors contributed to editorial changes in the manuscript. All authors read and approved the final manuscript. All authors have participated sufficiently in the work and agreed to be accountable for all aspects of the work.
Not applicable.
We gratefully acknowledge the participants in the NHANES database.
This research received no external funding.
The authors declare no conflict of interest.
References
Publisher’s Note: IMR Press stays neutral with regard to jurisdictional claims in published maps and institutional affiliations.