


 , Asli Akyol 1, Aylin Ayaz 1
1 Department of Nutrition and Dietetics, Faculty of Health Sciences, Hacettepe University, 06100 Ankara, Turkiye
Abstract
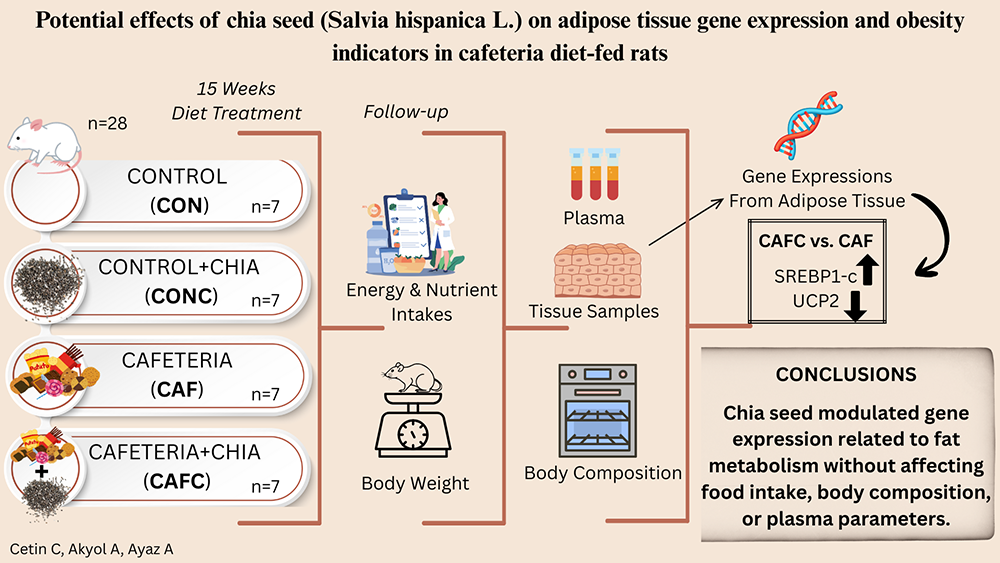
Obesity is a major global health concern, highlighting the need for effective nutritional interventions. Chia seeds (Salvia hispanica L.) are rich in α-linolenic acid and have recently attracted attention for potential metabolic benefits. Thus, this study aimed to investigate the effects of chia seed supplementation on obesity-related indicators in a rat model fed a cafeteria diet.
Three-week-old male Wistar rats (n = 28) were randomly and equally divided into four groups (n = 7 each) and fed the following diets for 15 weeks: control diet (CON), CON with 20% chia seed-supplemented diet (CONC), cafeteria diet (CAF), and CAF with 20% chia seed-supplemented diet (CAFC). Food consumption and body weights were recorded daily. Tissue and plasma samples were collected at the end of the study, and body composition and gene expression levels in white adipose tissues were analyzed.
The CAF and CAFC showed significantly higher energy intake (198 ± 7.76 and 199 ± 7.76 kcal/day, respectively) and weight gain (509 ± 46.3 and 500 ± 33.8 g, respectively) compared to CON (all p < 0.001). However, chia seed supplementation did not significantly alter body composition (p > 0.05). Plasma leptin levels differed among groups (p = 0.017), with the CAF promoting higher levels than the CON (6.26 ± 1.78 vs. 1.20 ± 0.26 ng/mL). Sterol regulatory element binding protein-1c (SREBP-1c) expression was higher in the CAFC than in the CAF (p < 0.001). Chia seed supplementation significantly decreased uncoupling protein 2 (UCP2) expression in the CONC (p < 0.05 vs. CON), and the CAFC showed a trend toward decreased expression (p = 0.053 vs. CAF). Expression of the peroxisome proliferator-activated receptor α (PPARα) and fatty acid desaturase 2 (FADS2) genes was higher in the CON than in the CAF and CAFC (both p < 0.05).
Chia seed supplementation modified specific gene expression levels, but did not impact primary obesity indicators under obesogenic conditions.
Graphical Abstract
Keywords
- Salvia hispanica
- rats
- obesity
- western diet
- gene expression
Obesity is defined as the accumulation of abnormal or excessive fat that can disrupt the maintenance of optimal health [1]. This complicated, chronic, and multifactorial disease has become a major global health concern in recent decades [2]. Sedentary lifestyles and environmental factors are considered to be primary causes of the global obesity and overweight problem [3, 4]. Excessive dietary energy intake—primarily from sugars and fats (saturated and trans fatty acids)—combined with low intakes of vitamins, minerals, and dietary fiber, contributes to weight gain and increases the risk of diet-related diseases [5, 6, 7, 8]. The urgent need for effective public health strategies to prevent obesity and overweight has emerged as a major global health priority [9].
Salvia hispanica L., commonly known as chia seed, belongs to the
Lamiaceae family of plants [10]. The lipid content of chia seeds is between
25–40%, and is composed of 60%
Recent animal studies have shown that chia seeds positively affect lipid and glucose homeostasis, contributing to disease prevention and the management of metabolic disorders [16, 17, 18]. Chia seed supplementation of high-fat diets improved lean body mass, reduced abdominal fat, and alleviated chronic inflammation in rats [19]. In other studies, chia seeds did not prevent weight gain, but enhanced glucose and insulin tolerance and had beneficial cardiac and hepatic effects [20, 21]. These findings indicate the n-3 fatty acid content of chia seeds may be an alternative dietary component against the effects of a high-fat diet [22, 23].
Polyunsaturated fatty acids (PUFAs) regulate basic adipose tissue cell functions
by modulating the activity of key transcription factors such as peroxisome
proliferator-activated receptor (PPAR
The cafeteria diet was developed by Rothwell and Stock to improve obesity models
through feeding of laboratory animals [29]. In this diet, human foods containing
high energy, fat, and sugar (chocolate, biscuits, chips, etc.) are provided in
addition to the normal daily feed of experimental animals. In rodent models that
are resistant to the development of obesity with a normal diet, the cafeteria
diet results in significantly increased food intake, body weight, and adipose
tissues as the taste threshold and food variety increase [30]. The cafeteria diet
has been proposed as the closest experimental model to the Western-style diet,
which is considered one of the most important factors in the development of
obesity in humans due to its high energy, saturated fat, salt, and sugar content,
with low content of vitamins, minerals, and essential nutrients [31, 32, 33]. To our
knowledge, the possible benefits of chia seed supplementation of the cafeteria
diet have yet to be explored. The aim of this study was therefore to investigate
the potential protective effects of chia seeds on cafeteria diet-induced obesity
in rats, as well as their effect on the expression of several key genes in
adipose tissue, namely PPAR
The experimental group was comprised of 28 male Wistar albino rats (3-weeks old) provided by Kobay Experimental Animals Laboratory Inc. All
animals were individually housed on shavings in plastic cages at the Laboratory
Animals Research and Application Centre, Hacettepe University, under controlled
conditions (22
| Energy and nutrients | CON diet | CONC diet | ||||
| g (%) | kcal (%) | g (%) | kcal (%) | |||
| Macronutrients | ||||||
| Carbohydrate | 63.9 | 63.9 | 63.9 | 63.9 | ||
| Corn starch | 39.7 | 39.7 | 32.5 | 32.5 | ||
| Dextrinized corn starch | 13.2 | 13.2 | 13.2 | 13.2 | ||
| Sucrose | 10.0 | 10.0 | 10.0 | 10.0 | ||
| Chia seed1 | - | - | 7.2 | 7.2 | ||
| Fat2 | 7.0 | 15.8 | 7.0 | 15.8 | ||
| Soybean oil | 7.0 | 15.8 | 1.1 | 2.5 | ||
| Chia seed | - | - | 5.9 | 13.3 | ||
| Protein | 20.3 | 20.3 | 20.3 | 20.3 | ||
| Casein | 20.0 | 20.0 | 15.4 | 15.4 | ||
| L-cysteine | 0.3 | 0.3 | 0.3 | 0.3 | ||
| Chia seed | - | - | 4.6 | 4.6 | ||
| Energy (kcal/g of diet) | 4 | 4 | ||||
| Sugar (g/g diet) | 0.11 | 0.11 | ||||
| Dietary fiber (g/g diet) | 0.05 | 0.09 | ||||
| Saturated fat (g/g diet) | 0.01 | 0.01 | ||||
| Sodium (mg/g diet) | 1.02 | 1.02 | ||||
CON diet, control diet; CONC diet, control+chia diet. Both diets also contained vitamin mix (V10001) 1%, mineral mix (S10026) 1%, choline bitartrate 0.25%, methyl paraben 0.0014%, dicalcium phosphate 1.3%, calcium carbonate 0.55%, and potassium citrate 1.7%. 1Chia seed: 200 g/kg diet. 2Saturated fat content (g/100 g diet) of the CON and CONC diets was 1.12 and 0.7, respectively as stated by the manufacturer.
| Energy and nutrients | Chia seed |
| Energy (kcal/100 g) | 434 |
| Carbohydrate (g/100 g) | 35.8 |
| Sugar (g/100 g) | 0 |
| Fiber (g/100 g) | 31.9 |
| Protein (g/100 g) | 22.9 |
| Fat (g/100 g) | 29.3 |
| Fatty acid composition (% of total lipid)1 | |
| Palmitic acid (C16:0) | 8.13 |
| Stearic acid (C18:0) | 4.32 |
| Oleic acid (C18:1) | 7.05 |
| Linoleic acid (C18:2) | 17.0 |
| Linolenic acid (C18:3) | 58.3 |
| Total saturated fatty acids | 5.79 |
| Total monounsaturated fatty acids | 2.38 |
| Total polyunsaturated fatty acids | 24.9 |
| Omega-3 | 19.2 |
| Omega-6 | 5.61 |
| Omega-3/Omega-6 ratio | 3.43 |
| Mineral composition (mg/100 g) | |
| Sodium (mg) | 0 |
| Potassium (mg) | 641 |
| Calcium (mg) | 538 |
| Iron (mg) | 9.54 |
| Magnesium (mg) | 277 |
| Phosphorus (mg) | 594 |
| Zinc (mg) | 4.76 |
| Copper (mg) | 1.64 |
| Manganese (mg) | 12.4 |
| Total phenolic content (mg GAE/g) | 3.422 |
GAE, Gallic acid equivalent. Energy and nutrient values were provided by the supplier; fatty acid and mineral compositions were analyzed by an external laboratory.
1Fatty acid composition was analyzed as fatty acid methyl esters derived from lipids extracted from chia seeds.
2Total phenolic content was obtained from the literature [38].
After an overnight fast, rats were terminally anesthetized with isoflurane at
the end of the intervention period. Blood samples were obtained using cardiac
puncture and collected into heparinized capillary tubes. Samples were then
transferred to Eppendorf Tubes for centrifugation at 3000
Body cavities of animals were opened and major organs were removed and weighed, including the liver, brain, kidneys, gonadal (GWAT) and peri-renal white adipose tissues (PWAT), and interscapular brown adipose tissue (IBAT). The organs were placed in punctured sterile bags and immersed in liquid nitrogen, followed by storage at –80 °C for subsequent assays. The weight of adipose tissue and organs are presented as a percentage of the animal’s total weight (relative).
The body length (naso-anal distance) of anaesthetized rats was recorded before
euthanasia. Body weight and length were used to determine the Lee obesity index,
calculated as
The body composition was assessed through chemical analysis of the carcass, which is the reference method for determining rat body composition [42]. Whole carcasses were oven-dried to assess body water levels. The dried carcasses were then homogenized and sampled to estimate nitrogen content using the Kjeldahl method, and fat content using Soxhlet extraction.
Commercially available ELISA kits were used to assess plasma total cholesterol (Shanghai Sunred Biological Technology Co., Ltd., Shanghai, China; Cat. No. 201-11-0785), triglycerides (Shanghai Sunred Biological Technology Co., Ltd., Shanghai, China; Cat. No. 201-11-0250), insulin (Crystal Chem Inc., Elk Grove Village, IL, USA; Cat. No. 90060), leptin (Crystal Chem Inc., Elk Grove Village, IL, USA; Cat. No. 90040) and C-peptide (Crystal Chem Inc., Elk Grove Village, IL, USA; Cat. No: 90055), as per the manufacturers’ instructions [39]. Plasma glucose concentration was measured with the glucose oxidase method and a fully automated biochemical analyzer (BS-300, Shenzhen Mindray Bio-Medical Electronics Co., Ltd., Shenzhen, China) [43].
Gene expression levels of SREBP-1c, UCP2,
PPAR
The data were analyzed with SPSS version 23.0 (Statistical Package for Social
Sciences, Inc., Chicago, IL, USA). Results are expressed as the mean
Food consumption and nutrient intake were the primary outcomes of this study
(Table 3). Diet significantly influenced food consumption (p
| Parameter | Group | SE | p | |||
| CON | CONC | CAF | CAFC | |||
| n = 7 | n = 7 | n = 7 | n = 7 | |||
| Food consumption (g/day) | 25.4a | 32.3b | 41.8c | 42.2c | 1.64 | |
| Water consumption (g/day) | 21.2a | 26.3ab | 31.9b | 28.7ab | 1.89 | 0.004 |
| Energy (kcal/day) | 102a | 129a | 198b | 199b | 7.76 | |
| Carbohydrate (g/day) | 16.2a | 20.6b | 20.5b | 20.4b | 0.86 | 0.003 |
| Fiber (g/day) | 1.27a | 1.61b | 1.78b | 1.84b | 0.07 | |
| Sugar (g/day) | 2.56a | 3.26a | 6.30b | 5.82b | 0.35 | |
| Protein (g/day) | 5.15a | 6.55b | 5.64ab | 5.93ab | 0.24 | 0.003 |
| Fat (g/day) | 1.78a | 2.26b | 10.0c | 10.1c | 0.49 | |
| Saturated fat (g/day) | 0.28a | 0.23b | 4.09c | 3.93c | 0.21 | |
| Sodium (mg/day) | 25.9a | 32.8b | 231c | 247c | 14.6 | |
CON, control diet; CONC, control+chia diet; CAF, cafeteria diet; CAFC,
cafeteria+chia diet; SE, pooled standard error. Values shown are the mean with
pooled standard error. Repeated measures analysis of variance (ANOVA) was used
for the analysis, and Bonferroni or Tamhane post hoc tests were used for
pairwise comparisons according to the homogeneity of variances. Mean values with
non-identical superscript letters were significantly different (p
The type of diet affected energy intake, with the CAF and CAFC groups having
higher intakes than CON and CONC groups (p
Changes in rat body weight over time are shown in Fig. 1A. Diet significantly
influenced the body weight of animals (p
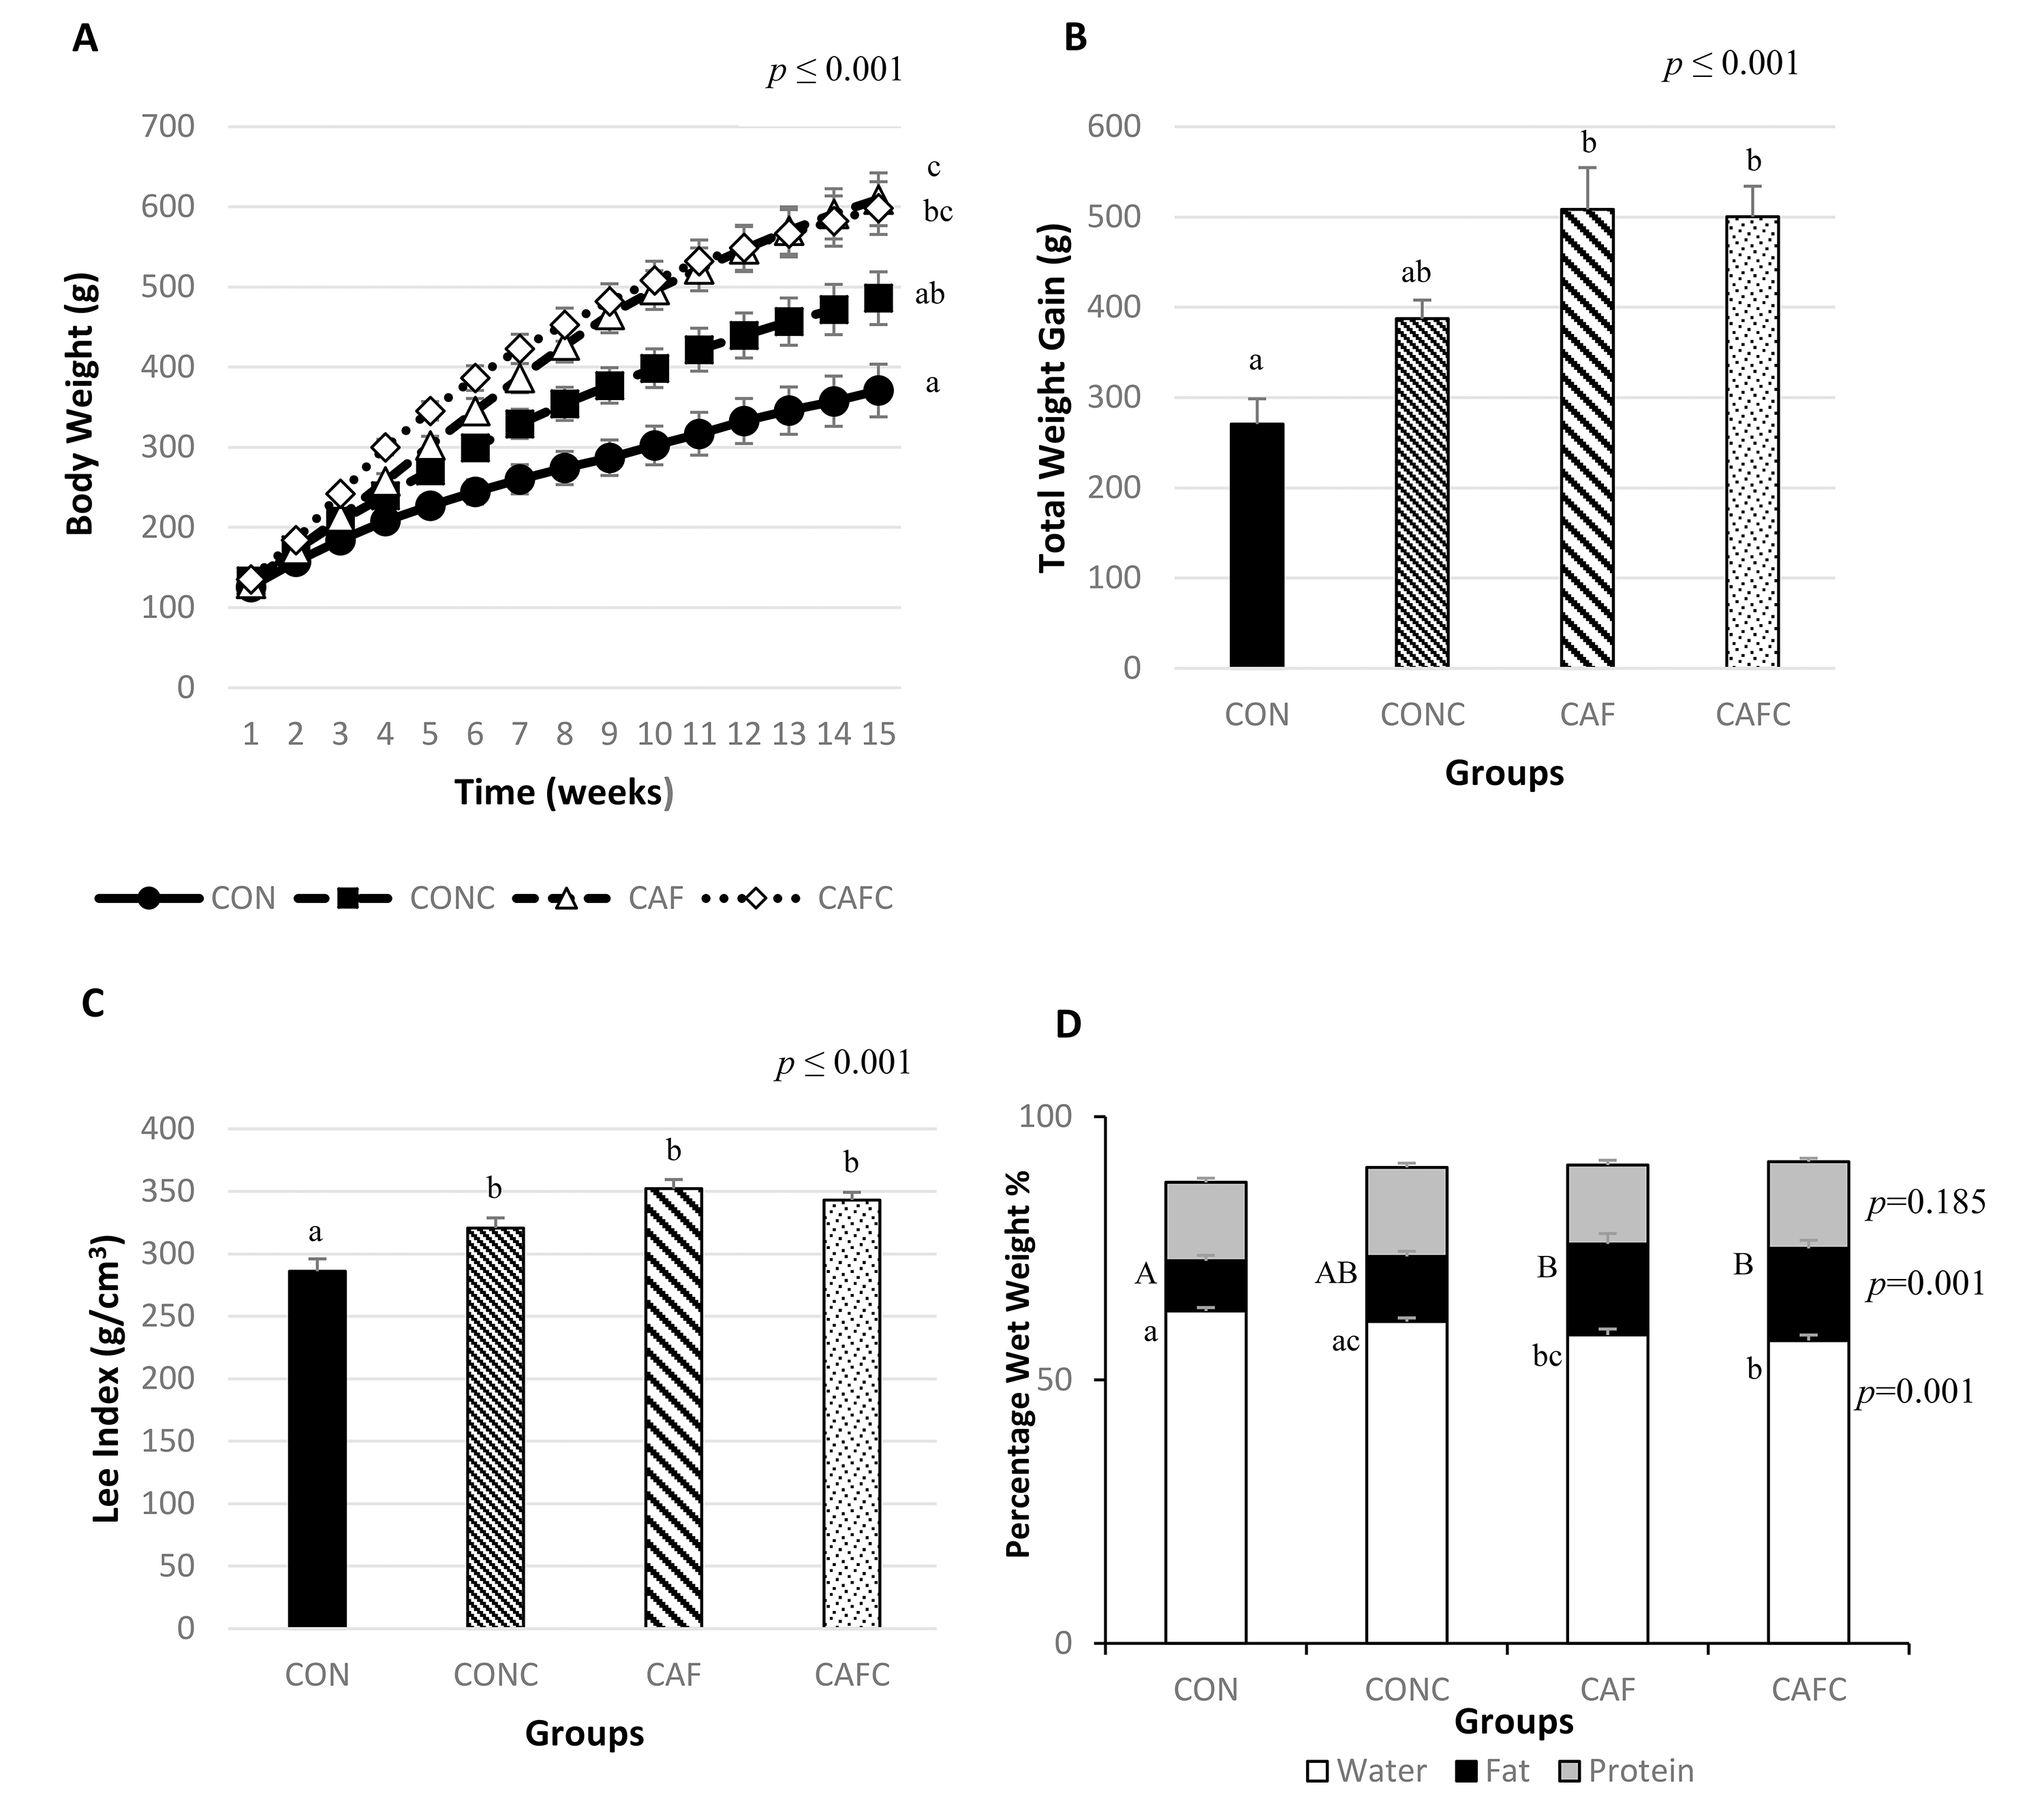 Fig. 1.
Body weight changes, total weight gain, Lee index, and
body composition in rats. CON, control diet; CONC, control+chia diet; CAF,
cafeteria diet; CAFC, cafeteria+chia diet; n = 7 per group. Data are presented as
the mean
Fig. 1D shows the body composition distribution of the four groups. Diet significantly influenced body water and body fat (both p = 0.001). CON had higher body water than CAF and CAFC, whereas it was lower in CAFC than CONC. CAF and CAFC both had higher body fat than CON.
Table 4 shows the adipose tissue and major organ weights of animals relative to
their body weight. Diet had a significant influence on white adipose tissue (WAT)
(all p
| Adipose tissue and organ weight (% BW) | Group | p | |||
| CON | CONC | CAF | CAFC | ||
| n = 7 | n = 7 | n = 7 | n = 7 | ||
| IBAT | 0.12 |
0.08 |
0.12 |
0.11 |
0.301 |
| PWAT | 1.19 |
2.05 |
4.25 |
3.71 |
|
| GWAT | 0.69 |
1.07 |
2.37 |
2.05 |
|
| Total WAT (PWAT + GWAT) | 1.88 |
3.12 |
6.62 |
5.76 |
|
| Liver | 2.53 |
2.36 |
2.42 |
2.54 |
0.368 |
| Brain | 0.54 |
0.40 |
0.44 |
0.35 |
0.211 |
| Right kidney | 0.33 |
0.30 |
0.30 |
0.30 |
0.275 |
| Left kidney | 0.32 |
0.30 |
0.30 |
0.29 |
0.210 |
CON, control diet; CONC, control+chia diet; CAF, cafeteria diet; CAFC,
cafeteria+chia diet; BW, body weight; IBAT, interscapular subcutaneous brown
adipose tissue; PWAT, peri-renal white adipose tissue; GWAT, gonadal white
adipose tissue; WAT, white adipose tissue. Values shown are the mean
The plasma parameters measured at the end of the study are shown in Table 5. Dietary treatment had no impact on the levels of plasma cholesterol, triglycerides, glucose, insulin or C-peptide. Only plasma leptin levels showed a significant difference between groups (p = 0.017), with CAF having significantly higher levels compared to CON.
| Biochemical parameter | Group | p | |||
| CON | CONC | CAF | CAFC | ||
| n = 7 | n = 7 | n = 7 | n = 7 | ||
| Cholesterol (mg/dL) | 87.9 |
86.5 |
91.2 |
86.7 |
0.947 |
| Triglycerides (mg/dL) | 104 |
114 |
103 |
104 |
0.322 |
| Glucose (mg/dL) | 198 |
177 |
198 |
226 |
0.377 |
| Insulin (ng/mL) | 8.04 |
8.18 |
8.34 |
8.07 |
0.910 |
| Leptin (ng/mL) | 1.20 |
2.26 |
6.26 |
5.67 |
0.017 |
| C-peptide (ng/mL) | 1.15 |
1.68 |
2.77 |
2.85 |
0.248 |
CON, control diet; CONC, control+chia diet; CAF, cafeteria diet; CAFC,
cafeteria+chia diet. Values shown are the mean
The relative gene expression levels of SREBP-1c, UCP2,
PPAR
 Fig. 2.
Relative gene expression levels in WAT at the end of the study.
CON, control diet; CONC, control+chia diet; CAF, cafeteria diet; CAFC,
cafeteria+chia diet. n = 7 in each group. Data are presented as the mean
The aim of this study was to investigate whether chia seed has protective effects against the progression of diet-induced obesity in a rat model. Several studies have reported beneficial effects from supplementing various obesogenic diets with chia seeds, chia oil, or chia flour [20, 21, 28, 48, 49, 50, 51]. However, the influence of chia seeds on the cafeteria diet, which has greater similarity with a multifactorial human diet, has so far not been investigated in studies of obesity development.
Chia seed supplementation had no effect on daily food or water consumption by the CAF group, as previously reported [21]. The CAF and CAFC groups were found to consume a significantly greater quantity of food than the CON and CONC groups. This result is similar to previous studies in which obesity was induced by cafeteria diet in rats [33, 39, 52]. Consumption of highly palatable cafeteria foods increased the fat mass and resulted in hyperphagia and rapid weight gain in male Wistar rats [33]. Cafeteria diet groups showed higher daily energy intake compared to CON and CONC groups. Studies on chia seed supplementation in obesogenic diets for rodents have yielded conflicting results, with some finding increased energy intake with chia seed supplementation of high-fat diets [21], while others found no short- or long-term differences [28, 53]. In the present study, chia showed only a minimal contribution (5.3%, data not shown) to total energy intake in the CAFC group. Moreover, the CAFC and CAF groups derived almost the same proportion of energy from cafeteria diet (75.7% and 75.8%, respectively, data not shown), indicating that both groups consumed similar amounts of cafeteria diet foods and that chia seed supplementation had no effect on energy intake [54].
The CAFC group had the highest fiber intake in this study, likely due to its high food consumption and the 32.5% fiber content of chia seeds (Table 3). Taken together, our findings suggest that the potential satiating or hypocaloric effects of fiber may be overridden [55]. However, this effect was not observed in our study, likely because of the higher energy, fat, carbohydrate, and salt content of the cafeteria diet. Despite the low fiber content of cafeteria foods, the CAF group had the second-highest fiber intake due to increased food consumption. In addition to fiber, chia also contains mucilage and minerals that may contribute to satiety [15]. However, such effects were not evident under the obesogenic conditions of the cafeteria diet. These results suggest that the potential satiating or hypocaloric effects of fiber may be overridden in the presence of an extremely energy-dense and palatable dietary background [55, 56]. Therefore, the high fiber content of chia alone may be insufficient to counteract the hyperphagic drive induced by the cafeteria diet.
Chia seed supplementation did not significantly alter saturated fat intake in rats fed the cafeteria diet, whereas it substantially reduced saturated fat intake in the control group. High consumption of saturated fats is known to increase oxidative stress and the production of free radicals [57], which contribute to obesity by promoting pre-adipocyte proliferation and increasing the size of differentiated adipocytes [58]. Excessive intake of saturated fat is therefore a key risk factor for the development of obesity. A study on three-week-old male Wistar rats demonstrated that adding 41.7% chia seeds to a high-fat diet significantly reduced saturated fat intake [59]. In contrast, our study suggests that supplementation of the cafeteria diet with a lower dose (20%) of chia seeds may not result in the same reduction in saturated fat. This finding indicates the lipid-modulating effects of chia may depend on both its proportion in the diet and the severity of the obesogenic background. The high fat and energy content of the cafeteria diet is likely to mask potential benefits from chia that have been observed in simpler, high-fat models [56, 59].
Chia seed supplementation of the cafeteria diet did not exert a significant effect on body weight. However, the final body weight and overall weight gain in the CAFC group were marginally lower compared to the CAF group, although this difference did not reach statistical significance. There are contradictory findings in the literature regarding the effect of chia seeds on weight gain. Several studies found no difference in body weight or weight gain when different forms of chia (seed, flour, or oil) were added to high-fat or high-sucrose diets at different doses (3–36.2%) and for different times in rodents and rabbits [26, 28, 53, 60, 61]. However, other studies reported that supplementation of a high-fat or high-fructose diet with 1.5–4% chia oil reduced weight gain [61, 62]. This discordance in research results highlights the complexities of the effects of chia seed supplementation on weight management, and suggests that dosage, duration, and dietary context can affect its physiological impact. The absence of a measurable effect of chia seeds on body weight in our study could reflect the relatively short consumption period and moderate dose, which may not have been sufficient to counteract the strong obesogenic drive of the cafeteria diet.
Analysis of the carcass at the end of this study revealed similar body fat ratios in both the CAF and CAFC groups. There are conflicting findings in the literature regarding the effect of chia seeds on body fat in obese rodents. Oliva et al. [37] and Fonte-Faria et al. [49] found that chia seed and oil treatments led to a reduction in the percentage of body fat. In contrast, de Miranda et al. [26] and Poudyal et al. [21] reported no significant changes in total body fat with 3% chia flour and 5% chia seed supplementation, respectively. These studies utilized different experimental models, with various forms of chia given in varying amounts and for different times. In our model, supplementation with chia seed showed no effect on body fat, suggesting that its impact on adiposity may depend on the dietary context and could be more apparent under less extreme nutritional conditions. The complex and variable composition and high nutrient density of the cafeteria diet might attenuate the capacity for chia to modulate fat accumulation [56].
PWAT, GWAT, and total WAT in the CAF and CAFC groups were 2–3-fold higher than in the CON group, consistent with other reports in the literature [33, 39, 63, 64, 65, 66]. Chia seed supplementation of the cafeteria diet did not affect the weight of adipose tissues in our study, although some studies found that addition of chia seed to a sucrose-rich diet reduced visceral adipose tissue [37, 67]. The cafeteria diet is considered to be more obesogenic than diets in which energy is increased by the addition of a single nutrient, possibly explaining why no effect on adipose tissue weight was observed [56].
Among the plasma parameters, only the leptin level was significantly different between groups. Chia seed supplementation of the cafeteria diet had no significant impact on the leptin level compared to the CAF diet alone; however, the leptin level in CAFC group was also similar to those in the CON and CONC groups, suggesting a trend toward control values. Although some studies have reported that chia oil reduced leptin levels in mice [49, 62], the present study found that chia seeds did not alter leptin levels in Wistar rats. This partial normalization of leptin levels suggests a modest improvement in leptin sensitivity or regulation, even if not statistically significant.
Supplementation with chia seeds was associated with significant changes in the
expression of some genes in WAT. Several studies have reported that ALA in chia
seeds can either increase or decrease the expression of SREBP-1c [18, 22, 37, 68, 69, 70]. The expression level increased when adipocyte cells were treated
with chia seeds [68], and when rats were fed with chia oil [69], consistent with
our findings. These effects are mainly attributed to the high ALA content of
chia, which is the principal bioactive component that influences lipid metabolism
[71]. The higher SREBP-1c expression level observed in the CAFC and CONC
groups compared to the CAF group may be related to the high ALA content of chia
seeds. However, chia seed reduced the expression of UCP2 in our study.
Creus et al. [72] reported that UCP2 expression in the heart
muscle of obese rats was not affected by chia seed supplementation, and this gene
has not been investigated in other studies of chia seeds. Fish oil
supplementation of a high-fat diet was shown to reduce UCP2 gene
expression in adipose tissue [73, 74]. Chia seeds are rich in plant-derived n-3
ALA, but deficient in eicosapentaenoic acid (EPA) and docosahexaenoic acid (DHA)
[23]. Since ALA serves as a precursor to both EPA and DHA [75], this could
potentially explain the reduced UCP2 expression observed in our study.
The levels of PPAR
To our knowledge, this is the first study to examine the effects of chia seed supplementation in a cafeteria diet-induced obesity model, which is a good model for Western-type eating patterns. We performed physiological, biochemical, and molecular assessments to obtain a broad view of the effect of chia seeds on obesity-related outcomes. The cafeteria diet is not a standardized approach and there are challenges associated with its implementation and accurate energy and nutrient estimation. Nevertheless, it is a well-established method for increasing adiposity parameters [39] and may better resemble Western diets compared to conventional high-fat models [56]. These aspects highlight the translational relevance of this work, as it bridges experimental findings with complex human dietary behaviors. Our results highlight the importance of evaluating nutritional interventions within realistic dietary contexts to better understand their physiological potential.
A key strength of this work is the integrated evaluation of dietary intake, body composition, plasma biomarkers, and gene expression in adipose tissue, thus providing a multidimensional understanding of chia seed supplementation. However, several limitations should be acknowledged: the cafeteria diet model is inherently variable, only one form and dose of chia seed was tested, and the relatively short duration may have limited the ability to detect subtle metabolic changes.
Unexpectedly, chia seed supplementation did not significantly alter energy and nutrient intake, body composition, or plasma parameters under obesogenic conditions. The most plausible explanation is that the dosage used was insufficient to counteract the strong obesogenic effects of the cafeteria diet. Future studies using different chia seed doses, longer intervention periods, and combined metabolic and gut microbiota assessments should help to clarify whether the observed changes in gene expression translate into meaningful metabolic improvements. Since the soluble fiber and mucilage fractions in chia may influence gut microbial composition, the integration of microbiota analysis would provide a more complete understanding of its physiological actions.
We hypothesized that supplementing a cafeteria diet with chia seed (20% w/w) may exert protective effects against the development of obesity, adiposity-related markers, and changes in gene expression levels in adipose tissue. This study found that chia seed supplementation in rats fed an obesogenic diet increased SREBP-1c expression and showed a trend toward decreased UCP2 expression in WAT, possibly mediated by the high ALA content of chia. In summary, this is the first study to explore the effects of chia seed supplementation in a cafeteria diet-induced obesity model, providing new insights into how plant-based n-3 sources can modulate adipose tissue gene expression under complex dietary conditions. The findings of this study should inform future research into the effects of chia seeds on obesity and lipid metabolism, focusing on both short- and long-term supplementation with varying doses. Future studies should incorporate dietary models that are more reflective of human nutrition, such as the cafeteria diet, to provide deeper insights into the potential benefits of chia seeds.
ALA, Alpha-linolenic acid; CAF, Cafeteria diet; CAFC, Cafeteria diet with chia seed; CON, Control diet; CONC, Control diet supplemented with chia seed; DHA, Docosahexaenoic acid; EPA, Eicosapentaenoic acid; FADS2, Fatty acid desaturase 2; GAPDH, Glyceraldehyde 3- phosphate dehydrogenase; GWAT, Gonadal white adipose tissue; IBAT, Interscapular brown adipose tissue; LA, Linoleic acid; n-3, Omega-3; PPAR
All data supporting the findings of this study are available upon reasonable request from the corresponding author.
CC, AAkyol, and AAyaz contributed to conceptualization, investigation, formal analysis, and data curation. AAkyol and AAyaz contributed to methodology. CC contributed to software and writing—original draft preparation. AAkyol and AAyaz contributed to review, editing, and supervision. AAyaz contributed to funding acquisition. All authors contributed to editorial changes in the manuscript. All authors read and approved the final manuscript. All authors have participated sufficiently in the work and agreed to be accountable for all aspects of the work.
All experimentation was conducted in accordance with Directive 2010/63/EU and ARRIVE guidelines, with a license from the Ethics Board on Animal Experimentations of Hacettepe University, Ankara, Turkiye (protocol number: 2016/33-04).
The authors would like to thank Tayfun Ide from ARDEN Research & Experiment for helping with the feed preparation process, Samet Ece from DIAGEN for his assistance with biochemical and gene analysis and Yücel Buyukdere for providing help in data collection.
This research was funded by the Scientific Research Projects Coordination Unit of Hacettepe University, grant numbers TDK-2018-16725 and THD-2019-18012.
The authors declare no conflict of interest.
During the preparation of this work, the authors used ChatGpt-5 to check spelling and grammar. After using this tool, the authors reviewed and edited the content as needed and take full responsibility for the content of the publication.
Supplementary material associated with this article can be found, in the online version, at https://doi.org/10.31083/IJVNR46718.
References
Publisher’s Note: IMR Press stays neutral with regard to jurisdictional claims in published maps and institutional affiliations.