


 , Tomáš Tesař 1,*, Andrea Gažová 2, Juraj Smaha 3, Martin Jankovský 3, Dana Dudová 3, Peter Jackuliak 3, Martin Kužma 3, Juraj Payer 3, Ján Kyselovič 3
1 Department of Organisation and Management of Pharmacy, Faculty of Pharmacy, Comenius University, 832 32 Bratislava, Slovakia
2 Faculty of Medicine, Institute of Pharmacology and Clinical Pharmacology, Comenius University Bratislava, 813 72 Bratislava, Slovakia
3 5th Department of Internal Medicine, Comenius University Faculty of Medicine, University Hospital, 826 06 Bratislava, Slovakia
Abstract
Vitamin D is a pleiotropic molecule involved in various physiological processes beyond skeletal health, including immune modulation and metabolic regulation. This prospective observational biomedical study aimed to assess the impact of short-term high-dose vitamin D supplementation on selected metabolic parameters in adult patients with type 2 diabetes mellitus (T2DM) and low serum 25-hydroxyvitamin D [25(OH)D] concentrations.
Thirty patients were enrolled and assigned to receive either 10,000 IU/day of cholecalciferol (Group A) or a significantly lower dose (960 IU/day, Group B) for 12 weeks based on recruitment order (odd/even identification numbers). The primary endpoints were changes in parathyroid hormone (PTH), fasting blood glucose (FBG), calcium, phosphorus, and glycated haemoglobin (HbA1c).
A strong, statistically significant negative correlation between changes in 25(OH)D and PTH (Spearman r = –0.69052, p = 0.0044) was also observed. In the high-dose group, 25(OH)D increased from 17.2 to 31.8 ng/mL (median change 13.3 ng/mL), while PTH decreased from 3.27 to 2.76 pmol/L (median change –0.27 pmol/L). In the lower-dose group, 25(OH)D increased from 18.5 to 28.2 ng/mL (median change +8.1 ng/mL). The increase in 25(OH)D was significantly greater in the high-dose group than in the lower-dose group (median change +13.3 vs +8.1 ng/mL, p = 0.015). Within the observed range, patients with larger increases in 25(OH)D tended to show greater reductions in PTH. Other metabolic markers (HbA1c, FBG, calcium, and phosphorus) remained stable over 12 weeks.
These findings support the effectiveness and safety of high-dose vitamin D supplementation in correcting vitamin D deficiency and reducing PTH levels in patients with T2DM while highlighting the need for longer-term studies to evaluate its broader metabolic effects.
Keywords
- vitamin D
- cholecalciferol
- high-dose supplementation
- type 2 diabetes mellitus
- 25-hydroxyvitamin D
- parathyroid hormone
- HbA1c
- fasting blood glucose
Vitamin D is believed to be one of the earliest hormones produced in evolutionary history, dating back to the emergence of eukaryotic organisms in the oceans more than 1.5 billion years ago. Supporting evidence comes from the observation of the phytoplankton species Emiliania huxlei, which has existed in its current form in the Sargasso Sea for more than 750 million years. This organism contains ergosterol (provitamin D2; approximately 1 µg/g dry weight), which can be photoconverted into previtamin D2 upon exposure to simulated sunlight [1]. Since the chemical structure of vitamin D was first elucidated in 1930—an achievement for which Adolf Otto Reinhold Windaus was awarded the Nobel Prize—research on this molecule has expanded substantially [2]. The number of publications on vitamin D has increased dramatically, with PubMed showing a progression from a single article in 1922 to 110 in 1952, 740 in 1982, and 5566 in 2020. This surge reflects a growing understanding that vitamin D plays a far broader biological role than initially thought. Early studies focused primarily on its effects on calcium homeostasis and bone metabolism [3].
The discovery of 25-hydroxyvitamin D [25(OH)D] in 1968 and the subsequent
identification of the active form, 1,25-dihydroxyvitamin D [1,25(OH)2D],
opened new lines of investigation into its roles in immunity, infectious
diseases, cancer, and cardiovascular health [4]. Beyond skeletal effects, vitamin
D is now recognized as a key immunomodulator, influencing phosphate absorption in
the gut and reducing renal excretion. Although its role in bone health is well
established, this represents only one of many functions. Vitamin D is considered
a pleiotropic molecule, meaning it exerts influence over multiple biological
systems simultaneously. Pleiotropy refers to the phenomenon in which a single
gene or compound affects multiple phenotypic traits [5]. Beyond its classical
role in calcium–phosphate homeostasis, vitamin D acts as a pleiotropic hormone
with wide-ranging extraskeletal actions. Several tissues not primarily involved
in mineral metabolism express the vitamin D receptor (VDR), and some also express
1
Type 2 diabetes mellitus (T2DM) is a chronic metabolic disorder closely
associated with low-grade chronic inflammation. This inflammatory state is
characterized by elevated levels of acute-phase proteins and multiple
inflammatory mediators, which play a crucial role in the development of insulin
resistance and pancreatic
Observational evidence further links low vitamin D status to inflammation-driven
complications of type 2 diabetes. In patients with T2DM, those with coexisting
non-alcoholic fatty liver disease (NAFLD) have significantly lower 25(OH)D levels
and a markedly higher prevalence of vitamin D deficiency, which emerges as an
independent risk factor for NAFLD in multivariable analyses. Similarly, in
diabetic nephropathy, vitamin D deficiency clusters with elevated TNF-
In the geriatric population, a large systematic review and meta-analysis showed that individuals with higher inflammatory marker levels have significantly lower vitamin D concentrations, and vitamin D deficiency is consistently linked to a wide range of chronic, inflammation-based conditions, including type 2 diabetes and cardiovascular disease. Furthermore, level 1 evidence from a meta-analysis in patients with T2DM indicates that vitamin D supplementation can reduce circulating inflammatory markers, even though randomized trials focusing on glycaemic outcomes alone have generally reported small or neutral effects on HbA1c and insulin resistance. Collectively, these findings support the concept that correcting vitamin D deficiency may attenuate chronic low-grade inflammation and related cardiometabolic complications in T2DM, while its influence on short-term glycaemic indices remains uncertain [15].
Through its receptor (VDR), vitamin D directly regulates the expression of genes
critical to insulin secretion and insulin action pathways. Acting as an
anti-inflammatory hormone, vitamin D modulates immune cells within metabolic
tissues, reducing both local and systemic inflammation and thereby helping to
prevent dysfunction of pancreatic islets, liver, and skeletal muscle [16]. It
also contributes to immune regulation through effects on innate and adaptive
immunity, inhibiting the production of pro-inflammatory cytokines and mitigating
chronic low-grade inflammation, a key driver of insulin resistance [17].
Experimental and clinical evidence support a direct role of vitamin D in several
steps of glucose homeostasis. Pancreatic
Beyond the pancreatic islet, vitamin D may also influence insulin sensitivity in
classical insulin target tissues. VDR and the activating enzyme CYP27B1 are
expressed in skeletal muscle and other peripheral tissues, where vitamin D
upregulates insulin receptor expression and may enhance insulin signalling,
partly through activation of peroxisome proliferator-activated
receptor-
The aim of this study was to monitor the impact of cholecalciferol
administration on serum vitamin D levels and selected clinical parameters in two
groups of patients. The dietary supplements used were a sublingual spray
delivering 10,000 IU/day (DeVit® Direct, Emergopharm, Poland) or
drops providing 960 IU/day (DeVit®, Emergopharm, Poland),
administered to adult patients aged 18 to 65 years attending an internal medicine
outpatient clinic, diagnosed with type 2 diabetes mellitus and low vitamin D
levels (
This biomedical observational study is designed as an open-label, non-blinded, monocentric, and non-placebo-controlled investigation. It aims to assess the effects of cholecalciferol supplementation administered in an unconventional short-term high-dose regimen, with subsequent evaluation of diabetic and endocrine blood parameters. In addition, the study examines the safety profile of the administered dosing and patient satisfaction with the supportive therapy. Participants were allocated using an alternating (quasi-random) assignment based on recruitment order (odd/even identification numbers). The study is conducted in compliance with the following guidelines:
• Declaration of Helsinki of the World Medical Association—Ethical Principles for Medical Research Involving Human Subjects.
• Good Clinical Practice (GCP).
• TREND Statement recommendations for the design and reporting of non-randomized/quasi-experimental studies [23].
Adult patients were enrolled based on predefined inclusion and exclusion criteria.
Inclusion criteria:
1. Signed informed consent and completion of patient education.
2. Adult patients of both sexes aged 18 to 65 years.
3. Diagnosed with type 2 diabetes mellitus and low serum vitamin D levels (
4. Permitted treatment consisting of indicated therapies for the specified diagnoses, which must be recorded in the questionnaire.
Exclusion criteria:
At the initial outpatient visit, a blood sample was collected to measure serum vitamin D levels. Upon meeting the inclusion criteria and being enrolled, each patient was assigned an identification number three days after the initial visit and was required to complete a questionnaire.
Group allocation was performed using an alternating assignment based on the order of recruitment. Consecutively enrolled participants received an incremental identification number; odd-numbered participants were allocated to Group A and even-numbered participants to Group B. Allocation was not based on smoking status or any other baseline characteristic.
Following enrolment, patients received a dietary supplement containing cholecalciferol for a 12-week period. After 4, 8, and 12 weeks of supplementation, patients attended follow-up visits during which blood samples were collected and analysed for the following parameters:
a. HbA1c (glycated haemoglobin).
b. PTH (parathyroid hormone).
c. Ionized calcium.
d. FBG (fasting blood glucose).
e. Phosphorus.
f. Vitamin D.
For vitamin D supplementation, a dietary supplement containing 10,000 IU of cholecalciferol per dose was used. The product is a spray designed for sublingual administration. Each dose delivers 250 µg of cholecalciferol suspended in medium-chain triglyceride (MCT) oil, with a total of 60 doses per container. The supplement is equipped with a certified Swiss-made dispenser, ensuring precise and uniform dosing. The distributor promotes the product as ideal for rapidly increasing serum vitamin D levels. Owing to its formulation, it is particularly suitable for individuals with malnutrition or swallowing difficulties, as absorption begins directly in the oral cavity.
The supplements used in this study are considered safe and have been widely utilized in households and outpatient clinics across Slovakia for several years. The primary reason for their selection was the anticipated advantage of the pharmaceutical form, dosing precision, and active ingredient content, which, in the intervention group, was expected to safely and effectively raise serum vitamin D levels within a short period. Participants in Group A received cholecalciferol 10,000 IU/day for 12 weeks. The group that did not receive the 10,000 IU cholecalciferol formulation was administered the dietary supplement at a dosage of two doses corresponding to a total of 960 IU of vitamin D. To avoid discouraging patients from supplementing their vitamin D intake, we selected a significantly lower dose compared with the intervention group, yet one that remains consistent with World Health Organization (WHO) recommendations for the general population.
Data were initially recorded in the patient’s folder and entered into the patient logbook in written form. During the evaluation phase, the data were transferred into an electronic database used exclusively for the statistical analysis of the biomedical study. All data collected were kept confidential, with access restricted to authorized personnel (the principal investigator, study coordinator, and pharmacist). Data completion and validation were performed using available information sources. Each enrolled patient was registered in the participant identification sheet and assigned a specific number as the patient’s identifier. This number replaced the patient’s name and surname to ensure protection of personal data. The data collected and assessed by the pharmacist included demographic and social information, details on the patient’s current health status, and their understanding of their therapy.
Descriptive statistical methods were used to analyse the basic characteristics of the patients. Questionnaires were evaluated using descriptive statistical methods, and, in cases involving standardized questionnaires, official scoring calculators were applied first. Changes in metabolic parameters and their relationship with vitamin D levels were assessed. Non-parametric tests were used due to their robustness in the presence of non-normally distributed data. Data visualization was performed using box plots and scatter plots. Group comparisons were conducted using the Wilcoxon rank-sum test, Wilcoxon signed-rank test, and Mann-Whitney U test. Correlation analysis was performed using Spearman’s rank correlation coefficient.
Each participant provided written informed consent in accordance with local requirements after receiving a full explanation of the nature of the study. The informed consent form was signed before initiating any study-related procedures. The reviewing ethics committee approved the version of the consent form and ensured that it was written in a language that the participant could read and understand. The informed consent process complied with the principles outlined in the Declaration of Helsinki, current ICH guidelines, Good Clinical Practice (GCP), and applicable regulatory requirements.
The biomedical study entitled “Identification of Vitamin D Levels Following Short-Term High-Dose Supplementation in Diabetic Patients” was approved by the Ethics Committee of University Hospital Bratislava – Ružinov Hospital. The committee issued a favourable opinion on the proposed study protocol, reference number EK/041/2022, dated March 23, 2022, stating that the submitted documentation meets the committee’s requirements and complies with applicable legislation.
A total of 30 patients were enrolled. Of these, 9 patients completed only the baseline blood sampling and did not continue follow-up. Among the remaining participants, 16 were scheduled for follow-up assessments according to the protocol (Table 1). This subgroup consisted of 14 men and 2 women. The average age of the men was 57.4 years, while the average age of the women was 60.5 years. The average body mass index (BMI) in men was 31.3, indicating mild obesity, whereas the average BMI in women was 35.1. However, the female subgroup included only two participants: one with a BMI of 19.5, which is at the lower limit of the normal range, and the other with a BMI of 50.7, indicating severe morbid obesity. However, one participant did not attend the follow-up visit and therefore follow-up laboratory values were unavailable. Consequently, 15 participants with complete baseline–follow-up paired laboratory measurements were included in the final paired analyses.
| Patient | Group | Age | Sex | Smoking | Height (m) | Weight (kg) | BMI | Hours of physical activity per day |
| 12 | B | 66 | M | No | 1.83 | 86 | 25.7 | Less than hour |
| 4 | A | 46 | M | No | 1.84 | 112 | 33.1 | Less than hour |
| 13 | B | 58 | M | No | 1.85 | 140 | 40.9 | More than 2 hours |
| 2 | A | 46 | M | No | 1.76 | 105 | 33.9 | 1–2 hours |
| 5 | A | 58 | F | Yes | 1.46 | 108 | 50.7 | More than 2 hours |
| 11 | B | 56 | M | No | 1.64 | 88 | 32.7 | Less than hour |
| 16 | B | 61 | M | No | 1.80 | 73 | 22.5 | Less than hour |
| 6 | A | 47 | M | Yes | 1.73 | 95 | 31.7 | Less than hour |
| 7 | A | 68 | M | No | 1.70 | 65 | 22.5 | Less than hour |
| 14 | B | 68 | M | No | 1.86 | 139 | 40.2 | Less than hour |
| 9 | B | 59 | M | No | 1.82 | 83 | 25.1 | Less than hour |
| 3 | A | 54 | M | Yes | 1.84 | 100 | 29.5 | Less than hour |
| 18 | B | 48 | M | No | 1.75 | 110 | 35.9 | 1–2 hours |
| 8 | A | 63 | F | No | 1.52 | 45 | 19.5 | More than 2 hours |
| 21 | B | 74 | M | No | 1.84 | 83 | 24.5 | 1–2 hours |
| 20 | B | 61 | M | No | 1.72 | 120 | 40.6 | Less than hour |
BMI, Body Mass Index; M, Male; F, Female.
A total of 62.5% of participants reported engaging in less than one hour of physical activity per day, 18.75% reported 1–2 hours daily, and another 18.75% reported more than 2 hours of daily physical activity. Only 6.25% reported spending at least 15 minutes per day in direct sunlight on 11 or more days per month; 31.25% reported 1–5 days per month; and 62.5% reported no such sunlight exposure during the past month. Additionally, 18.75% reported vitamin D supplementation within the past month at a dose of 1000–2000 IU per day. The same proportion (18.75%) reported being smokers. With regard to study groups, the intervention group (Group A) included 7 patients, comprising 2 women and 5 men, with a mean age of 54.6 years. All smokers were in this group. The average BMI in this group was 31.6. The control group (Group B) included 9 patients, all male, with a mean age of 61.2 years and no smokers. The average BMI in this group was 32.0.
The aim of the analysis was to evaluate changes in selected metabolic parameters (PTH, HbA1c, calcium, glucose, and phosphorus) over the course of the study, both within individual patients and between groups receiving different doses of vitamin D. Correlations between these metabolic variables and vitamin D levels were assessed using correlation analysis. Changes in individual parameters over time were evaluated using paired tests. Group comparisons were performed to detect potential differences in the effectiveness of vitamin D dosing. Data were visualized using box plots to illustrate distribution and summary statistics at baseline and final visits and scatter plots to show correlations between variables. Choosing appropriate statistical tests was essential for obtaining reliable results. Because most variables did not follow a normal distribution (confirmed via the Shapiro–Wilk test), non-parametric tests were used. These methods are more robust for small sample sizes and outlier-prone data because they rely on ranks or medians rather than raw values. To verify baseline comparability between the groups, the Wilcoxon rank-sum test—a non-parametric alternative to the independent t-test—was used. A p-value greater than 0.05 was considered evidence that the groups were comparable at baseline. This step ensured that any later differences could be attributed to the intervention rather than to pre-existing disparities. The Wilcoxon signed-rank test was used to compare repeated measures within the same patients (e.g., before and after intervention). A p-value below 0.05 indicated a statistically significant change. The Mann–Whitney U test was applied to compare the two independent groups; based on ranked data, it assesses whether values in one group are systematically higher or lower than those in the other. Finally, Spearman’s rank correlation coefficient was used to evaluate relationships between vitamin D levels and metabolic parameters. This method is appropriate for non-normally distributed data and is less sensitive to outliers.
For data analysis, two measurements were used for each patient: the first available measurement (baseline) and the last available measurement (final follow-up). Patients with missing values for either measurement were excluded from the respective analyses. No imputation methods were applied; only complete data pairs were analysed. After excluding patients with missing data, the analysis included 7 patients from Group A and 8 patients from Group B.
At baseline, all evaluated metabolic parameters were comparable in the high-dose
(Group A) and lower-dose (Group B) vitamin D groups. There were no statistically
significant between-group differences in PTH, HbA1c, FBG, calcium, phosphorus, or
25(OH)D (all p
| Group A | Group B | ||||||
| n = 7 | n = 8 | ||||||
| Parameters | Descriptive statistics | First visit | Last visit | Change | First visit | Last visit | Change |
| HBA1C [%] | Mean (SD) | 8.09 (1.7392) | 7.66 (1.1907) | –0.43 (1.3306) | 7.39 (0.3380) | 7.88 (1.3230) | 0.49 (1.3237) |
| Median | 7.600 | 7.480 | –0.150 | 7.385 | 7.395 | 0.020 | |
| Min; Max | 6.43; 11.19 | 6.42; 9.70 | –3.00; 1.23 | 7.01; 8.02 | 6.42; 10.33 | –1.01; 3.20 | |
| Q1; Q3 | 6.68; 9.44 | 6.53; 8.42 | –1.02; 0.43 | 7.10; 7.56 | 7.07; 8.67 | –0.29; 1.13 | |
| p-value of paired test | 0.5781 | 0.5469 | |||||
| p-value of group comparison test | 0.2243 | ||||||
| PTH [pmol/L] | Mean (SD) | 3.09 (1.4521) | 2.67 (1.0434) | –0.42 (0.7335) | 4.53 (3.3277) | 4.21 (1.6809) | –0.32 (2.4437) |
| Median | 3.270 | 2.760 | –0.270 | 3.530 | 4.210 | 0.610 | |
| Min; Max | 1.15; 5.35 | 1.28; 3.71 | –1.65; 0.37 | 1.73; 10.80 | 2.30; 6.65 | –4.75; 1.97 | |
| Q1; Q3 | 1.55; 4.06 | 1.52; 3.70 | –1.13; 0.12 | 1.93; 6.38 | 2.53; 5.61 | –1.53; 1.03 | |
| p-value of paired test | 0.2969 | 0.7109 | |||||
| p-value of group comparison test | 0.1179 | ||||||
| FBG [mmol/L] | Mean (SD) | 7.57 (2.8819) | 8.38 (1.2289) | 0.81 (1.7883) | 8.39 (1.3640) | 9.76 (2.4168) | 1.37 (1.9623) |
| Median | 6.630 | 7.760 | 1.090 | 8.715 | 9.720 | 0.775 | |
| Min; Max | 4.58; 12.90 | 6.95; 10.32 | –2.58; 3.18 | 5.53; 9.91 | 6.10; 13.62 | –1.15; 4.90 | |
| Q1; Q3 | 5.56; 9.34 | 7.53; 9.64 | 0.30; 1.91 | 7.95; 9.20 | 8.31; 11.17 | 0.41; 2.42 | |
| p-value of paired test | 0.2188 | 0.1094 | |||||
| p-value of group comparison test | 0.9539 | ||||||
| P [mmol/L] | Mean (SD) | 1.06 (0.2491) | 1.16 (0.1567) | 0.11 (0.1489) | 1.06 (0.2420) | 1.19 (0.2291) | 0.13 (0.2285) |
| Median | 1.100 | 1.150 | 0.070 | 1.090 | 1.145 | 0.200 | |
| Min; Max | 0.74; 1.34 | 0.94; 1.36 | –0.04; 0.41 | 0.75; 1.37 | 0.80; 1.50 | –0.28; 0.35 | |
| Q1; Q3 | 0.78; 1.29 | 1.01; 1.30 | 0.01; 0.16 | 0.83; 1.27 | 1.08; 1.40 | –0.04; 0.33 | |
| p-value of paired test | 0.0781 | 0.1953 | |||||
| p-value of group comparison test | 0.8168 | ||||||
| Ca [mmol/L] | Mean (SD) | 2.28 (0.0661) | 2.61 (0.7529) | 0.33 (0.7672) | 2.25 (0.1177) | 2.26 (0.1031) | 0.01 (0.1117) |
| Median | 2.300 | 2.350 | 0.030 | 2.260 | 2.245 | 0.010 | |
| Min; Max | 2.16; 2.36 | 2.24; 4.31 | –0.06; 2.06 | 2.08; 2.44 | 2.10; 2.45 | –0.15; 0.16 | |
| Q1; Q3 | 2.25; 2.32 | 2.27; 2.40 | 0; 0.16 | 2.17; 2.31 | 2.20; 2.31 | –0.08; 0.09 | |
| p-value of paired test | 0.1563 | 0.8125 | |||||
| p-value of group comparison test | 0.3537 | ||||||
| Vitamin D [ng/mL] | Mean (SD) | 16.15 (6.6699) | 36.34 (13.7101) | 20.19 (11.2833) | 17.03 (6.5143) | 25.31 (6.7336) | 8.29 (5.4640) |
| Median | 17.200 | 31.800 | 13.300 | 18.500 | 28.200 | 8.100 | |
| Min; Max | 4.24; 24.50 | 25.00; 64.40 | 11.20; 39.90 | 7.07; 26.40 | 14.70; 32.50 | 0.50; 17.60 | |
| Q1; Q3 | 11.70; 20.60 | 26.60; 42.90 | 11.60; 30.16 | 11.97; 20.90 | 19.10; 30.35 | 4.45; 11.55 | |
| p-value of paired test | 0.0156 | 0.0078 | |||||
| p-value of group comparison test | 0.0150 | ||||||
Max, Maximum; Mean, Arithmetic mean; Min, Minimum; Q1, Lower quartile; Q3, Upper quartile; SD, Standard deviation; HbA1c, glycated haemoglobin; PTH, parathyroid hormone; FBG, fasting blood glucose. p-values were calculated using the Wilcoxon signed-rank test and the Mann-Whitney U test for group comparisons.
Table 2 summarizes the changes in key metabolic parameters between the first and final visits for both groups. HbA1c levels remained relatively stable, with a slight decrease in Group A and a slight increase in Group B; however, these changes were not statistically significant, either within groups or between them. PTH levels decreased in Group A and increased in Group B, but none of these changes reached statistical significance. Similarly, glucose levels showed an upward trend in both groups, yet without statistical confirmation. Phosphorus and calcium levels remained essentially unchanged throughout the study in both groups. Minor variations in mean or median values were observed, but none were statistically significant, indicating stable mineral metabolism. In contrast, both groups showed significant increases in vitamin D levels, with a much greater and statistically significant rise observed in Group A. The between-group comparison confirmed a significant difference, clearly demonstrating the superior effectiveness of higher-dose vitamin D supplementation. In summary, aside from the expected and statistically significant increase in vitamin D levels—particularly in Group A—none of the other parameters showed meaningful or statistically significant changes. This suggests that while high-dose vitamin D effectively raises serum concentrations, its short-term impact on glycaemic and mineral markers in this cohort was limited. PTH levels are presented as a scatterplot in Fig. 1.
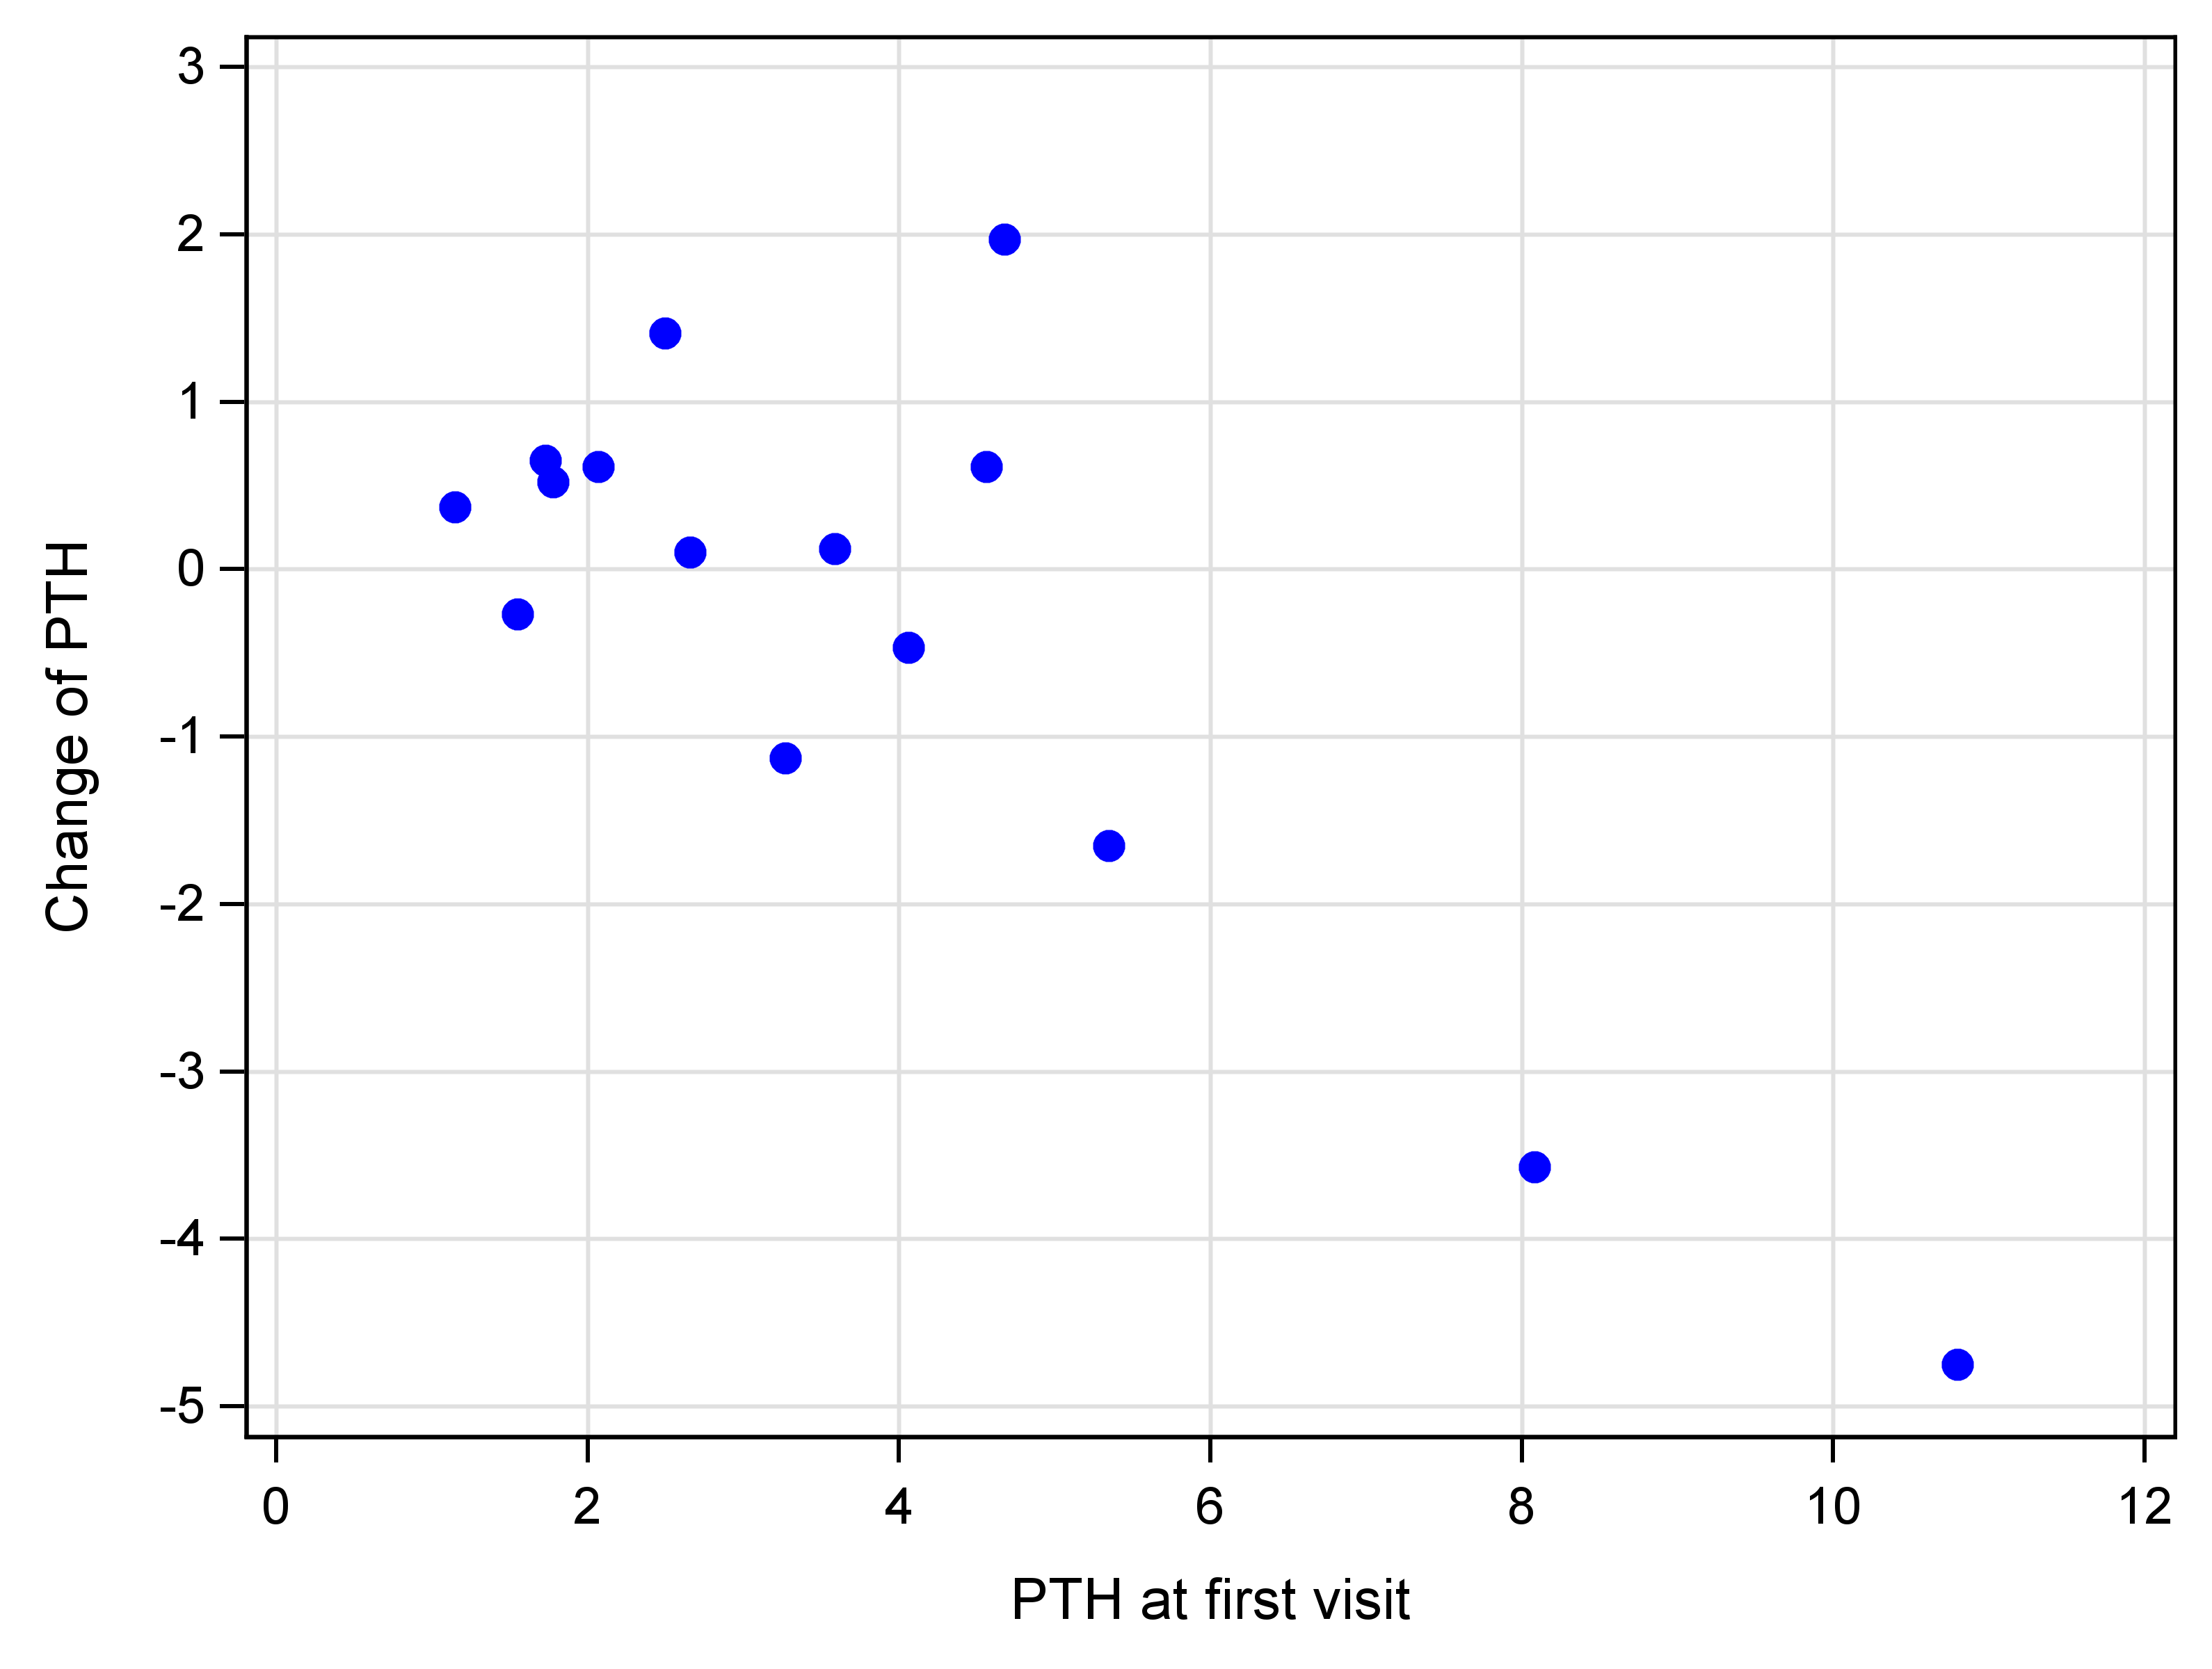 Fig. 1.
Scatterplot of PTH [pmol/L].
Results of statistical tests adjusted for baseline values did not differ from those obtained using the Wilcoxon signed-rank test and the Mann–Whitney U test. Therefore, the original test methods were retained to ensure consistency across the analysis.
The box plots reveal differences between Groups A and B across several metabolic parameters (Fig. 2). In Group A, HbA1c values showed greater variability throughout the study, but the median slightly decreased, suggesting a potential positive trend. In contrast, Group B displayed stable HbA1c values with low variability and virtually no change over time. PTH levels decreased in Group A, while they increased in Group B, indicating a potential beneficial effect of high-dose vitamin D on PTH suppression in the intervention group. Glucose levels in Group A showed a slight increase in the median over time, with values becoming more clustered, suggesting a narrowing distribution. Group B exhibited a similar trend, although the change was less pronounced. Phosphorus values were initially lower in Group A and increased over time with reduced variability, indicating stabilization. Conversely, Group B showed both an increase in phosphorus and greater variability at the final visit, reflecting a less consistent pattern. Calcium levels remained stable in both groups, with minimal changes in median values and similar variability, reinforcing the safety of high-dose vitamin D and the absence of hypercalcemia. Finally, vitamin D levels rose substantially in Group A, with increases in both the median and variability, clearly reflecting the impact of high-dose supplementation. Group B also showed an increase, but the change was less pronounced and more uniform, supporting the greater efficacy of the higher-dose regimen.
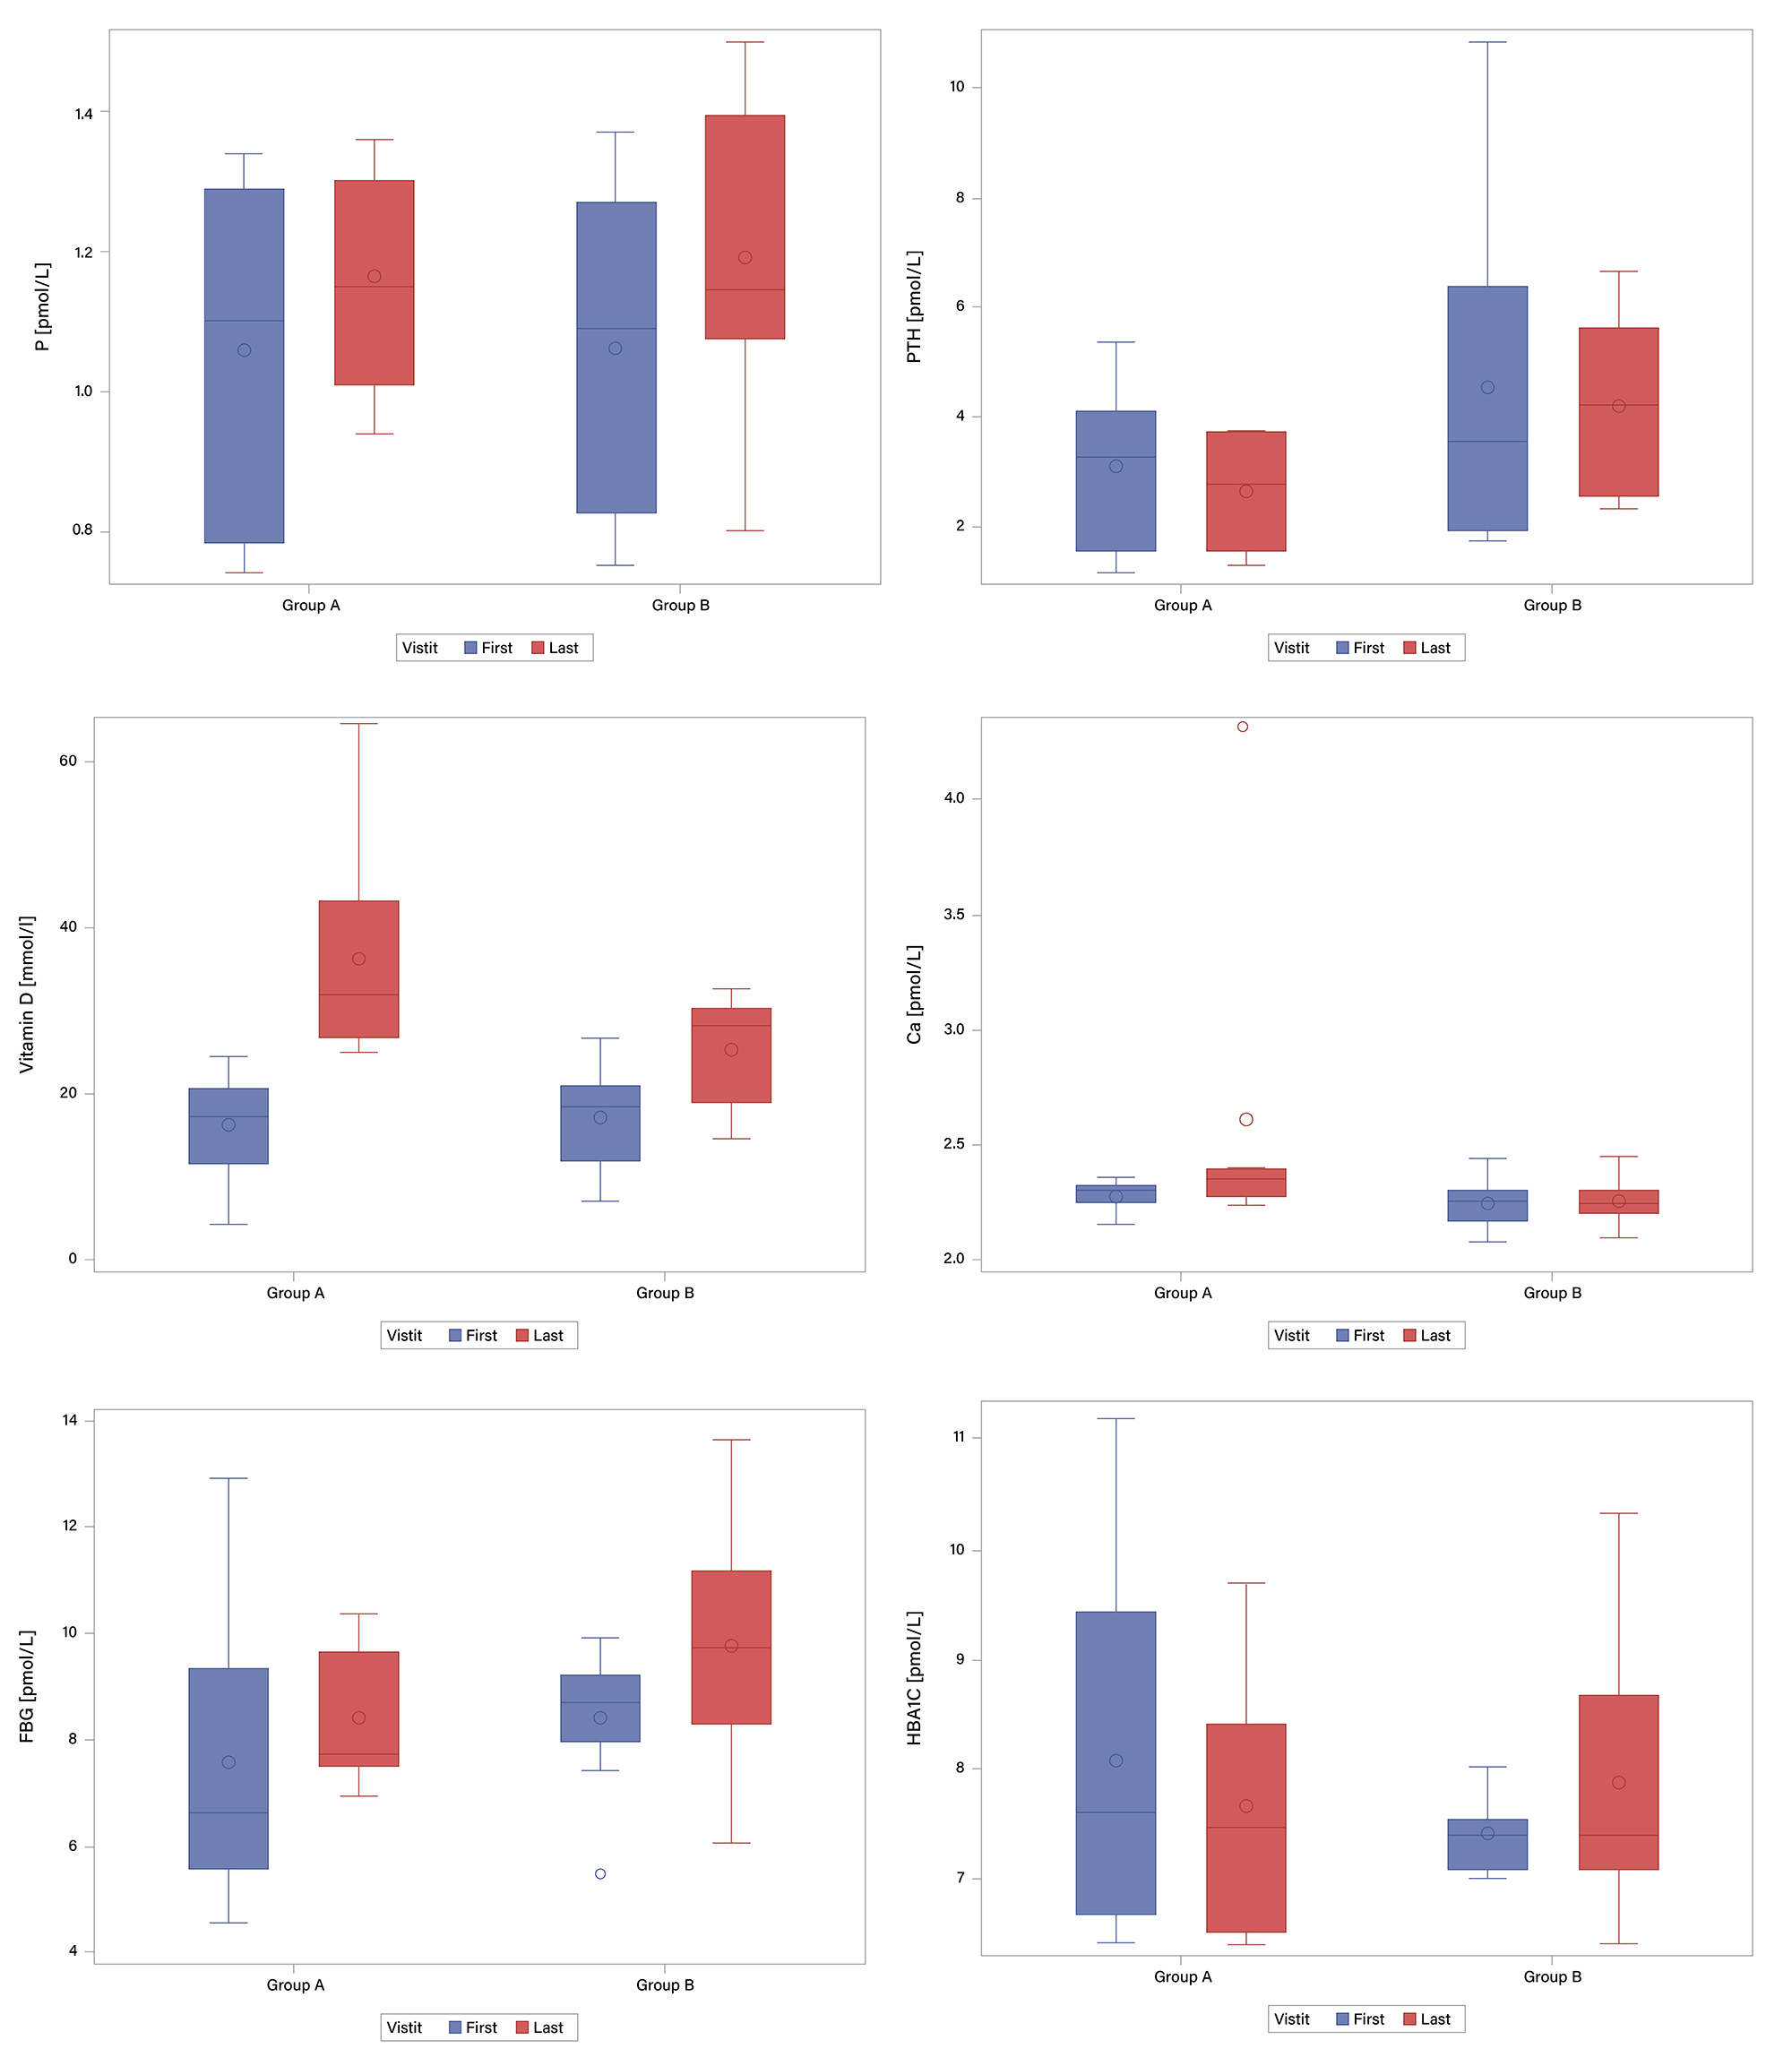 Fig. 2.
Box plots of baseline and 12-week values of metabolic parameters
in the high-dose (Group A, n = 7) and lower-dose (Group B, n = 8) vitamin D
groups. 25(OH)D increased significantly in both groups, with a greater increase
in the high-dose group (p
The correlation analysis examined relationships between changes in vitamin D levels and changes in selected parameters between the first and final patient visits. The strongest negative correlation was observed between the change in vitamin D and the change in PTH levels, with a greater increase in vitamin D associated with a decrease in PTH. This correlation was statistically significant (p = 0.0044). Positive correlations between changes in vitamin D and changes in glucose and calcium levels suggest that higher increases in vitamin D may be associated with slight increases in glucose and calcium; however, these relationships were not statistically significant (p = 0.2287 for glucose and p = 0.2554 for calcium). Other parameters, such as phosphorus and HbA1c, showed only weak correlations with changes in vitamin D, none of which were statistically significant (Table 3). Overall, these findings indicate that changes in vitamin D levels were most strongly associated with changes in PTH, whereas associations with other metabolic parameters were less pronounced.
| Parameter | Spearman’s correlation coefficient | p-value |
| FBG | 0.33065 | 0.2287 |
| Calcium | 0.31334 | 0.2554 |
| HbA1C | –0.07685 | 0.7854 |
| Phosphorus | –0.26009 | 0.3492 |
| PTH | –0.69052 | 0.0044 |
The scatter plot confirms a negative correlation between changes in vitamin D levels and changes in PTH, visible as a downward trend in the corresponding panel (Fig. 3). Greater increases in vitamin D were associated with reductions in PTH levels, consistent with the results of Spearman’s correlation coefficient and the observed statistical significance. A weak positive trend was noted for glucose and calcium, although the wide dispersion of data points indicates only a limited relationship. Phosphorus showed a slight negative correlation, while HbA1c values did not display any clear association with changes in vitamin D.
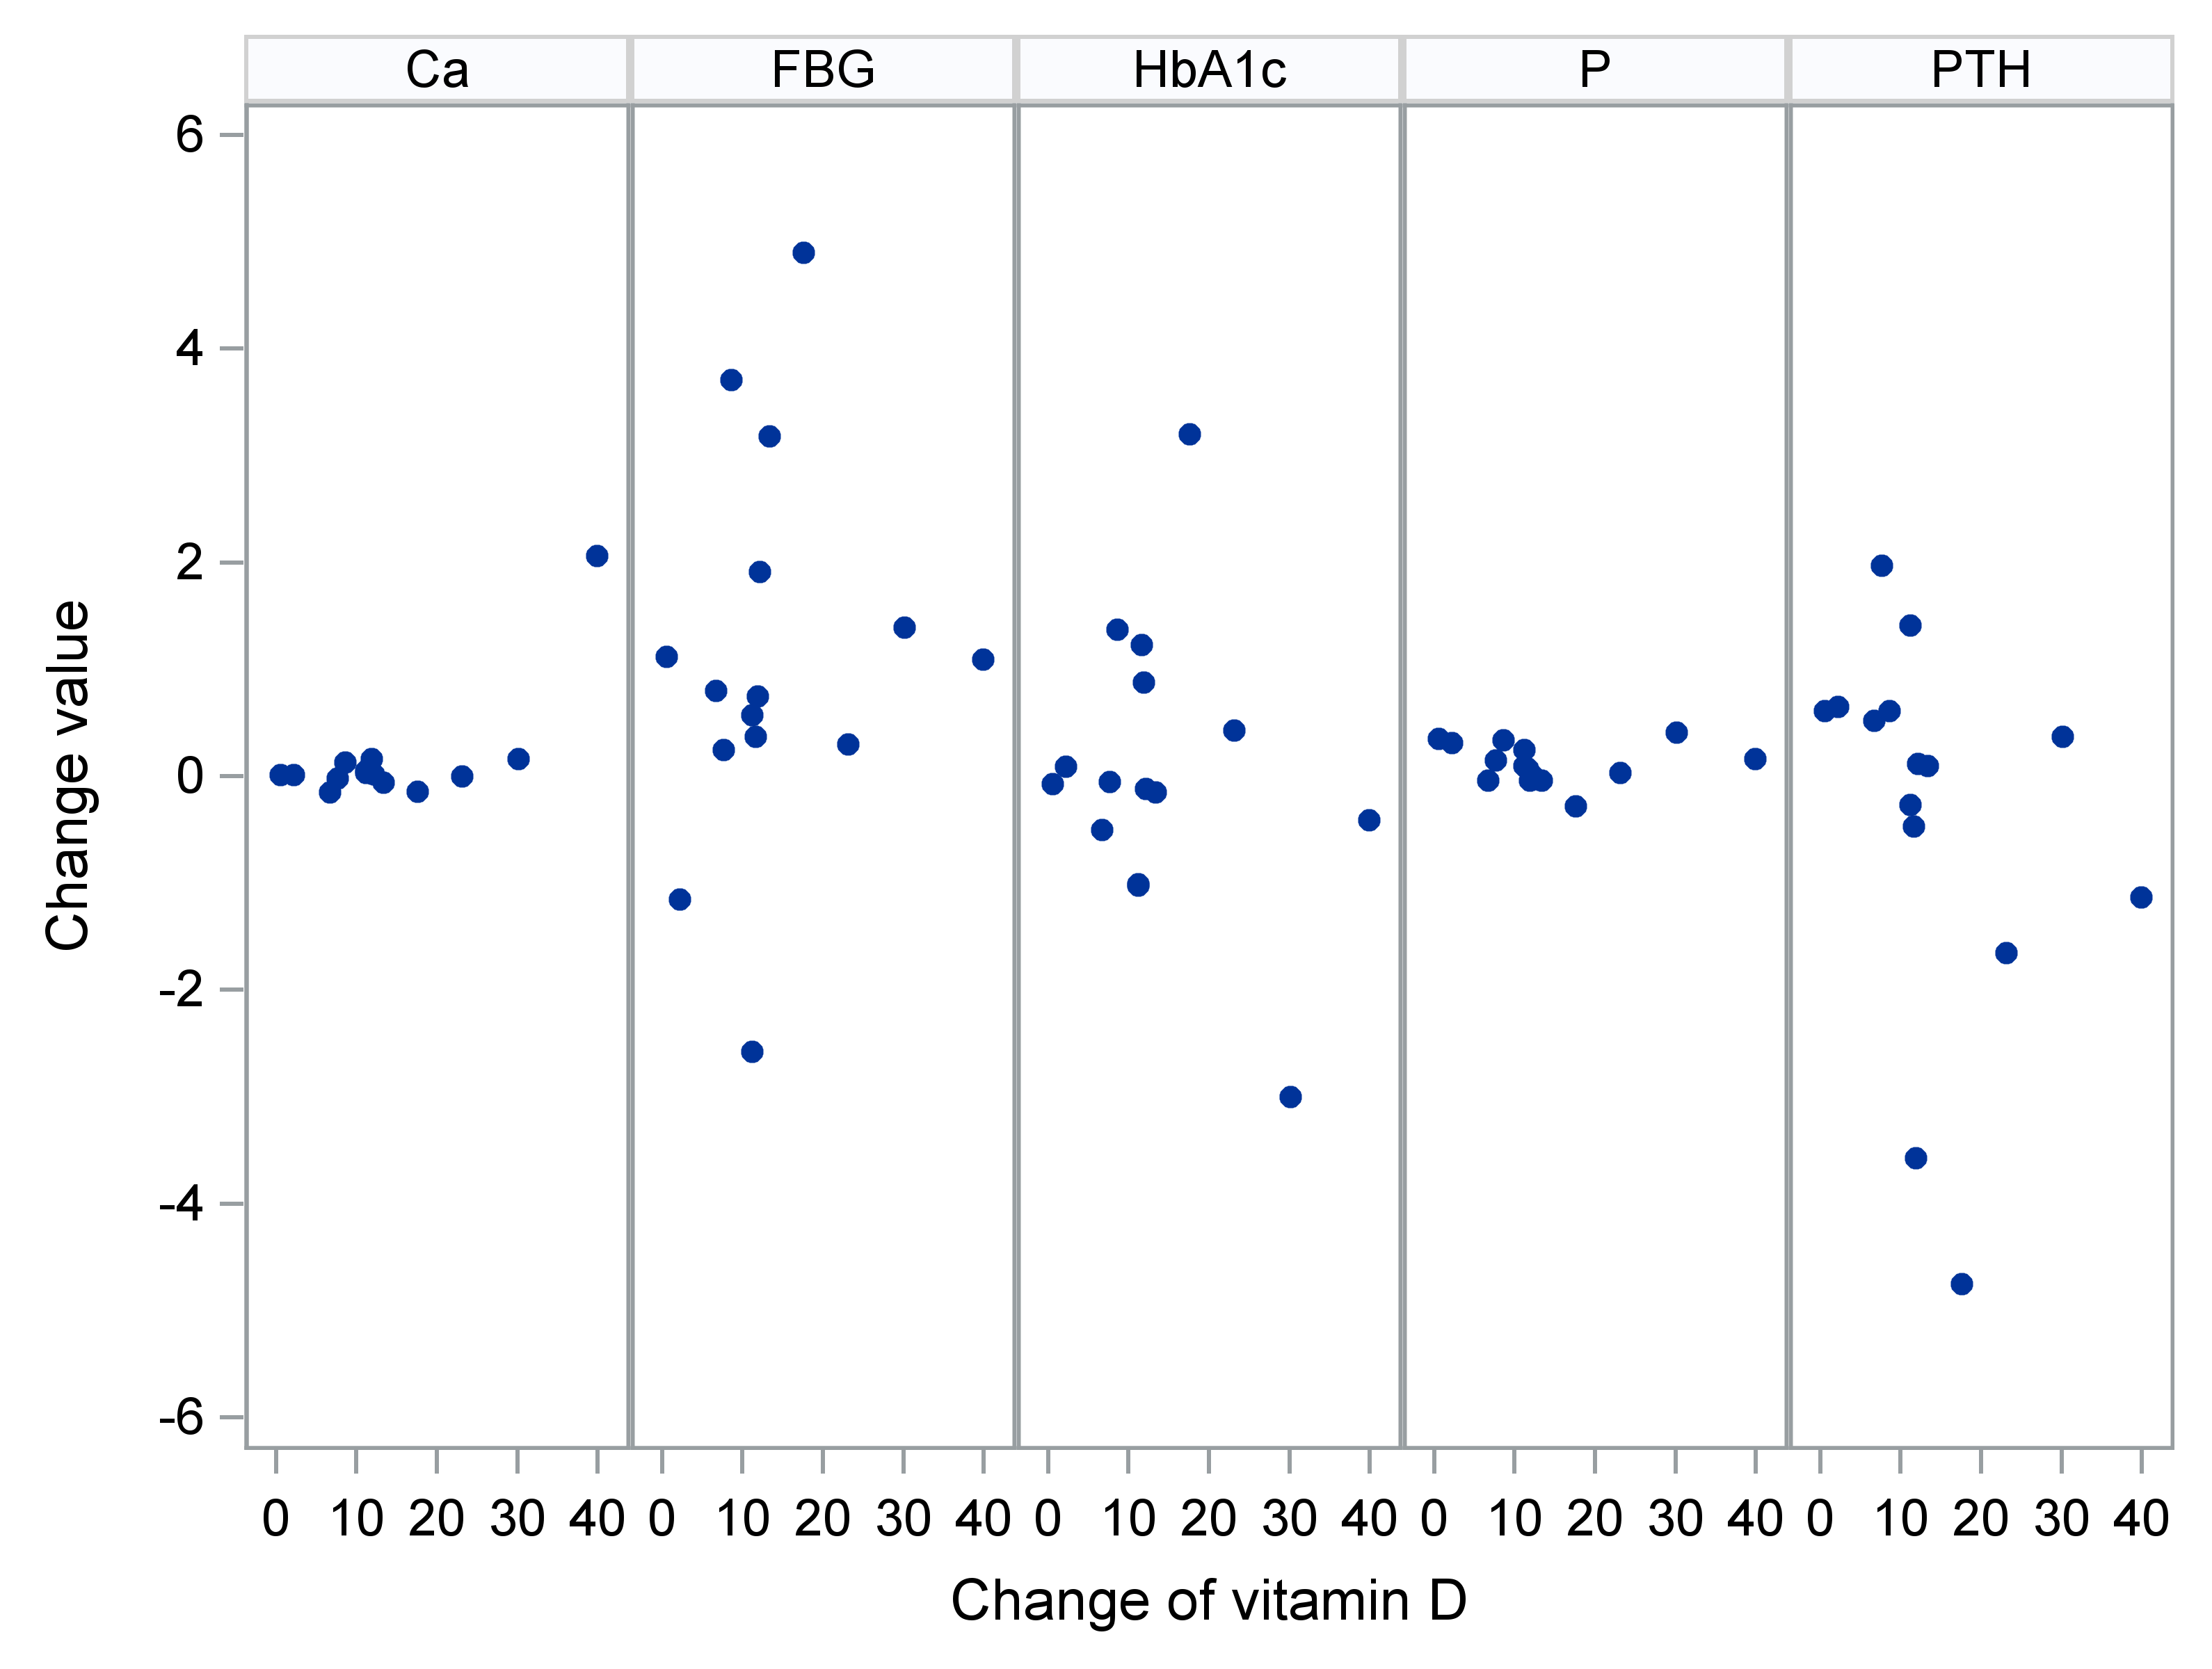 Fig. 3.
Scatter plots – change in parameters vs. change in vitamin D.
The aim of this study was to assess the effect of vitamin D supplementation on selected metabolic parameters—specifically PTH, glucose, calcium, phosphorus, and HbA1c—and to explore their relationship with changes in vitamin D levels. Patients were divided into an intervention group (Group A) and a control group (Group B), with changes tracked between the first and final visits. Parameter-specific analysis revealed that vitamin D supplementation had the strongest effect on PTH levels. A statistically significant negative correlation was observed, indicating that rising vitamin D levels were associated with reductions in PTH. In contrast, no statistically significant changes or correlations were observed for glucose, calcium, phosphorus, or HbA1c. Glucose levels showed a slight increase in both groups, but this was not statistically significant, suggesting that vitamin D supplementation does not directly affect glycaemic control over the observed period. Calcium and phosphorus levels remained stable, with no relevant changes or group differences. Similarly, HbA1c levels did not differ significantly, indicating that short-term vitamin D supplementation does not influence long-term glucose regulation. In summary, vitamin D supplementation had the most pronounced and statistically significant impact on PTH levels. Other metabolic parameters remained largely unchanged, suggesting that the primary short-term effect of high-dose vitamin D lies in bone metabolism and parathyroid regulation. Effects on other metabolic markers may require longer follow-up or larger sample sizes to be reliably detected.
According to current scientific data, approximately 40% of the European population has insufficient vitamin D levels, defined as serum 25(OH)D concentrations below 20 ng/mL [24]. This represents a significant public health concern, as low vitamin D levels are associated with an increased risk of numerous health complications, including impaired bone health, immune dysfunction, greater susceptibility to infections, and a higher risk of chronic diseases such as type 2 diabetes, cardiovascular disease, and certain cancers [25]. Even more concerning, about 13% of the European population is affected by severe vitamin D deficiency—defined as serum levels below 12 ng/mL—which may substantially impair health and quality of life [26]. These statistics highlight the urgent need to implement effective and targeted vitamin D supplementation strategies on a population-wide scale. Supplementation is particularly important in high-risk groups that are more vulnerable to the adverse consequences of deficiency, including older adults with reduced cutaneous vitamin D synthesis and individuals with prediabetes or type 2 diabetes, in whom deficiency may exacerbate insulin resistance and accelerate disease progression. People with elevated BMI are also disproportionately affected, as adipose tissue sequesters vitamin D and reduces its bioavailability [27, 28].
In this context, increased attention should be directed toward targeted vitamin D supplementation strategies tailored to the individual needs and risk factors of specific populations. Effectively addressing widespread deficiency requires a multidisciplinary approach that includes public and professional education on appropriate supplementation and the implementation of preventive and interventional programs focused on routine vitamin D monitoring, particularly in high-risk groups. Such efforts could substantially mitigate the negative public health impact of vitamin D deficiency and improve quality of life at a population level.
From a clinical perspective, one of the key ongoing questions is determining the optimal dosing of vitamin D necessary to achieve and maintain sufficient serum concentrations. Although current international guidelines provide clear recommendations, clinical practice continues to encounter inconsistencies and debate regarding individualized dosing.
The Endocrine Society, a leading authority in endocrinology and vitamin D metabolism, currently recommends daily doses between 800 and 2000 IU for most healthy adults to maintain adequate serum 25(OH)D levels. These recommendations consider physiological needs and cutaneous synthesis from sunlight exposure. Standard supplementation is effective in preventing deficiency in the general population, particularly among individuals with limited but regular sun exposure [29]. However, in clinical practice, it is often necessary to rapidly and effectively correct severe vitamin D deficiency, typically defined as serum 25(OH)D levels below 12 ng/mL. In such cases—where the goal is rapid repletion and resolution of clinical symptoms—the Endocrine Society guidelines allow for short-term administration of higher doses, such as 6000 IU per day or more, depending on clinical context [30]. Clinical studies have consistently shown that these high doses effectively raise serum vitamin D levels to optimal ranges and may lead to prompt clinical improvement. Although high doses of vitamin D (typically above 4000 IU daily) are effective in correcting deficiency [31], concerns remain about their long-term safety, particularly regarding the risk of overdose. Prolonged high-dose use, especially without monitoring, may result in adverse effects such as hypercalcemia, nephrocalcinosis, or soft tissue calcification [32, 33]. For this reason, most clinical guidelines emphasize that after successful correction of deficiency with high doses, patients should transition to lower maintenance doses appropriate for long-term supplementation [34]. These maintenance doses—generally between 800 and 2000 IU daily—are adequate for sustaining vitamin D stability without risking excessive accumulation. Dosing should always be individualized based on factors such as age, body weight, sun exposure, comorbidities, concurrent medications, and ongoing monitoring of serum 25(OH)D levels to ensure both safety and effectiveness [30].
Such a personalized and comprehensive approach enables clinicians to use vitamin D safely while minimizing the risks associated with improper or excessive dosing. It also provides flexibility in addressing diverse patient needs and supports both prevention and treatment of vitamin D deficiency at individual and population levels.
Our biomedical study aimed to build upon existing evidence by evaluating the effects of vitamin D supplementation under real-world clinical conditions. We monitored changes in serum vitamin D concentrations and their impact on metabolic parameters, patient-reported quality of life, and treatment satisfaction. Our findings confirmed a statistically significant negative correlation between vitamin D and PTH levels, indicating a robust inverse relationship. This observation is consistent with mechanistic evidence and supports the clinical validity of our hypothesis.
In contrast, we did not observe significant changes in HbA1c, FBG, serum calcium, or phosphorus levels. These findings align with previously reported data summarized in our systematic review and suggest that vitamin D supplementation may not induce short-term improvements in glycaemic or mineral metabolism. The small, non-significant increase in blood glucose observed in both study groups further supports the notion that vitamin D is unlikely to influence glycaemic control over a short observation period. Similarly, the stability of HbA1c, calcium, and phosphorus values suggests that longer intervention periods, alternative dosing strategies, or larger sample sizes may be necessary to detect meaningful metabolic effects.
Overall, our results contribute valuable real-world data to the growing body of evidence on vitamin D supplementation in individuals with type 2 diabetes mellitus (T2DM). The findings emphasize the need for longer-term, adequately powered trials to clarify the potential metabolic benefits of vitamin D. They also underscore the importance of individualized therapeutic strategies in diabetes care and highlight the necessity for continued investigation into the broader metabolic role of vitamin D.
The results of our biomedical study support the safety and efficacy of high-dose
vitamin D supplementation (
The datasets generated and analyzed during the current study are not publicly available due to patient confidentiality, but are available from the corresponding author upon reasonable request.
Conceptualization, FM, AG, TT and JP; methodology, FM, PJ, MK, JP and JK; software, PJ and MK; validation, AG, TT and JP; formal analysis, FM, AG, DD, JS, MJ and JP; investigation, JS, DD, MJ; resources, AG and TT; data curation, FM, AG and JP; writing—original draft preparation, FM; writing—review and editing, FM, AG and TT; visualization, FM; supervision, FM, AG, TT and JP; project administration, FM, AG, TT and JP; funding acquisition, FM and TT. All authors have read and agreed to the published version of the manuscript. All authors contributed to editorial changes in the manuscript. All authors have participated sufficiently in the work and agreed to be accountable for all aspects of the work.
Ethics approval for this study was obtained from the Ethics Committee of the University Hospital Bratislava – Ružinov (reference EK/041/2022, March 23, 2022). All participants provided written informed consent before participation. The authors confirm that all experimental protocols were approved by the Ethics Committee of the University Hospital Bratislava – Ružinov. The study is conducted in compliance with the Declaration of Helsinki of the World Medical Association—Ethical Principles for Medical Research Involving Human Subjects.
The authors have no additional acknowledgments to declare. The manuscript has been reviewed and edited for clarity and grammar by a professional English-language editor.
This research received no external funding.
The authors declare no conflict of interest.
References
Publisher’s Note: IMR Press stays neutral with regard to jurisdictional claims in published maps and institutional affiliations.