


 , Yue Zuo 5, Dansong Liu 5, Qirong Wang 1,2,*
1 Sports Nutrition Center, National Institute of Sports Medicine, 100029 Beijing, China
2 Key Lab of Sports Nutrition, General Administration of Sport of China, 100029 Beijing, China
3 School of Exercise and Health, Shanghai University of Sport, 200438 Shanghai, China
4 Sport Science College, Beijing Sport University, 100084 Beijing, China
5 School of Physical Education, Hubei University of Technology, 430068 Wuhan, Hubei, China
†These authors contributed equally.
Abstract
Prolonged or intense exercise can disrupt gastrointestinal (GI) function and gut microbiota, impairing athletic performance. Dietary fibre supplementation may enhance gut microbiota diversity, improve body composition, and promote recovery in athletes. This study aimed to explore the effects of dietary fibre supplementation at two doses for 8 weeks on these aspects in college basketball players.
Twenty male college basketball players (aged 17–25 years) were randomly assigned to a high-dose group (HDG; 10 participants; 6.84 g/day dietary fibre) or a low-dose group (LDG; 10 participants; 3.24 g/day dietary fibre). The participants consumed fibre-enriched meals daily while maintaining their regular training schedules. The outcome measures included gut microbiota diversity (metagenomic sequencing), body composition, fatigue recovery markers, glucose and lipid metabolism, and athletic performance. Statistical analyses included paired and independent t tests for within- and between-group comparisons and Spearman’s correlation analysis to assess the relationships between gut microbiota and biochemical markers.
One participant in the high-dose group withdrew, and nineteen ultimately completed the study. Both groups showed significant within-group improvements (p < 0.05) in body weight (HDG: –2.77 ± 0.76 kg; LDG: –2.40 ± 0.67 kg), body fat percentage (HDG: –1.87 ± 0.69; LDG: –1.49 ± 0.45), cortisol (HDG: –6.79 ± 4.26 μg/dL; LDG: –4.5 ± 4.84 μg/dL), maximum power (HDG: 27.16 ± 9.77 W; LDG: 14.50 ± 9.43 W), maximal oxygen uptake (HDG: 8.78 ± 0.97; LDG: 6.90 ± 1.37), and half-court triangle run times (HDG: –0.48 ± 0.36 s; LDG: –0.25 ± 0.20 s). Meanwhile, fasting blood glucose significantly decreased (0.91 ± 0.55 mmol/L; p = 0.001), and the gut microbiome changes were more stable in the HDG, whereas the LDG presented greater shifts in microbial diversity. No significant between-group differences were observed.
Dietary fibre supplementation improved the gut microbiome composition, body composition, fatigue recovery, and athletic performance of college basketball players, regardless of dosage. Further studies are needed to evaluate higher doses and specific fibre types.
Keywords
- dietary fibre
- gut microbiota
- athletic performance
Prolonged or intense exercise can disrupt gastrointestinal (GI) function by redirecting blood flow to skeletal muscles, causing GI ischaemia and compromising the intestinal barrier. This disruption leads to GI symptoms such as abdominal pain and diarrhoea, which can hinder athletic performance or force withdrawal from competitions [1, 2]. The gut microbiome plays a pivotal role in maintaining GI health by producing metabolites, regulating inflammation, and preserving the intestinal barrier [3]. Gut dysbiosis has been implicated in GI diseases such as irritable bowel syndrome and inflammatory bowel disease [4, 5]. Modulating the gut microbiome may therefore improve GI function, benefiting both health and athletic performance [4, 6, 7].
Dietary fibre is a significant determinant of the gut microbiome composition [8, 9]. A low-fibre diet reduces microbial diversity, decreases beneficial bacteria, and may result in the permanent loss of microbial species [10]. Athletes are often advised to consume low-fibre diets to minimize GI discomfort during exercise [11, 12]. However, long-term low-fibre intake may lead to dysbiosis, triggering intestinal inflammation and impairing metabolic health [13]. Supplementing with dietary fibre can produce beneficial substances for host metabolism and homeostasis, such as short-chain fatty acids (SCFAs) and active neurotransmitters [3].
Given the influence of the gut microbiome on physical performance, dietary fibre supplementation may represent a novel strategy to increase athletic performance and prevent metabolic disorders in athletes [14]. Nevertheless, high doses of dietary fibre can cause GI symptoms such as bloating and abdominal discomfort, highlighting the need to identify an optimal dosage for athletes.
This study examined the effects of dietary fibre supplementation at two different doses on the gut microbiome, body composition, fat recovery, glucose and lipid metabolism, and athletic performance of college basketball players. We hypothesized that high-dose supplementation would yield greater improvements in these outcomes.
Twenty male college basketball players from Hubei University of Technology were recruited in accordance with the principles outlined in the Helsinki Declaration. All participants were classified as second-level players in the Chinese University Basketball Association (CUBA) and provided written informed consent before the study. In this study, a double-blind methodology was employed to ensure that both the researchers and the participants were unaware of the group allocations. The participants were randomly assigned to either a high-dose group (n = 10) or a low-dose group (n = 10), with the sole difference between the groups being the dosage of the dietary fibre administered. Importantly, apart from this dosage variation, the two dietary fibre foods were identical in their composition, sensory characteristics, and nutritional profiles. The study was approved by the Ethics Committee of the Institute of Sports Medicine affiliated with the General Administration of Sport of China (Ethics Approval No. 202112).
The inclusion criteria were as follows: (1) healthy male college basketball players aged 17–25 years; (2) no history of diabetes, digestive or metabolic disorders, or other significant systemic diseases; (3) no prior or current sports-related injuries; (4) no use of medications or dietary supplements before the trial; (5) no allergies to oats, legumes, or dairy; and (6) no lactose intolerance. Participants were excluded if they failed to meet any single criterion of the inclusion standards.
Two dietary fibre supplements were developed. Both supplements from the same sources: oatmeal, rice flour, and inulin, the only difference between the groups was the quantity of fibre intake. The high-dose supplement contained 7.6 g of dietary fibre per 100 g, whereas the low-dose supplement contained 3.6 g of dietary fibre per 100 g. Apart from the fibre content, the supplements were identical in composition (Table 1).
| Item | High-dose group food | Low-dose group food |
| (per 100 g) | (per 100 g) | |
| Energy | 1600 KJ | 1600 KJ |
| Protein | 10.0 g | 10.0 g |
| Fat | 19.0 g | 19.0 g |
| Carbohydrates | 52.0 g | 52.0 g |
| Dietary fibre | 7.6 g | 3.6 g |
| Sodium | 100 mg | 100 mg |
The participants were instructed to avoid dairy products and high-fibre foods for five days before the experiment while maintaining their usual dietary habits. The study lasted for 8 weeks, during which each participant consumed 90 g of fibre-enriched food daily as breakfast. The food was dissolved in 180 mL of warm water at a temperature below 50 °C. The participants in the high-dose group received 6.84 g of dietary fibre per serving, whereas those in the low-dose group received 3.24 g. During the intervention, all the participants adhered to their regular training schedules, lifestyles, and dietary routines. They were instructed to cease training one day before testing and to fast after dinner, with only water permitted (Fig. 1).
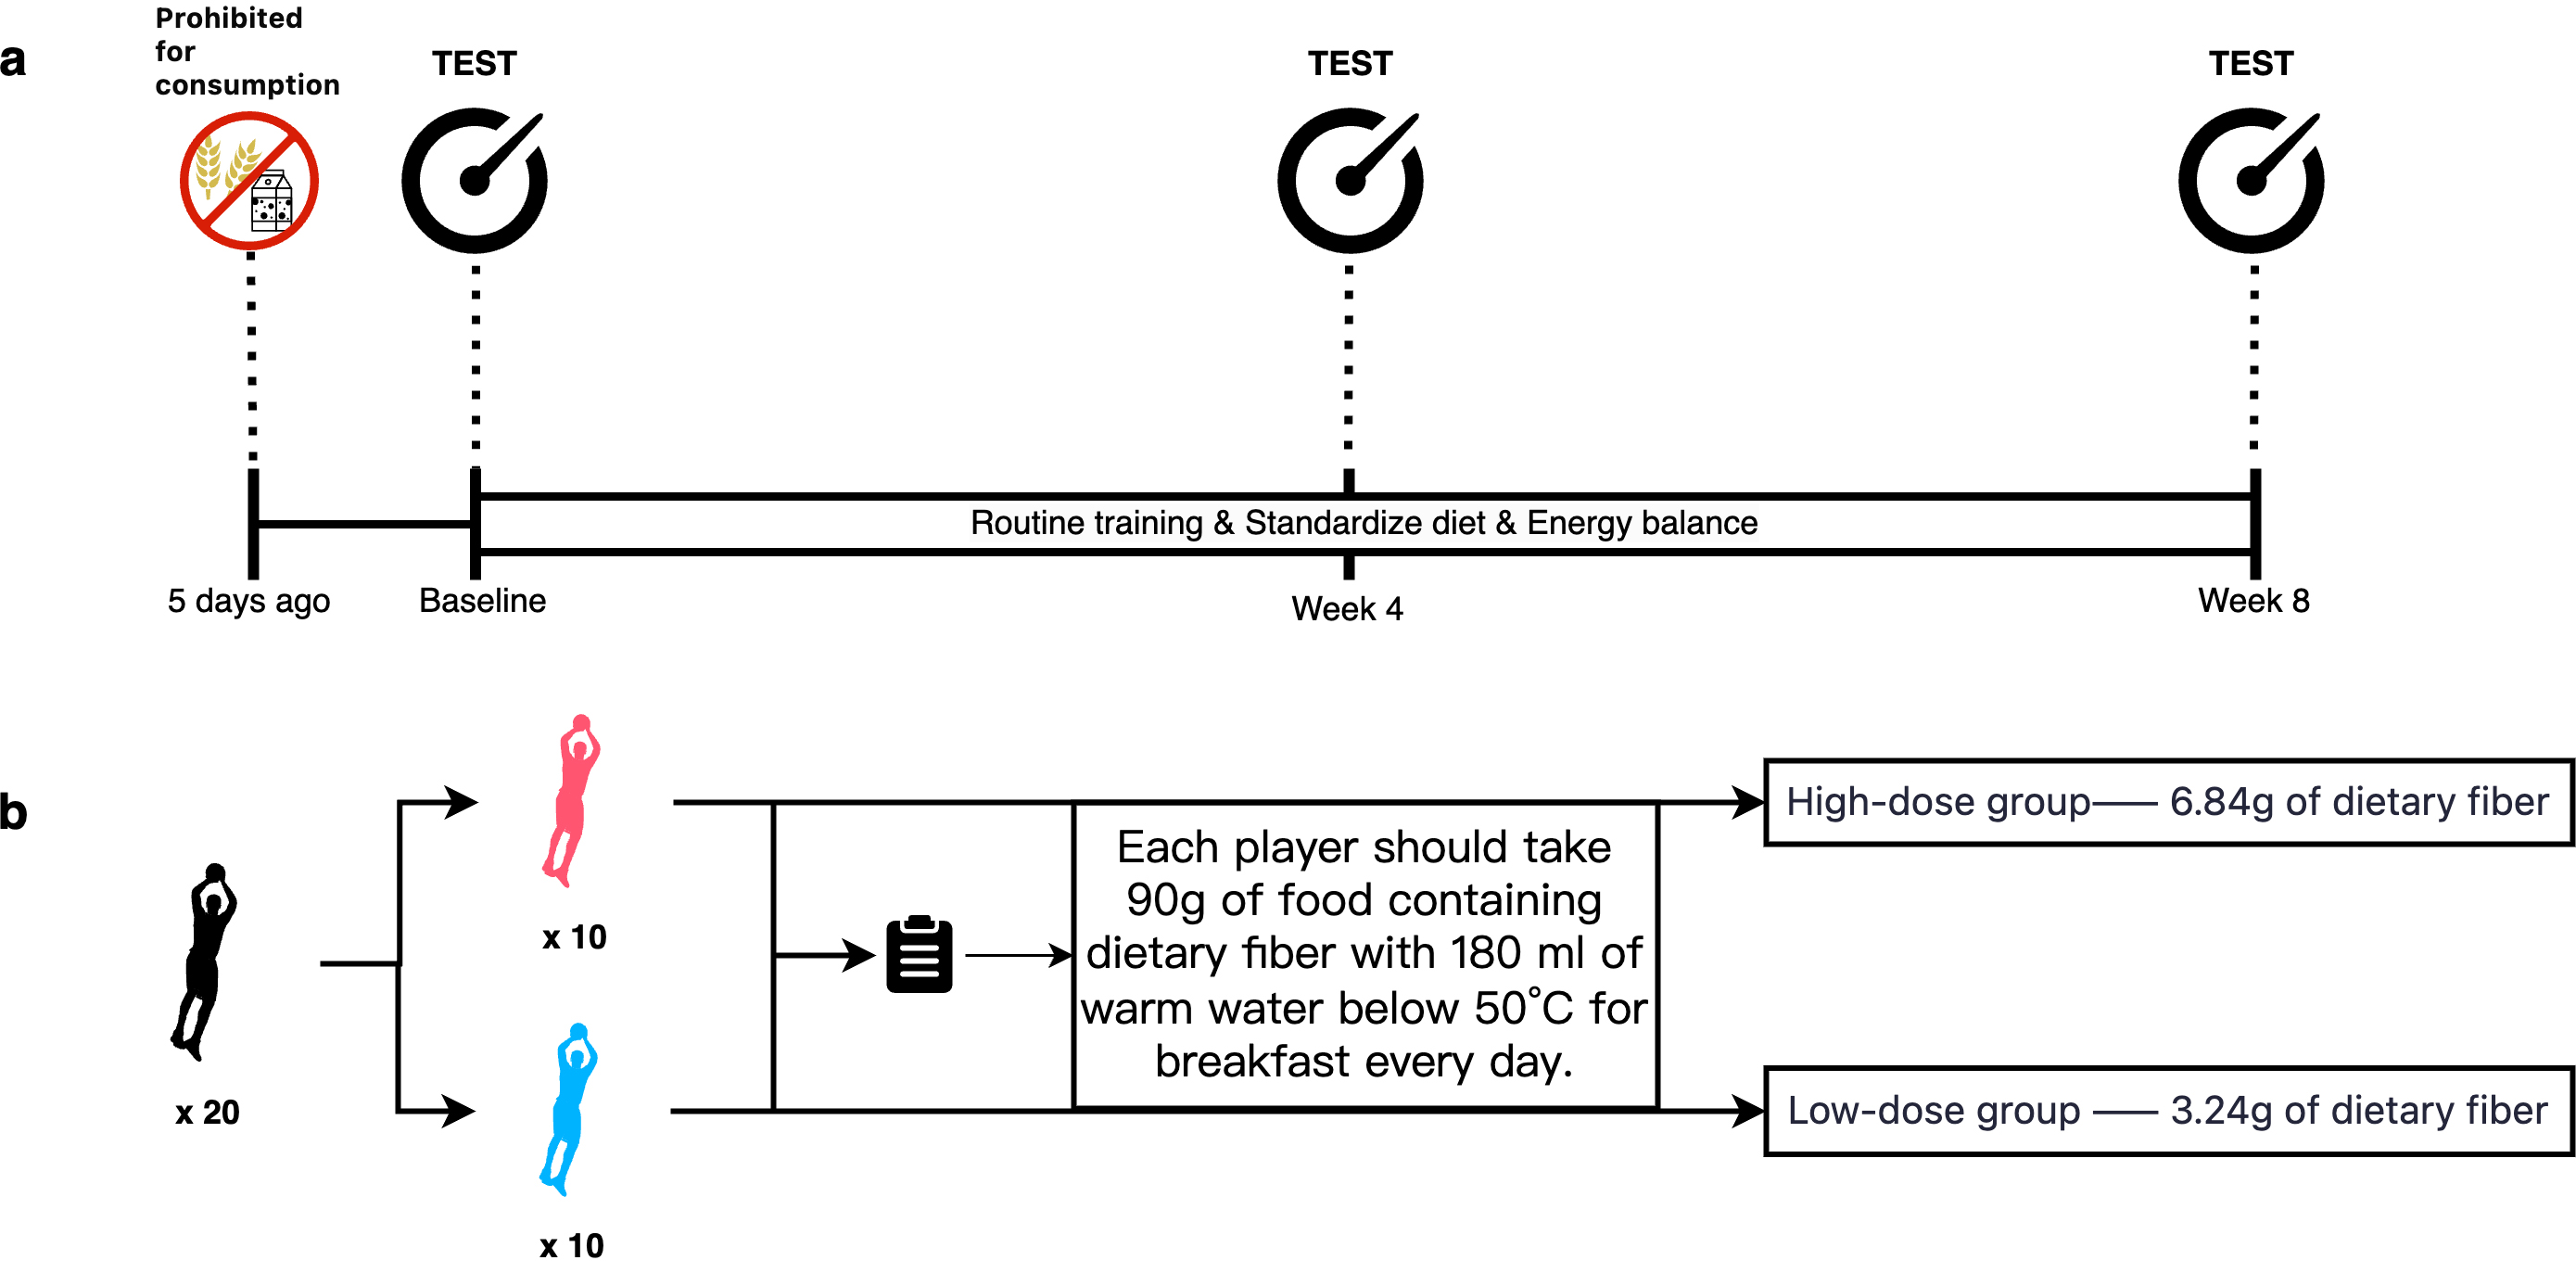 Fig. 1.
Nutritional intervention protocol. (a) Implementation process of the trial protocol. (b) Subject allocation and dietary fibre supplementation protocol.
Throughout the intervention, nutritionists provided individualized meal plans, education, and monitoring to ensure compliance, including recording the types of products consumed and calories. The participants followed a standardized diet, with approximately 55%, 30%, and 15% total caloric intake derived from carbohydrates, fats, and proteins, respectively. Players maintain a daily energy balance by matching caloric intake to their basal metabolic rate, the thermic effect of food, and exercise energy expenditure, with no requirement to gain or lose weight.
During the experimental period, all participants maintained their regular training schedules and intensity. Training sessions were held Monday to Friday from 6:30 PM to 8:00 PM, lasting 90 minutes each, with weekends reserved for rest. Exercise intensity was categorized as moderate to high, with the maximum heart rate remaining below 190 beats per minute (See Appendix A).
The standardized meal components were carefully weighed and recorded via the “Athlete and General Population Dietary Analysis and Management System” software developed by the Sports Medicine Research Institute of the General Administration of Sport of China. This software was used to calculate participants’ average daily dietary fibre intake to ensure that athletes adhered to their dietary plan. Other recording methods are also applicable under the same principles. The detailed data are provided in Table 2.
| Characteristics | Unit | High-dose group | Low-dose group | T | p |
| (N = 9) | (N = 10) | ||||
| Age | years | 20.6 |
20.0 |
0.806 | 0.431 |
| Height | cm | 180.7 |
181.5 |
–0.367 | 0.718 |
| Body weight | kg | 74.5 |
75.5 |
–0.304 | 0.764 |
| Body mass index | kg/m2 | 22.8 |
22.9 |
–0.161 | 0.874 |
| Dietary fibre from standardized meals | g/d | 16.3 |
16.3 |
||
| Total dietary fibre intake | g/d | 23.1 |
19.5 |
Outcome data were collected at three time points: baseline (pre-experiment), mid-intervention (week 4), and postintervention (week 8). These included maximum strength tests, basketball-specific performance tests, and weekly subjective ratings of perceived exertion (RPE). Additionally, body composition, fatigue recovery indices, glycaemic and lipid metabolism markers, aerobic capacity, and anaerobic capacity were assessed. The participants were instructed to cease training one day prior to testing, fast after dinner, and consume only water. The specific testing protocols are as follows:
Body composition was measured via a bioelectrical impedance analyser (InBody 3.0, InBody Co., Ltd., Seoul, Korea) after breakfast at baseline, at mid-intervention, and postintervention.
At all three time points, fasting venous blood samples were collected by medical staff. The serum was separated by centrifugation and stored at –80 °C in an ultralow temperature freezer for later analysis. Cortisol and testosterone levels were measured via a chemiluminescence immunoassay (UniCel Dxl 800, Beckman Coulter, Brea, California, USA), whereas serum creatine kinase (CK) levels were determined via an automated biochemical analyser (AU480, Beckman Coulter, Brea, CA, USA). Additionally, subjective fatigue levels were recorded weekly via the 20-point RPE scale at the end of the Friday training sessions.
Fasting venous blood samples were collected at all three time points. Serum was analysed to assess insulin levels via a chemiluminescence immunoassay (UniCel DxI 800, Beckman Coulter, Brea, California, USA), while blood glucose, total cholesterol, triglycerides, high-density lipoprotein (HDL), low-density lipoprotein (LDL), and nonesterified fatty acid (NEFA) were measured via an automated biochemical analyser (AU 700, Beckman Coulter, Brea, California, USA). The remaining serum samples were stored at –80 °C for future analyses.
Faecal samples were collected on the same days as blood samples were collected at baseline, at mid-intervention, and postintervention. The samples were immediately stored in liquid nitrogen at –75 °C and sent to the Beijing Genomics Institute (BGI) for metagenomic sequencing. The analysis consisted of the following steps:
A. Library Construction and Sequencing
DNA concentrations were quantified via fluorometric assays, and integrity was confirmed via 1% agarose gel electrophoresis. One microgram of genomic DNA was fragmented via a Covaris instrument, and fragments of 200–400 bp were selected. The DNA ends were repaired, an “A” base was added at the 3′ terminus, and the adapters were ligated. Ligation products were amplified via polymerase chain reaction (PCR), purified, and circularized to generate sequencing libraries. Libraries were sequenced on the DNBSEQ platform.
B. Bioinformatic Analysis
Low-quality reads, reads containing excessive “N” bases, and contaminants were removed via SOAPnuke software [15]. Clean reads were assembled via MEGAHIT [16], followed by gene prediction and redundancy. The downstream analyses included abundance profiling and species- and function-based differential analyses.
C. Evaluation Metrics
a. Species Annotation
Species annotation was conducted against the Unified Human Gastrointestinal Genome (UHGG) database to classify organisms at each taxonomic level.
b. Diversity Analysis
Alpha diversity: Alpha diversity is an indicator of species diversity within a single sample [17]. The Chao1 index reflects community richness, with higher values indicating greater species variety [18]. The Shannon and Simpson indices reflect both species richness and evenness [19, 20], where higher Shannon values and lower Simpson values indicate greater diversity and a more uniform species distribution.
Beta diversity: Beta diversity evaluates differences in microbial communities between samples on the basis of abundance data [21]. Nonmetric multidimensional scaling (NMDS) and analysis of similarities (ANOSIM) were used for comparison. NMDS reduces high-dimensional data into a two-dimensional space while preserving the original relationships for visualization [22]. Each point represents a sample, and overlapping sample ranges suggest greater intergroup similarity. ANOSIM, a distance-matrix-based statistical method, evaluates significant differences between microbial communities without focusing on individual species [23].
c. Differential Analysis
The Wilcoxon rank-sum test was used to assess changes in species-level abundance within and between groups before and after nutritional intervention. Owing to the large number of species identified, key species were highlighted through textual descriptions and graphical representations of the top 30 differential species.
d. Correlation Analysis
After intervention, correlations between gut microbiota at the species level and specific biochemical indicators were analysed. Fatigue recovery markers (cortisol, testosterone, creatine kinase) and glucose‒lipid metabolism markers (blood glucose, insulin, total cholesterol, triglycerides, high-density lipoprotein, low-density lipoprotein, and nonesterified fatty acid) were included. The results were visualized via a correlation heatmap, which displays Spearman rank correlation coefficients. The horizontal axis represents differential species, whereas the vertical axis represents biochemical indicators. In the results section, only the correlations between the biochemical indicators and the microbiota that showed significant changes postintervention are described. The colour intensity indicates the strength of the correlation, with deeper shading reflecting stronger associations. Red hues indicate positive correlations, whereas blue hues indicate negative correlations.
A. Aerobic Capacity Testing
The participants performed treadmill exercises via a portable cardiopulmonary function testing system (Cortex Metamax 3B, Cortex Biophysik GmbH, Leipzig, Germany). The running speed ranged from 11.2 to 13.6 km/h, with a 2% increase every 2 minutes until exhaustion. The maximal oxygen uptake (VO2max) was recorded at the point of fatigue, defined by a decrease in VO2max despite continued effort.
B. Anaerobic Capacity Testing
Anaerobic performance was assessed via a 30-second Wingate test on a power bicycle (Monark 839E, Monark Exercise AB, Vansbro, Sweden). The maximum and average anaerobic powers were calculated.
C. Maximum Strength Testing (1RM Squat)
The participants warmed up with 5–10 repetitions using an unloaded barbell, followed by a 1-minute rest. Additional sets of 3–5 repetitions were completed with progressively increasing loads, followed by a 2-minute rest. The one-repetition maximum (1RM) squat was determined after a final attempt.
D. Basketball-Specific Performance Testing
The basketball-specific tests included jumping tests (single-leg vertical jump, double-leg vertical jump, standing double-touch height, and triple frog jump), speed tests (half-court triangle run), and agility tests (variable-distance shuttle run) (Fig. 2).
 Fig. 2.
Basketball-specific performance testing. (a) Half-court triangle running. (b) Variable-distance shuttle run.
Statistical analyses were conducted via SPSS 27.0 (IBM Inc., Chicago, IL, USA).
The data are presented as the means
Independent-samples t tests were used to compare the baseline
characteristics of the two groups, as well as intergroup differences in
preintervention body composition, fatigue recovery indicators, glucose and lipid
metabolism markers, RPE, and physical performance. Postintervention intergroup
differences were assessed by analysing changes (postintervention minus baseline)
via independent-samples t tests. Within-group changes were evaluated via
paired samples t tests. A p value of
Spearman correlation analysis was used to examine the relationships between
postintervention gut microbiome composition and selected biochemical markers. The
correlation strength (r) was categorized as follows:
A total of 20 male basketball players with second-level sports qualifications who met the inclusion criteria were recruited for this study. The participants were randomly assigned to either the high-dose or low-dose group. During the intervention, one participant from the high-dose group withdrew, resulting in 9 participants in the high-dose group and 10 in the low-dose group completing the study and all data collection.
Baseline characteristics were compared between the two groups. No significant differences were observed, confirming comparable baseline conditions (Table 2).
Both groups were provided with standardized meals during the intervention. The
average dietary fibre intake from these meals was 16.3
At the phylum level, the dominant bacterial phyla and their relative abundances were generally similar between the high-dose and low-dose groups before and after dietary fibre supplementation. The dominant phyla included Bacteroidetes, Firmicutes, Proteobacteria, and Antibacterial (Fig. 3).
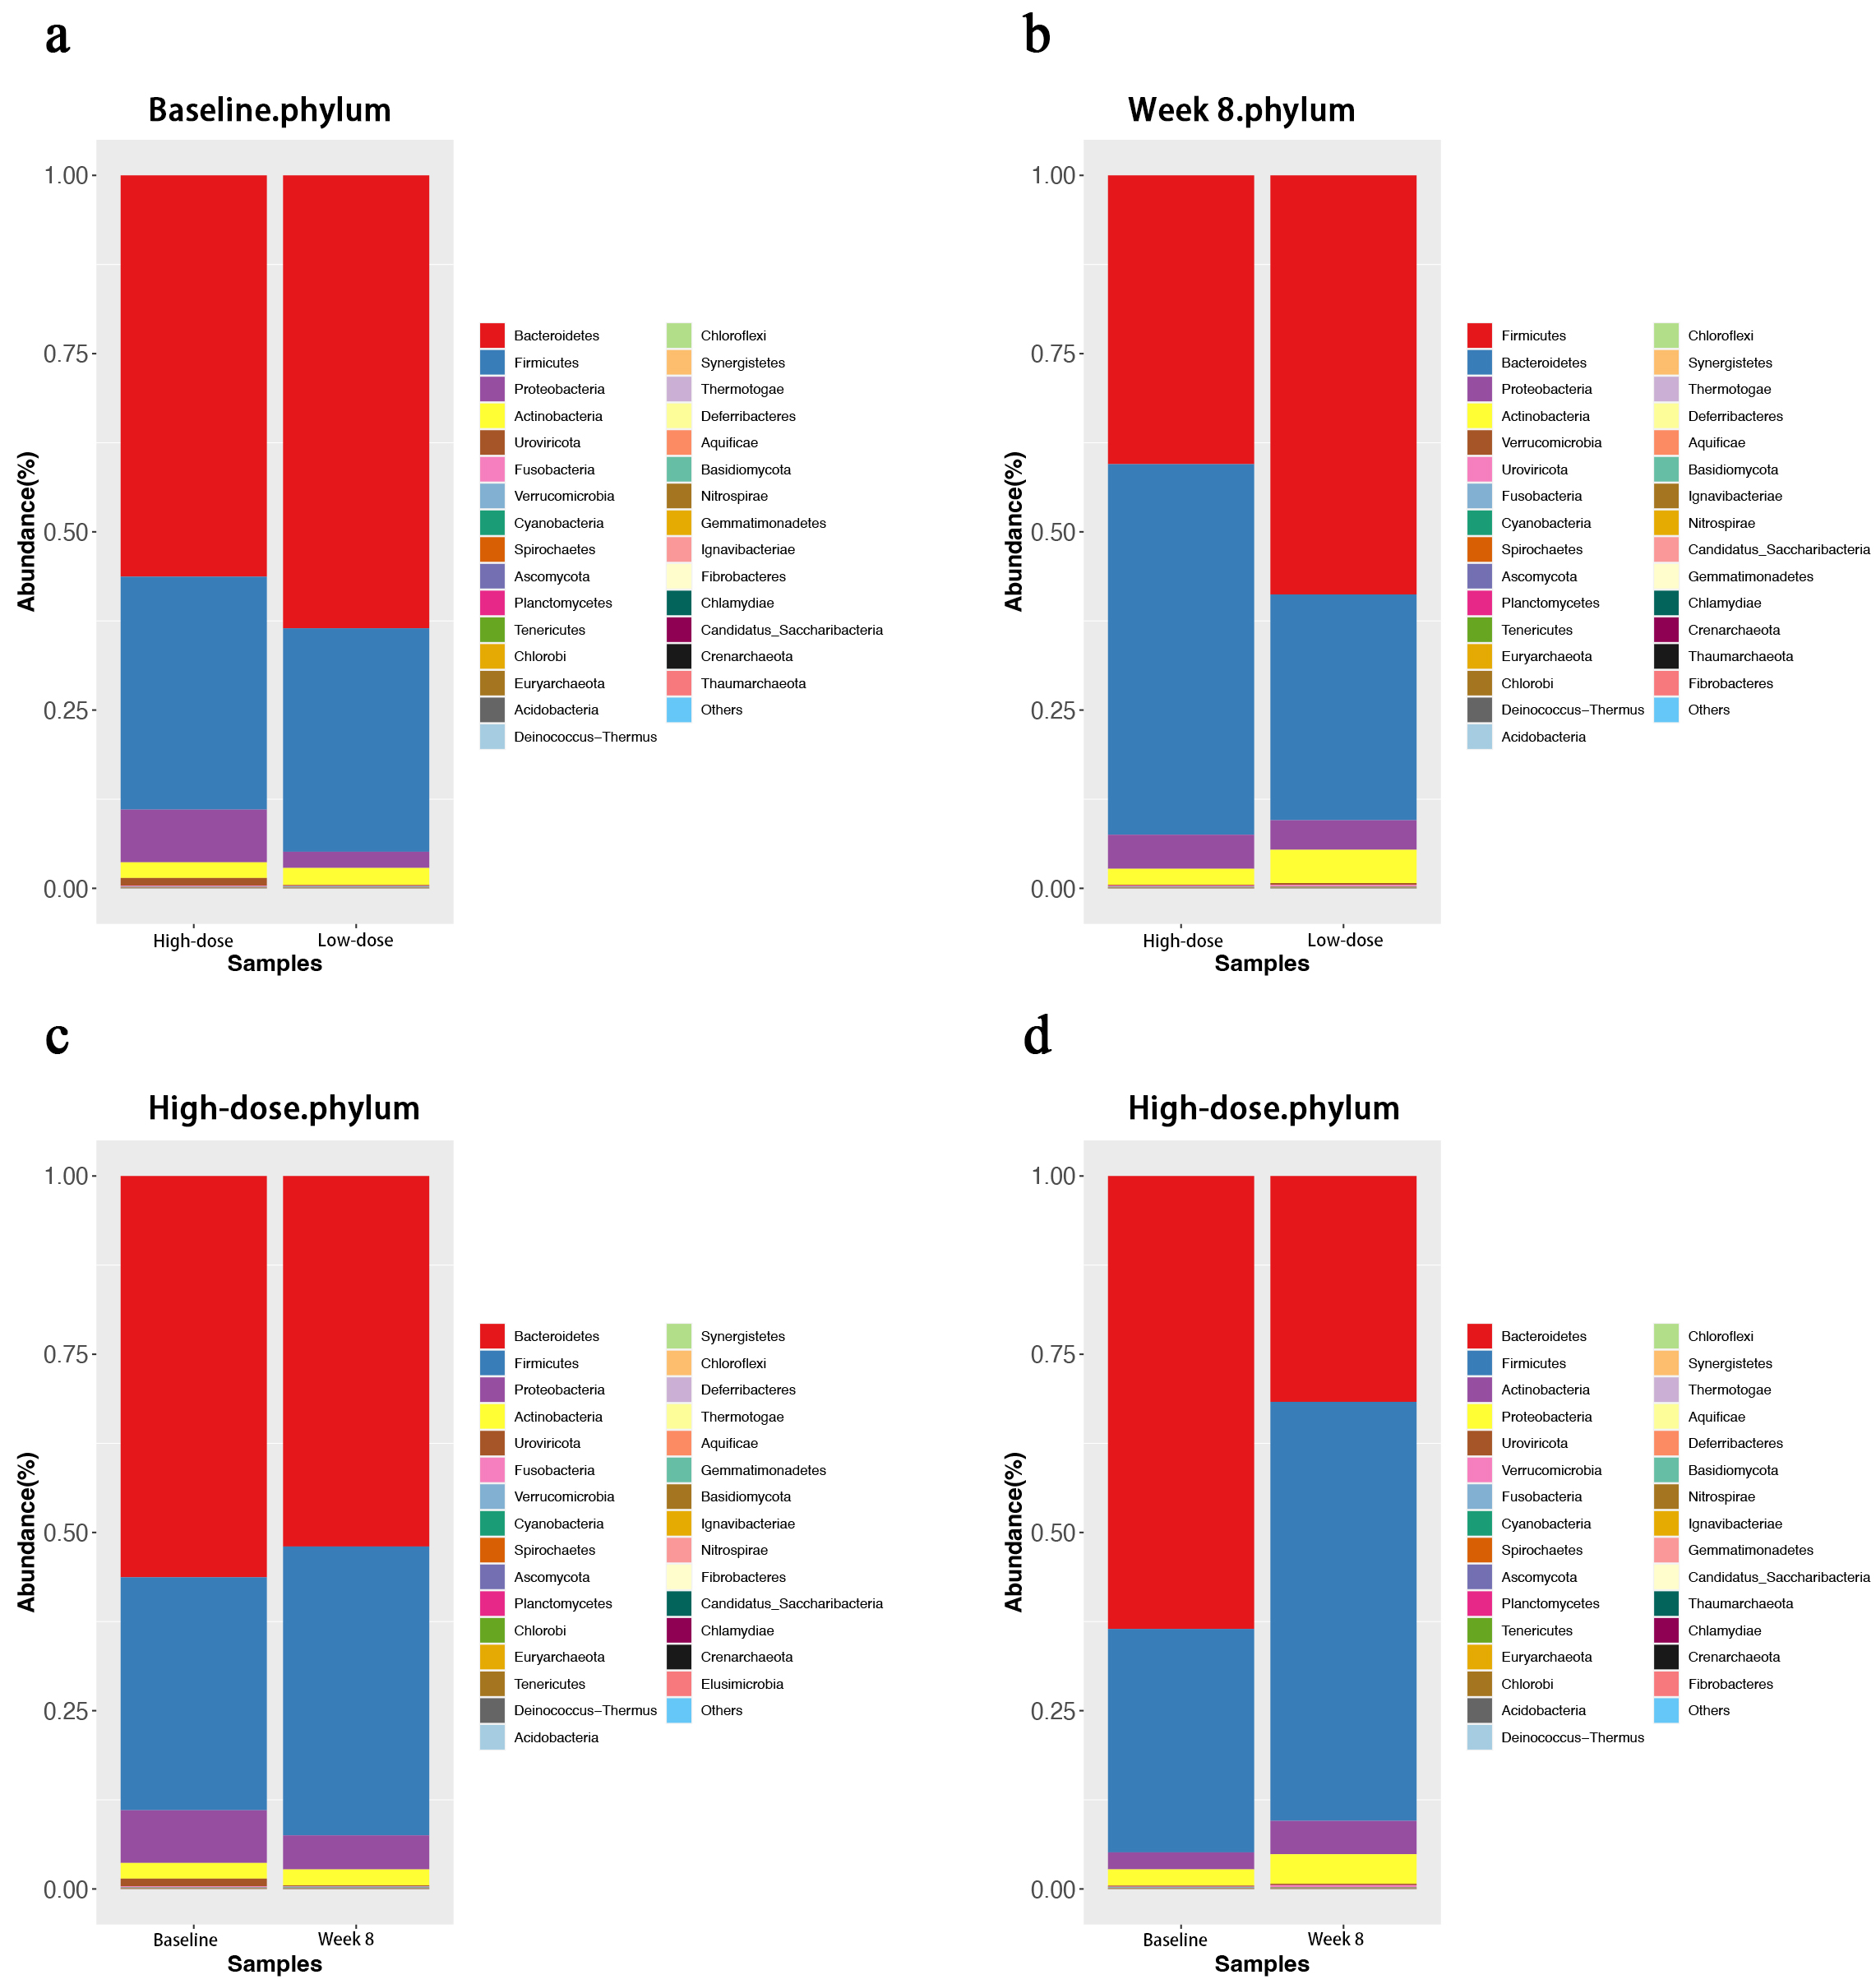 Fig. 3.
Bar plot of abundance at the phylum level. (a) The high-dose and low-dose groups before the intervention. (b) The high-dose and low-dose groups after the intervention. (c) The high-dose group before and after the intervention. (d) Low-dose group before and after the intervention.
After dietary fibre supplementation, the abundance of Firmicutes in the high-dose group was significantly lower than that in the low-dose group (p = 0.022), whereas the abundance of Bacteroidetes in the high-dose group was significantly greater than that in the low-dose group (p = 0.043).
Before dietary fibre supplementation, Firmicutes accounted for 32.67%, and Bacteroidetes accounted for 56.28% in the high-dose group. After the intervention, the relative abundance of Firmicutes increased to 40.51%, whereas that of Bacteroidetes decreased to 51.97%. The Firmicutes to Bacteroidetes (F/B) ratio change from 0.58 to 0.78 was not statistically significant.
In the low-dose group, Firmicutes accounted for 31.34%, and Bacteroidetes accounted for 63.53% before dietary fibre supplementation. After the intervention, the relative abundance of Firmicutes significantly increased to 58.78%, whereas that of Bacteroidetes significantly decreased to 31.68%. The F/B ratio significantly increased from 0.49 to 1.86.
To evaluate microbial diversity within samples, alpha diversity was assessed at the species level for both groups before and after dietary fibre supplementation (Fig. 4).
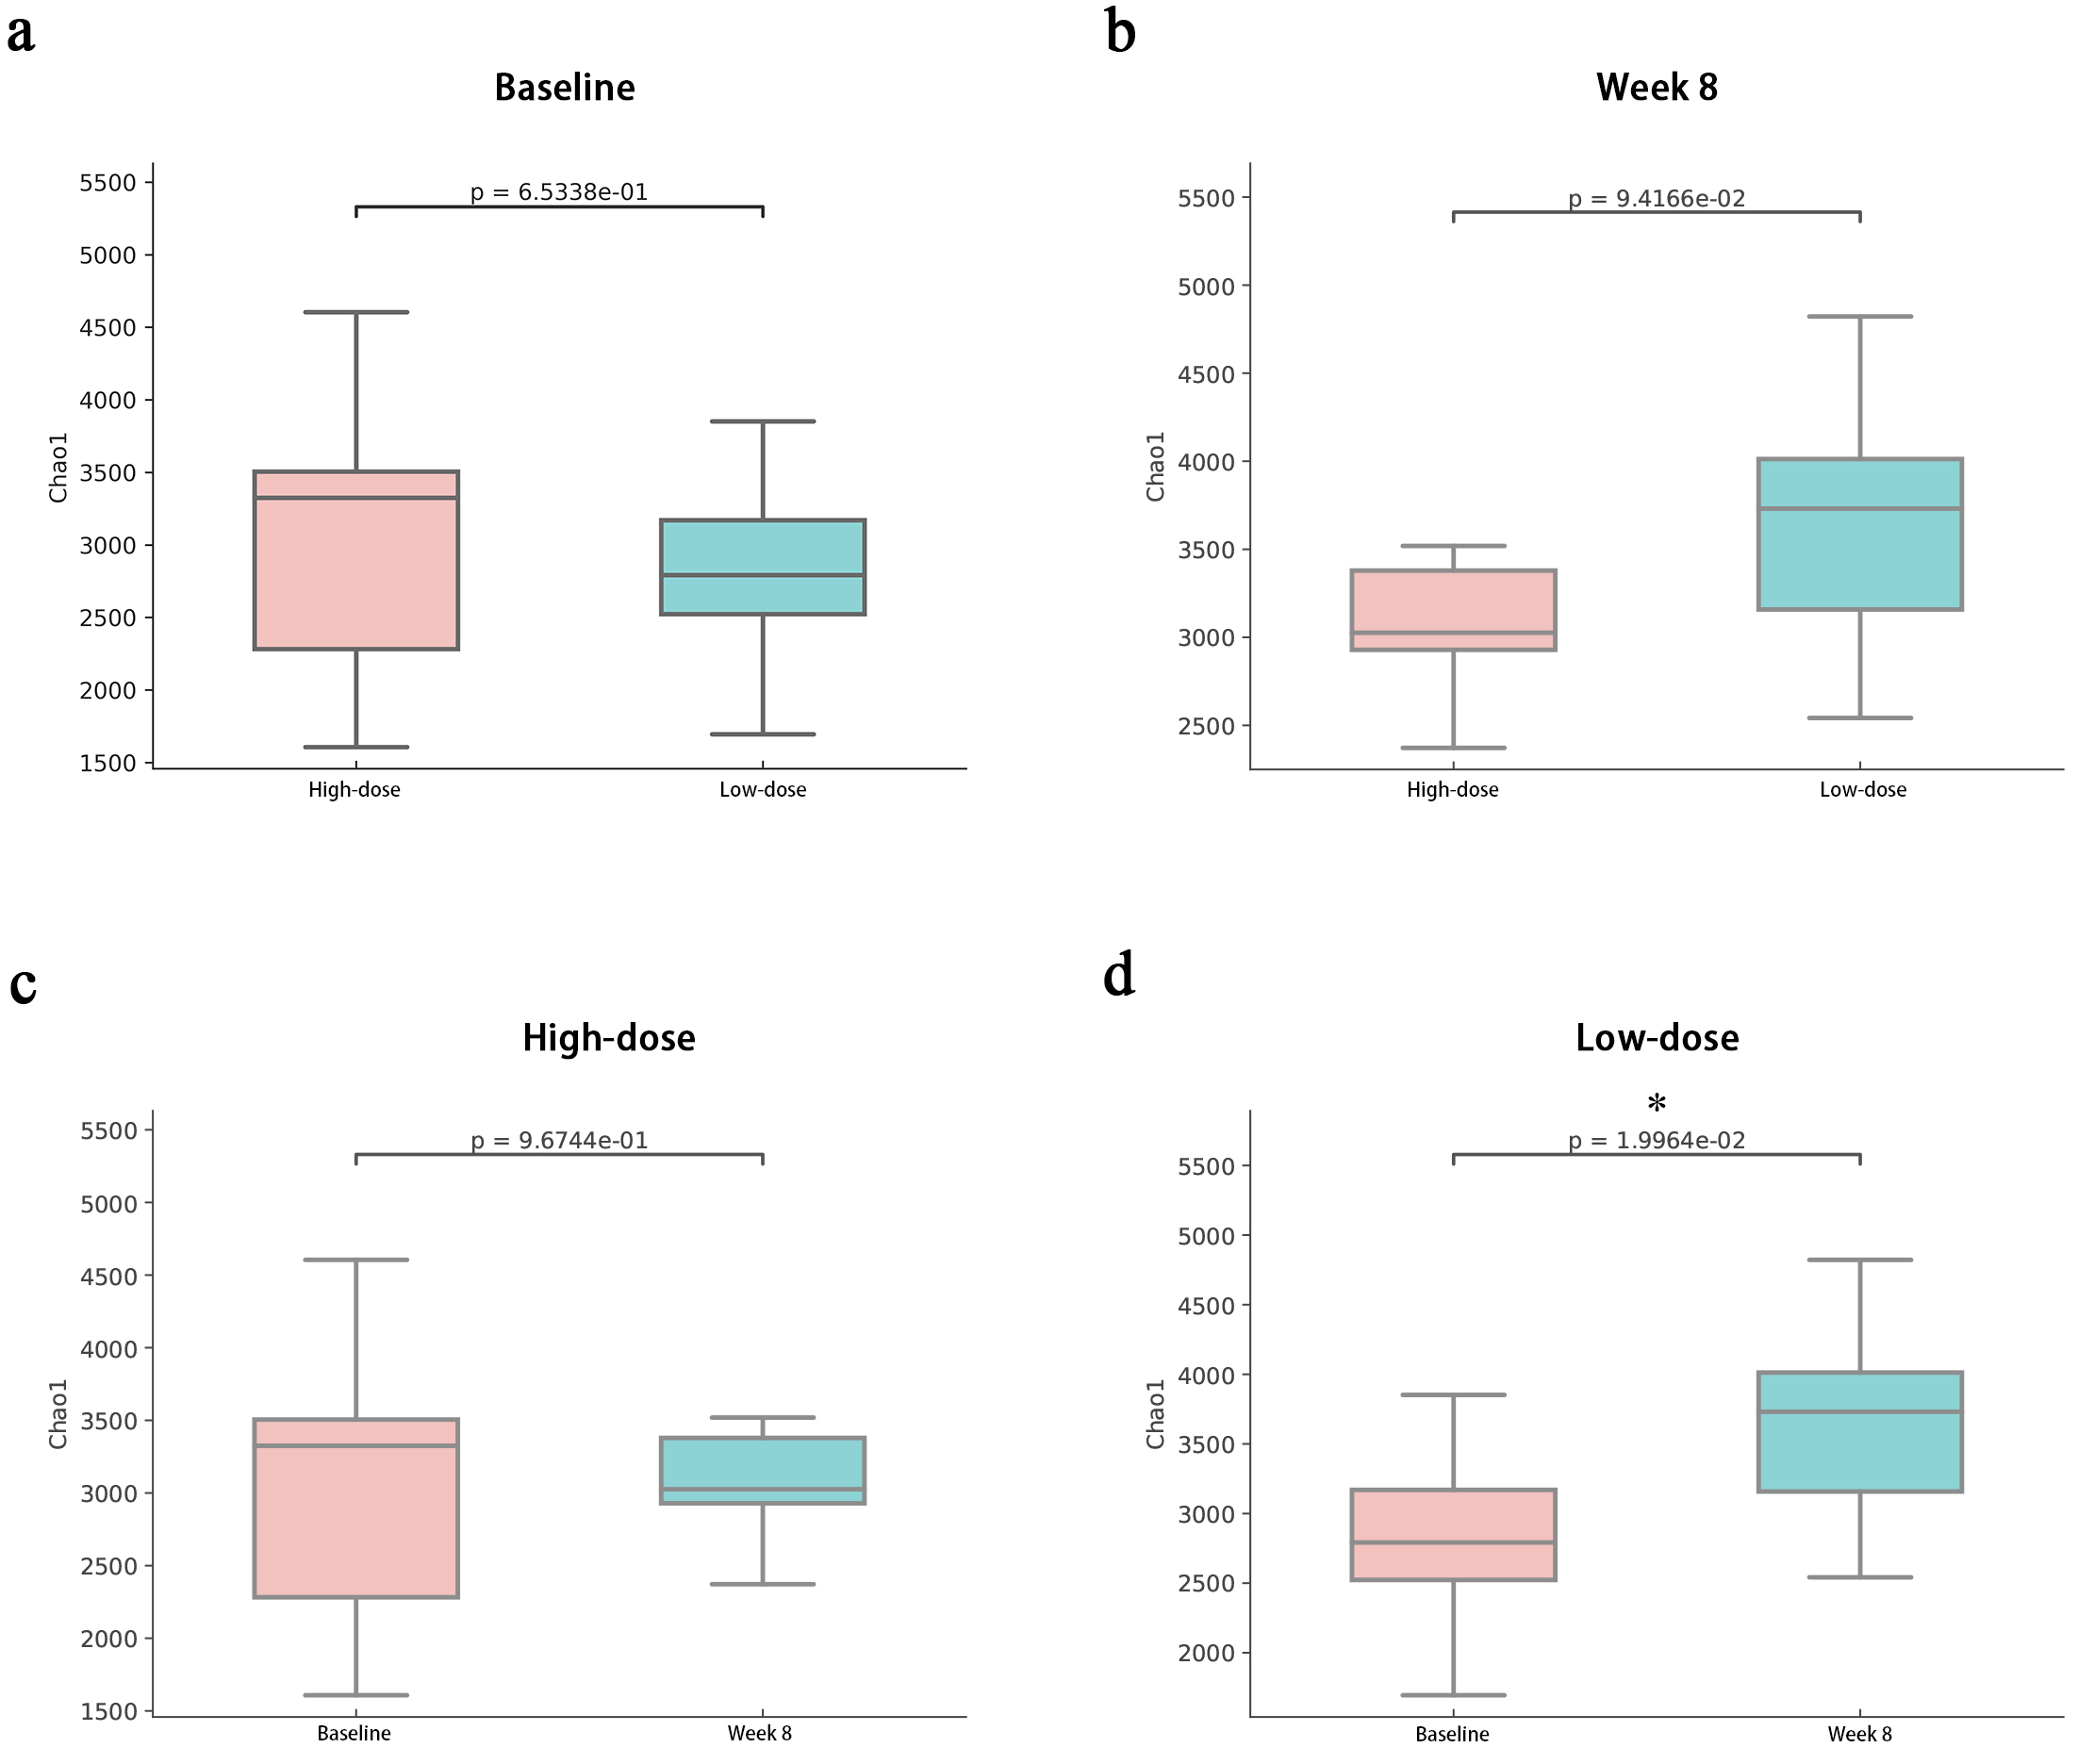 Fig. 4.
Changes in the Chao1 index at the species level. (a) Changes in the Chao1 index between the high-dose and low-dose groups before the intervention. (b) Changes in the Chao1 index between the high-dose and low-dose groups after the intervention. (c) Changes in the Chao1 index in the high-dose group before and after the intervention. (d) Changes in the Chao1 index in the low-dose group before and after the intervention. * indicates a significant difference within the group before and after the intervention.
Before the intervention, the Chao1 index, which reflects community richness, was comparable between the high-dose and low-dose groups. Postintervention, no significant differences in the Chao1 index were observed between the groups. Within-group changes revealed a nonsignificant decrease in the Chao1 index for the high-dose group, whereas the low-dose group presented a significant increase.
Similarly, the Shannon and Simpson indices, which account for both species richness and evenness, were comparable between the groups at baseline. Postintervention, there were no significant differences in the changes in the Shannon and Simpson indices between the two groups. Within-group analysis revealed no notable changes in these indices for either group after supplementation.
Beta diversity, reflecting differences in microbial composition between samples, was analysed via NMDS and ANOSIM at the species level (Fig. 5).
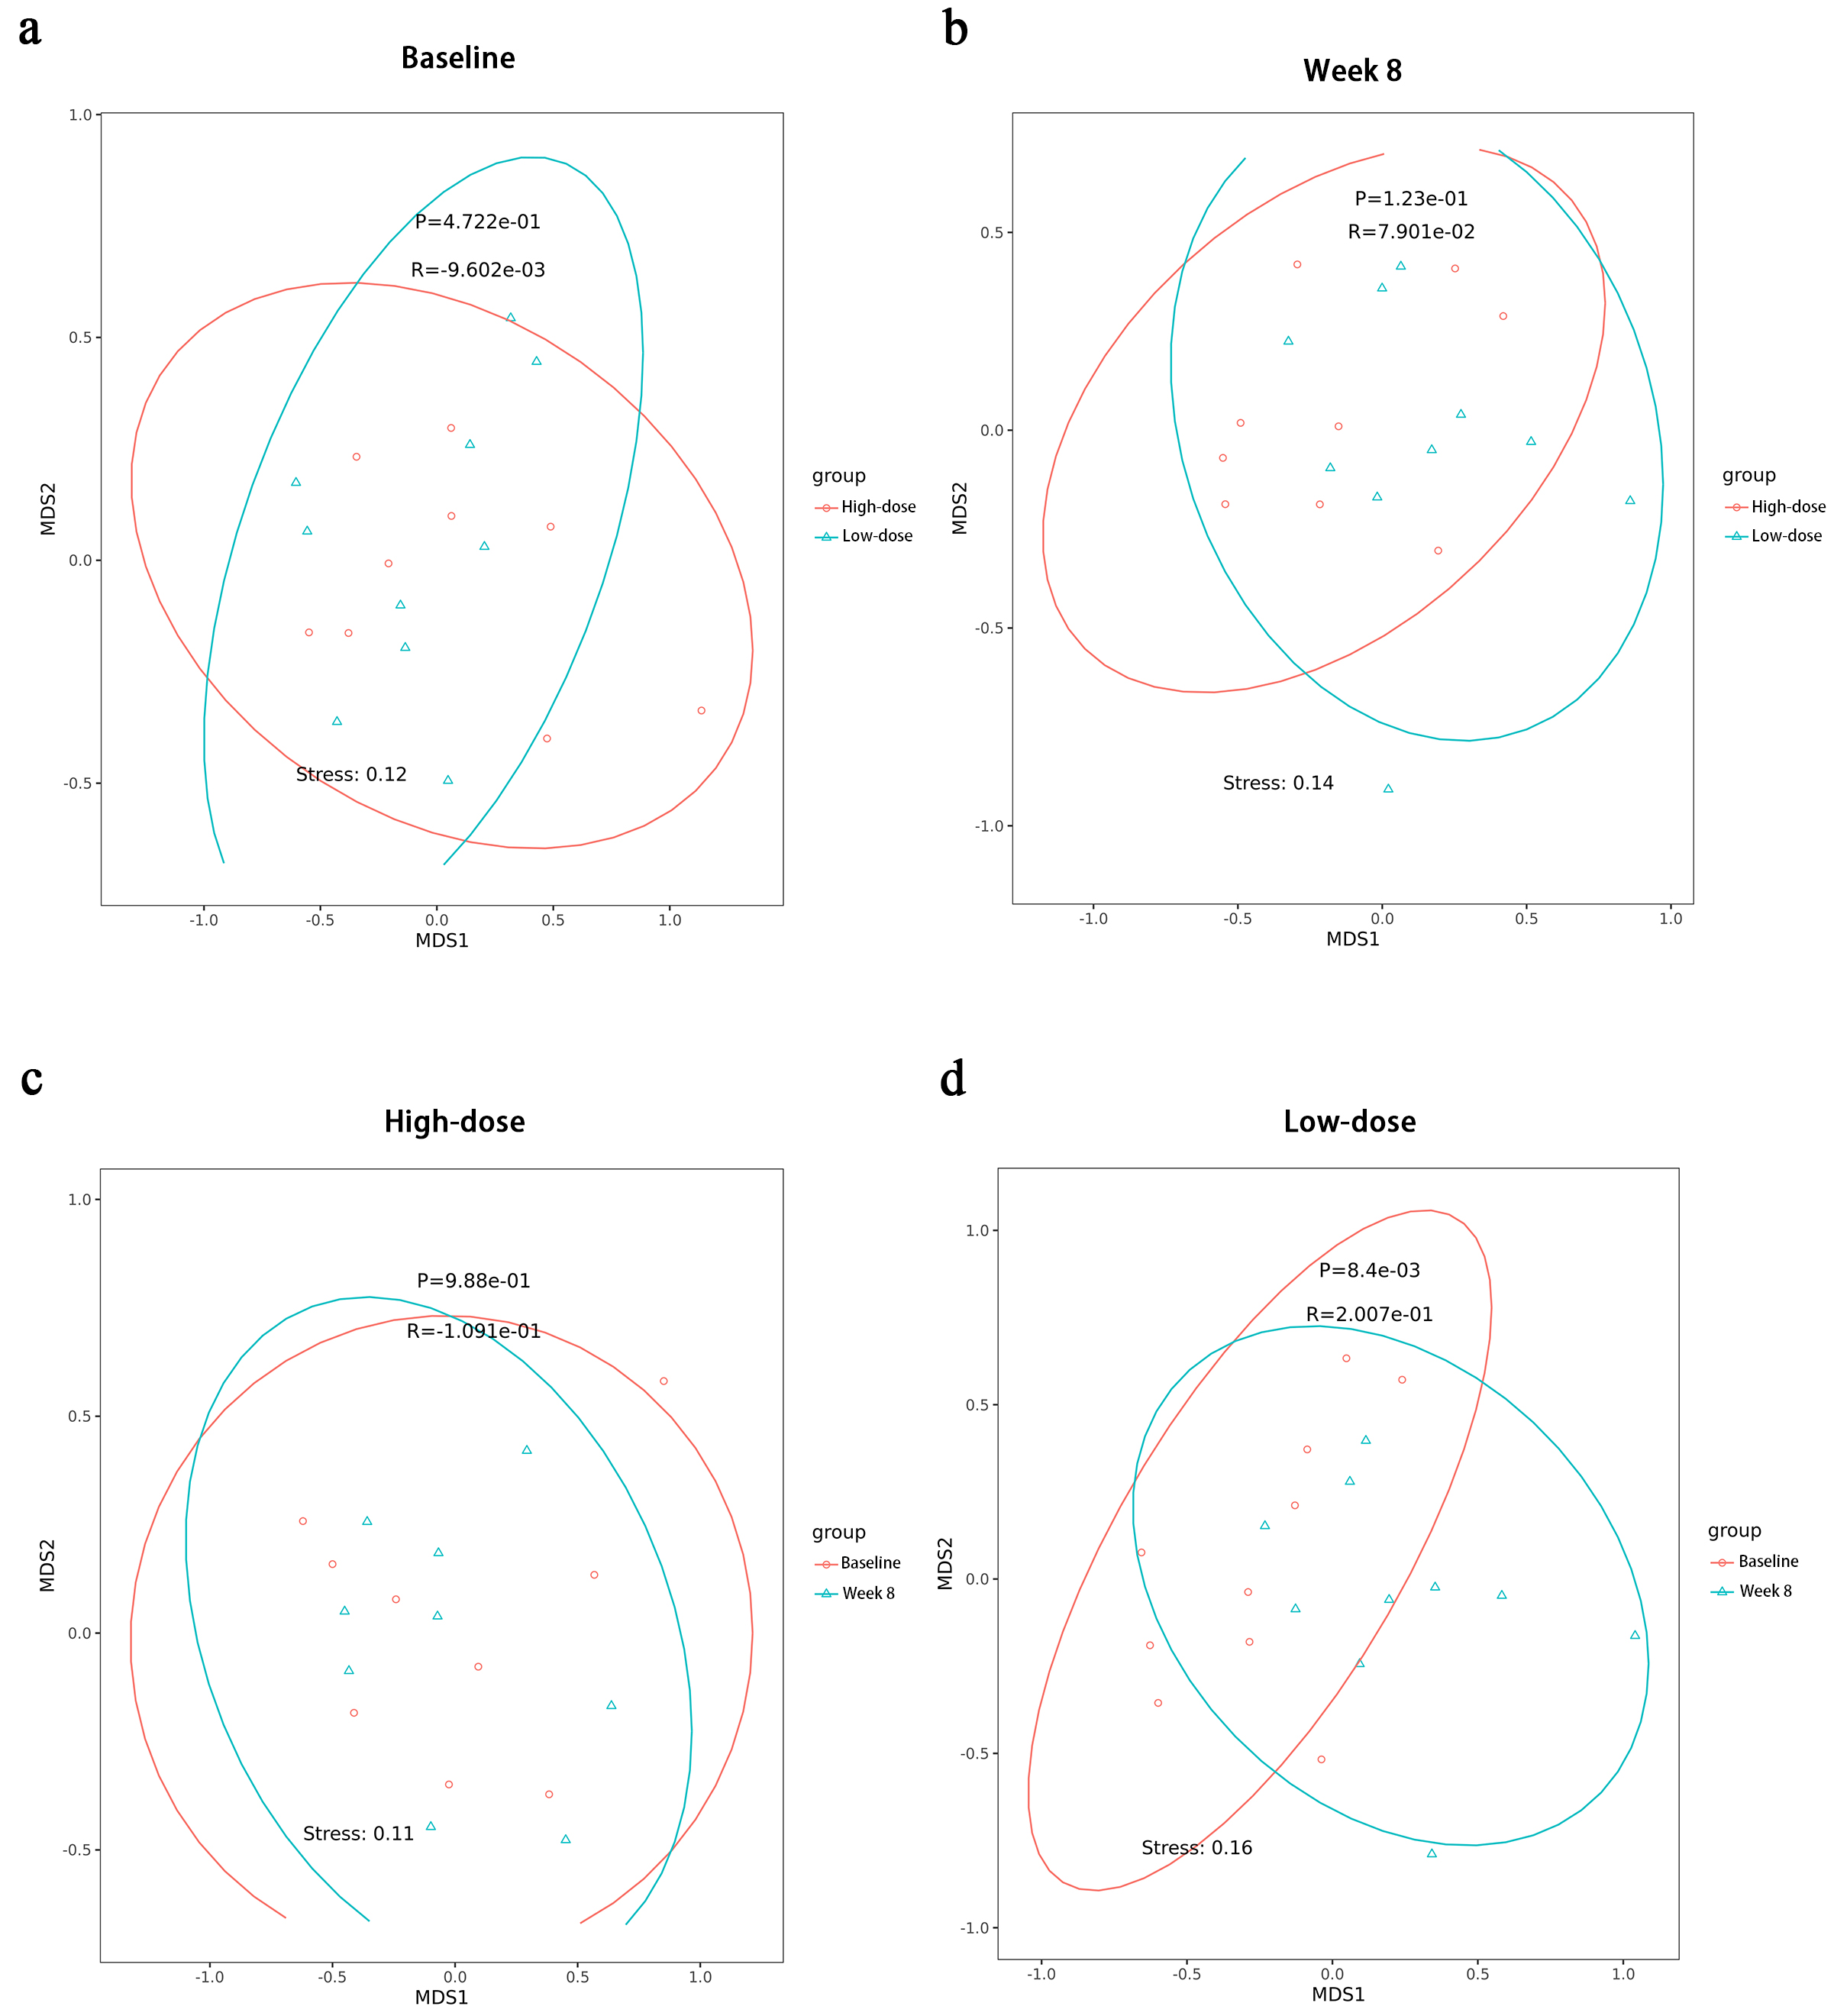 Fig. 5.
Nonmetric multidimensional scaling (NMDS) analysis at the species level. (a) NMDS changes between the high-dose and low-dose groups before the intervention. (b) NMDS changes between the high-dose and low-dose groups after the intervention. (c) NMDS changes within the high-dose group before and after the intervention. (d) NMDS changes within the low-dose group before and after the intervention.
Before the intervention, the species compositions of the high-dose and low-dose
groups were similar (p = 4.722
Within-group analysis revealed that the microbial species composition in the
high-dose group was largely unchanged after the intervention (p = 9.88
The 30 species with the greatest differences in abundance before and after dietary fibre supplementation (Fig. 6).
 Fig. 6.
Differential species analysis at the species level via the Wilcoxon test. (a) Wilcoxon test results for species differences within the high-dose group before and after the intervention. (b) Wilcoxon test results for species differences within the low-dose group before and after the intervention.
In the high-dose group, the species abundance was highly variable among the samples before the intervention. After supplementation, the abundance of bacterial species became more concentrated and tended to stabilize and increase, although these changes were not statistically significant. Notable species exhibiting this trend included Faecalibacterium prausnitzii, Lachnospira eligens. Additionally, the abundance of Escherichia coli decreased postintervention, but the change was not significant.
In the low-dose group, a similar trend towards a more concentrated and stable increase in species abundance was observed after the intervention. Significant increases were recorded for Faecalibacterium prausnitzii, Lachnospira eligens (p = 0.00, 0.01). The abundance of Escherichia coli also decreased postintervention, but this change was not statistically significant (p = 0.36).
At baseline, there were no significant differences in body weight, body fat percentage, fat mass, or lean body mass between the high-dose group and the low-dose group. After the intervention, no significant differences in these indicators were observed between the two groups overall (Table 3).
| Indicators | Unit | High-dose group | Low-dose group | T | p | ||||
| (N = 9) | (N = 10) | (between groups) | (between groups) | ||||||
| Baseline | Week 8 | Change | Baseline | Week 8 | Change | ||||
| Body weight | kg | 74.48 |
71.71 |
–2.77 |
75.50 |
73.10 |
–2.40 |
–1.112 | 0.875 |
| Body fat | % | 16.73 |
14.87 |
–1.87 |
16.19 |
14.70 |
–1.49 |
–1.422 | 0.907 |
| Fat mass | kg | 12.52 |
10.70 |
–1.82 |
12.37 |
10.85 |
–1.52 |
–1.145 | 0.528 |
| Lean body mass | kg | 61.84 |
60.97 |
–0.88 |
63.13 |
62.25 |
–0.88 |
0.007 | 0.337 |
* Indicates a significant within-group change before and after the
intervention (p
In both the high-dose and low-dose groups, body weight, body fat percentage, fat mass, and lean body mass were significantly lower after the intervention.
At baseline, testosterone, cortisol, and the testosterone/cortisol ratio were similar between the high-dose and low-dose groups (p = 0.368, 0.357, and 0.540, respectively). After the intervention, no significant differences in these indicators were observed between the two groups. In the high-dose group, testosterone and cortisol levels significantly decreased after the intervention (p = 0.040, 0.001), whereas the testosterone/cortisol ratio significantly increased (p = 0.048). In the low-dose group, only cortisol significantly decreased (p = 0.016), whereas the other indicators did not significantly change (testosterone and testosterone/cortisol ratio: p = 0.077 and 0.107, respectively) (Table 4).
| Indicators | Unit | High-dose group | Low-dose group | T | p | ||||
| (N = 9) | (N = 10) | (between groups) | (between groups) | ||||||
| Baseline | Week 8 | Change | Baseline | Week 8 | Change | ||||
| Testosterone | ng/dL | 535.82 |
414.24 |
–120.58 |
589.85 |
492.09 |
–97.76 |
–0.328 | 0.747 |
| Cortisol | µg/dL | 13.74 |
6.95 |
–6.79 |
12.23 |
7.72 |
–4.5 |
–1.089 | 0.291 |
| Testosterone/Cortisol | 40.56 |
67.24 |
26.68 |
52.84 |
75.21 |
22.37 |
0.255 | 0.802 | |
| CK | U/L | 218.44 |
226.44 |
8.00 |
263.10 |
220.50 |
–42.60 |
0.564 | 0.582 |
| RPE | 15.44 |
13.44 |
–2.00 |
15.60 |
13.40 |
–2.20 |
0.579 | 0.369 | |
* Indicates a significant within-group change before and after the
intervention (p
At baseline, CK levels were similar between the high-dose and low-dose groups (p = 0.230). After the intervention, there were no significant differences in creatine kinase levels between the two groups. Additionally, no significant changes in creatine kinase levels were observed between the high-dose and low-dose groups (p = 0.857 and 0.601, respectively).
At baseline, RPE was similar between the high-dose and low-dose groups
(p = 0.678). After the intervention, there were no significant
differences in RPE between the groups. However, in both the high-dose and
low-dose groups, RPE significantly decreased after the intervention (p
At baseline, fasting blood glucose and fasting insulin levels were similar between the high-dose and low-dose groups (p = 0.348, 0.562). After the intervention, no significant differences in these indicators were observed between the two groups. In the high-dose group, fasting blood glucose significantly decreased after the intervention (p = 0.001), whereas fasting insulin did not significantly change (p = 0.509). In the low-dose group, neither fasting blood glucose nor fasting insulin levels significantly changed (p = 0.115, 0.121) (Table 5).
| Indicators | Unit | High-dose group | Low-dose group | T | p | ||||
| (N = 9) | (N = 10) | (between groups) | (between groups) | ||||||
| Baseline | Week 8 | Change | Baseline | Week 8 | Change | ||||
| Fasting blood glucose | mmol/L | 4.55 |
3.64 |
–0.91 |
4.74 |
4.21 |
–0.53 |
–1.079 | 0.298 |
| Fasting insulin | mU/dL | 4.80 |
7.51 |
2.71 |
4.12 |
10.93 |
6.81 |
–0.733 | 0.474 |
| Total cholesterol | mmol/L | 4.48 |
4.41 |
–0.07 |
3.97 |
4.12 |
1.14 |
–0.497 | 0.626 |
| Triglycerides | mmol/L | 0.76 |
1.18 |
0.41 |
0.69 |
0.78 |
0.09 |
1.238 | 0.233 |
| HDL | mmol/L | 1.36 |
1.23 |
–0.14 |
1.21 |
1.29 |
0.07 |
–1.535 | 0.144 |
| LDL | mmol/L | 1.97 |
1.99 |
0.02 |
1.73 |
1.75 |
0.02 |
0.015 | 0.988 |
| NEFA | mmol/L | 0.45 |
0.35 |
–0.10 |
0.46 |
0.25 |
–0.21 |
1.029 | 0.323 |
* Indicates a significant within-group change before and after the
intervention (p
Similarly, at baseline, total cholesterol, triglyceride, HDL, LDL, and NEFA levels were similar between the high-dose and low-dose groups (p = 0.669, 0.288, 0.320, 0.348, 0.907, respectively). After the intervention, no significant differences in these indicators were observed between the two groups. Within the high-dose group, no significant changes were observed in total cholesterol, triglyceride, HDL, LDL, or NEFA levels after the intervention (p = 0.839, 0.072, 0.209, 0.892, 0.080, respectively). Similarly, in the low-dose group, these indicators also showed no significant changes except for cortisol (p = 0.611, 0.622, 0.455, 0.892, 0.068).
The correlations between gut microbiota at the species level and fatigue recovery/metabolic indicators after intervention are shown in Fig. 7. According to our previous results, the only biochemical index that significantly changed between the two groups after the intervention was cortisol, and the abundances of Faecalibacterium prausnitzii, Lachnospira eligens significantly changed at the species level.
 Fig. 7.
Correlation analysis for the relationships of gut microbiota
species with fatigue recovery indicators and glucose and lipid metabolism
indicators after the intervention. TG, triglyceride; CK, creatine kinase;
GLU-HK, blood glucose; INS, insulin; LDL, low-density lipoprotein; CHO, total
cholesterol; HDL, high-density lipoprotein; T, testosterone; C, cortisol; NEFA,
nonesterified fatty acid. Red indicates positive correlations, blue indicates
negative correlations, and * indicates statistical significance, *
indicates p
The changes in the abundances of Faecalibacterium prausnitzii (r = –0.266, p = 0.048), Lachnospira eligens (r = –0.318, p = 0.017) were negatively correlated with changes in cortisol levels.
The changes in athletic performance indicators before and after nutritional intervention in both groups are shown in Table 6.
| Indicators | Unit | High-dose group | Low-dose group | T | p | ||||
| (N = 9) | (N = 10) | (between groups) | (between groups) | ||||||
| Baseline | Week 8 | Change | Baseline | Week 8 | Change | ||||
| Maximum power | W | 664.60 |
691.76 |
27.16 |
663.44 |
677.90 |
14.50 |
2.873 | 0.896 |
| Average power | W | 483.44 |
513.30 |
29.76 |
493.61 |
523.95 |
30.34 |
–0.083 | 0.006# |
| VO2max | 45.56 |
54.33 |
8.78 |
44.90 |
51.80 |
6.90 |
3.407 | 0.253 | |
| 1RM squat | kg | 117.11 |
120.56 |
3.44 |
125.00 |
128.20 |
3.20 |
0.074 | 0.942 |
| Single-leg jump | cm | 277.67 |
289.00 |
11.33 |
279.00 |
294.70 |
15.7 |
–1.059 | 0.716 |
| Double-leg jump | cm | 294.00 |
298.00 |
4.00 |
295.11 |
304.22 |
8.70 |
–1.287 | 0.121 |
| Standing double-touch height | cm | 285.89 |
291.33 |
5.44 |
290.40 |
301.80 |
11.40 |
–1.267 | 0.916 |
| Triple frog jump | m | 7.47 |
7.62 |
0.13 |
7.43 |
7.72 |
0.28 |
–0.793 | 0.168 |
| Half-court triangle Run | s | 13.37 |
12.90 |
–0.48 |
13.31 |
13.05 |
–0.25 |
–1.752 | 0.392 |
| Variable-distance shuttle run | s | 32.22 |
31.39 |
–0.83 |
31.04 |
31.00 |
–0.05 |
–2.756 | 0.261 |
* Indicates a significant within-group change before and after the
intervention (p
# Indicates a significant between-group change before and after the
intervention (p
At baseline, no significant differences were observed between the high-dose and low-dose groups. Postintervention, the average power in the low-dose group was significantly greater than that in the high-dose group, whereas the other indicators were not significantly different between the two groups.
The high-dose group showed significant improvements in maximum strength, single-leg vertical jump, triple frog jump, half-court triangle run, and variable-distance shuttle run. The low-dose group demonstrated significant improvements in single-leg vertical jump, double-leg vertical jump, standing double-touch height, and half-court triangle run. Both groups presented significant increases in maximum power, average power, and relative oxygen uptake after intervention.
In the present study, we investigated the effects of 8 weeks of dietary fibre supplementation at different doses on various parameters, including gut microbiota, body composition, fatigue recovery indicators, aerobic and anaerobic capacity, maximum strength, and basketball-specific performance, in college basketball players. The results demonstrated significant improvements across these measures, with a reduction in blood glucose observed in the high-dose group, although all values remained within the healthy range. Intergroup differences in the measured parameters were generally insignificant.
Changes in the gut microbiome were assessed through species diversity and composition. After 8 weeks of dietary fibre supplementation, the low-dose group presented greater shifts in species diversity, whereas the high-dose group presented more stable and convergent changes in microbiota. In both groups, the abundance of beneficial bacteria increased, whereas that of harmful or conditionally pathogenic bacteria tended to decrease, suggesting an overall positive trend.
Postintervention, alpha diversity (as measured by the Chao1 index) increased significantly in the low-dose group, indicating an increase in species richness. However, the unchanged Shannon and Simpson indices suggest that species evenness remained stable. Beta diversity analysis revealed significant shifts in community composition in the low-dose group, whereas the high-dose group presented more stable, convergent microbial changes.
These outcomes may be influenced by the specific type and dosage of dietary
fibre. The gut microbiome has a remarkable ability to metabolize diverse fibre
types due to its extensive repertoire of carbohydrate-active enzymes; however,
microbial responses are highly individualized and depend on host-specific factors
and the microbiome composition [25]. Studies suggest that higher fibre intake
(e.g.,
At the phylum level, both groups presented an increase in Firmicutes and a decrease in Bacteroidetes, with Firmicutes linked to increased energy absorption and calorie acquisition [28]. An increased ratio of Firmicutes to Bacteroidetes (F/B) is associated with obesity in nonathletic populations, but we did not observe an increase in weight or body fat in athletes, which may indicate that athletes are different from the general population [29, 30]. Athletes undergo prolonged high-intensity training, leading to certain physiological adaptations that increase energy utilization efficiency [31].
At the species level, both groups presented increases in beneficial bacteria such as Faecalibacterium prausnitzii, Lachnospira eligens. These species are key producers of SCFAs, particularly butyrate, which support colonic health, reduce inflammation, and protect against intestinal pathogens [32, 33]. The abundance of harmful bacteria, such as Escherichia coli, decreased in both groups. Escherichia coli, a common bacterium in the human gut that is conditionally pathogenic [34] and, under certain conditions, can cause gastrointestinal or urinary infections in humans and other animals [35].
These findings underscore the usefulness of dietary fibre supplementation for creating a healthier and more stable gut microbiome, which may alleviate gastrointestinal disturbances caused by exercise and indirectly benefit athletic performance.
Both the high-dose and low-dose groups experienced significant reductions in body weight, body fat percentage, and fat mass after 8 weeks of supplementation, with smaller reductions in lean body mass than fat mass.
Epidemiological studies have consistently shown that higher dietary fibre intake is associated with lower body weight and fat mass [36]. While most studies have focused on overweight populations, this study demonstrated similar benefits in healthy athletes [37]. Moreover, combining dietary fibre supplementation with exercise may amplify reductions in body weight and fat mass, as seen in prior studies involving aerobic training and fibre intake [38]. The observed decrease in Bacteroidetes, which is positively associated with body fat percentage, may also contribute to improved body composition [39].
Additionally, because this study involved college athletes whose training intensity, lifestyle management, and dietary balance were less stringent than those of professional athletes were, it is plausible that, after eight weeks of standardized dietary planning, systematic training, and maintenance of healthy daily habits, participants experienced significant reductions in both body weight and body fat.
However, the lack of significant intergroup differences in weight and fat mass changes suggests that the relatively small dosage difference between the two groups may have limited the observed effects. Future studies should explore higher supplementation doses to better assess dose-dependent effects.
Fatigue recovery was assessed via testosterone, cortisol, the testosterone-to-cortisol ratio, creatine kinase, and RPE. Both groups showed significant decreases in cortisol and RPE after the intervention, indicating improved recovery and reduced perceived fatigue. In the high-dose group, testosterone levels decreased significantly, but the testosterone-to-cortisol ratio increased, suggesting favourable adaptation to training loads.
Correlation analysis revealed that increases in beneficial bacteria such as Faecalibacterium prausnitzii, Lachnospira eligens were negatively associated with cortisol levels. Cortisol can also reflect stress responses—such as anxiety or depression—triggered by exercise or training. Previous studies have demonstrated that increased Faecalibacterium prausnitzii abundance is correlated with reduced cortisol levels and improved stress regulation, reinforcing the link between gut health and psychological recovery [40, 41]. Additionally, the abundance of Lachnospira eligens was found to be correlated with changes in cortisol levels [42] and may affect human sleep [43]. These bacteria are known to produce SCFAs, which have anti-inflammatory properties and may reduce stress-induced inflammatory responses [44].
These findings highlight the role of dietary fibre in promoting both physical and psychological recovery, contributing to players’ overall training adaptation and performance.
Over an 8-week period of dietary fibre supplementation at various doses, only the high-dose group exhibited a significant decrease in fasting blood glucose levels, all of which remained within the normal range. Indicators related to lipid metabolism showed no significant changes. Although lipid metabolism markers remained stable in this study, animal studies suggest that Faecalibacterium prausnitzii may improve lipid profiles, potentially benefiting athletes with high energy demands [45].
Dietary fibre improves glucose metabolism through SCFA production during fermentation, which stimulates the release of glucagon-like peptide-1 (GLP-1), promoting insulin secretion and glucose regulation [46, 47, 48]. Additionally, viscous fibres can delay gastric emptying and reduce glucose absorption in the small intestine [49, 50]. These processes ultimately contribute to improved blood glucose levels.
Furthermore, SCFAs produced from fibre fermentation can influence hepatic lipid
metabolism through GPR41 and GPR43 [51]. SCFAs activate the key fatty acid
receptor peroxisome proliferator-activated receptor gamma (PPAR-
Because the participants were healthy with normal baseline glucose and lipid levels, the observed changes were limited. Future studies may focus on athletes with metabolic abnormalities to better evaluate the effects of dietary fibre on glucolipid metabolism.
Both groups demonstrated significant improvements in aerobic capacity, anaerobic capacity, lower-limb strength, and basketball-specific performance metrics, including vertical jumps, triple frog jumps, and sprint times. These improvements are likely attributable to the combination of training and dietary fibre supplementation.
In a study by Sugiyama et al. [55], university athletes consumed 6 g of supplemental dietary fibre daily for four weeks and performed more sit-up and side jump repetitions after extreme fatigue. The authors hypothesized that the athletes’ habitual fibre intake was insufficient and that supplementation improved their gut microbiome, thereby enhancing physical performance. The role of dietary fibre in enhancing performance may involve SCFA-mediated improvements in skeletal muscle metabolism and energy utilization [56]. SCFAs, particularly butyrate, enhance mitochondrial function and reduce exercise-induced inflammation, thereby improving endurance and recovery.
Furthermore, the reductions in body weight and fat mass observed in this study may have improved explosive power and sprint efficiency, contributing to better basketball-specific performance [57, 58]. Maximum lower-limb strength also contributes to enhanced vertical jump performance [59]. However, Hadžić et al. [57] conducted a study with adolescent basketball players and reported that supplementation with 6 grams of soluble dietary fibre over four weeks did not result in reduced body weight or fat and had a minimal impact on explosive lower-limb performance.
Although dietary fibre supplementation alone may not directly improve performance, the optimization of the gut microbiome, improved body composition, faster fatigue recovery, and stabilized metabolism observed in this study indirectly benefit athletic performance.
Currently, there are no dietary fibre supplements specifically tailored for athletes. As dietary fibre is an indigestible nutrient, large-scale supplementation over a short period is likely to cause gastrointestinal symptoms, which can adversely affect athletes’ training and competitive performance. Consequently, in the present study, we used relatively small supplementation doses to evaluate the feasibility and tolerability of fibre intake in athletes. The low-dose group consumed approximately 3.24 g/day of fibre, while the high-dose group consumed 6.84 g/day. This limited difference was intentional, as our primary aim was to introduce fibre supplementation gradually and in a manner that would not disrupt athletes’ daily routines or cause significant gastrointestinal discomfort. However, this approach may have limited our ability to detect substantial differences in gut microbiota composition and performance outcomes between the groups.
In this experiment, we aimed to observe the effects of additional dietary fibre supplementation while maintaining athletes’ daily routines as much as possible. Despite this, neither group of athletes reached the recommended intake levels, which is an important consideration for future research. Additionally, the insufficient adaptation period for dietary management may have influenced the results, as both dietary restriction and fibre supplementation were introduced simultaneously without allowing adequate time for physiological adaptation. Future studies should prioritize implementing a prolonged adaptation phase (e.g., 2–4 weeks) for dietary modifications prior to initiating fibre interventions, thereby allowing clearer differentiation between the effects of dietary restriction and fibre supplementation. This limitation complicates our ability to attribute observed changes solely to fibre supplementation.
The primary aim of this exploratory trial was to evaluate potential
between-group differences in body composition changes following high- versus
low-dose interventions. While no statistically significant differences were
detected, this finding must be interpreted in light of the study’s limited
statistical power. A post hoc power analysis revealed a power of less than 80%,
indicating a high probability of type II error. This is related to the small
sample size (n = 19), which was insufficient to reliably detect anything less
than very large between-group effects. To achieve 80% power for detecting large
effects (d = 0.7), a minimum of 34 participants per group would be needed
(
On the basis of current evidence, it can be assumed that dietary fibre supplementation has potential benefits for improving gut microbiome composition, body composition, fatigue recovery, and athletic performance in college basketball players. However, these effects require further investigation and confirmation, and the optimal dosage regimens remain to be determined.
All the data points generated or analysed during this study are included in this article, and no other data are necessary to reproduce the results.
QW, DL, YZha and MX designed the research study. DL, YZuo and YZha performed the experiments and collected the data. MX, YZha and YZuo analyzed and interpreted the data. YZha and MX drafted the initial manuscript. QW and DL provided critical intellectual input and supervised the research. All authors contributed to manuscript revision and editing. QW and DL provided funding acquisition and resources. All authors read and approved the final manuscript. All authors have participated sufficiently in the work and agreed to be accountable for all aspects of the work.
The research protocol was approved by the Ethics Committee of the National Institute of Sports Medicine (Ethics Approval Number: 202112), and all of the participants provided signed informed consent.
We gratefully acknowledge the assistance and instructions from the National Testing & Research Center for Sports Nutrition and Hubei University of Technology.
This research was funded by the National Key R&D Program of China, grant number 2019YFF0301702, and the Doctoral Research Fund, grant number XJ2022000601.
The authors declare no conflict of interest.
Supplementary material associated with this article can be found, in the online version, at https://doi.org/10.31083/IJVNR37069.
See Appendix A.
The training schedule was as follows:
Warm-up (10 minutes): Basic stretching, flexibility exercises, joint mobility, and light jogging.
Fundamental training (30 minutes): Ball handling, passing, shooting (stationary and in motion), and transition offense and defence.
Specialized training (40 minutes): Baseline running drills, contact training, sport-specific skill development, and group scrimmages.
Cool-down (10 minutes): active stretching for relaxation and assisted massage/stretching.
Twice a week, strength and conditioning sessions were conducted, replacing group scrimmages with 20-minute sessions focusing on squats, burpees, core stability training, and high-intensity interval training (HIIT).
The goal was to increase basketball players’ lower-limb strength, explosive power, and core stability.
References
Publisher’s Note: IMR Press stays neutral with regard to jurisdictional claims in published maps and institutional affiliations.