


 , Bariş Timur 2, Kandemir Baş 3, Naci Cem Aydogdu 1, Fatih Yiğit 4, Zehra Kursunlu 1, Esat Gokhan Kiral 1, Cevdet Ugur Kocogullari 1
1 Department of Cardiovascular Surgery, University of Health Sciences, Dr. Siyami Ersek Thoracic and Cardiovascular Surgery Education and Research Hospital, 34668 Istanbul, Turkey
2 Department of Cardiovascular Surgery, University of Health Sciences, Mehmet Akif Ersoy Thoracic and Cardiovascular Surgery Education and Research Hospital, 34303 Istanbul, Turkey
3 Department of Cardiovascular Surgery, Muğla Sıtkı Koçman University Training and Research Hospital, 48000 Muğla, Turkey
4 Department of Cardiovascular Surgery, University of Health Sciences, Kosuyolu High Specialization Education and Research Hospital, 34865 Istanbul, Turkey
Abstract
This study aimed to evaluate and compare the prognostic value of preoperative serum uric acid (UA) levels and the uric acid-to-albumin ratio (UAR) in predicting three-year mortality following isolated coronary artery bypass grafting (CABG).
We screened a total of 480 patients retrospectively, and analysed 184 patients who underwent isolated CABG between January 2021 and January 2023. Preoperative laboratory data, including UA and albumin levels, were recorded, and UAR was calculated.
The primary endpoint was all-cause mortality during a three-year follow-up period. Reciever operating characteristic (ROC) curve analysis and multivariable logistic regression were employed to identify independent predictors of mortality. The mean age of the participants was 60.0 ± 9.2 years. ROC curve analysis demonstrated significant predictive ability for both UAR (AUC: 0.767, p = 0.001) and UA (AUC: 0.768, p = 0.001) regarding 3-year mortality. The optimal cut-off value for UAR was 1.6233 (84.6% sensitivity, 56.7% specificity). In multivariable logistic regression models, UAR (OR: 6.701, p = 0.017) and UA (OR: 1.745, p = 0.011) were both identified as independent predictors of mortality, along with age. Although the UA-based model provided slightly better overall calibration (Hosmer-Lemeshow p = 0.109 vs 0.094) and marginally higher explanatory power (Nagelkerke R2: 0.405 vs 0.396).
Both preoperative UA and UAR were identified as independent predictors of long-term mortality after isolated CABG and demonstrated significant prognostic utility for three-year survival assessme.
Keywords
- CABG
- uric acid
- albumin
- uric acid-to-albumin ratio
- mortality
- prognosis
Elevated levels of UA represent a considerable risk factor for cardiovascular disease (CVD), including hypertension (HT), atrial fibrillation (AF), chronic kidney disease (CKD), heart failure (HF), coronary artery disease (CAD), and CVD mortality. Hyperuricaemia may be caused by purine and/or fructose-rich diets, genetic and environmental factors, as well as increased hepatic production, or accelerated cellular turnover. Impaired renal or extra-renal excretion of uric acid is associated with its deposition in soft tissues, joints, the kidneys, and other organs [1,2,3].
Uric acid is produced by xanthine oxidoreductase (XOR), the principal enzyme catalysing the sequential oxidation of hypoxanthine to xanthine and subsequently to uric acid. During purine metabolism, XOR also produces reactive oxygen species (ROS) leading to inflammation and endothelial injury, as does intracellular uric acid [4].
Serum albumin, a plasma protein involved in the regulation of plasma oncotic pressure, is an inflammatory marker, and is a major transporter of blood compounds [5], the normal range of which is is 3–5 g/dL [6]. Studies reported that hypoalbuminemia after cardiac surgery was linked to enhanced rates of mortality and morbidity [5,6]. Albumin, found in human extracellular fluid, is both an anti-inflammatory as well as antioxidant agent and can inhibit platelet aggregation and activation to have an impact on plasma viscosity [2]. Patients undergoing cardiac surgery who had hypoalbuminemia (<3.0 g/dL, equivalent to <30 g/L) were reported to be at greater risk for 30-day all-cause mortality [2], with studies suggesting that low serum albumin predicts an increased risk of atrial fibrillation and acute kidney injury (AKI) [7].
The uric acid-to-albumin ratio (UAR) is a new and potent composite biomarker that combines the anti-inflammatory, antioxidant, and anti-aggregant properties of albumin with the pro-inflammatory and oxidative stress-related characteristics of uric acid [8]. When these two different metabolic markers are combined, UAR offers a more thorough evaluation of nutritional status and systemic inflammation, frequently showing better predictive value than either test alone in a variety of cardiovascular diseases [9].
Several clinical and biochemical markers have prognostic value following coronary artery bypass grafting (CABG) [10]. The present study sought to compare serum uric acid levels and the UAR in predicting three-year postoperative survival among individuals undergoing isolated CABG.
This retrospective, single-centre observational study analysed 480 patients who had undergone isolated CABG between January 2021 and January 2023, of whom 184 patients meeting the inclusion criteria were enrolled. Those who had concomitant procedures such as valvular or thoracic aortic surgery, emergency surgery due to haemodynamic instability, mechanical circulatory support device implantation, severely impaired cardiac function (ejection fraction (EF) <30%), preoperative CKD, or missing clinical or laboratory data (n = 194) were excluded. Only elective or urgent cases were included; emergency procedures due to haemodynamic instability were excluded. The institutional ethics committee approved the study, and all participants gave their written informed consent. Data were obtained from hospital electronic medical records and patient files. The primary endpoint was 3-year all-cause mortality following isolated CABG. Follow-up was completed for all 184 patients (100%), with none lost to follow-up. Survival status was obtained from the national electronic health record system and the institutional hospital information system. During the study period, 13 patients (7.1%) died within three years of surgery (shown in detail in Fig. 1).
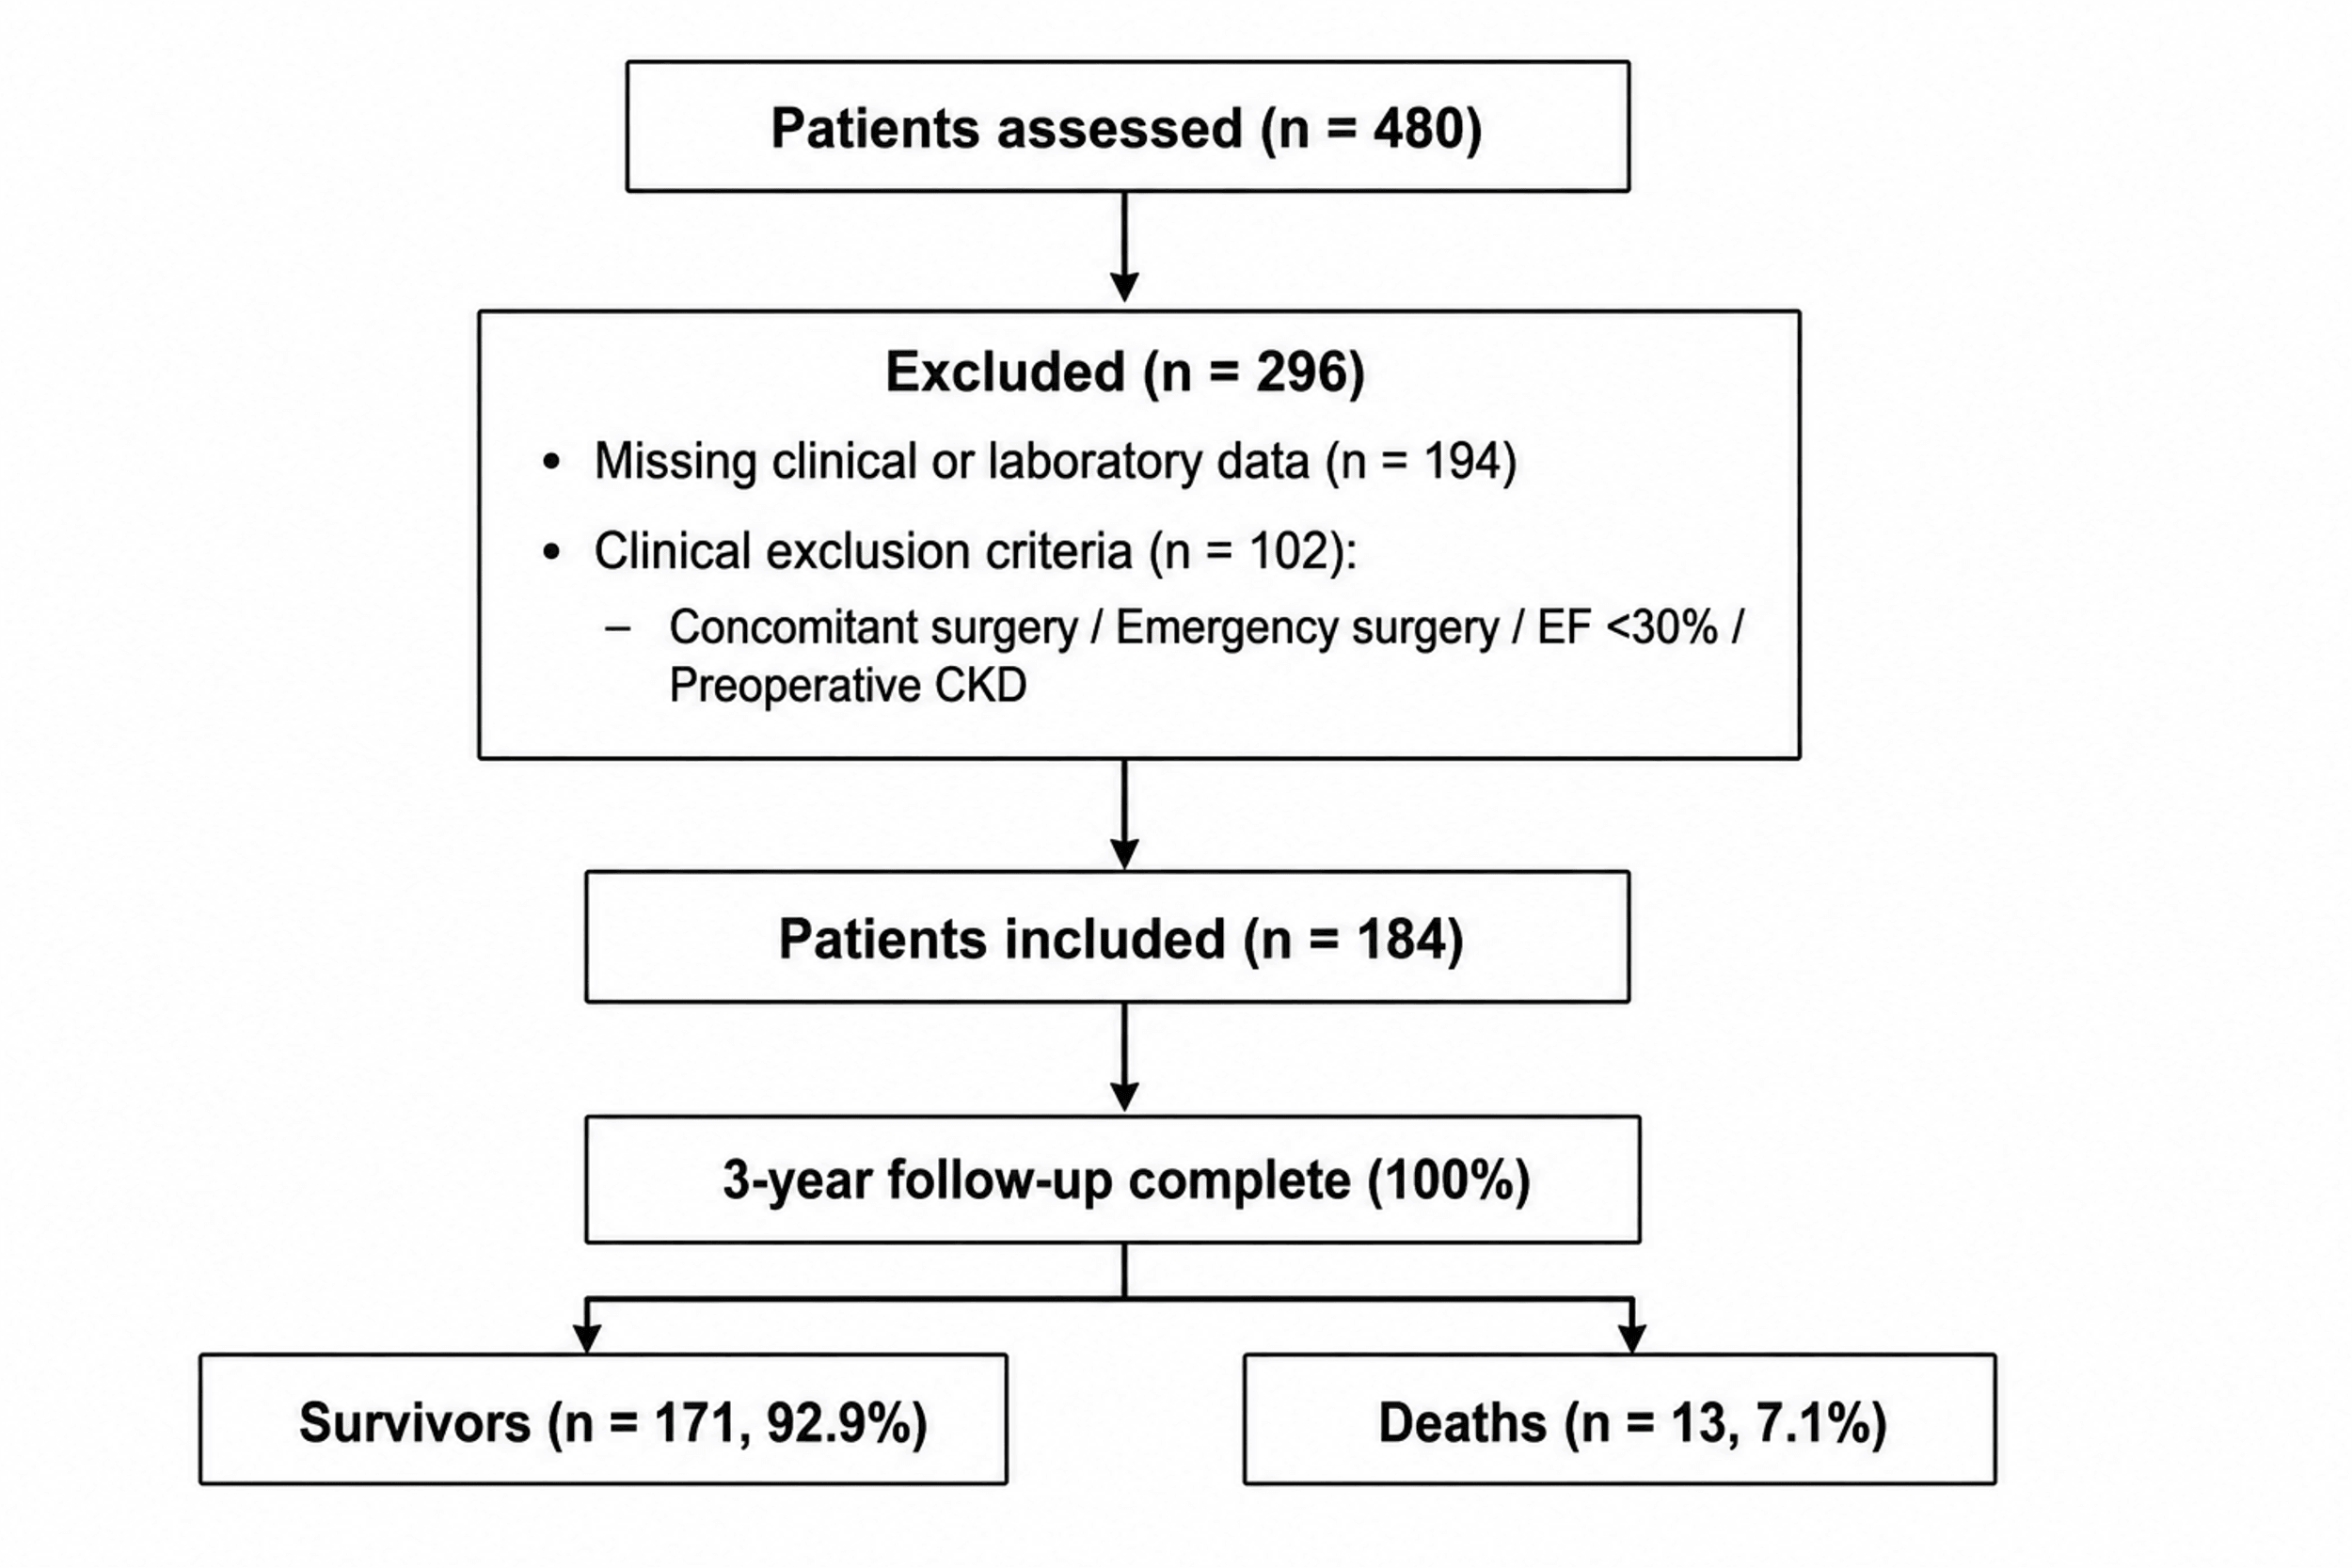 Fig. 1.
Study population. EF, ejection fraction; CKD, chronic kidney disease.
Demographic characteristics (age, sex, body mass index), comorbidities (HT, diabetes mellitus (DM), chronic obstructive pulmonary disease (COPD), extracardiac arteriopathy), preoperative echocardiographic parameters—including left ventricular ejection fraction (EF %) and right ventricular dysfunction (RVD)—and operative risk scores (European System for Cardiac Operative Risk Evaluation II [EuroSCORE II]) were recorded.
All laboratory tests were obtained within 24 to 48 hours prior to surgery. Preoperative laboratory parameters included blood urea nitrogen (BUN), haemoglobin (Hb), mean corpuscular volume (MCV), red cell distribution width (RDW), lymphocyte count, neutrophil count, platelet count (PLT), white blood cell count (WBC), C-reactive protein (CRP), total protein, albumin, total bilirubin, and serum uric acid levels.
Preoperative serum albumin concentrations were determined using the bromocresol green dye-binding technique. Serum albumin levels were expressed in g/dL. Perioperative albumin infusion was not routinely administered. The UAR was calculated by dividing serum uric acid (mg/dL) by serum albumin (g/dL). Patients were subsequently stratified into high and low UAR groups based on the optimal cut-off value derived from receiver operating characteristic (ROC) curve analysis.
Missing data were mainly related to certain intraoperative perfusion parameters and selected postoperative laboratory measurements. Importantly, the primary variables used for the main analyses (uric acid, albumin, UAR, and mortality outcomes) were completed for all included patients.
All procedures were performed on-pump using conventional cardiopulmonary bypass; no off-pump cases were included. Conventional cardiopulmonary bypass (CPB) was performed via a median sternotomy under moderate systemic hypothermia (30–34 °C). CPB flow was maintained at 2.2–2.5 L/min/m2 with a mean perfusion pressure of 50–80 mmHg and a target haematocrit of 20–25%. Myocardial protection was achieved using intermittent antegrade delivery of hypothermic and hyperkalemic blood cardioplegia.
All statistical analyses were performed using EZR (version 1.68; Saitama Medical Center, Jichi Medical University, Saitama, Japan), a graphical user interface for R (R Foundation for Statistical Computing, Vienna, Austria), and RStudio (version 4.2.2; Posit Software, PBC, Boston, MA, USA). Categorical variables were expressed as frequencies and percentages, and continuous variables as mean ± standard deviation or median with interquartile range (25th–75th percentile), depending on the distribution. Normality of continuous data was assessed through visual inspection of histograms, Kolmogorov–Smirnov and Shapiro–Wilk tests, and skewness statistics. Group comparisons were carried out using the Pearson Chi-square or Fisher’s exact test for categorical variables, the Student’s t-test for normally distributed continuous variables, and the Mann–Whitney U test for non-normally distributed data. Prognostic accuracy of numerical predictors for 3-year mortality was evaluated using ROC curve analysis, with area under the curve (AUC) values and 95% confidence interval (CI) reported, along with optimal cut-off points determined by Youden’s J statistic and corresponding sensitivity and specificity. To identify independent predictors of mortality, binary logistic regression was employed; variables with statistical significance in univariate analyses were entered into the multivariate model. Model calibration was tested with the Hosmer–Lemeshow goodness-of-fit test, explanatory power was summarized with Nagelkerke’s pseudo R2, and discrimination was quantified using the AUC of the final model. Continuous variables included in the logistic regression models were assessed for linearity in the logit using graphical inspection. No substantial deviations from linearity were observed. Because the primary variables included in the regression models had no missing values, analyses were performed using a complete-case approach and no imputation procedures were applied. Statistical significance was defined as two-tailed p < 0.05. Analyses were conducted in R using the tidyverse (version 2.0.0), pROC (version 1.18.4), ResourceSelection (version 0.3-6), and DescTools (version 0.99.60) packages. All packages were accessed through the Comprehensive R Archive Network (CRAN; https://cran.r-project.org/).
The participants (n = 184) had a mean age of 60.0 ± 9.2 years, and 22 (12.0%) were females with a median body mass index (BMI) of 26.9 (Interquartile Range [IQR]: 25.0–30.3) kg/m2. Comorbidities included HT (n = 93, 50.5%), DM (n = 89, 48.0%), extracardiac arteriopathy (n = 35, 19.0%), and COPD (n = 30, 16.0%). The median EuroSCORE II was 1.41 (IQR: 0.88–2.52), with a median EF of 55.0% (IQR: 45.0–60.0). The baseline characteristics are presented in Table 1.
| Variable | Mean ± SD, n (%), median (IQR) |
|---|---|
| Age (years) | 60 ± 9.24 |
| Gender (female) | 22 (12) |
| Body mass index (BMI, kg/m2) | 26.9 (25.04–30.27) |
| EuroSCORE II | 1.41 (0.88–2.52) |
| Hypertension (HT) | 93 (50.5) |
| Diabetes mellitus (DM) | 89 (48) |
| Extracardiac arteriopathy (ECA) | 35 (19) |
| Chronic obstructive pulmonary disease (COPD) | 30 (16) |
| Ejection fraction (EF, %) | 55 (45–60) |
| Right ventricular dysfunction (RVD) | 3 (2) |
Values are presented as n (%), mean ± SD, or median (IQR) as appropriate. Percentages were calculated within groups. EuroSCORE II, European System for Cardiac Operative Risk Evaluation II; IQR, Interquartile range.
Preoperative laboratory evaluation revealed a median BUN of 17.0 (IQR: 14.0–20.0) mg/dL and mean Hb of 13.7 ± 1.5 g/dL. The mean lymphocyte count was 2.22 ± 0.86 × 10⁹/L, and the median PLT was 219.0 (IQR: 191.5–261.5) × 103/μL. The median preoperative uric acid level was 6.20 (IQR: 4.95–7.25) mg/dL, with 85 patients (46.2%) being assigned to the high UAR group. The laboratory parameters are shown in Table 2.
| Variable | n (%)/Mean ± SD/Median (IQR) |
|---|---|
| Preoperative BUN (mg/dL) | 17 (14–20) |
| Preoperative hemoglobin (Hb, g/dL) | 13.66 ± 1.52 |
| Preoperative MCV (fL) | 89.1 ± 5.3 |
| Preoperative RDW (%) | 15.50 (14.80–16.40) |
| Preoperative lymphocytes (×109/L) | 2.22 ± 0.86 |
| Preoperative neutrophils (×109/L) | 4.80 (4.09–5.94) |
| Preoperative platelets (PLT, ×103/μL) | 219 (191–261) |
| Preoperative white blood cells (WBC, ×103/μL) | 7.91 (6.91–9.57) |
| Preoperative C-reactive protein (CRP, mg/L) | 0.70 (0.30–1.80) |
| Preoperative uric acid (mg/dL) | 6.20 (4.95–7.25) |
| Total protein (g/dL) | 6.68 (6.40–7.10) |
| Total albumin (g/dL) | 3.90 (3.70–4.10) |
| Total bilirubin (mg/dL) | 0.70 (0.50–0.96) |
| UAR category | 85 (46.2) |
Values are presented as n (%), mean ± SD, or median (IQR) as appropriate. Percentages were calculated within groups. IQR, Interquartile Range (25th–75th percentile); UAR, Uric acid-to-Albumin Ratio; BUN, blood urea nitrogen; MCV, mean corpuscular volume; RDW, red cell distribution width.
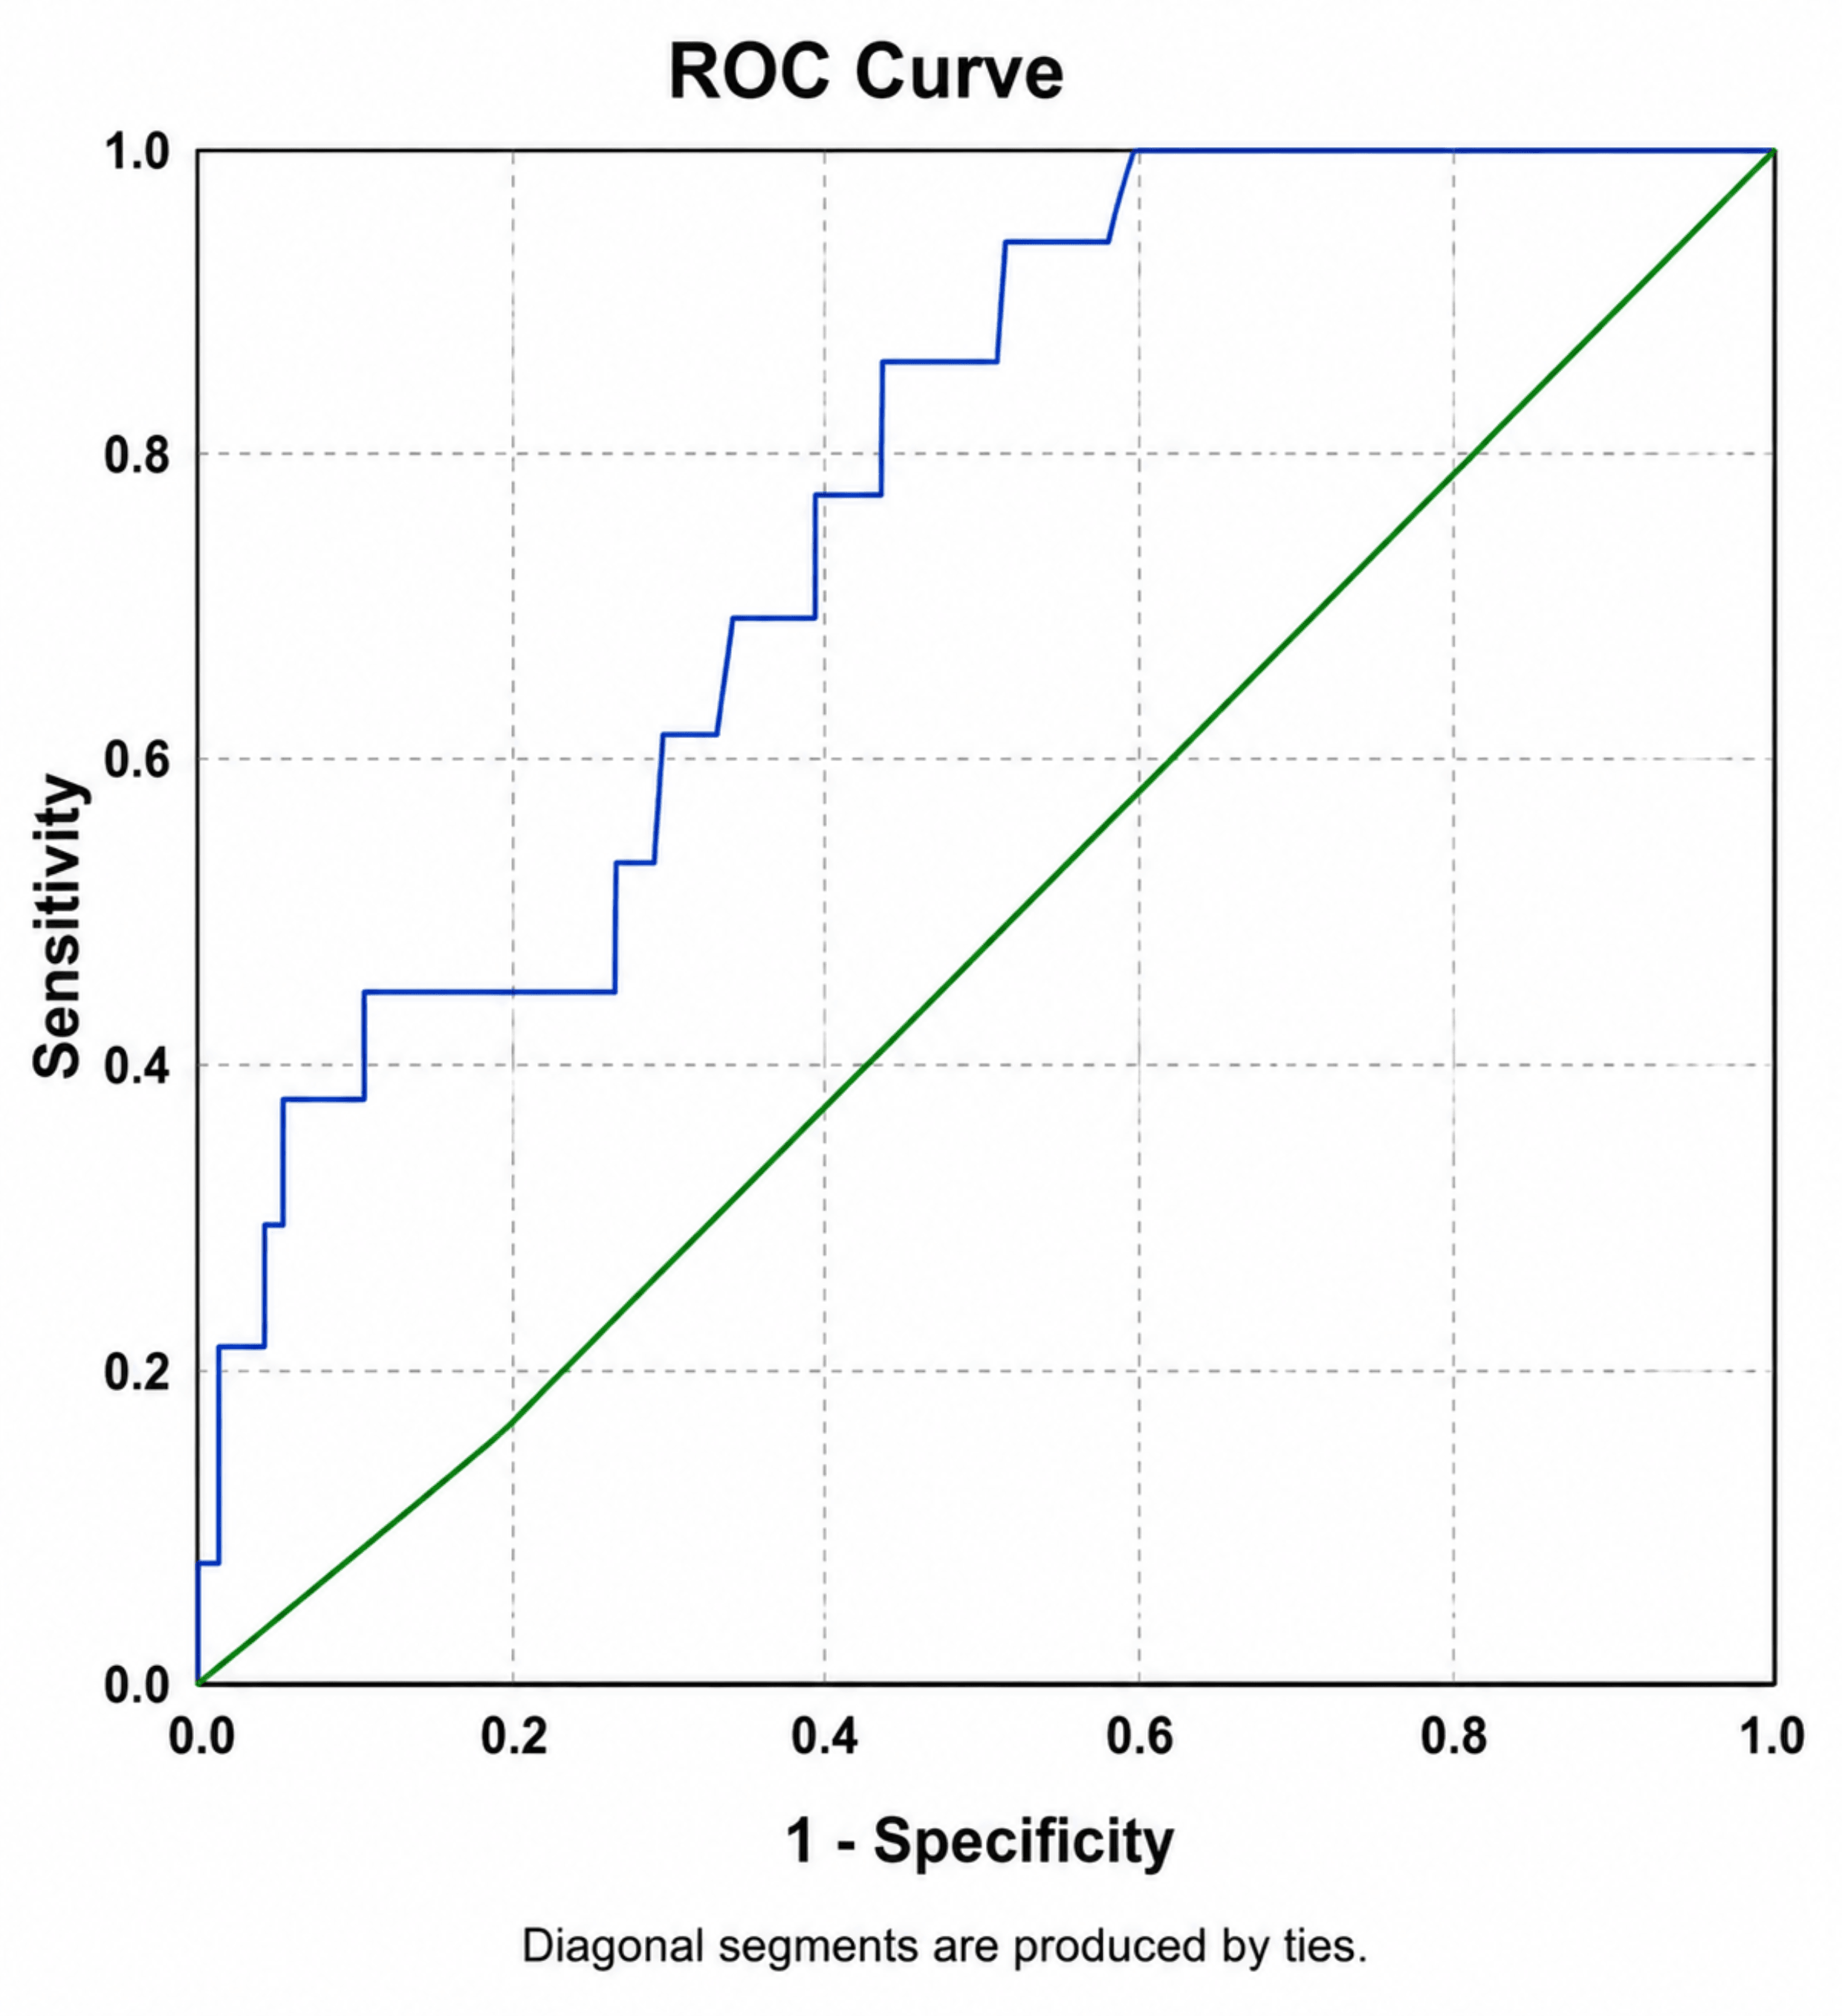
ROC curve analysis demonstrated significant discriminative ability for both the uric UAR and preoperative uric acid in predicting 3-year mortality (Fig. 2). The UAR showed an AUC of 0.767 (95% CI: 0.650–0.883, p = 0.001), with an optimal cut-off value of 1.6233, corresponding to a sensitivity of 84.6% and specificity of 56.7%. At this threshold, the positive predictive value (PPV) was 12.9%, and the negative predictive value (NPV) was 98.0%.
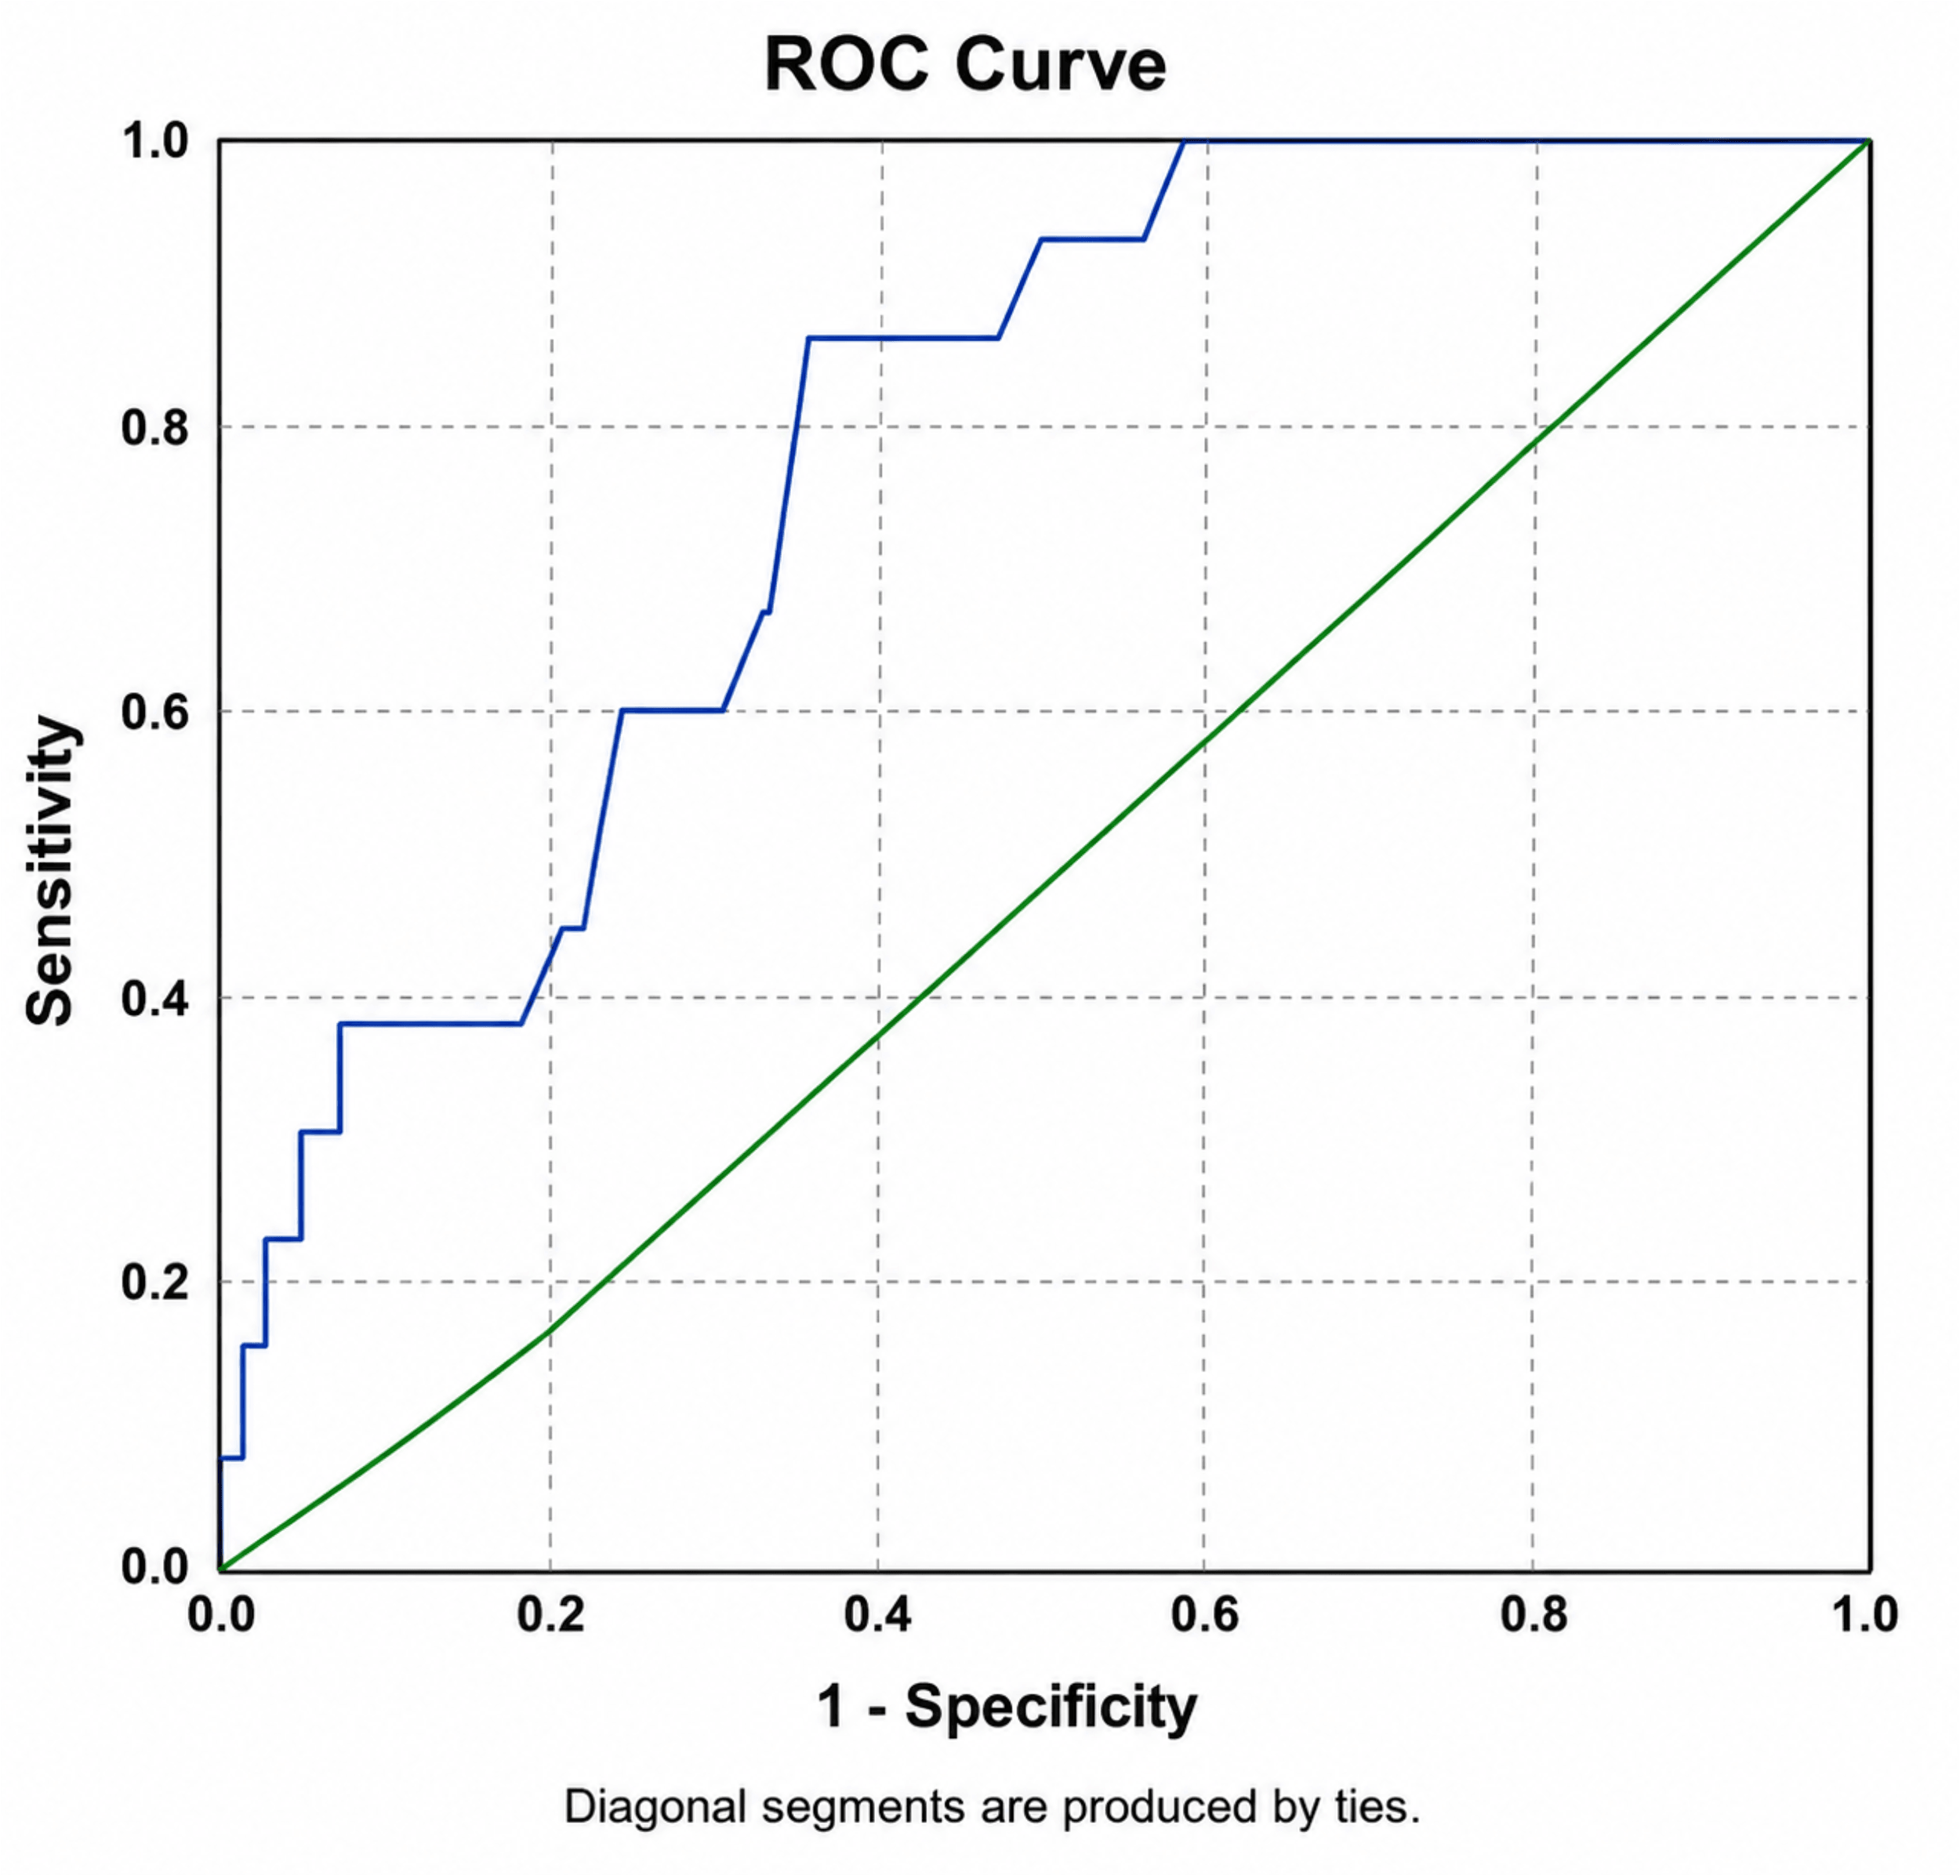 Fig. 2.
Receiver operating characteristic (ROC) curve for uric acid/albumin ratio. ROC curve for the uric acid-to-albumin ratio predicting 3-year mortality. The area under the curve (AUC) was 0.767 (95% confidence interval [CI]: 0.650–0.883, p = 0.001). The optimal cut-off value was 1.623, yielding 84.6% sensitivity and 56.7% specificity.
Preoperative uric acid demonstrated an AUC of 0.768 (95% CI: 0.661–0.875, p = 0.001) with an optimal cut-off value of 6.45 mg/dL, corresponding to a sensitivity of 84.6% and specificity of 63.7% (Fig. 3). At this cut-off, the PPV was 15.1% and the NPV was 98.2%.
 Fig. 3.
ROC curve for preoperative uric acid. ROC curve for preoperative uric acid predicting 3-year mortality. The AUC was 0.768 (95% CI: 0.661–0.875, p = 0.001). The optimal cut-off value was 6.45 mg/dL, yielding 84.6% sensitivity and 63.7% specificity.
To directly compare the discriminative ability of the two biomarkers, a DeLong test for correlated ROC curves was performed. The analysis demonstrated no statistically significant difference between the ROC curves of uric acid and the uric acid-to-albumin ratio (DeLong p > 0.05), indicating comparable discrimination performance for predicting 3-year mortality.
There were significant differences in several parameters (Table 3) in the survivors and non-survivors at three years. Non-survivors had advanced ages (65.2 ± 11.4 vs 59.7 ± 9.0 years, p = 0.036) and higher EuroSCORE II values (3.56 [IQR: 2.87–4.55] vs 1.33 [IQR: 0.88–2.36], p < 0.001) as well as a higher prevalence of COPD (38.0% vs 15.0%, p = 0.041) and lower EF (40.0% [IQR: 35.0–50.0] vs 55.0% [IQR: 45.0–60.0] %, p = 0.006).
| Variables | Category | Alive (-) | Exitus (+) | p-value |
|---|---|---|---|---|
| Mean ± SD, n (%), Median (IQR) | Mean ± SD, n (%), Median (IQR) | |||
| Age (years) | 59.67 ± 8.97 | 65.23 ± 11.44 | 0.036** | |
| Gender | Female | 19 (11) | 3 (23) | 0.191 |
| BMI (kg/m2) | 27.34 (25.15–30.43) | 25.83 (23.66–30.12) | 0.208 | |
| EuroSCORE II | 1.33 (0.88–2.36) | 3.56 (2.87–4.55) | <0.001 ɤ | |
| Diabetes mellitus (DM) | 81 (47) | 8 (62) | 0.324 | |
| Hypertension | 87 (51) | 6 (46) | 0.743 | |
| Carotid artery stenosis | 33 (19) | 2 (15) | 1.000** | |
| COPD | 25 (15) | 5 (38) | 0.041** | |
| Ejection fraction (EF) (%) | 55.00 (45.00–60.00) | 40.00 (35.00–50.00) | 0.006 ɤ | |
| Preoperative BUN (mg/dL) | 16.00 (14.00–20.00) | 25.00 (19.00–28.00) | 0.001 ɤ | |
| Preoperative Hb (g/dL) | 13.74 ± 1.47 | 12.58 ± 1.84 | 0.007** | |
| Preoperative MCV (fL) | 89.00 (86.00–92.60) | 88.10 (87.70–90.20) | 0.938 | |
| Preoperative RDW (%) | 15.50 (14.70–16.30) | 16.20 (15.30–17.10) | 0.048 ɤ | |
| Preoperative lymphocytes (×109/L) | 2.16 (1.70–2.78) | 1.85 (1.63–2.14) | 0.281 | |
| Preoperative neutrophils (×109/L) | 4.80 (4.12–5.90) | 4.56 (3.94–6.13) | 0.810 | |
| Preoperative platelets (×103/µL) | 219,000 (192,000–261,000) | 214,000 (181,000–287,000) | 0.927 | |
| Preoperative WBC (×103/µL) | 7.95 (6.98–9.56) | 6.72 (6.35–9.78) | 0.496 | |
| Preoperative CRP (mg/L) | 0.70 (0.30–1.80) | 1.00 (0.60–1.50) | 0.279 | |
| Preoperative uric acid (mg/dL) | 6.10 (4.80–7.10) | 7.20 (6.50–9.10) | 0.001ɤ | |
| Total protein (g/dL) | 6.68 (6.40–7.07) | 6.74 (6.20–7.26) | 0.930 | |
| Total albumin (g/dL) | 3.90 (3.70–4.10) | 3.90 (3.70–4.00) | 0.556 | |
| Total bilirubin (mg/dL) | 0.70 (0.50–0.98) | 0.58 (0.46–0.85) | 0.493 | |
| Uric acid/albumin ratio | Low (<1.6233) | 97 (57) | 2 (15) | 0.004* |
| High (>1.6233) | 74 (43) | 11 (85) | ||
| Uric acid category | <6.45 | 109 (64) | 2 (15) | <0.001* |
| >6.45 | 62 (36) | 11 (85) | ||
*: Chi-Square, **: Fisher's Exact: T-test, ɤ: Mann-Whitney U test. Values are presented as n (%), mean ± SD, or median (IQR) as appropriate. Percentages were calculated within groups. Statistical significance was defined as p < 0.05.
Survivors and non-survivors had significantly different laboratory parameters including preoperative BUN (25.0 [IQR: 19.0–28.0] vs 16.0 [IQR: 14.0–20.0] mg/dL, p = 0.001), Hb (12.6 ± 1.8 vs 13.7 ± 1.5 g/dL, p = 0.007), and uric acid (7.20 [IQR: 6.50–9.10] vs 6.10 [IQR: 4.80–7.10] mg/dL, p = 0.001).
In the overall cohort, 3-year mortality occurred in 13 patients (7.1%). When stratified according to UAR categories, mortality was observed in 11 of 85 patients (12.9%) in the high-UAR group compared with 2 of 99 patients (2.0%) in the low-UAR group. Similarly, when categorized according to uric acid levels, mortality occurred in 11 of 73 patients (15.1%) with uric acid ≥6.45 mg/dL compared with 2 of 111 patients (1.8%) with uric acid <6.45 mg/dL.
In the model incorporating UAR (Table 4) indicated that UAR was independently associated with 3-year mortality (OR: 6.701, 95% CI: 1.406–31.946, p = 0.017), along with age (OR: 1.093, 95% CI: 1.007–1.187, p = 0.033). EF showed a borderline association (p = 0.070). This model demonstrated acceptable calibration (Hosmer–Lemeshow p = 0.094) and a Nagelkerke R2 of 0.396.
| Predictor | B | SE | p | Odds ratio (95% CI) |
|---|---|---|---|---|
| Age (years) | 0.089 | 0.042 | 0.033 | 1.093 (1.007–1.187) |
| COPD | 0.571 | 0.793 | 0.471 | 1.771 (0.374–8.380) |
| EF (%) | –0.062 | 0.0341 | 0.070 | 0.940 (0.879–1.005) |
| Preop BUN (mg/dL) | 0.076 | 0.045 | 0.090 | 1.079 (0.988–1.177) |
| Preop Hb (g/dL) | –0.049 | 0.265 | 0.854 | 0.952 (0.566–1.602) |
| Preop RDW (%) | 0.267 | 0.290 | 0.357 | 1.306 (0.740–2.304) |
| UA/Albumin ratio | 1.902 | 0.797 | 0.017 | 6.701 (1.406–31.946) |
| Nagelkerke R2: 0.396, Hosmer-Lemeshow test p-value: 0.094 | ||||
In contrast, the model including preoperative uric acid (Table 5) also identified uric acid as a significant predictor of 3-year mortality (OR: 1.745, 95% CI: 1.136–2.681, p = 0.011), along with age (OR: 1.107, 95% CI: 1.017–1.205, p = 0.018) and lower EF (OR: 0.932, 95% CI: 0.870–0.998, p = 0.043). This model demonstrated slightly better calibration (Hosmer–Lemeshow p = 0.109) and a higher Nagelkerke R2 (0.405).
| Predictor | SE | B | p | Odds ratio (95% CI) |
|---|---|---|---|---|
| Age (years) | 0.043 | 0.102 | 0.018 | 1.107 (1.017–1.205) |
| COPD | 0.808 | 0.615 | 0.446 | 1.85 (0.380–9.007) |
| EF (%) | 0.035 | –0.071 | 0.043 | 0.932 (0.870–0.998) |
| Preop BUN (mg/dL) | 0.045 | 0.060 | 0.179 | 1.062 (0.973–1.159) |
| Preop Hb (g/dL) | 0.261 | –0.109 | 0.675 | 0.896 (0.538–1.494) |
| Preop RDW (%) | 0.295 | 0.250 | 0.397 | 1.284 (0.720–2.289) |
| Preop uric acid (mg/dL) | 0.219 | 0.557 | 0.011 | 1.745 (1.136–2.681) |
| Nagelkerke R2: 0.405, Hosmer–Lemesow Test p-value: 0.109 | ||||
SE, Standard Error; p, p-value; Odds Ratio (95% CI), Odds Ratio with the 95% Confidence Interval, formatted as “OR (Lower–Upper)”. Significant p-values (p < 0.05) are bolded.
When the two models were compared, the UAR showed a larger effect size (OR: 6.701 vs 1.745), suggesting a stronger magnitude of association with 3-year mortality. In contrast, the model including preoperative uric acid demonstrated slightly better calibration (Hosmer–Lemeshow p = 0.109 vs 0.094) and marginally higher explanatory power (Nagelkerke R2: 0.405 vs 0.396). Importantly, the discriminative performance of the two models was nearly identical, as indicated by very similar AUC values (0.767 for UAR vs 0.768 for uric acid).
To further evaluate the overall discriminative performance of the multivariable models, ROC curves derived from the predicted probabilities of each model were compared. The model including preoperative uric acid showed a numerically higher AUC compared with the model including UAR; however, a DeLong test for correlated ROC curves demonstrated that the difference between the two models was not statistically significant (p > 0.05).
Although there are many reports on the association of UAR with CAD and AKI, the number of studies about the effect of UAR on survival following CABG is limited. This study aims to evaluate the association between serum UA and UAR levels in isolated CABG patients in terms of 3-year mortality, suggesting that both biomarkers may independently forecast mortality. The present study found that the UAR has a greater impact on forecasting 3-year mortality. However, preoperative UA showed slightly better overall calibration and far higher explanatory power, indicating that while UAR alone may represent a more potent determinant, the uric acid offers better statistical outcomes. This emphasizes that both UAR and UA have predicted prognosis to some degree. But UA levels have been found to better predict 3-year mortality compared to UAR.
It has been identified that enhanced UA and high-sensitivity CRP concentrations suggest systemic inflammation, depressed anti-inflammatory biomarkers predicting the prognosis of CVD [11,12]. ROC curve analysis demonstrated that both UAR and preoperative uric acid levels effectively predicted 3-year mortality. Although the AUC values were nearly identical for UAR and uric acid, the optimal cut-off values differed, with UAR providing high sensitivity and moderate specificity. Multivariable logistic regression analysis revealed that UAR was independently associated with 3-year mortality.
Elevated serum uric acid suggests increased oxidative stress, endothelial dysfunction, activation of the renin–angiotensin system, and proinflammatory signalling, all of which are closely associated with adverse cardiovascular and renal outcomes [13,14]. However, serum albumin remains to be a negative acute-phase reactant with well-established antioxidant, anti-inflammatory, and endothelial-protective properties, also being a marker of nutritional and systemic inflammatory status [15]. UAR is a simple, readily available, and biologically plausible composite biomarker particularly relevant for risk stratification in complex surgical populations such as patients undergoing CABG [16]. This study evaluated the prognostic value of preoperative serum uric acid and the UAR in patients undergoing isolated CABG. Despite having been largely studied regarding renal and CVS issues, evidence for UAR remains limited [17]. Our findings demonstrate that both UA and UAR are significantly associated with 3-year mortality following CABG, with UA being a better predictor.
UAR was reported to be superior using uric acid and albumin to predict TASC-II C–D disease. A threshold of 1.62 was importantly linked to poor 3-year survival in patients with CABG, which underscores its value in predicting prognosis.
It was reported that increased serum uric acid levels (>7 mg/dL) resulted in a higher risk of AKI, and that a UAR of more than 1.7 was also an independent factor in causing AKI and 28-day mortality, whilst a cut-off value of 1.62 was predictive of reduced survival—findings consistent with our results [20]. Adults are expected to have serum uric acid concentrations of 5 to 7 mg/dL [19]. Serum uric acid levels are influenced by many conditions and pharmacological agents, such as CKD, hypertension, obesity, diabetes mellitus, diuretic therapy, and antihypertensive drugs [21]. Both hyperuricemia and hypoalbuminemia are predictive of AKI [7,22]. Yalcinkaya and colleagues [23] found increased UAR levels among patients with high SYNTAX scores and reported that higher UAR levels were associated with CAD severity. New-onset atrial fibrillation after myocardial infarction was shown to be related to increased UAR levels, suggesting both metabolic and inflammatory burden in CAD [24].
Increased preoperative UAR has been related to adverse renal outcomes and poor survival, prompting consideration that UAR is likely to have the potential of detecting abnormalities apart from coronary ones. Endothelial dysfunction, oxidative stress, and inflammation may occur by the concurrence of hyperuricemia and hypoalbuminemia, resulting in postoperative AKI and poor survival, findings consistent with our results [24,25,26,27,28,29]. The present study points to both the ratio of UAR and UA levels being effective predictors of 3-year mortality in ROC curve analysis, but UA being a slightly superior predictor.
Recent studies have reported that increased UAR levels are associated with CAD severity, high SYNTAX scores, new-onset atrial fibrillation, AKI, and short-term mortality. A UAR of about 1.6–1.7 may predict adverse outcomes, findings which are consistent with the present study [9]. It can be concluded that these simple, readily available biomarkers may provide clinically significant prognostic evaluation for 3-year survival following CABG. Although the EuroSCORE II remains the cornerstone of perioperative risk evaluation, they are primarily designed to predict short-term outcomes and may not demonstrate long-term systemic challenges [29]. From a clinical standpoint, the integration of UA and UAR into preoperative evaluation may complement existing risk scores such as EuroSCORE II, which primarily predict short-term outcomes. The identification of patients with a UAR exceeding 1.62 or UA levels above 6.45 mg/dL before surgery could trigger a structured perioperative optimization pathway. Such a pathway may include nutritional assessment and correction of hypoalbuminemia through dietary supplementation, evaluation and management of hyperuricemia in coordination with nephrology consultation, intensified anti-inflammatory strategies, and a tailored postoperative surveillance plan with closer follow-up intervals. However, it should be emphasized that these thresholds require external validation before clinical implementation, and interventional studies are needed to determine whether preoperative modification of UA or UAR levels translates into improved survival outcomes.
There are some limitations in this study, which has a retrospective and single-centre design, with a small sample size. The optimal cut-off values for uric acid and UAR were derived from ROC analysis using the Youden index. However, because the study is based on a relatively small retrospective cohort with a limited number of outcome events, these thresholds may be subject to instability. Therefore, the identified cut-off values should be interpreted cautiously and require validation in larger prospective datasets.
Due to the limited number of mortality events, the multivariable models were constructed using a parsimonious approach to minimize the risk of overfitting. Therefore, additional potential confounders such as detailed renal function parameters, medication use, or perioperative variables could not be fully incorporated into the model. Future studies with larger sample sizes and higher event numbers may allow for a more comprehensive adjustment.
The present study focused primarily on the prognostic value of preoperative biomarkers. Therefore, operative parameters such as cardiopulmonary bypass time, cross-clamp time, number of grafts, completeness of revascularization, and postoperative complications were not incorporated into the multivariable models. These variables may influence long-term outcomes after CABG and should be considered in future larger studies designed to integrate both preoperative and operative risk factors. These limitations underscore the need for larger, multicenter, prospective studies to confirm the prognostic utility of UAR in patients undergoing CABG.
In conclusion, both serum UA levels and UAR were identified as significant predictors of 3-year mortality in patients undergoing isolated CABG.Although the UA-based model demonstrated slightly better overall calibration and explanatory performance compared with the UAR-based model, both biomarkers showed significant prognostic utility for long-term mortality assessment. These findings suggest that preoperative UA and UAR may both contribute to risk stratification in CABG patients. Further prospective studies are required to clarify the potential clinical role of UAR in long-term prognostic assessment after CABG.
Data were obtained from hospital electronic medical records and patient files. Readers may request the corresponding author's information upon reasonable request.
RA: Manuscript writing, supervision, and management of all stages of the study. BT: Manuscript writing and analysis. KB: Data collection and manuscript writing. FY: Statistical analysis and manuscript writing. NCA: Data collection and manuscript writing. EGK: Data collection and manuscript writing. ZK: Manuscript writing and statistics. CUK: Statistical analysis, supervision and critical review. All authors read and approved the final manuscript. All authors have participated sufficiently in the work and agreed to be accountable for all aspects of the work.
This study follows the Declaration of Helsinki. Approval was obtained from the Education Planning Committee in Dr. Siyami Ersek Thoracic and Cardiovascular Surgery Education and Research Hospital (E-28001928-604.01-276512282) and all participants gave their written informed consents. Data were obtained from hospital electronic medical records and patient files.
Not applicable.
This research received no external funding.
The authors declare no conflicts of interest.
References
Publisher’s Note: IMR Press stays neutral with regard to jurisdictional claims in published maps and institutional affiliations.