

 , Juncheng Duan 1,*
1 Department of Cardiovascular Surgery, Suining Central Hospital, North Sichuan Medical College, 629000 Suining, Sichuan, China
Abstract
Current risk assessment tools for predicting in-hospital major adverse cardiovascular events (MACEs) after heart valve replacement (HVR) have notable limitations. To address this gap, this study aimed to develop and validate a machine learning (ML) model for predicting such events.
A total of 346 patients who underwent HVR were retrospectively included and divided into a training set (n = 242) and a validation set (n = 104). Patients who experienced in-hospital MACEs were classified as having the complication. In the training set, prognostic indicators were screened using univariate analysis, least absolute shrinkage and selection operator (LASSO) regression, and multivariate logistic regression. Prediction models were constructed using random forest (RF), K-Nearest Neighbors (K Model), and gradient boosting (GB). Model performance was evaluated using the area under the receiver operating characteristic (AUC) curve, calibration curves, and decision curve analysis, and the optimal model was selected. Model interpretability was assessed using SHapley Additive exPlanations (SHAP) values.
No statistically significant differences were observed in baseline characteristics between the training and validation sets (p > 0.05). Multivariate logistic regression identified age, European System for Cardiac Operative Risk Evaluation II (EuroSCORE II), cardiopulmonary bypass time, aortic cross-clamp time, left ventricular ejection fraction, and serum albumin as independent predictors of MACEs (all p < 0.05). The RF model demonstrated the highest predictive performance, with AUC values of 0.847 in the training set and 0.823 in the validation set. The RF model achieved a validation AUC of 0.823, which was significantly superior to that of the K model (0.790), the GB model (0.771), and the traditional EuroSCORE II (0.723) (all p < 0.05), establishing the RF model as the optimal predictive approach.
This study developed and validated a machine-learning model to predict MACEs after HVR. The RF model showed favorable predictive performance compared with traditional scoring systems. The RF model may serve as a clinical decision-support tool to help identify high-risk patients before surgery, potentially aiding in resource allocation and individualized intervention.
Keywords
- heart valve replacement
- machine learning
- postoperative complications
- predictive models
- random forest model
Heart valve disease is a common cardiovascular condition globally, with its incidence rising alongside an aging population [1]. Heart valve replacement (HVR) remains a fundamental, albeit invasive and high-risk, treatment for end-stage valvular heart disease [2]. Major adverse cardiovascular events (MACEs), such as low cardiac output syndrome, stroke, acute kidney injury, severe infection, and death, seriously affect patient recovery and impose a significant healthcare burden. Currently, the European System for Cardiac Operative Risk Evaluation II (EuroSCORE II) is widely used for preoperative risk assessment in cardiac surgery [3]. However, it has several limitations: it was derived from a specific population, relies on linear modeling assumptions, and struggles to capture complex non-linear relationships and high-order interactions among variables. This often results in suboptimal performance for predicting composite outcomes, such as MACE, in specific cohorts like patients undergoing isolated valve surgery, failing to meet the demands of individualized precision medicine [4]. Machine learning (ML), a core branch of artificial intelligence, can automatically learn complex patterns from large datasets and model non-linear relationships. It has demonstrated successful applications in medical prognosis prediction [5,6]. In cardiac surgery, ML models have shown potential to outperform traditional scoring systems for predicting outcomes like mortality after coronary artery bypass grafting [7]. Nevertheless, few studies have specifically focused on developing ML models to predict composite MACE in patients undergoing isolated or combined HVR—a distinct patient population with unique pathophysiology and risk profiles. Therefore, this study aims to construct and validate an ML-based prediction model for postoperative MACE in HVR patients using routinely available perioperative data. Its performance was directly compared with the EuroSCORE II, with the goal of establishing a more accurate and individualized risk assessment tool to support clinical decision-making.
A retrospective cohort study design was adopted. A total of 346 patients who underwent HVR at our cardiovascular disease center from January 2019 to June 2024 were continuously included. Inclusion criteria were as follows: first-time HVR surgery (mechanical or biological valve) [8], age ≥18 years, types of surgery included isolated aortic valve replacement, isolated mitral valve replacement, combined aortic and mitral valve replacement, and valve replacement combined with coronary artery bypass grafting, elective or sub-emergency surgery under cardiopulmonary bypass at our center, complete and retrievable clinical medical records. Exclusion criteria were as follows: patients who underwent transcatheter aortic valve implantation, patients complicated with acute infective endocarditis, patients complicated with acute myocardial infarction requiring concurrent surgery, patients with severe missing clinical data (>20%). The flow of patient screening and cohort formation was summarized in Supplementary Fig. 1.
Patient data were collected through the electronic medical record system, including: preoperative data: age, gender, body mass index, hypertension, diabetes, history of previous cardiac surgery, etc., preoperative left ventricular ejection fraction (LVEF), New York Heart Association (NYHA) functional classification (class III/IV was defined as poor cardiac function), EuroSCORE II, hemoglobin, serum albumin, creatinine, C-reactive protein, total bilirubin, platelet count. Intraoperative data: type of surgery, whether combined with coronary artery bypass grafting, cardiopulmonary bypass time, aortic cross-clamp time, valve type (mechanical/biological valve). The primary outcome was the occurrence of major adverse cardiovascular events (MACE, a composite endpoint) in the hospital after surgery, defined as the incidence of any of the following events within 30 days postoperatively: all-cause death, low cardiac output syndrome, new-onset stroke, reoperation due to bleeding, acute kidney injury requiring renal replacement therapy.
According to the international guidelines of cardiothoracic surgery, cases were grouped according to whether postoperative major complications occurred [9]. The complication group (MACE group) was defined as patients who experienced major adverse cardiovascular events (including all-cause death, low cardiac output syndrome, new-onset stroke, reoperation due to bleeding, and acute kidney injury requiring renal replacement therapy) within 30 days after valve replacement. The non-complication group (Non-MACE group) was the control group of patients who did not experience the above events during the same period. The 30-day follow-up period was chosen to capture short-term surgical outcomes consistently.
The sample size for this study was estimated based on the Events Per Variable (EPV) principle to ensure sufficient outcome events and mitigate model overfitting. With an estimated in-hospital MACE incidence of approximately 22% and planning for 5–6 final predictor variables, a minimum of 25–30 events were required. Our final cohort of 346 patients, yielding 76 MACE events, satisfied this requirement.
Data analysis was performed using SPSS 26.0 (IBM Corp., Armonk, NY, USA), R 4.2.3 (R Foundation for Statistical Computing, Vienna, Austria), and Python 3.8.5 (Python Software Foundation, Beaverton, OR, USA). Continuous variables are presented as mean ± standard deviation or median (interquartile range), and categorical variables as counts (percentages). Group comparisons used Student’s t-test, Mann-Whitney U test, or Chi-square test as appropriate. Before model construction, comprehensive data preprocessing was performed: (1) Missing data: Variables with missing rates >20% were excluded per protocol. For remaining variables, missing values (<20%) were imputed using multiple imputation (5 iterations). (2) Outliers: Continuous variable outliers were identified using the 3σ rule and reviewed for clinical plausibility; non-physiological extreme values were winsorized at the 99th percentile. (3) Standardization: All continuous variables were standardized via z-score normalization to neutralize scale effects. The dataset was initially split into a training set (70%, n = 242) and a validation set (30%, n = 104) using stratified random sampling to preserve the MACE incidence ratio. In the training set, univariate analysis was first conducted to screen for variables. Least absolute shrinkage and selection operator (LASSO) regression was applied to the significant variables from the univariate analysis for further feature selection. The optimal penalty coefficient (λ) was determined via 10-fold cross-validation to select the core variables with the highest predictive value. Statistically significant variables were included in a multivariate logistic regression analysis to identify independent influencing factors. Prediction models were constructed using random forest (RF) Model, K-Nearest Neighbors (K Model), and gradient boosting (GB Model) algorithms implemented in Python (v3.8.5) with the scikit-learn library. Hyperparameters for each model were optimized via a 5-fold cross-validated grid search on the training set. Key tuned parameters included: for the RF Model (n_estimators, max_depth, min_samples_split, min_samples_leaf); for the K Model (n_neighbors); and for the GB Model (n_estimators, max_depth, learning_rate). Model performance was primarily evaluated by the area under the receiver operating characteristic (ROC) curve (AUC). The Delong test was used for statistical comparison of AUCs between models and against the EuroSCORE II. Calibration was assessed with calibration curves and the Brier score. To rigorously evaluate model stability and optimism, 5-fold cross-validation was applied during training, and bootstrap resampling (1000 iterations) was performed on the entire dataset to obtain optimism-corrected performance estimates. Decision curve analysis (DCA) was used to evaluate the clinical net benefit. To enhance interpretability of the optimal model, SHapley Additive exPlanations (SHAP) analysis was conducted. A two-sided p-value < 0.05 was considered statistically significant.
Among the 346 enrolled patients, 76 (22.0%) experienced at least one MACE component within 30 days postoperatively. According to the ratio of 7:3, 346 patients who underwent HVR were divided into a training dataset (including 242 cases) and a validation dataset (including 104 cases). There were no statistically significant differences in the comparison of general data between patients in the training set and the validation set (all p > 0.05) (Table 1).
| Indicators | Training set (n = 242) | Validation set (n = 104) | t/χ2/U | p |
|---|---|---|---|---|
| Age (years) | 65.72 ± 9.13 | 64.31 ± 8.96 | 1.325 | 0.186 |
| Gender (male/female) | 143/99 | 65/39 | 0.353 | 0.553 |
| BMI (kg/m2) | 23.81 ± 3.57 | 24.15 ± 3.40 | 0.824 | 0.411 |
| Hypertension (yes/no) | 138/104 | 62/42 | 0.200 | 0.655 |
| Diabetes (yes/no) | 65/177 | 25/79 | 0.301 | 0.583 |
| Chronic pulmonary disease (yes/no) | 42/200 | 16/88 | 0.202 | 0.653 |
| Peripheral vascular disease (yes/no) | 28/214 | 14/90 | 0.244 | 0.621 |
| Previous cardiac surgery history (yes/no) | 25/217 | 9/95 | 0.231 | 0.631 |
| Left ventricular ejection fraction (%) | 54.83 ± 11.29 | 56.07 ± 10.50 | 0.956 | 0.340 |
| New York Heart Association functional class (III/IV) | 118/124 | 47/57 | 0.371 | 0.542 |
| European System for Cardiac Operative Risk Evaluation II | 2.28 (1.58, 3.12) | 2.35 (1.60, 3.20) | 0.512 | 0.610 |
| Hemoglobin (g/L) | 126.54 ± 18.21 | 128.36 ± 17.43 | 0.863 | 0.389 |
| Serum albumin (g/L) | 38.23 ± 4.51 | 38.96 ± 4.31 | 1.399 | 0.163 |
| Creatinine (μmol/L) | 90.06 ± 26.88 | 87.50 ± 24.31 | 0.835 | 0.404 |
| C-reactive protein (mg/L) | 6.56 (4.02, 10.72) | 5.99 (3.62, 9.91) | 0.710 | 0.478 |
| Total bilirubin (μmol/L) | 15.84 ± 6.91 | 16.18 ± 7.21 | 0.414 | 0.679 |
| Platelet count (×10⁹/L) | 185.64 ± 65.17 | 192.10 ± 68.59 | 0.832 | 0.406 |
| Aortic valve replacement (yes/no) | 125/117 | 58/46 | 0.495 | 0.482 |
| Combined coronary artery bypass grafting (yes/no) | 78/164 | 29/75 | 0.643 | 0.422 |
| Cardiopulmonary bypass time (min) | 132.52 ± 38.64 | 127.81 ± 35.89 | 1.062 | 0.289 |
| Aortic cross-clamp time (min) | 88.90 ± 27.25 | 85.43 ± 25.17 | 1.111 | 0.268 |
| Mechanical valve replacement (yes/no) | 155/87 | 63/41 | 0.376 | 0.540 |
| Major adverse outcomes (occurred/not occurred) | 52/190 | 24/80 | 0.107 | 0.743 |
BMI, body mass index.
In the training set, univariate analysis showed that there were statistically significant differences in age, LVEF, EuroSCORE II, serum albumin, cardiopulmonary bypass time, and aortic cross-clamp time between the non-complication group and the complication group (all p < 0.05) (Table 2).
| Indicators | Non-complication group (n = 190) | Complication group (n = 52) | t/χ2/U | p |
|---|---|---|---|---|
| Age (years) | 64.67 ± 8.91 | 68.08 ± 9.45 | 2.414 | 0.017 |
| Gender (male/female) | 115/75 | 28/24 | 0.753 | 0.385 |
| BMI (kg/m2) | 24.01 ± 3.59 | 23.65 ± 3.56 | 0.642 | 0.522 |
| Hypertension (yes/no) | 108/82 | 30/22 | 0.012 | 0.913 |
| Diabetes (yes/no) | 50/140 | 15/37 | 0.133 | 0.715 |
| Chronic pulmonary disease (yes/no) | 32/158 | 10/42 | 0.162 | 0.687 |
| Peripheral vascular disease (yes/no) | 20/170 | 8/44 | 0.942 | 0.332 |
| Previous cardiac surgery history (yes/no) | 18/172 | 7/45 | 0.701 | 0.403 |
| Left ventricular ejection fraction (%) | 56.59 ± 8.20 | 51.96 ± 10.36 | 3.399 | 0.001 |
| New York Heart Association functional class (III/IV) | 95/95 | 23/29 | 0.544 | 0.461 |
| European System for Cardiac Operative Risk Evaluation II | 2.11 (1.51, 2.70) | 2.67 (1.82, 4.80) | 2.931 | 0.004 |
| Hemoglobin (g/L) | 126.38 ± 18.22 | 127.04 ± 18.83 | 0.230 | 0.818 |
| Serum albumin (g/L) | 39.05 ± 3.44 | 37.65 ± 4.32 | 2.454 | 0.015 |
| Creatinine (μmol/L) | 87.87 ± 22.81 | 92.36 ± 25.21 | 1.229 | 0.220 |
| C-reactive protein (mg/L) | 6.02 (3.51, 9.52) | 7.12 (4.05, 11.85) | 0.996 | 0.320 |
| Total bilirubin (μmol/L) | 15.62 ± 6.41 | 16.24 ± 7.23 | 0.601 | 0.549 |
| Platelet count (×10⁹/L) | 182.66 ± 65.87 | 184.65 ± 68.54 | 0.191 | 0.848 |
| Aortic valve replacement (yes/no) | 100/90 | 25/27 | 0.339 | 0.560 |
| Combined coronary artery bypass grafting (yes/no) | 62/128 | 16/36 | 0.065 | 0.799 |
| Cardiopulmonary bypass time (min) | 125.47 ± 29.54 | 139.78 ± 39.10 | 2.874 | 0.004 |
| Aortic cross-clamp time (min) | 86.14 ± 20.45 | 96.73 ± 28.50 | 3.020 | 0.003 |
| Mechanical valve replacement (yes/no) | 120/70 | 35/17 | 0.305 | 0.581 |
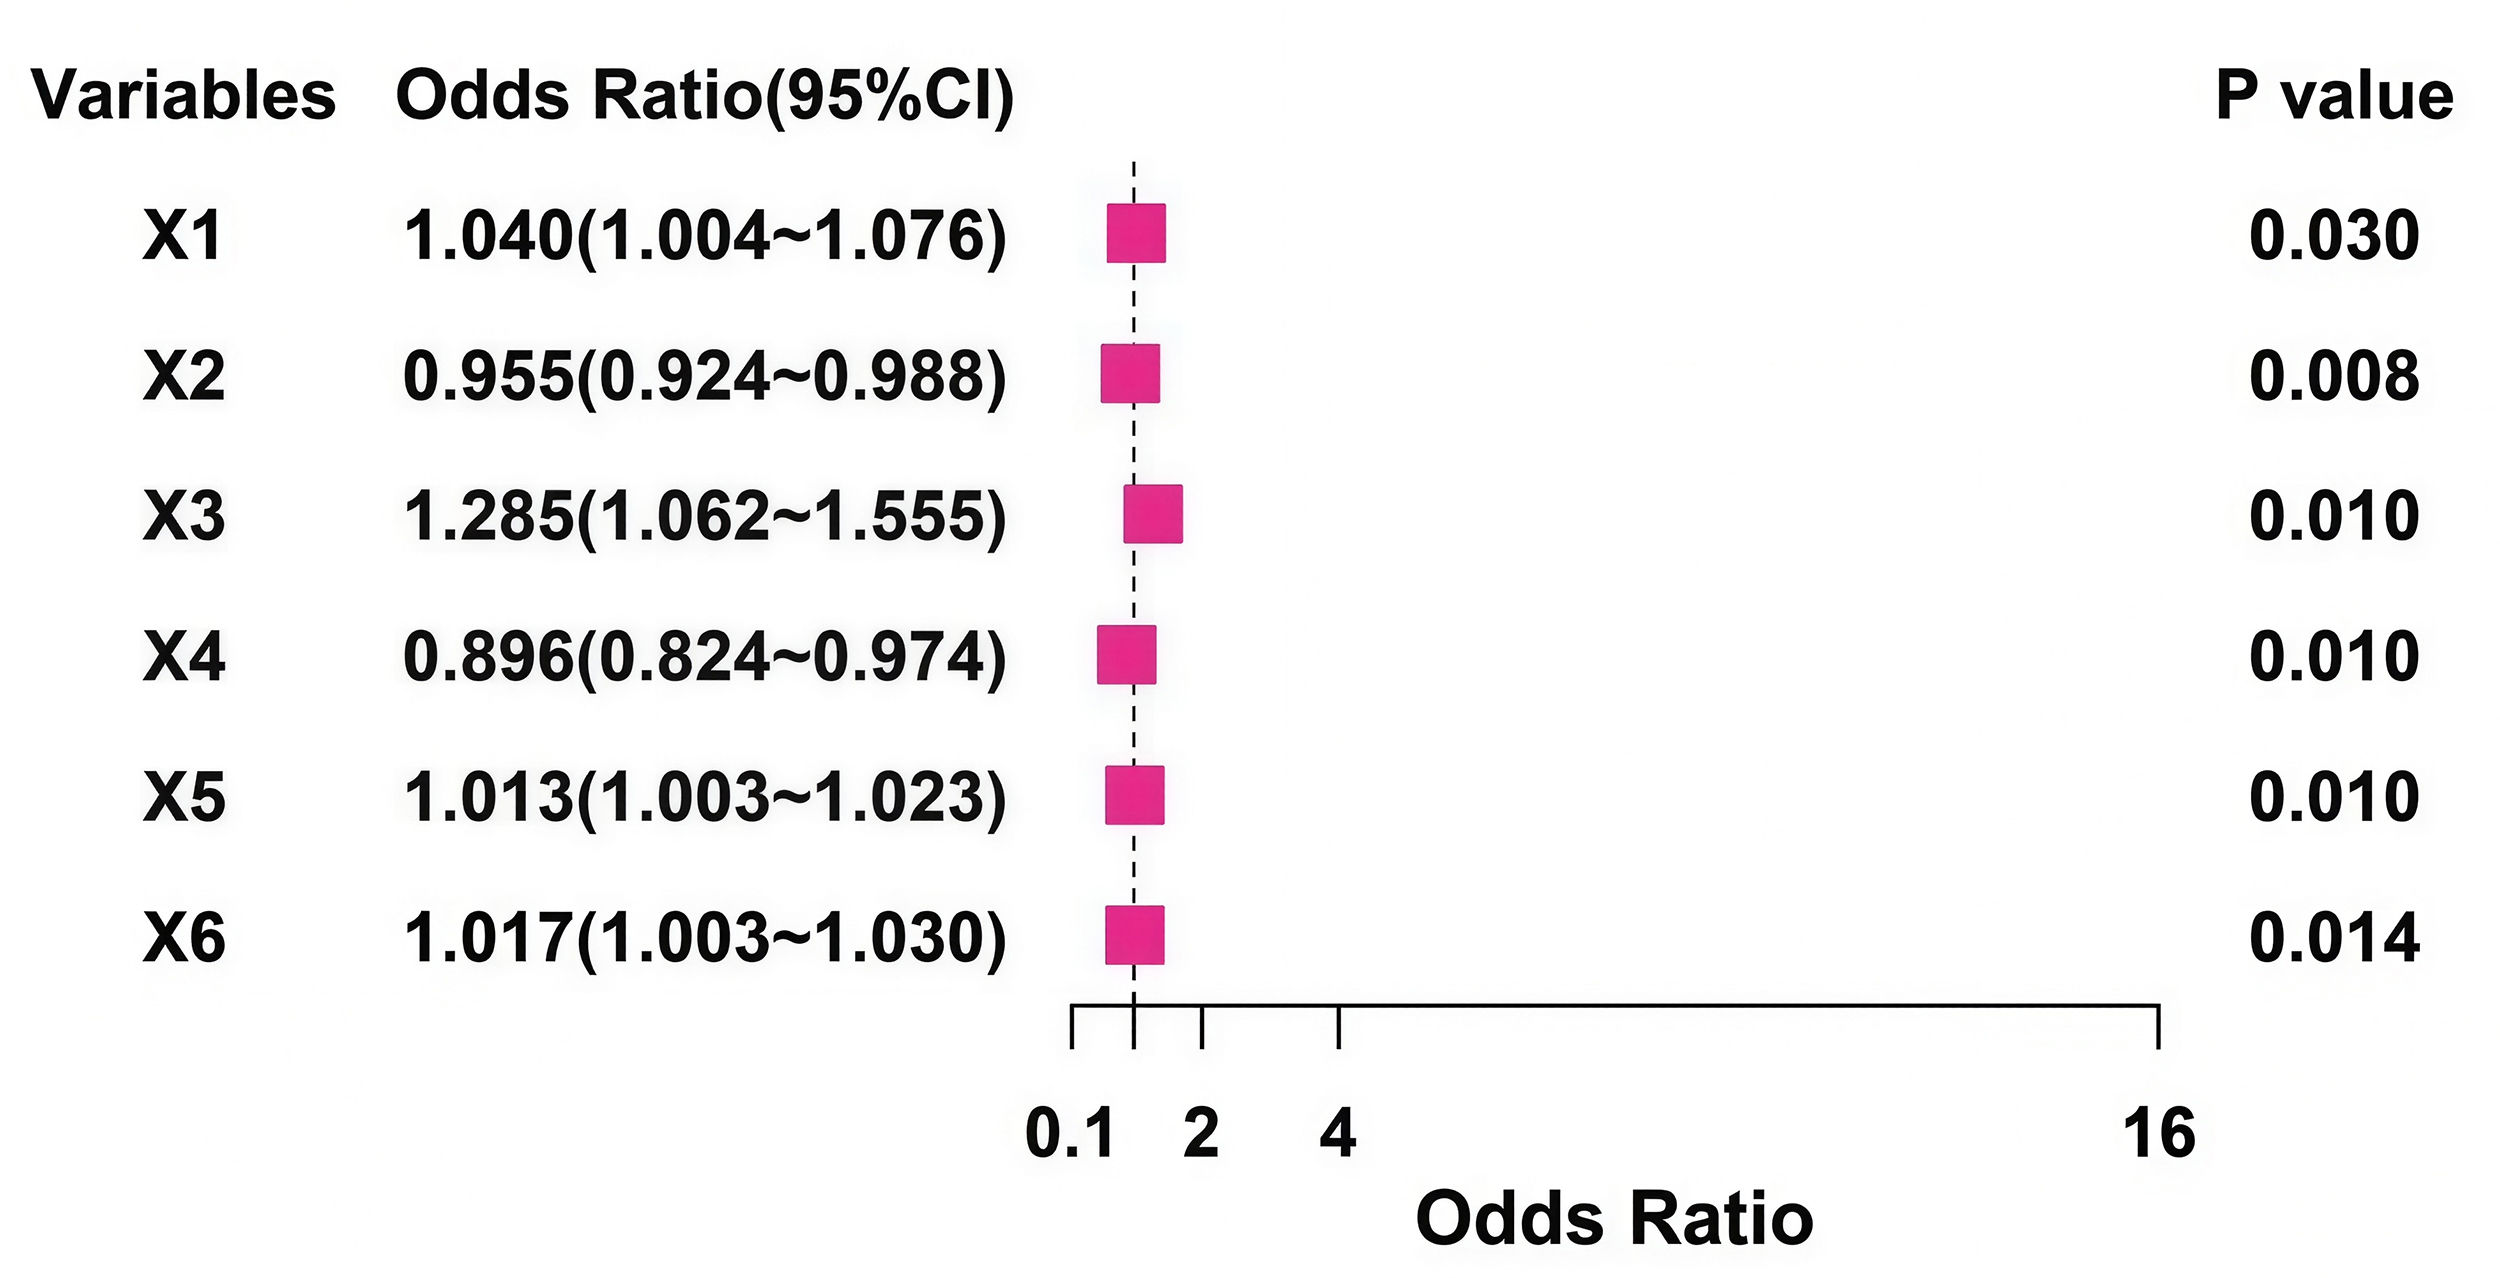
The outcome after heart valve replacement was used as the dependent variable (non-complication group = 0, complication group = 1) (Supplementary Table 1). The indicators with statistical significance in the univariate analysis were included in the LASSO regression for variable screening. Variables were selected using the screening criterion of lambda.1se (Supplementary Figs. 2,3). The appropriate predictive variables were age, LVEF, EuroSCORE II, serum albumin, cardiopulmonary bypass time, and aortic cross-clamp time. The result of multivariate logistic regression analysis identified age, EuroSCORE II, cardiopulmonary bypass time, aortic cross-clamp time, LVEF, and serum albumin as independent influencing factors for MACE (all p < 0.05) (Fig. 1).
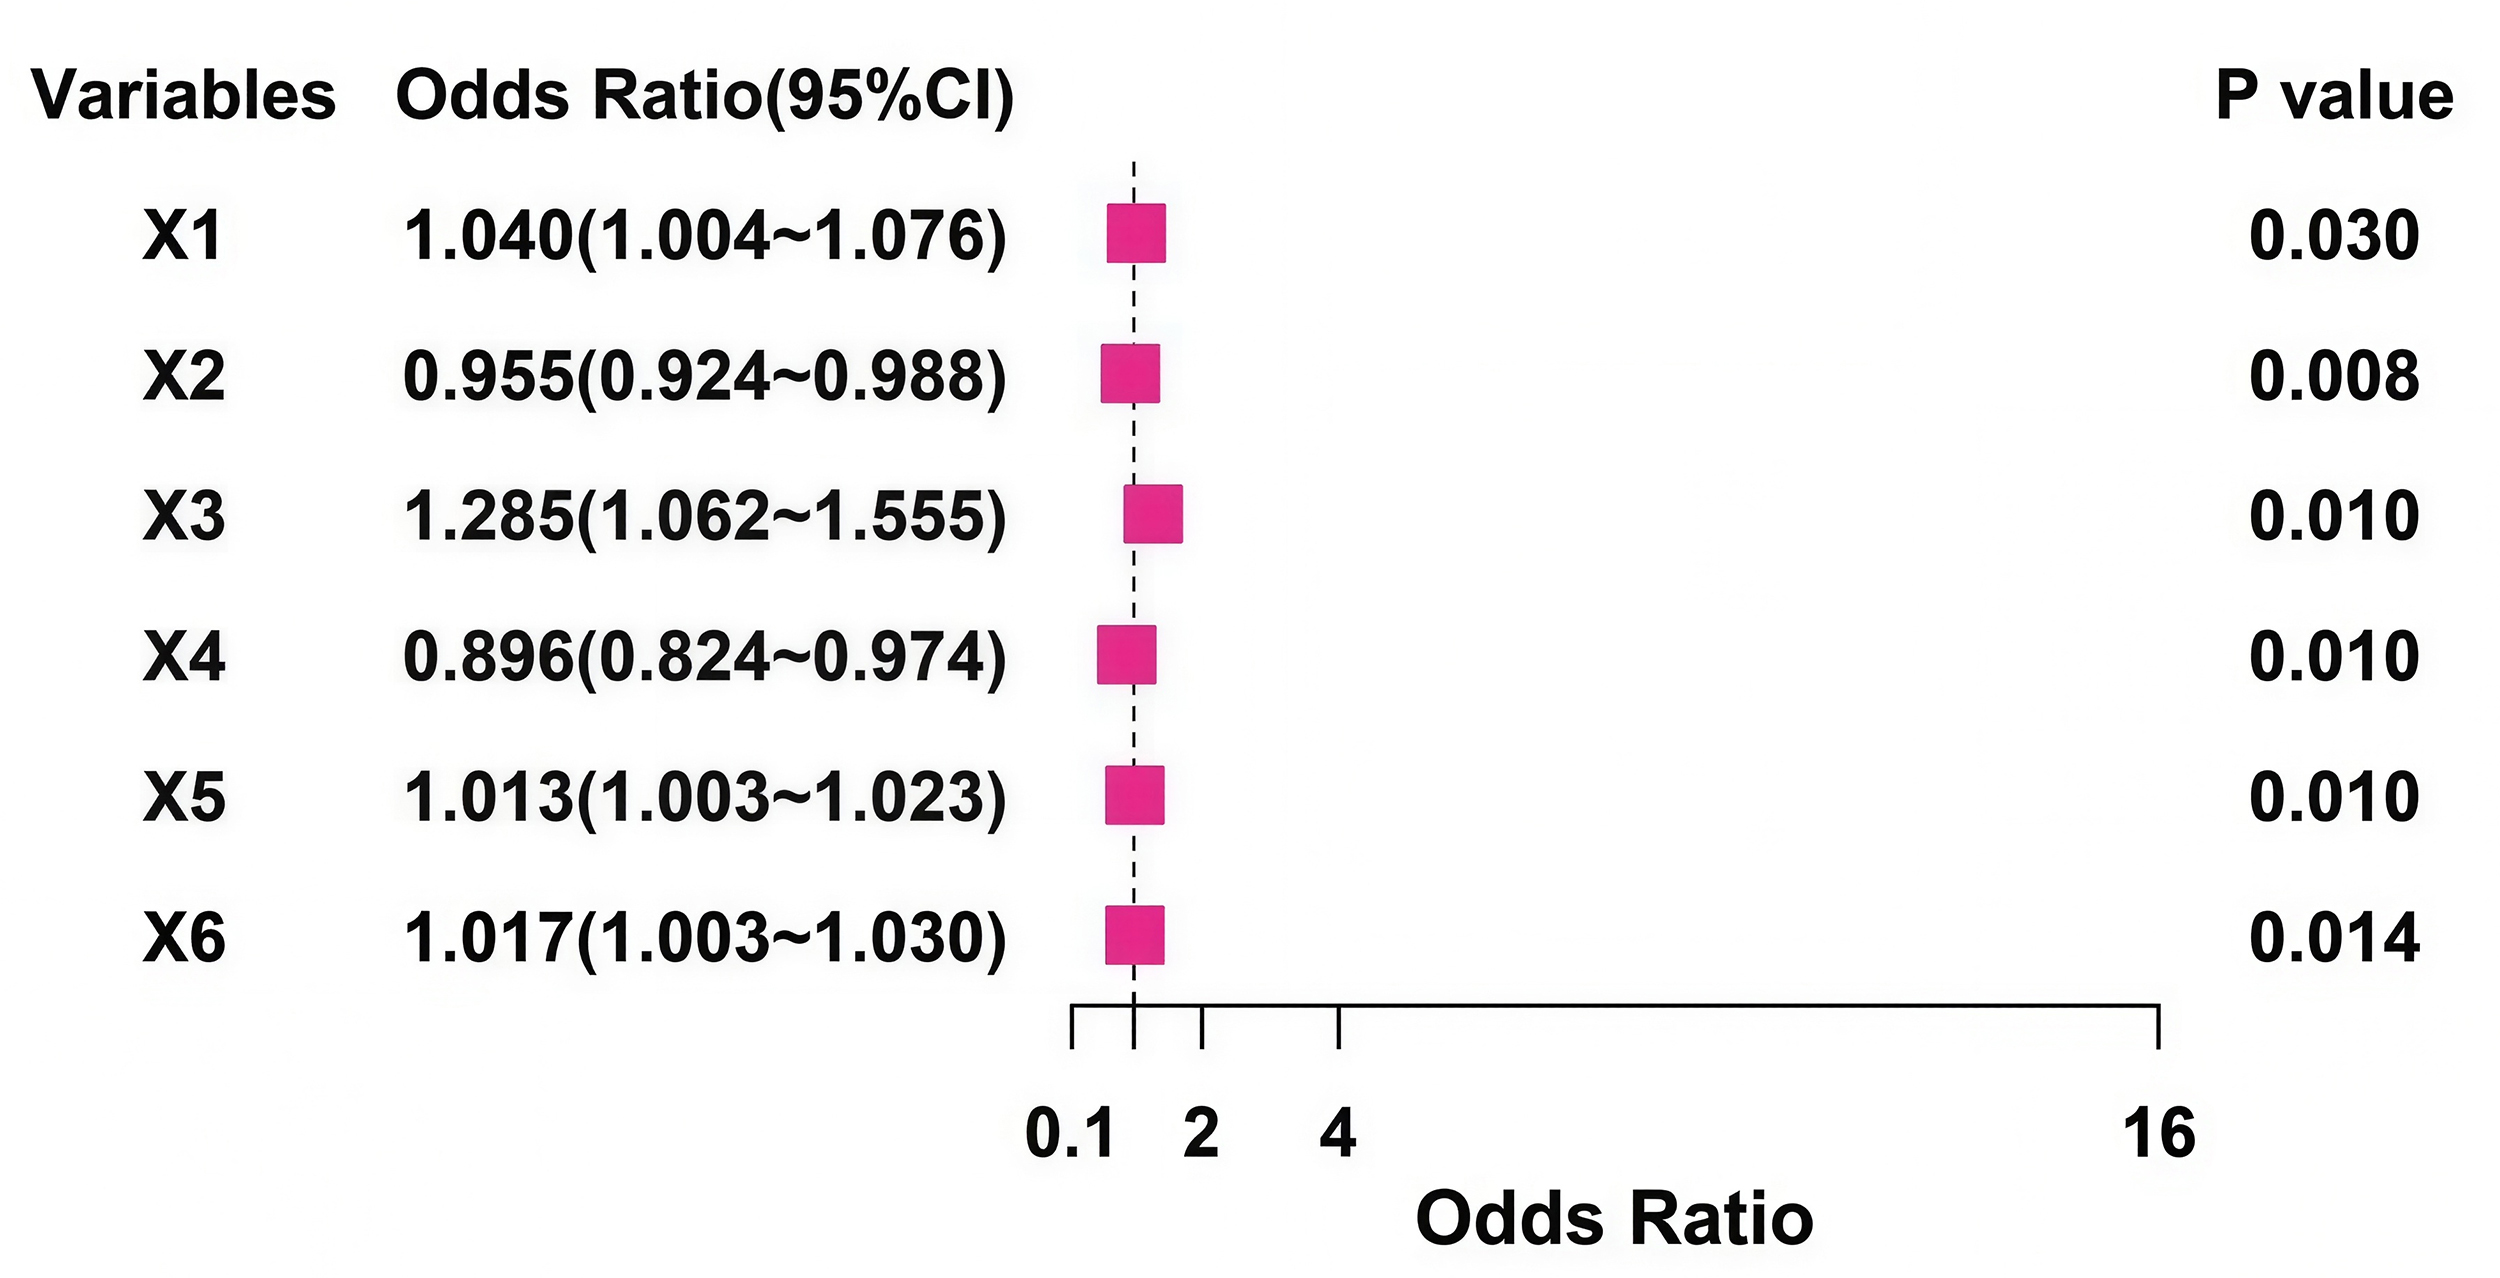 Fig. 1.
Forest plot of the multivariable logistic regression analysis of influencing factors for MACEs after heart valve replacement. X1, age; X2, left ventricular ejection fraction; X3, EuroSCORE II; X4, serum albumin; X5, cardiopulmonary bypass time; X6, aortic cross-clamp time; MACEs, major adverse cardiovascular events.
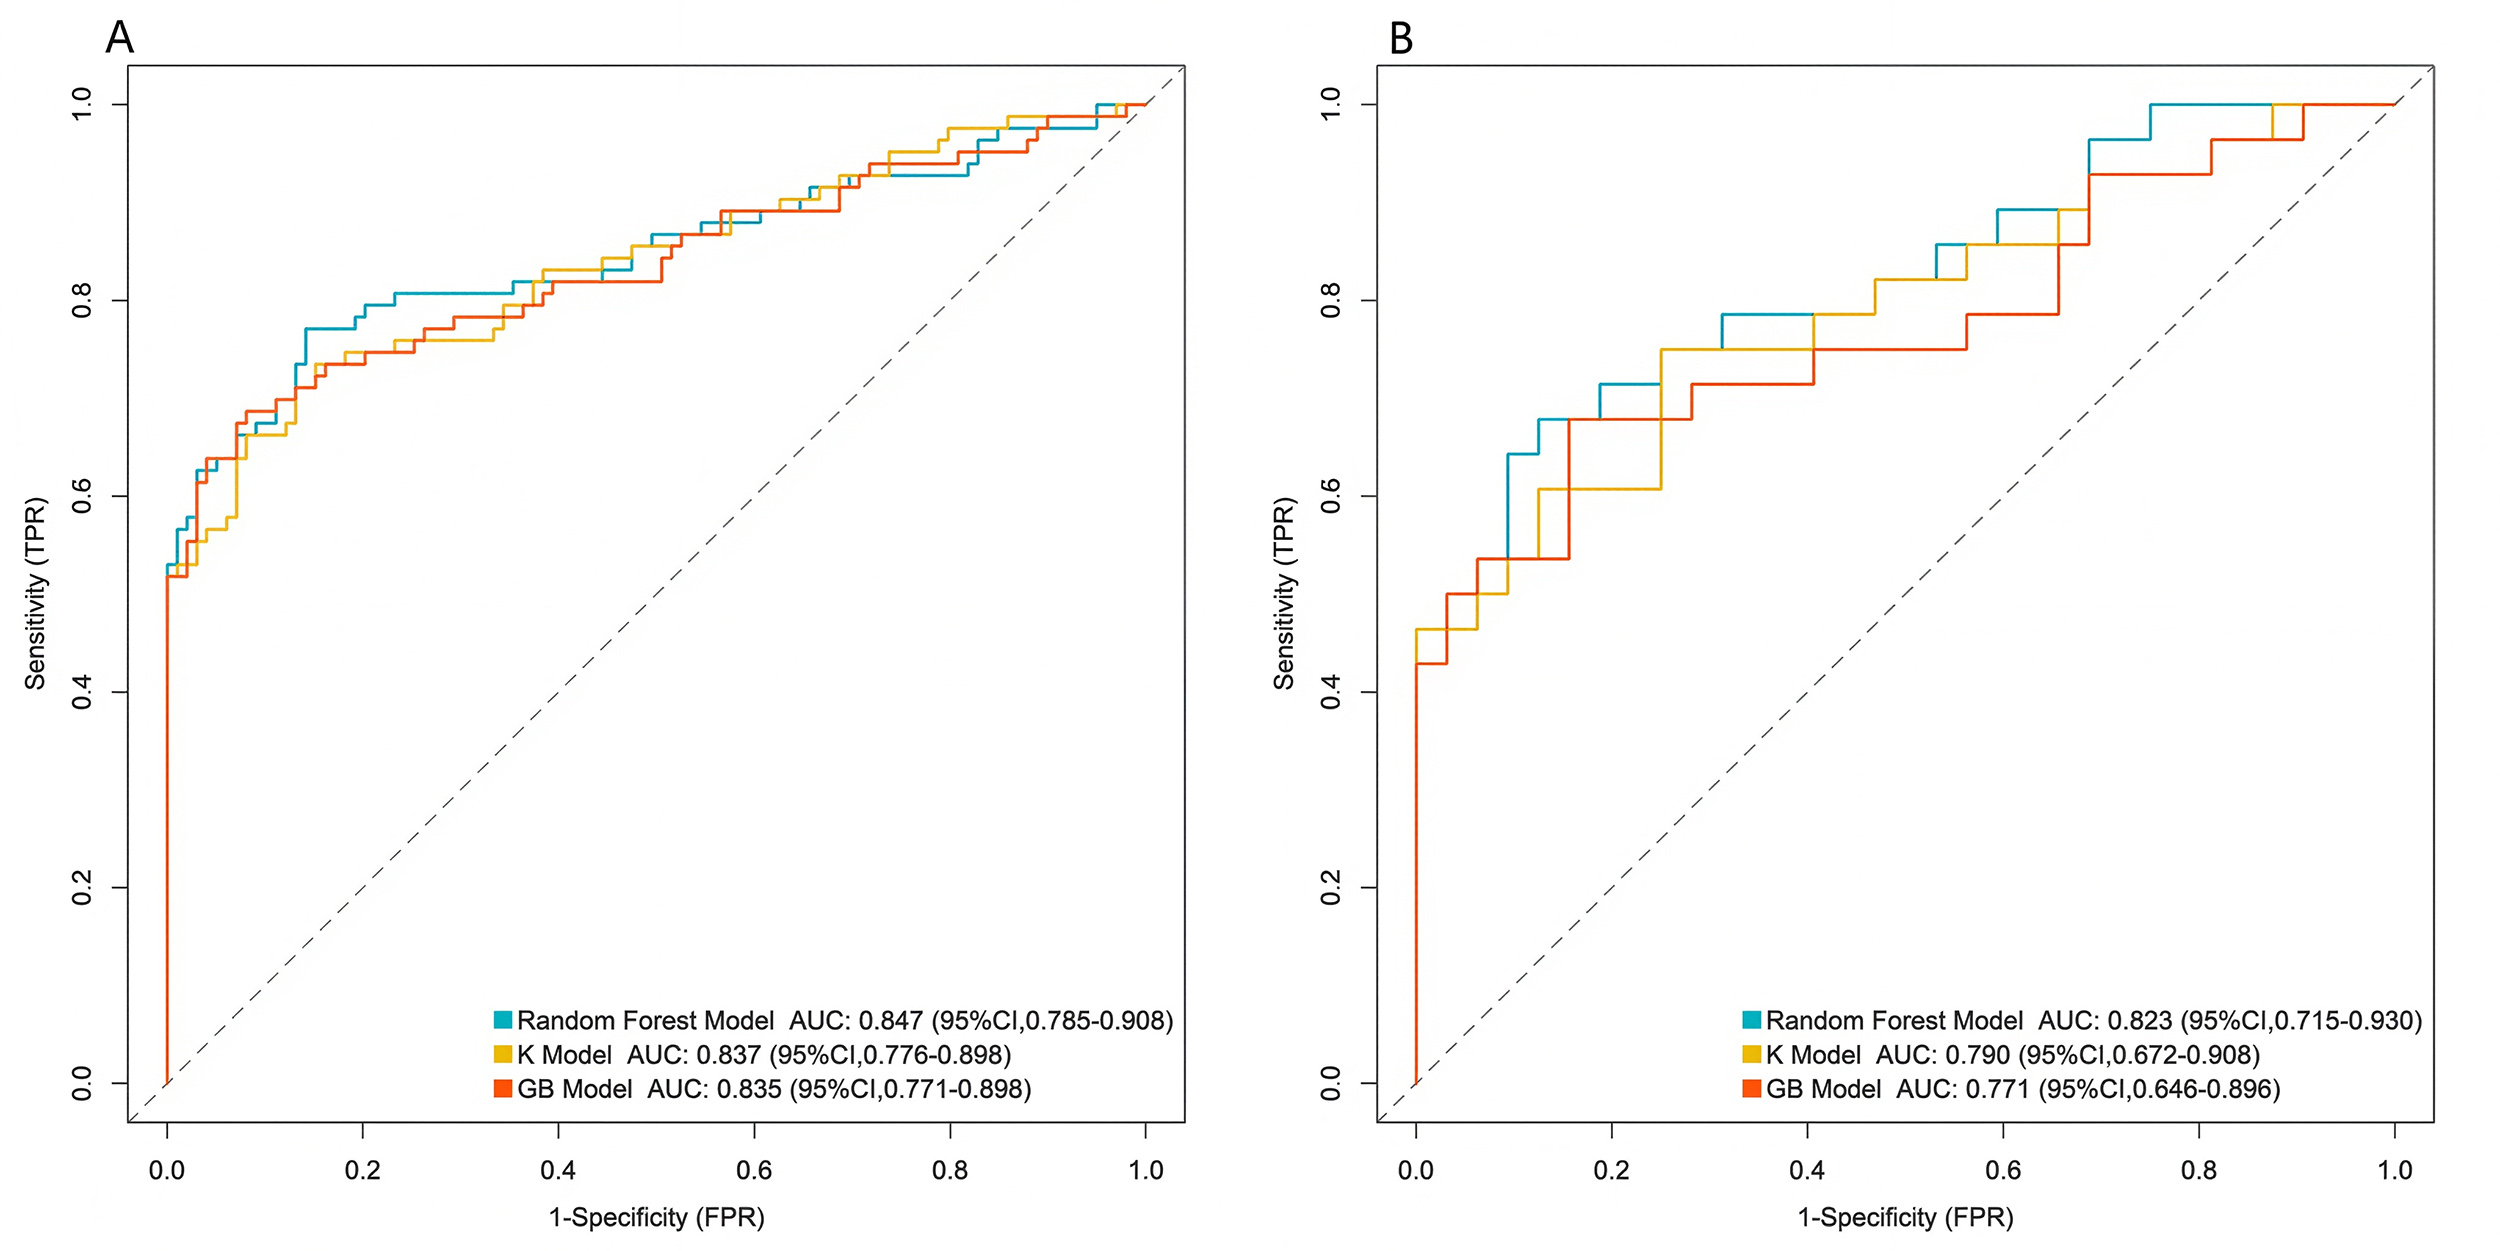
The RF Model, K Model, and GB Model were used for prediction in the training set and validation set. The AUC values of the three models in the training set were 0.847 (95% CI: 0.785–0.908), 0.837 (95% CI: 0.776–0.898), and 0.835 (95% CI: 0.771–0.898) respectively, and those in the validation set were 0.823 (95% CI: 0.715–0.930), 0.790 (95% CI: 0.672–0.908), and 0.771 (95% CI: 0.646–0.896) respectively. The model with the largest AUC value was selected as the best model for this study, which was the RF Model (Fig. 2). The predictive performance of the ML models and the EuroSCORE II was summarized in Table 3. The results of the DeLong test indicated that in the validation set, the AUC of the RF Model was significantly higher than that of the EuroSCORE II score and superior to the other compared machine learning models. Specifically, the AUC of the RF Model was 0.823, which was significantly higher than that of EuroSCORE II (0.723), K Model (0.790), and GB Model (0.771), with corresponding p-values of 0.028, 0.036, and 0.021, respectively. 5-fold cross-validation results showed that the average AUC of the RF Model was 0.839 (95% CI: 0.792–0.886), which was consistent with the 70/30 split validation result (0.823), indicating good model stability. Bootstrap correction (1000 iterations) yielded an optimism-corrected AUC of 0.811 (95% CI: 0.755–0.867) for the RF Model, which remains substantially higher than the EuroSCORE II, indicating robust performance despite the sample size constraints.
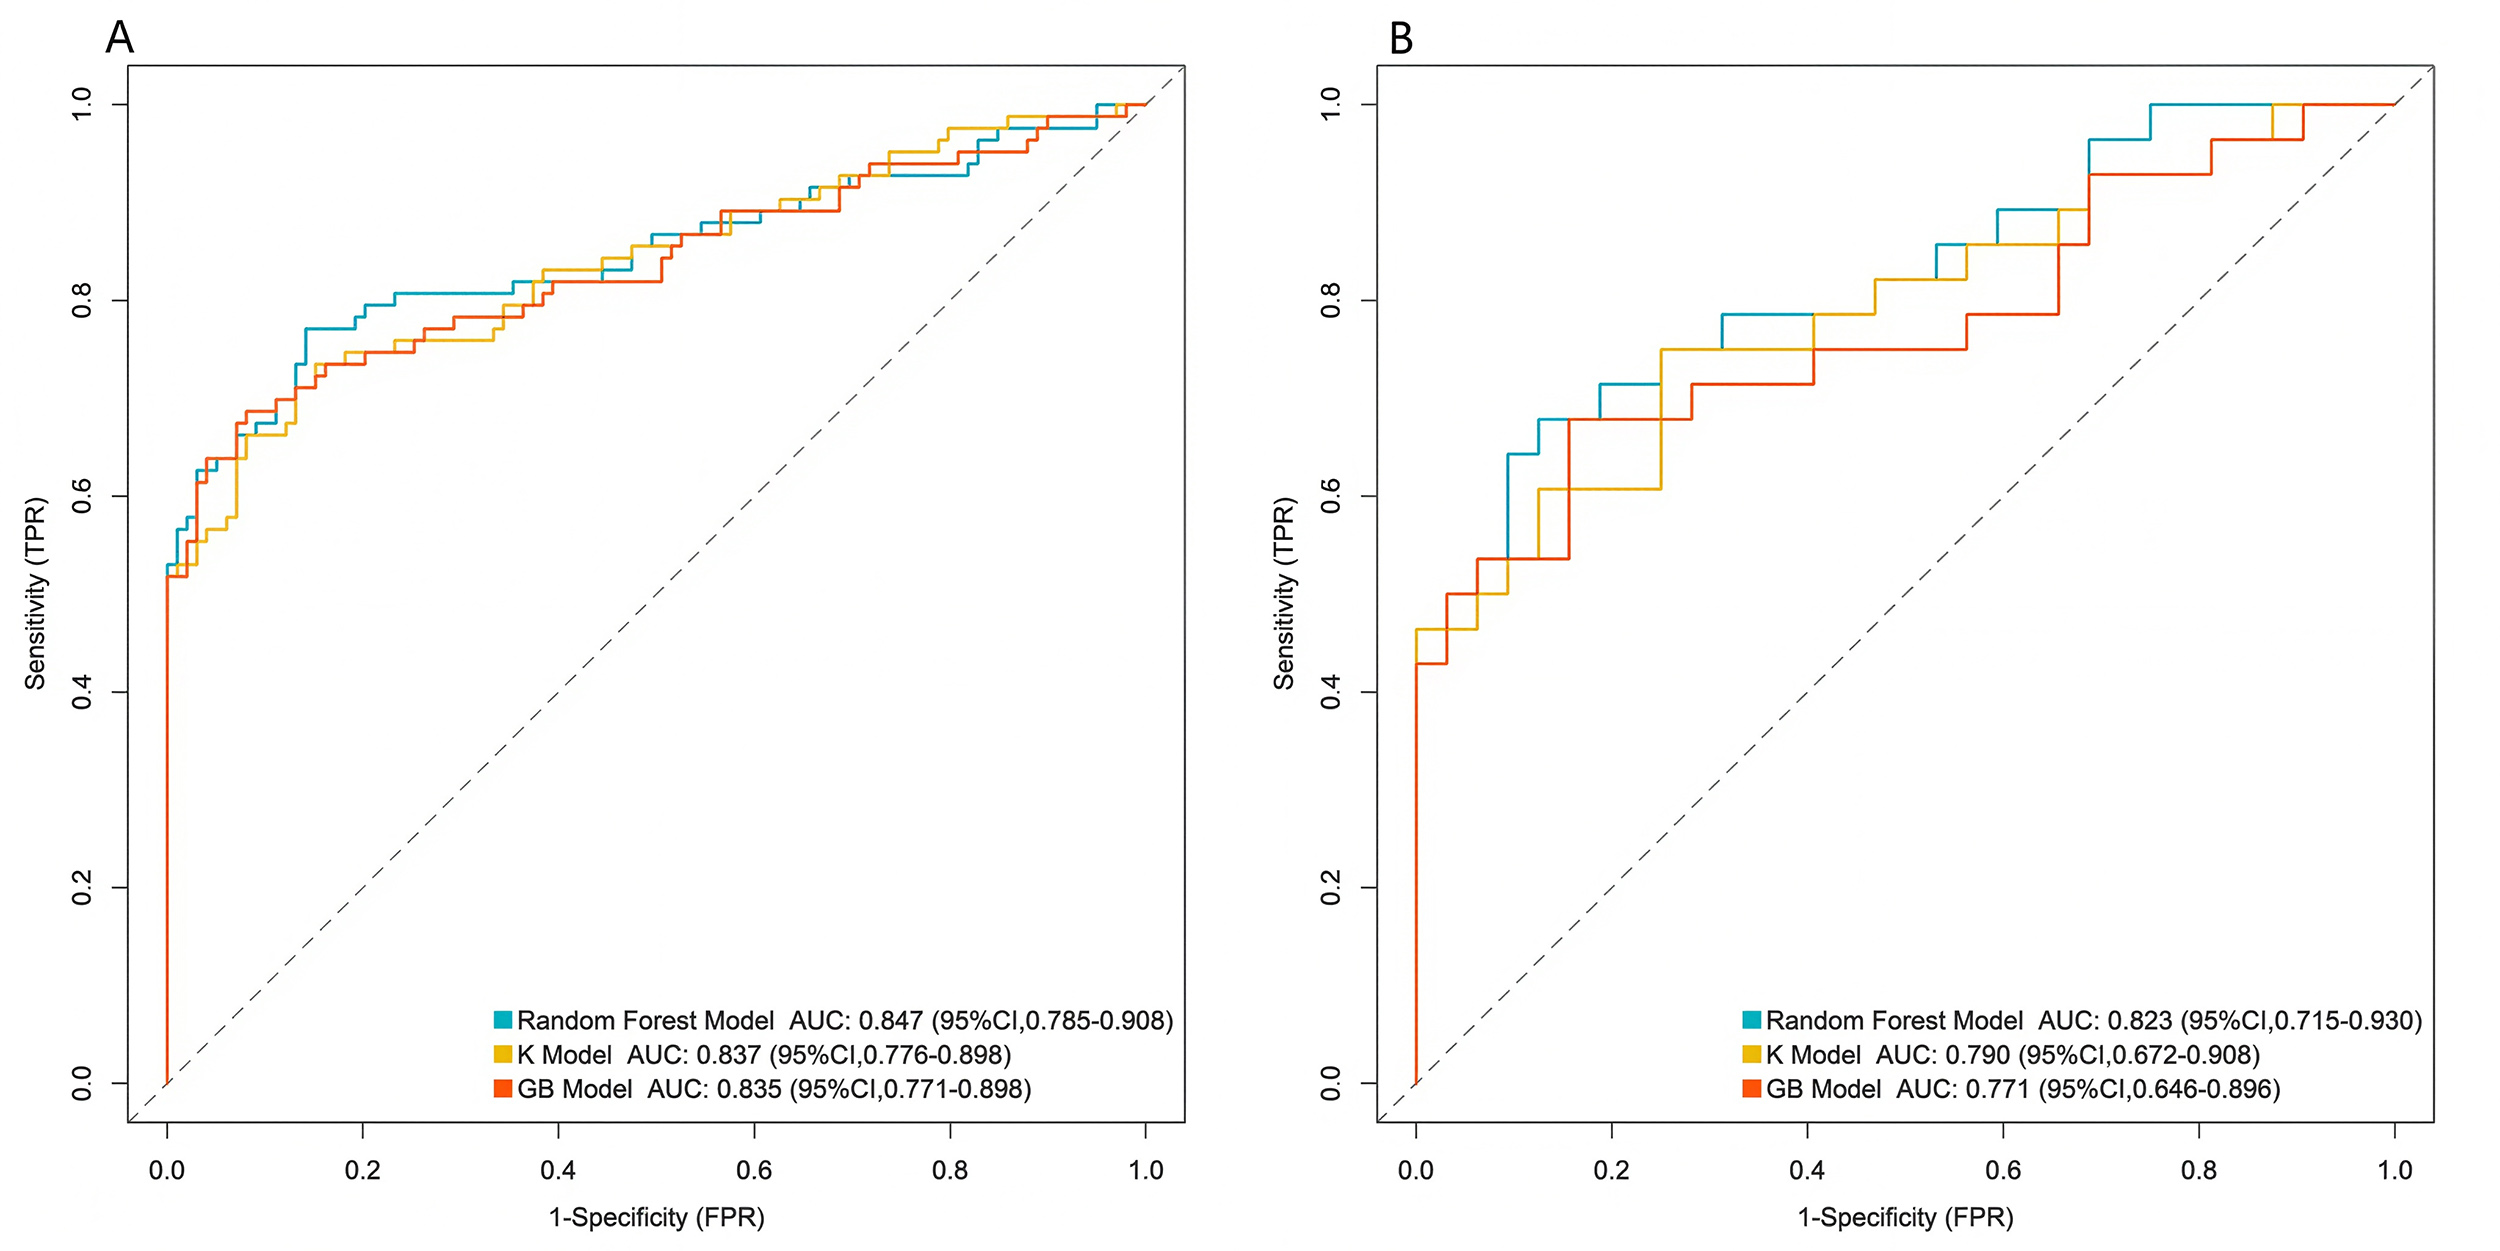 Fig. 2.
Area under the receiver operating characteristic curve of machine learning models. (A) The training set. (B) The validation set. K Model, K-Nearest Neighbors Model; GB Model, gradient boosting Model; AUC, area under the receiver operating characteristic curve; TPR, true positive rate.
| Model | Training set AUC | Validation set AUC | Validation set sensitivity | Validation set specificity |
|---|---|---|---|---|
| Random Forest Model | 0.847 | 0.823 | 0.750 | 0.801 |
| K-Nearest Neighbors Model | 0.837 | 0.790 | 0.708 | 0.776 |
| Gradient Boosting Model | 0.835 | 0.771 | 0.667 | 0.769 |
| EuroSCORE Ⅱ | - | 0.723 | 0.625 | 0.714 |
EuroSCORE II, European System for Cardiac Operative Risk Evaluation II.
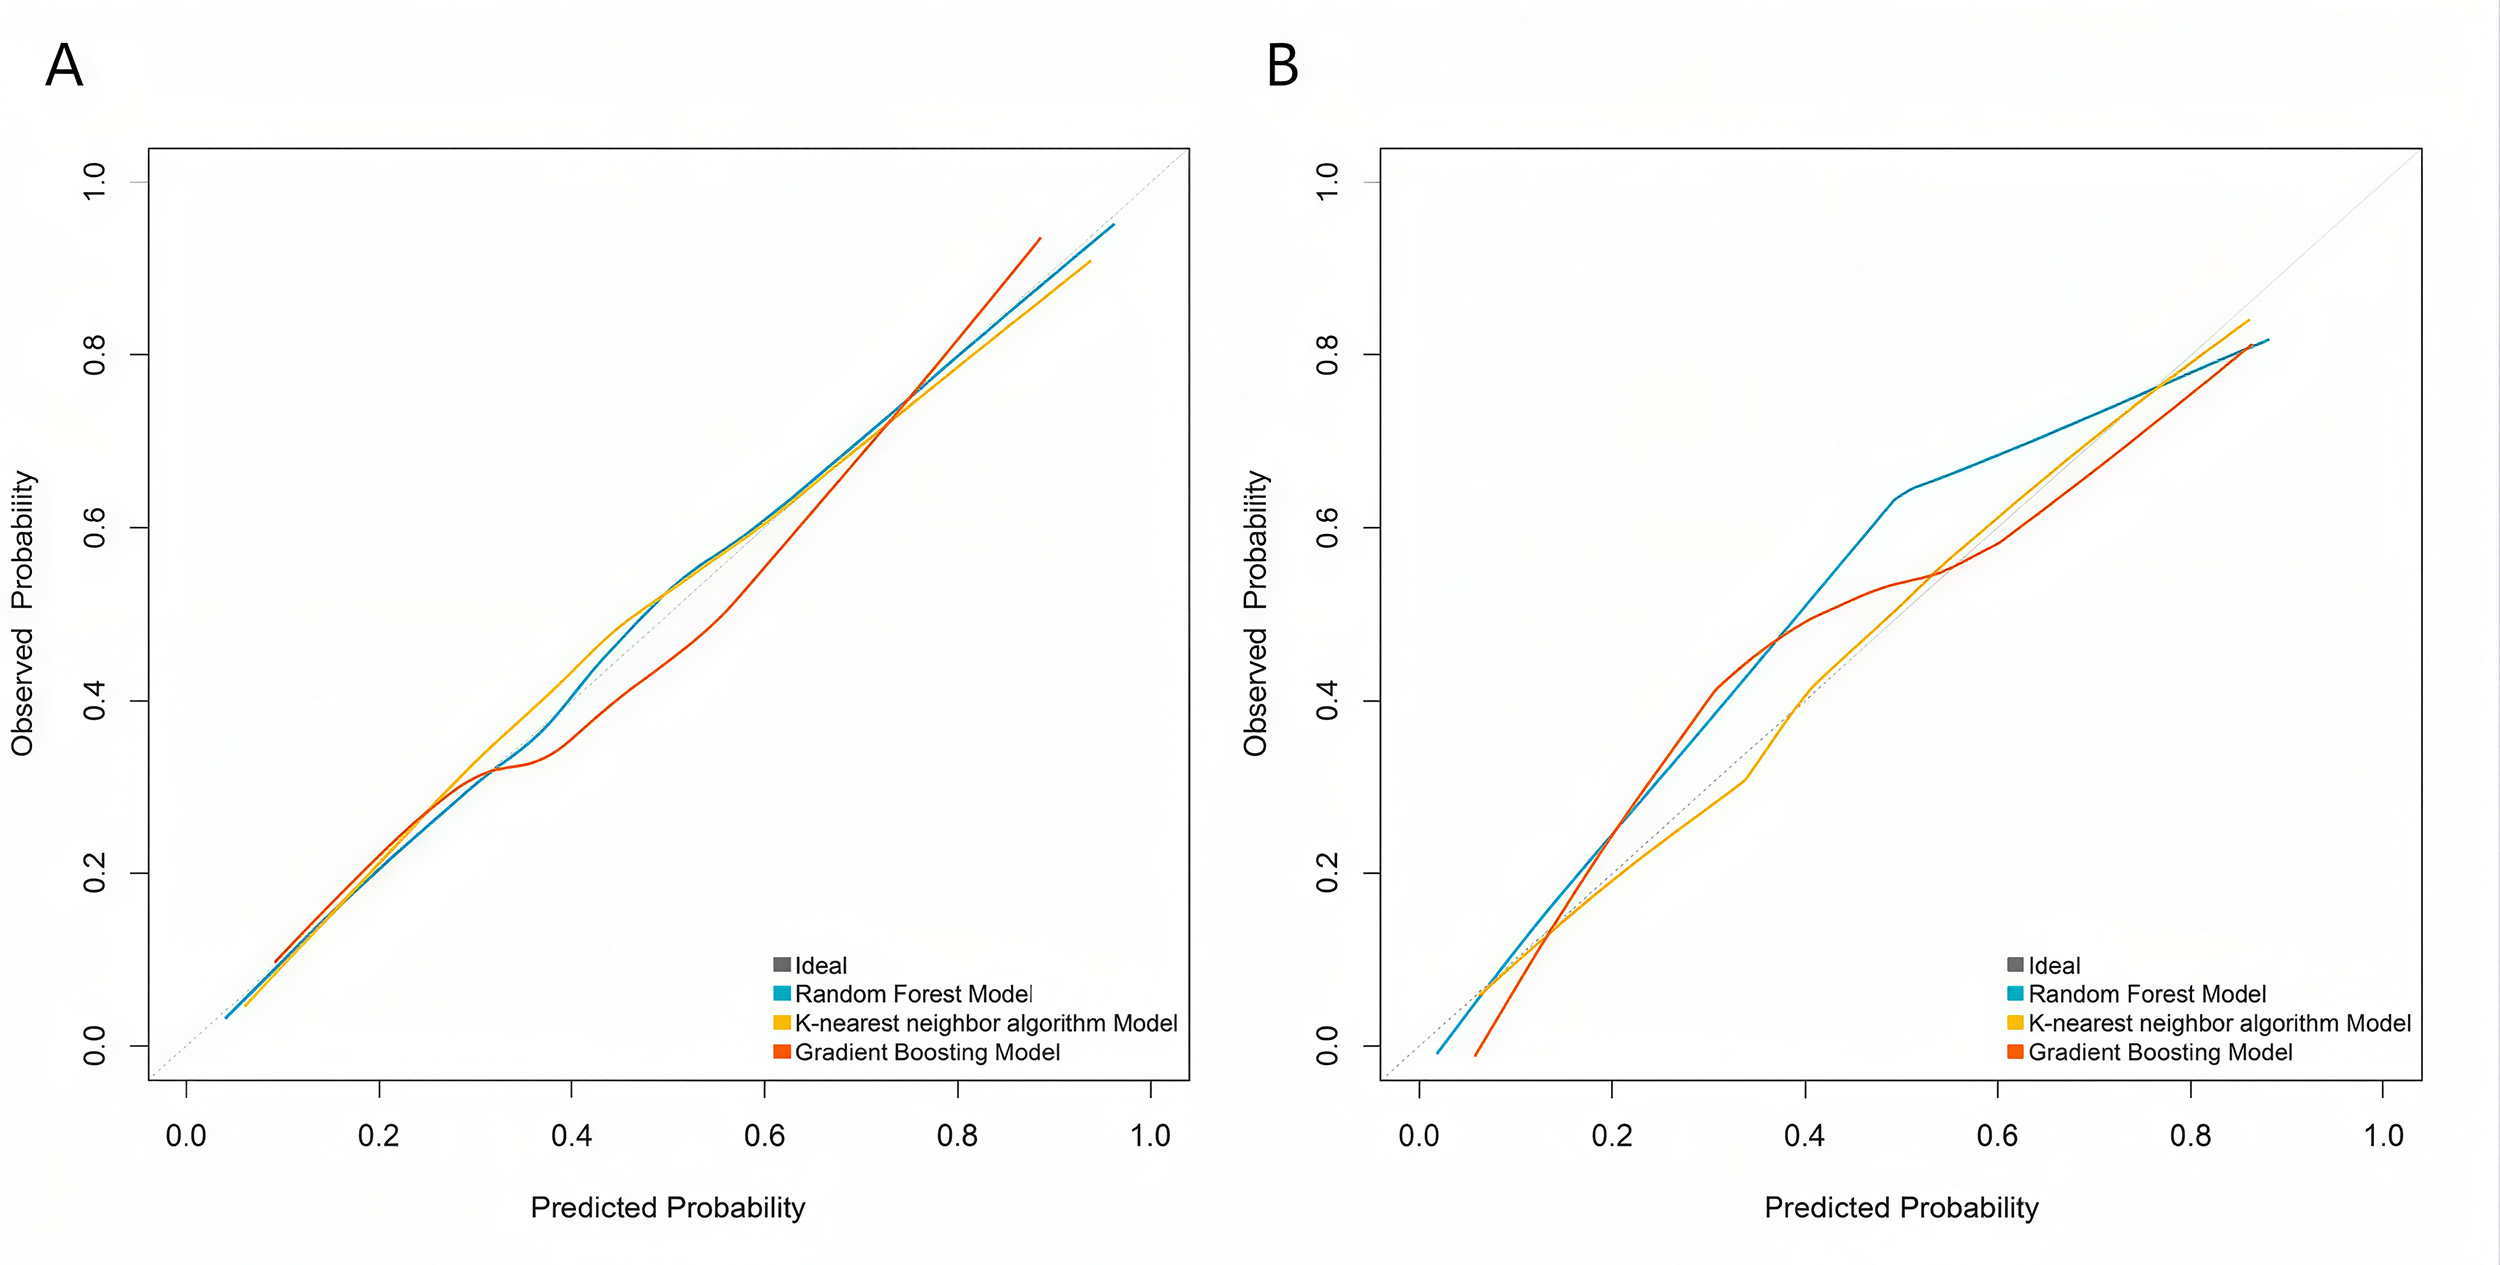
Furthermore, calibration analysis was performed for the RF Model. The Brier score for the validation set was 0.124, where a lower score indicates better model calibration. The calibration curve demonstrated good agreement between the predicted probability of MACE and the actual observed frequency, without significant systematic overestimation or underestimation (Fig. 3).
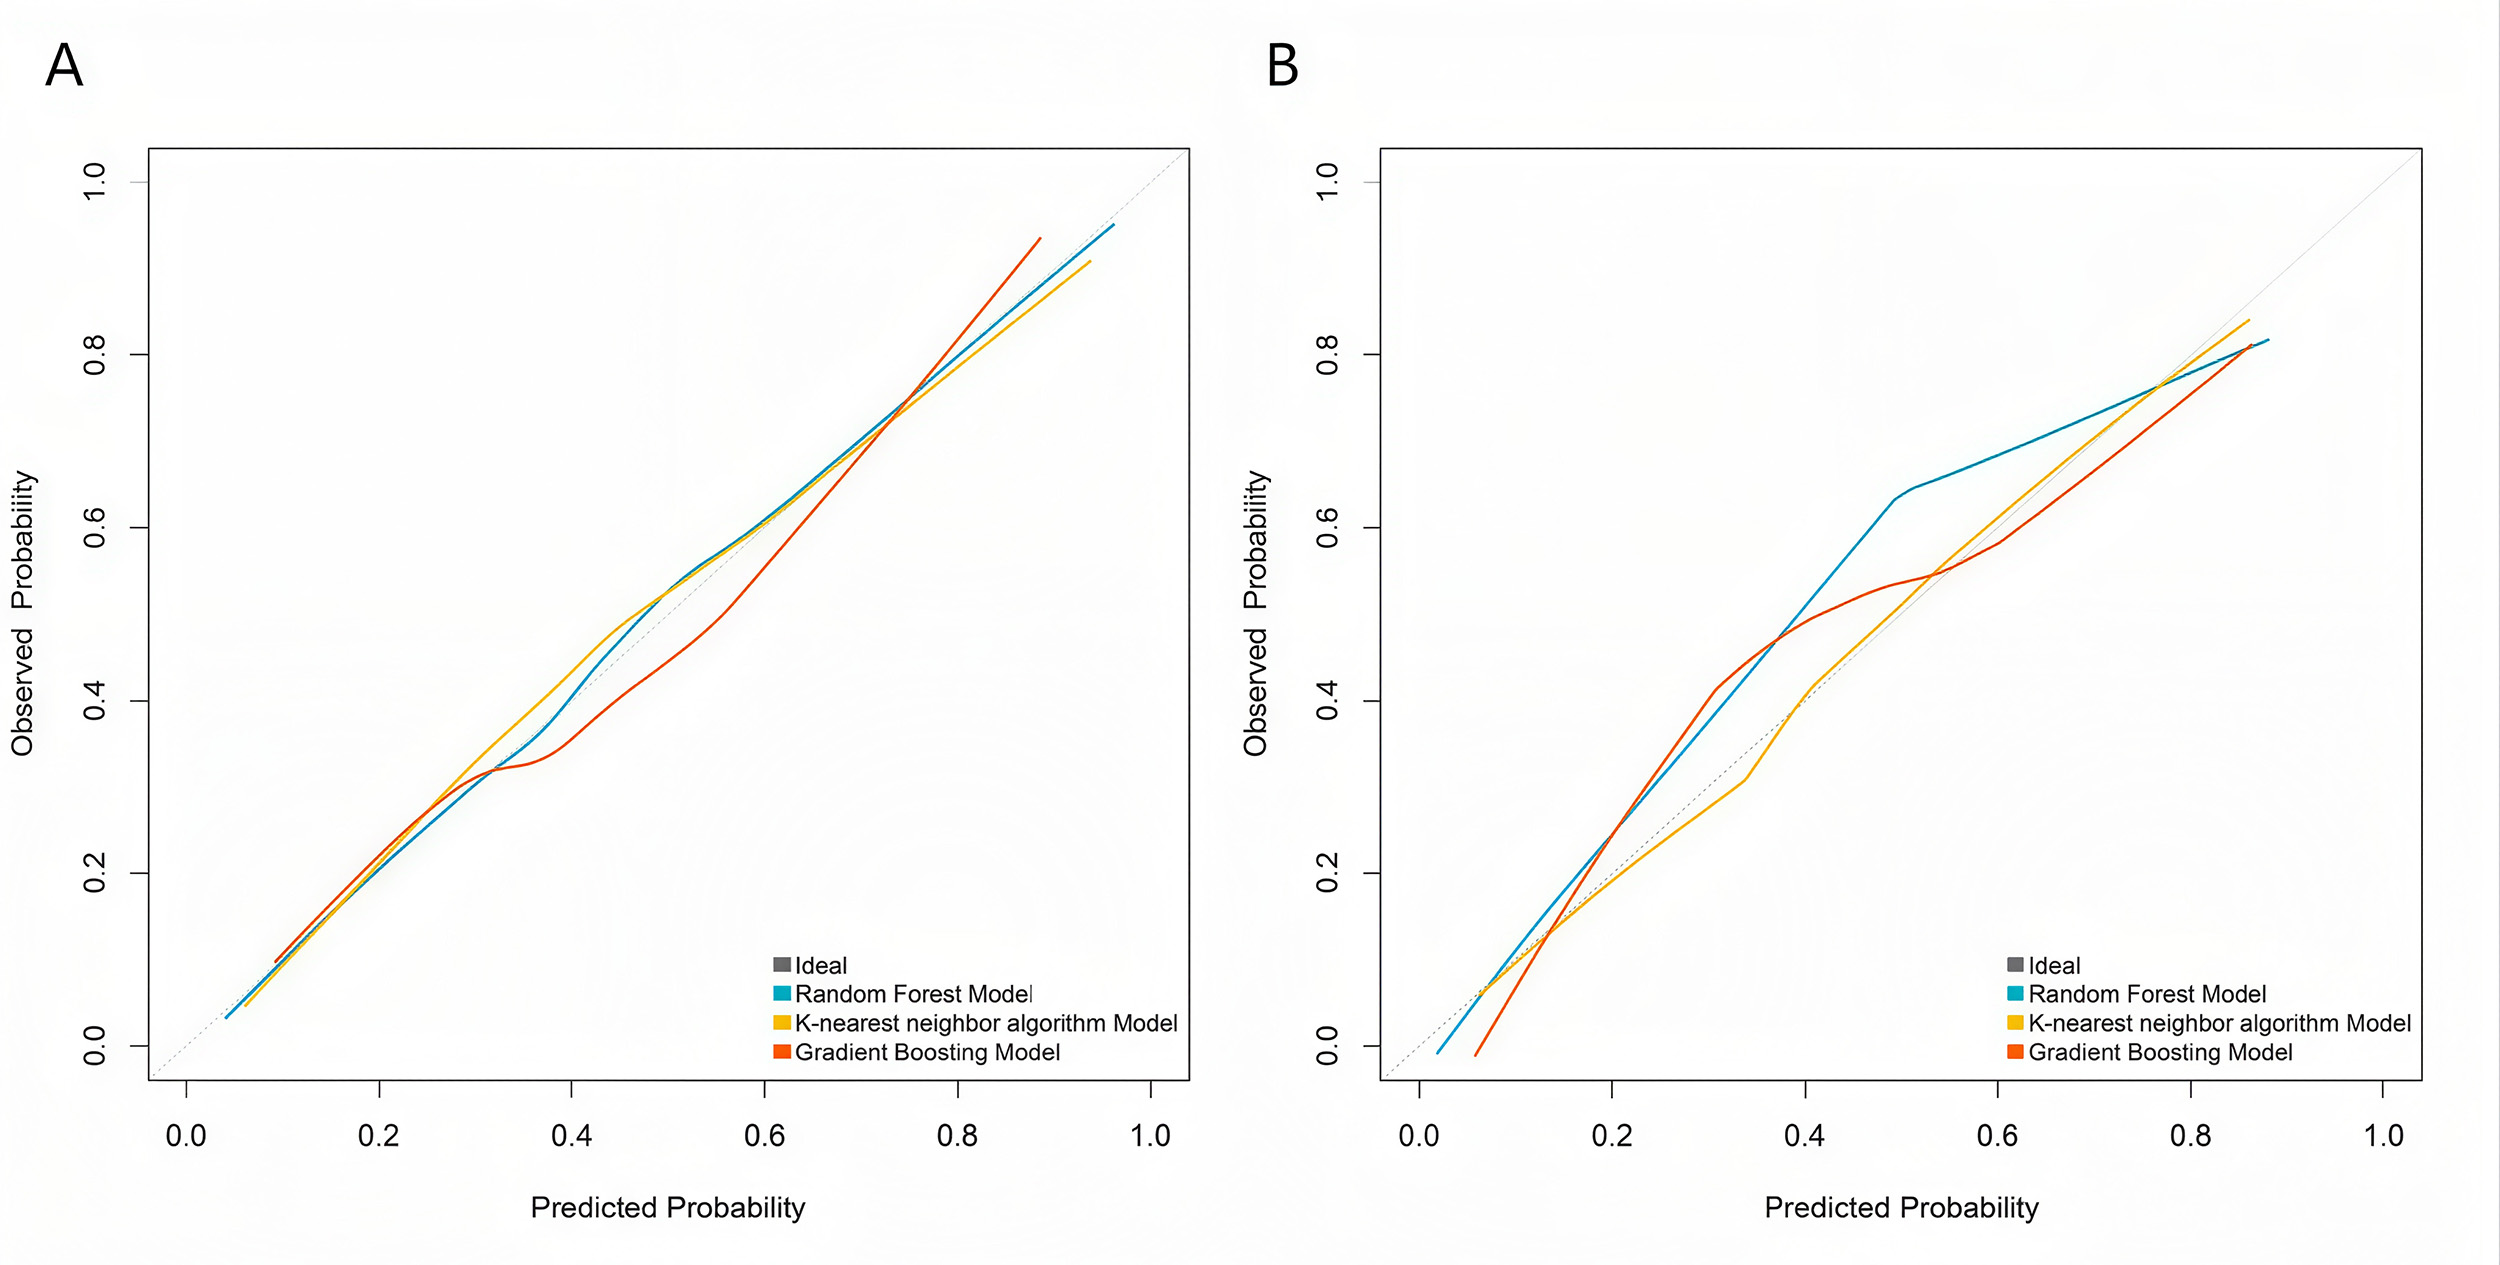 Fig. 3.
Calibration curves of machine learning models. (A) Training set. (B) Validation set.
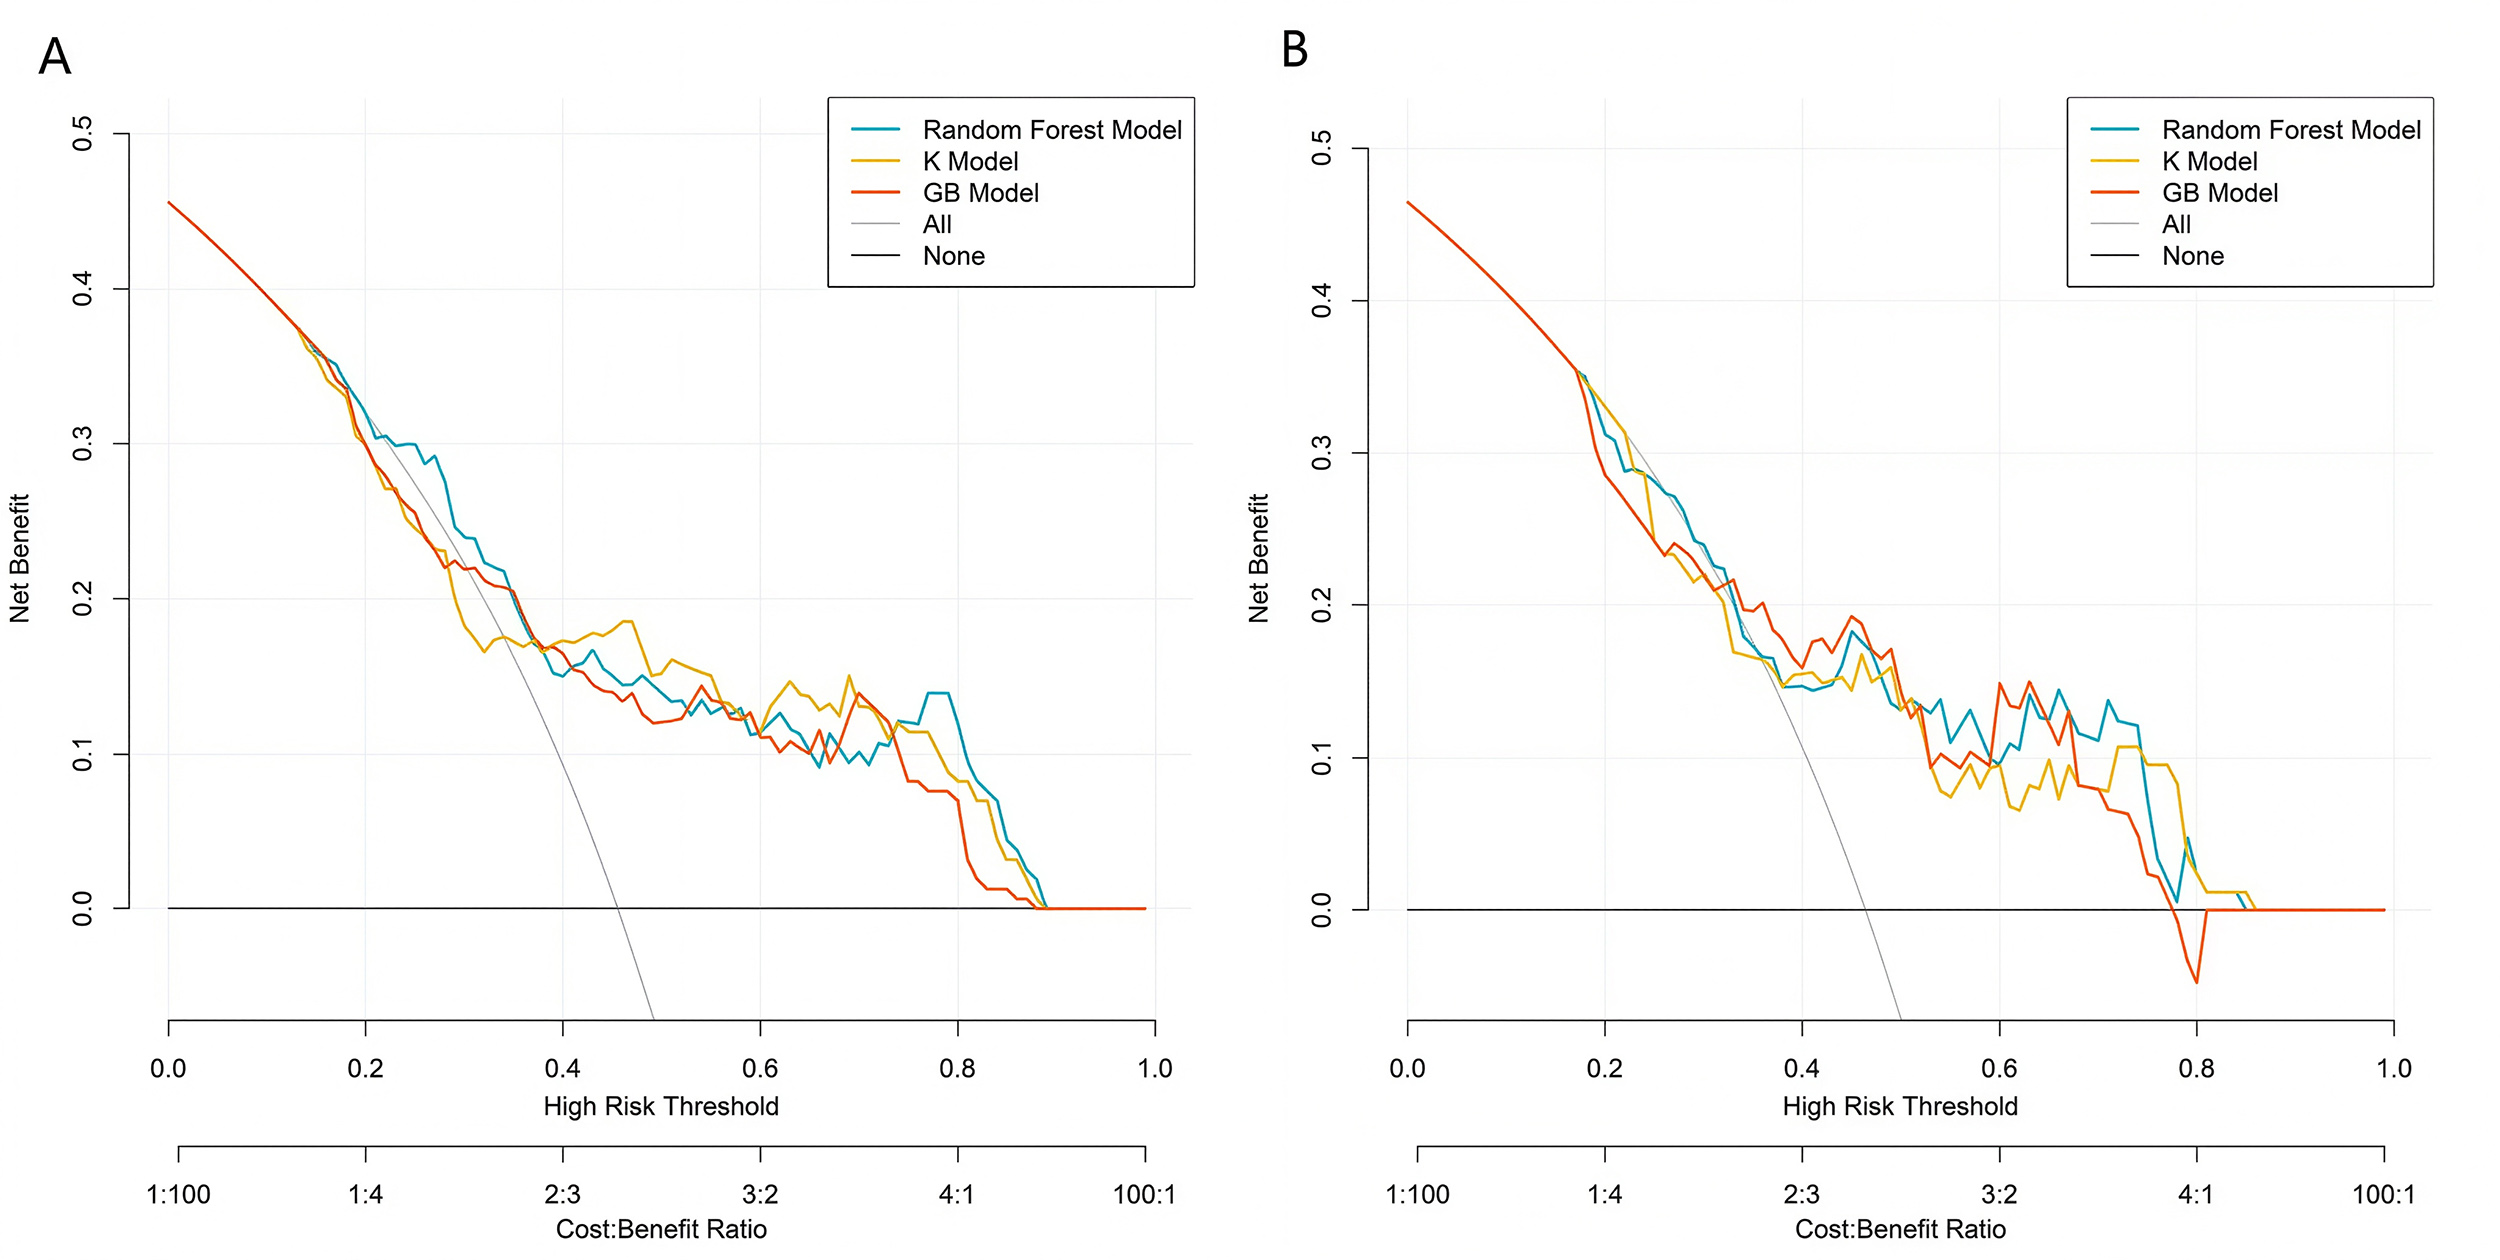
DCA showed that across a wide range of clinical decision thresholds (high-risk probability threshold approximately 0.1–0.5), the net clinical benefit curve of the RF Model was consistently higher than the “treat all” and “treat none” strategies, indicating that using it to guide clinical decisions (e.g., intensifying interventions for high-risk patients) could yield greater net clinical benefit (Fig. 4). The net benefits of the K Model and the GB Model were also superior to the simple strategies but lower than those of the RF Model. Compared with the currently used EuroSCORE II score, the RF Model demonstrated significant reclassification improvement, with a net reclassification improvement index of 0.250 (95% CI: 0.070–0.430, p = 0.006) and an integrated discrimination improvement index of 0.080 (95% CI: 0.030–0.130, p = 0.001). After stratifying patients into low-, medium-, and high-risk groups based on the model’s predicted probabilities, the actual incidence of MACE in the high-risk group (45.2%) was significantly higher than that in the medium-risk (17.3%) and low-risk (3.8%) groups (p for trend <0.001), confirming the model’s good risk stratification capability.
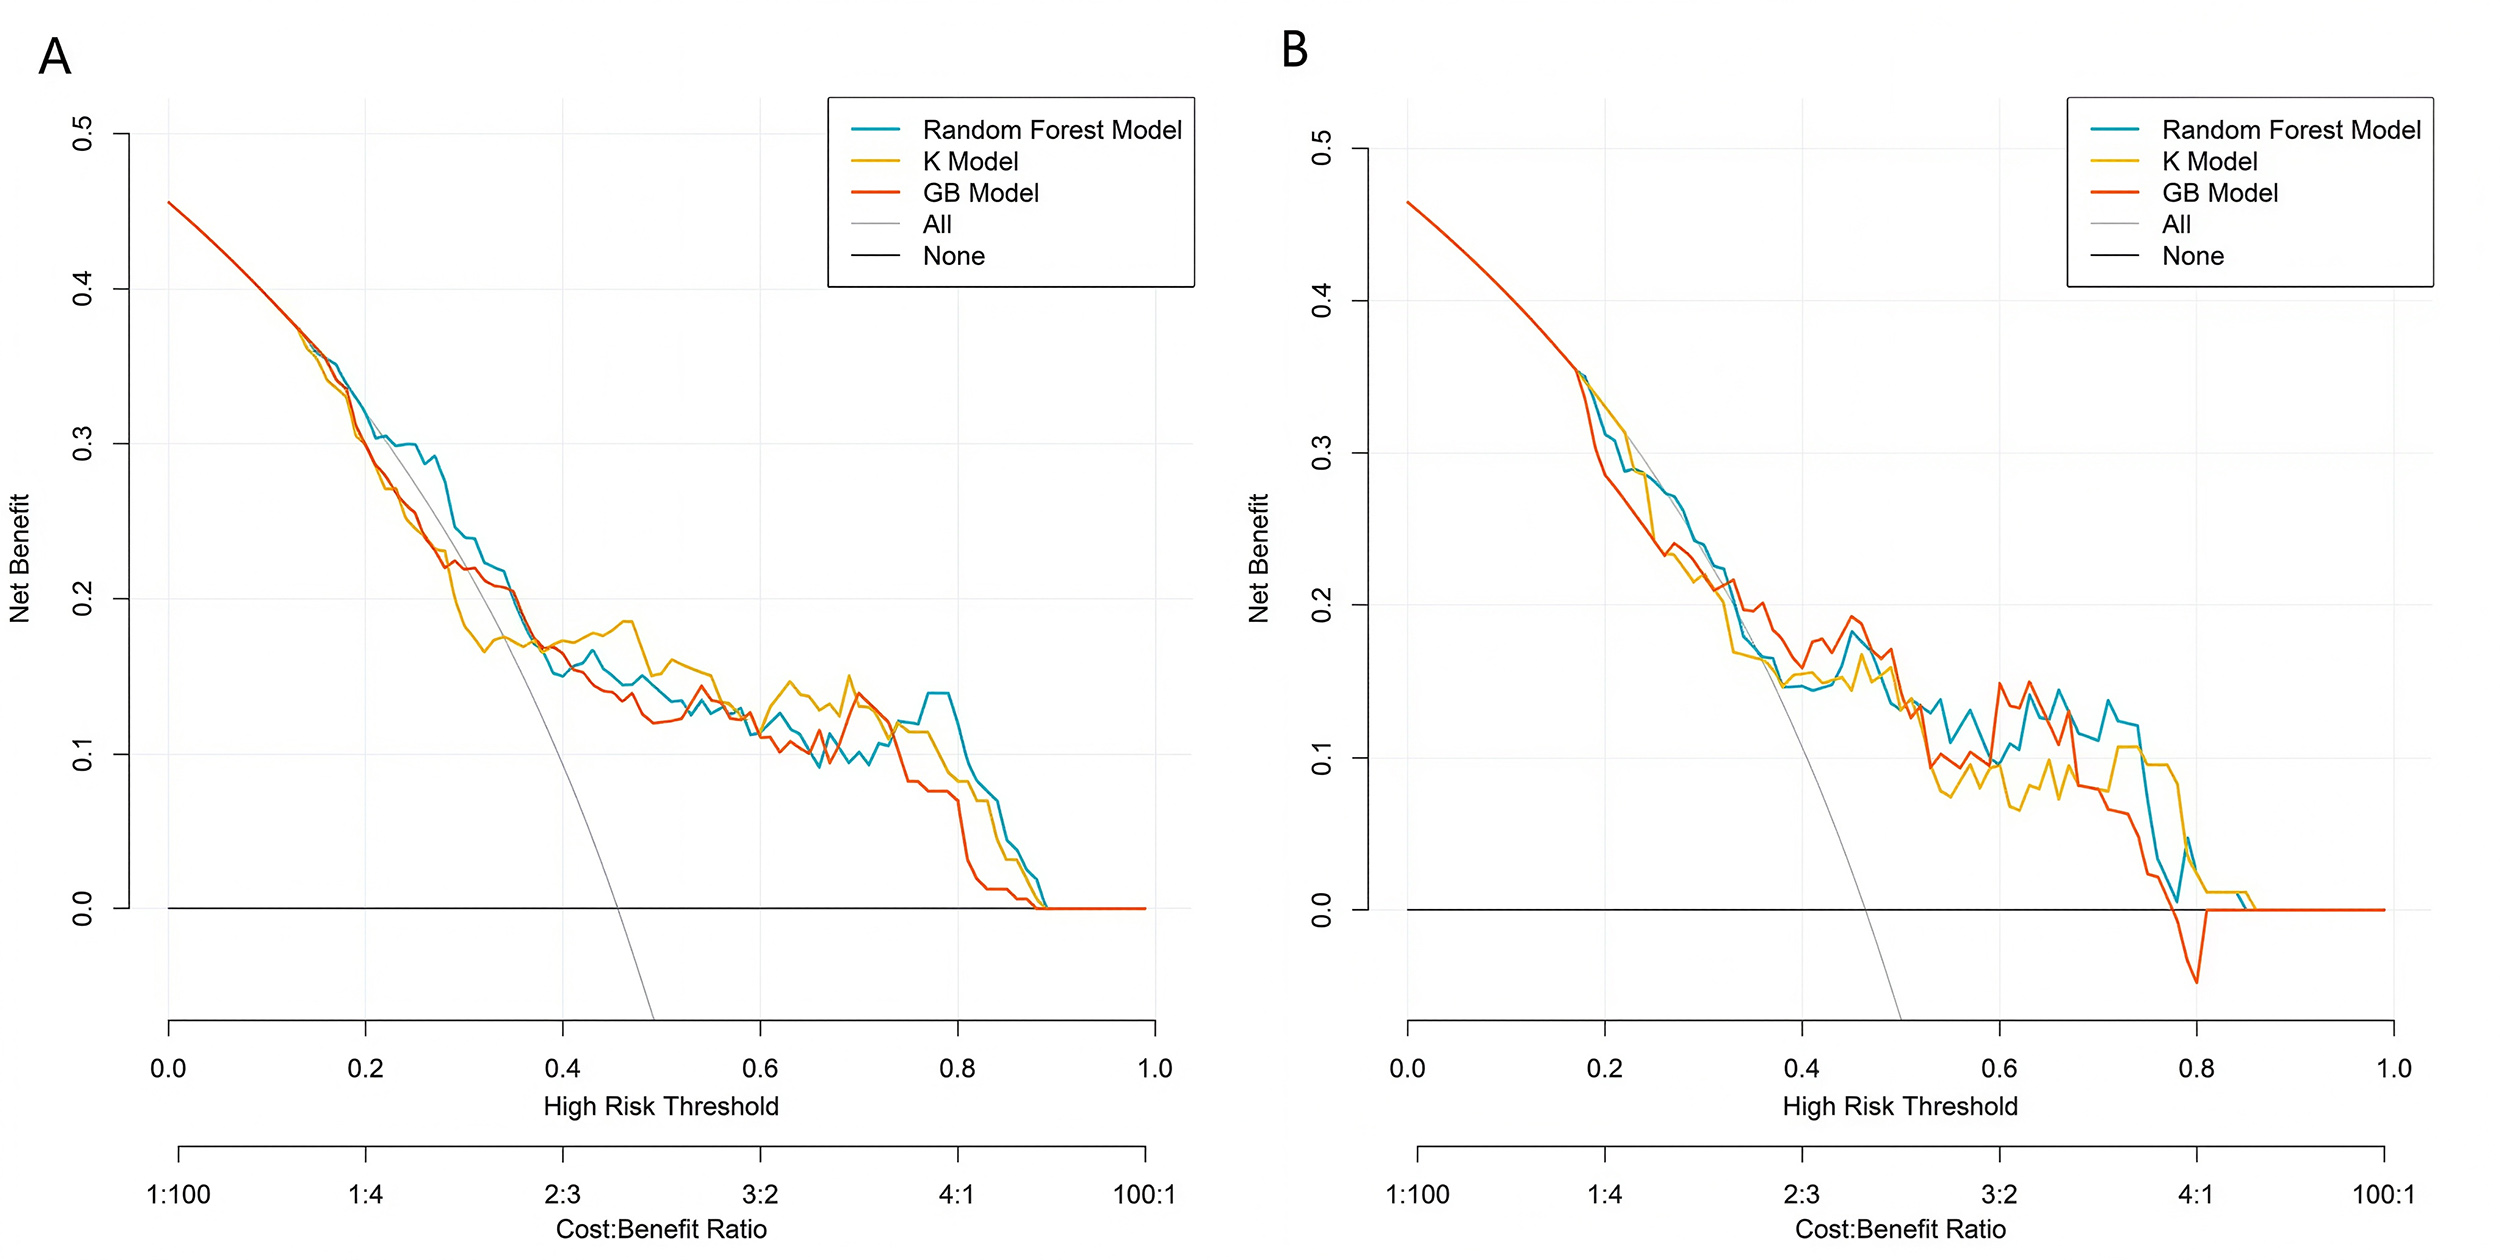 Fig. 4.
Decision curves of machine learning models. (A) Training set. (B) Validation set.
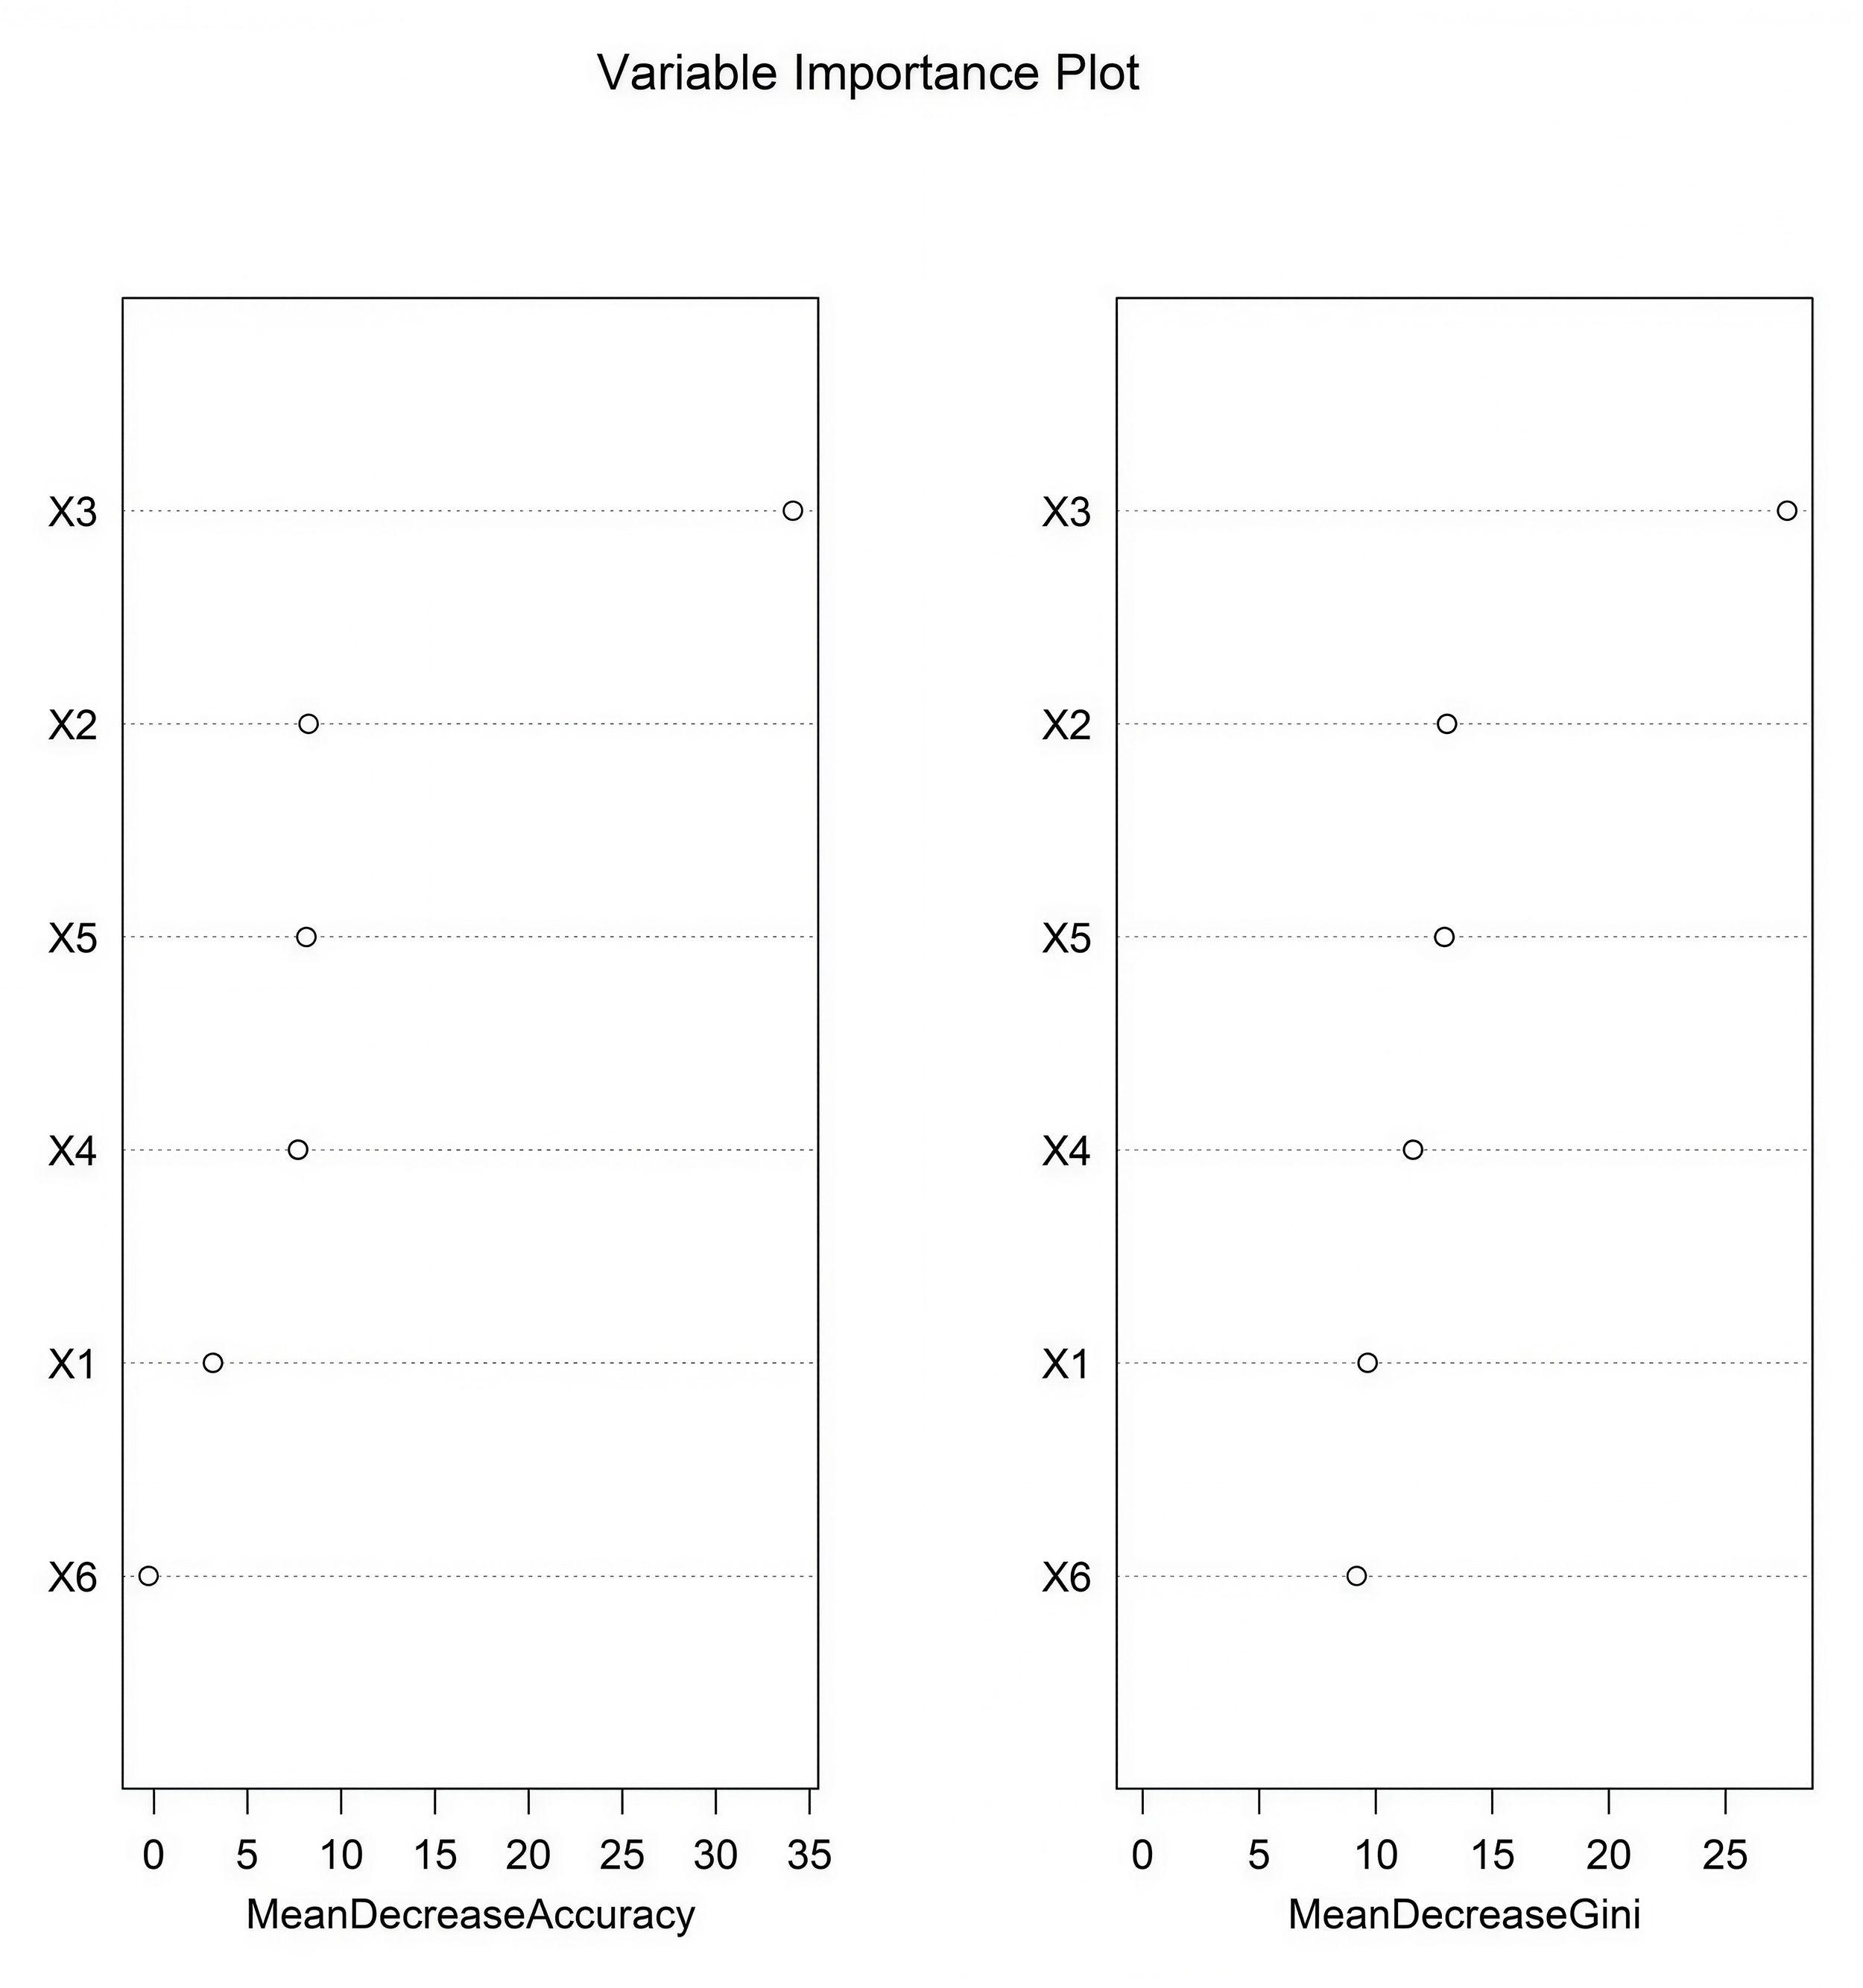
As the number of decision trees increased, the overall error gradually stabilized. This change trend reflected the dynamic change characteristics of the predictive performance of the model during the iterative construction of decision trees. This trend can be used to assist in judging the convergence of the model. When the error curve tended to be stable, it indicated that the model complexity reached a certain level, and the optimization effect of new decision trees on the error was limited. This provided a basis for parameter selection to determine the optimal number of decision trees and improve the predictive efficiency of the model, helping to screen out the configuration that could balance model complexity and prediction accuracy, so as to enhance the model’s performance in predicting the outcomes after heart valve replacement (Supplementary Fig. 4). Based on the RF Model, the importance scores of independent influencing factors for the outcomes after heart valve replacement were calculated. The importance ranking was as follows: EuroSCORE II, LVEF, cardiopulmonary bypass time, serum albumin, age, and aortic cross-clamp time (Fig. 5).
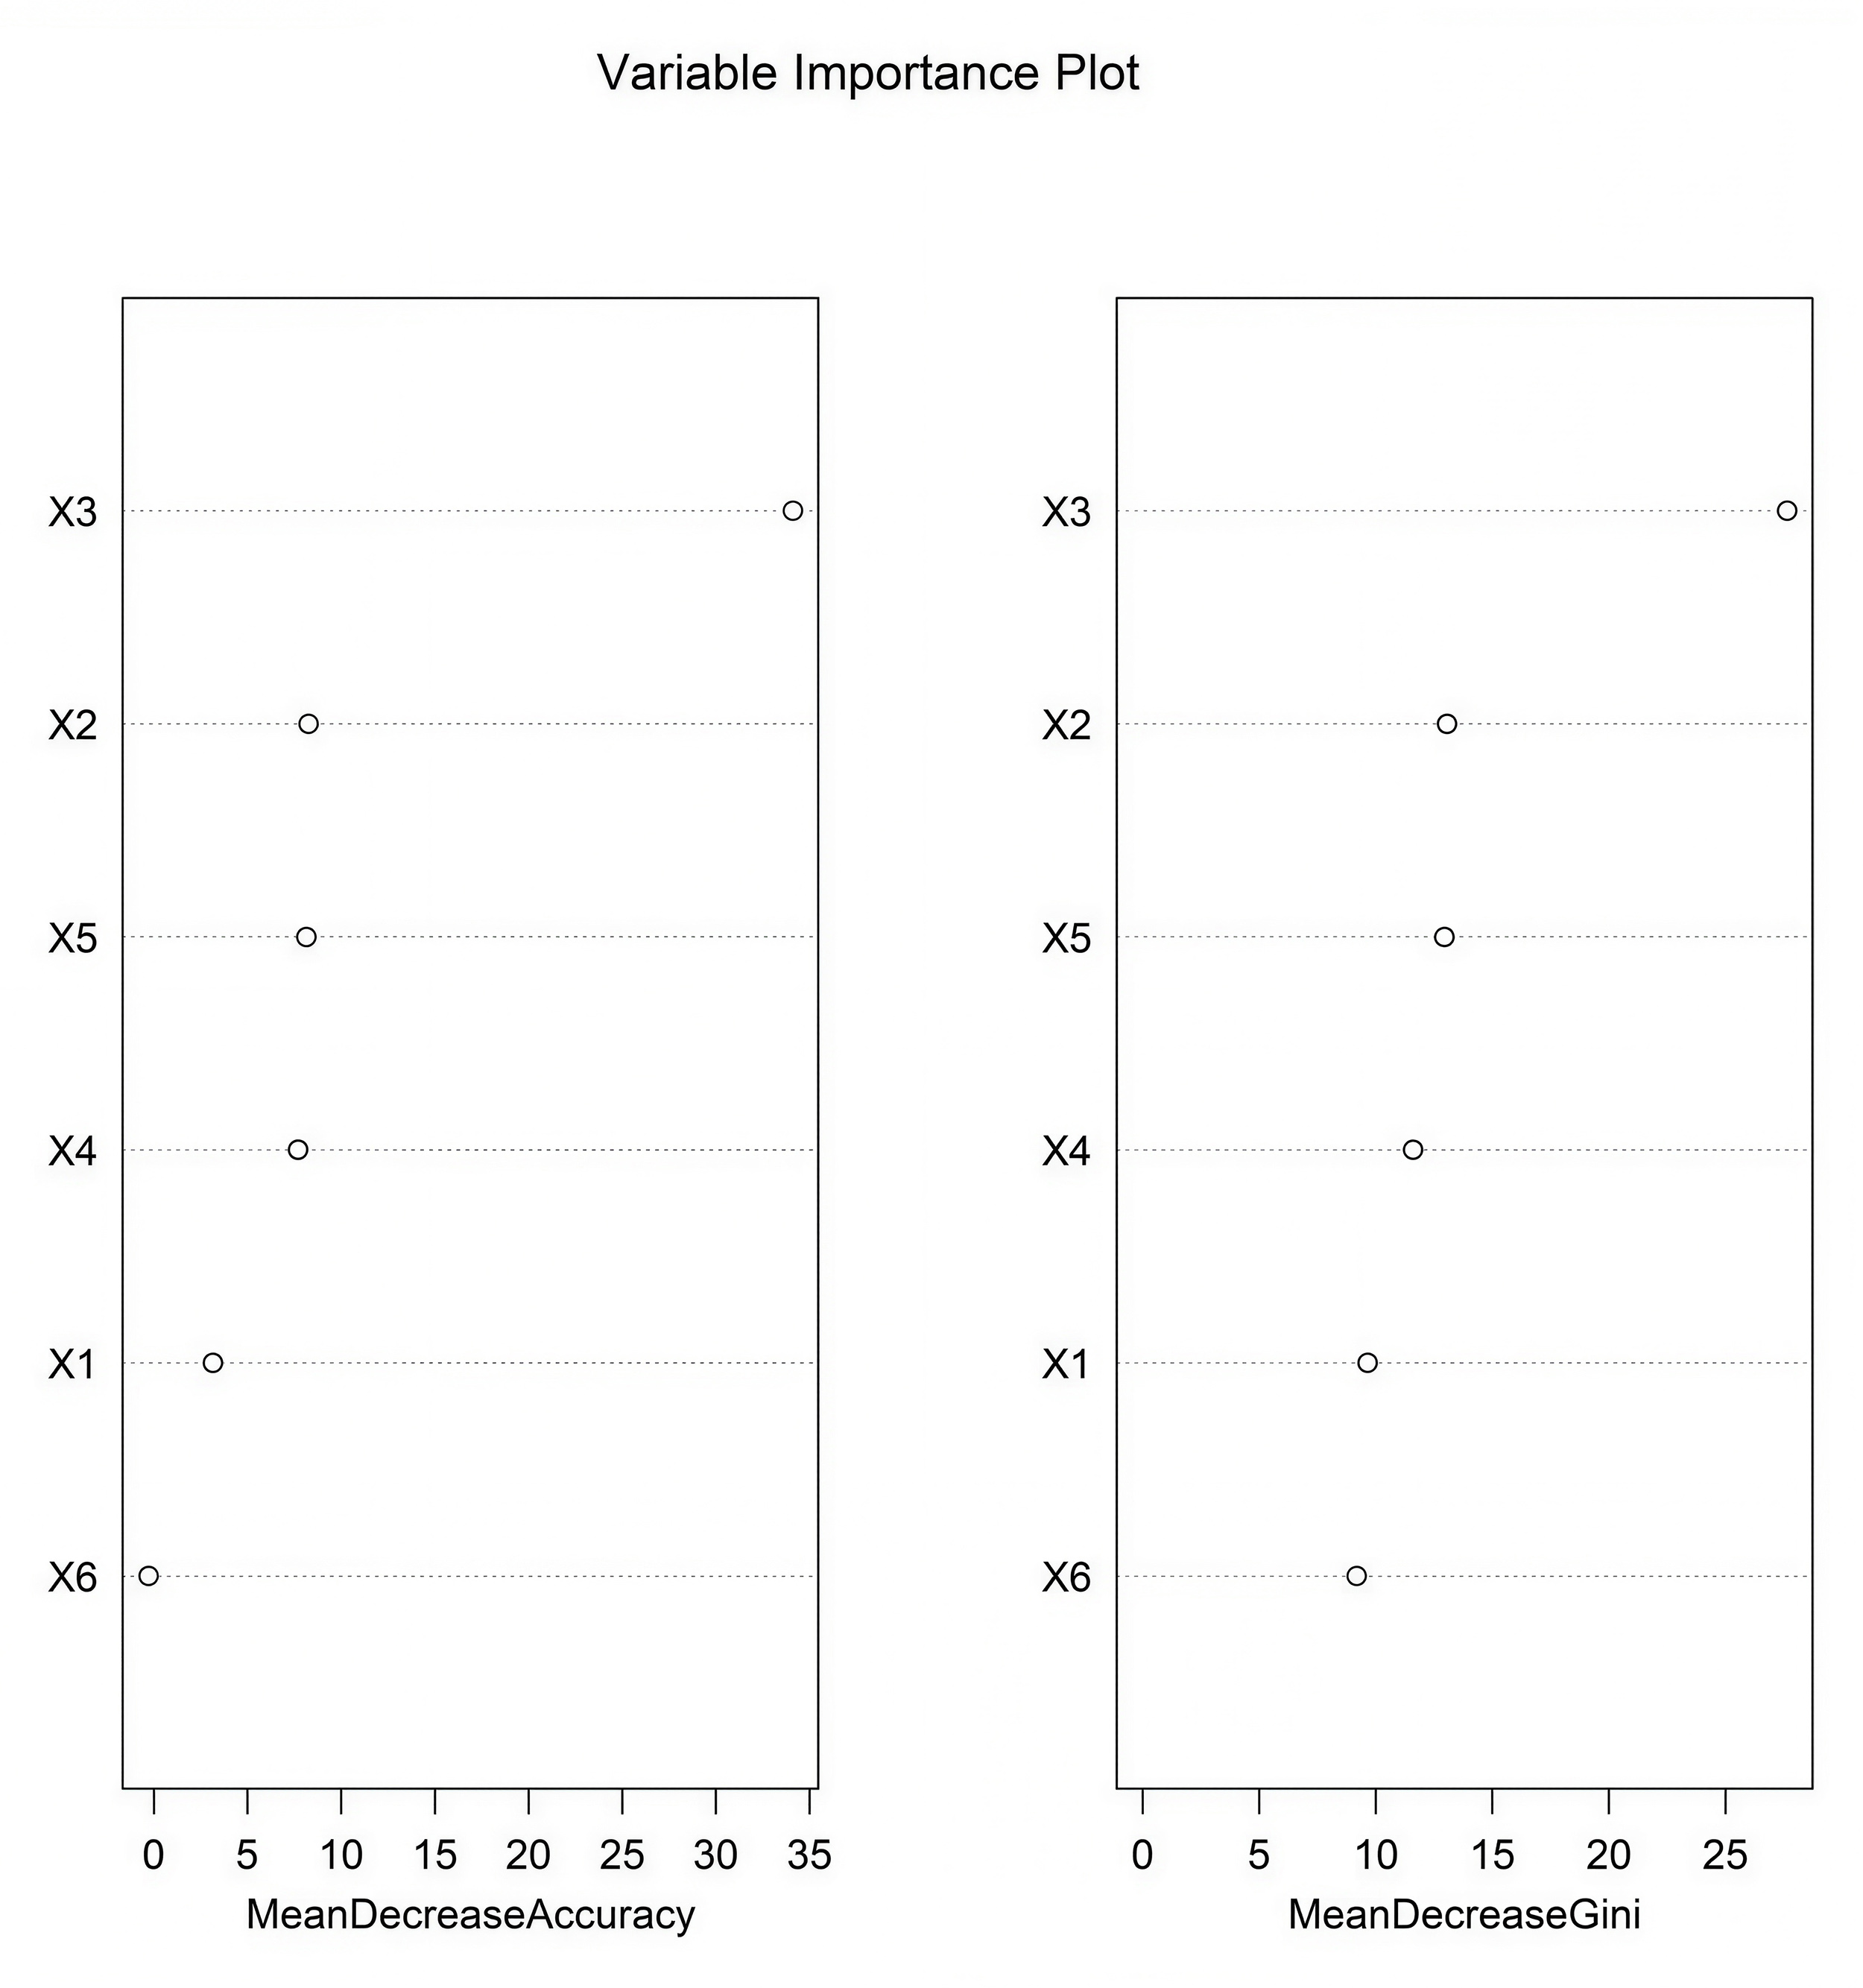 Fig. 5.
Importance ranking of the random forest model. X1, age; X2, left ventricular ejection fraction; X3, EuroSCORE II; X4, serum albumin; X5, cardiopulmonary bypass time; X6, aortic cross-clamp time.
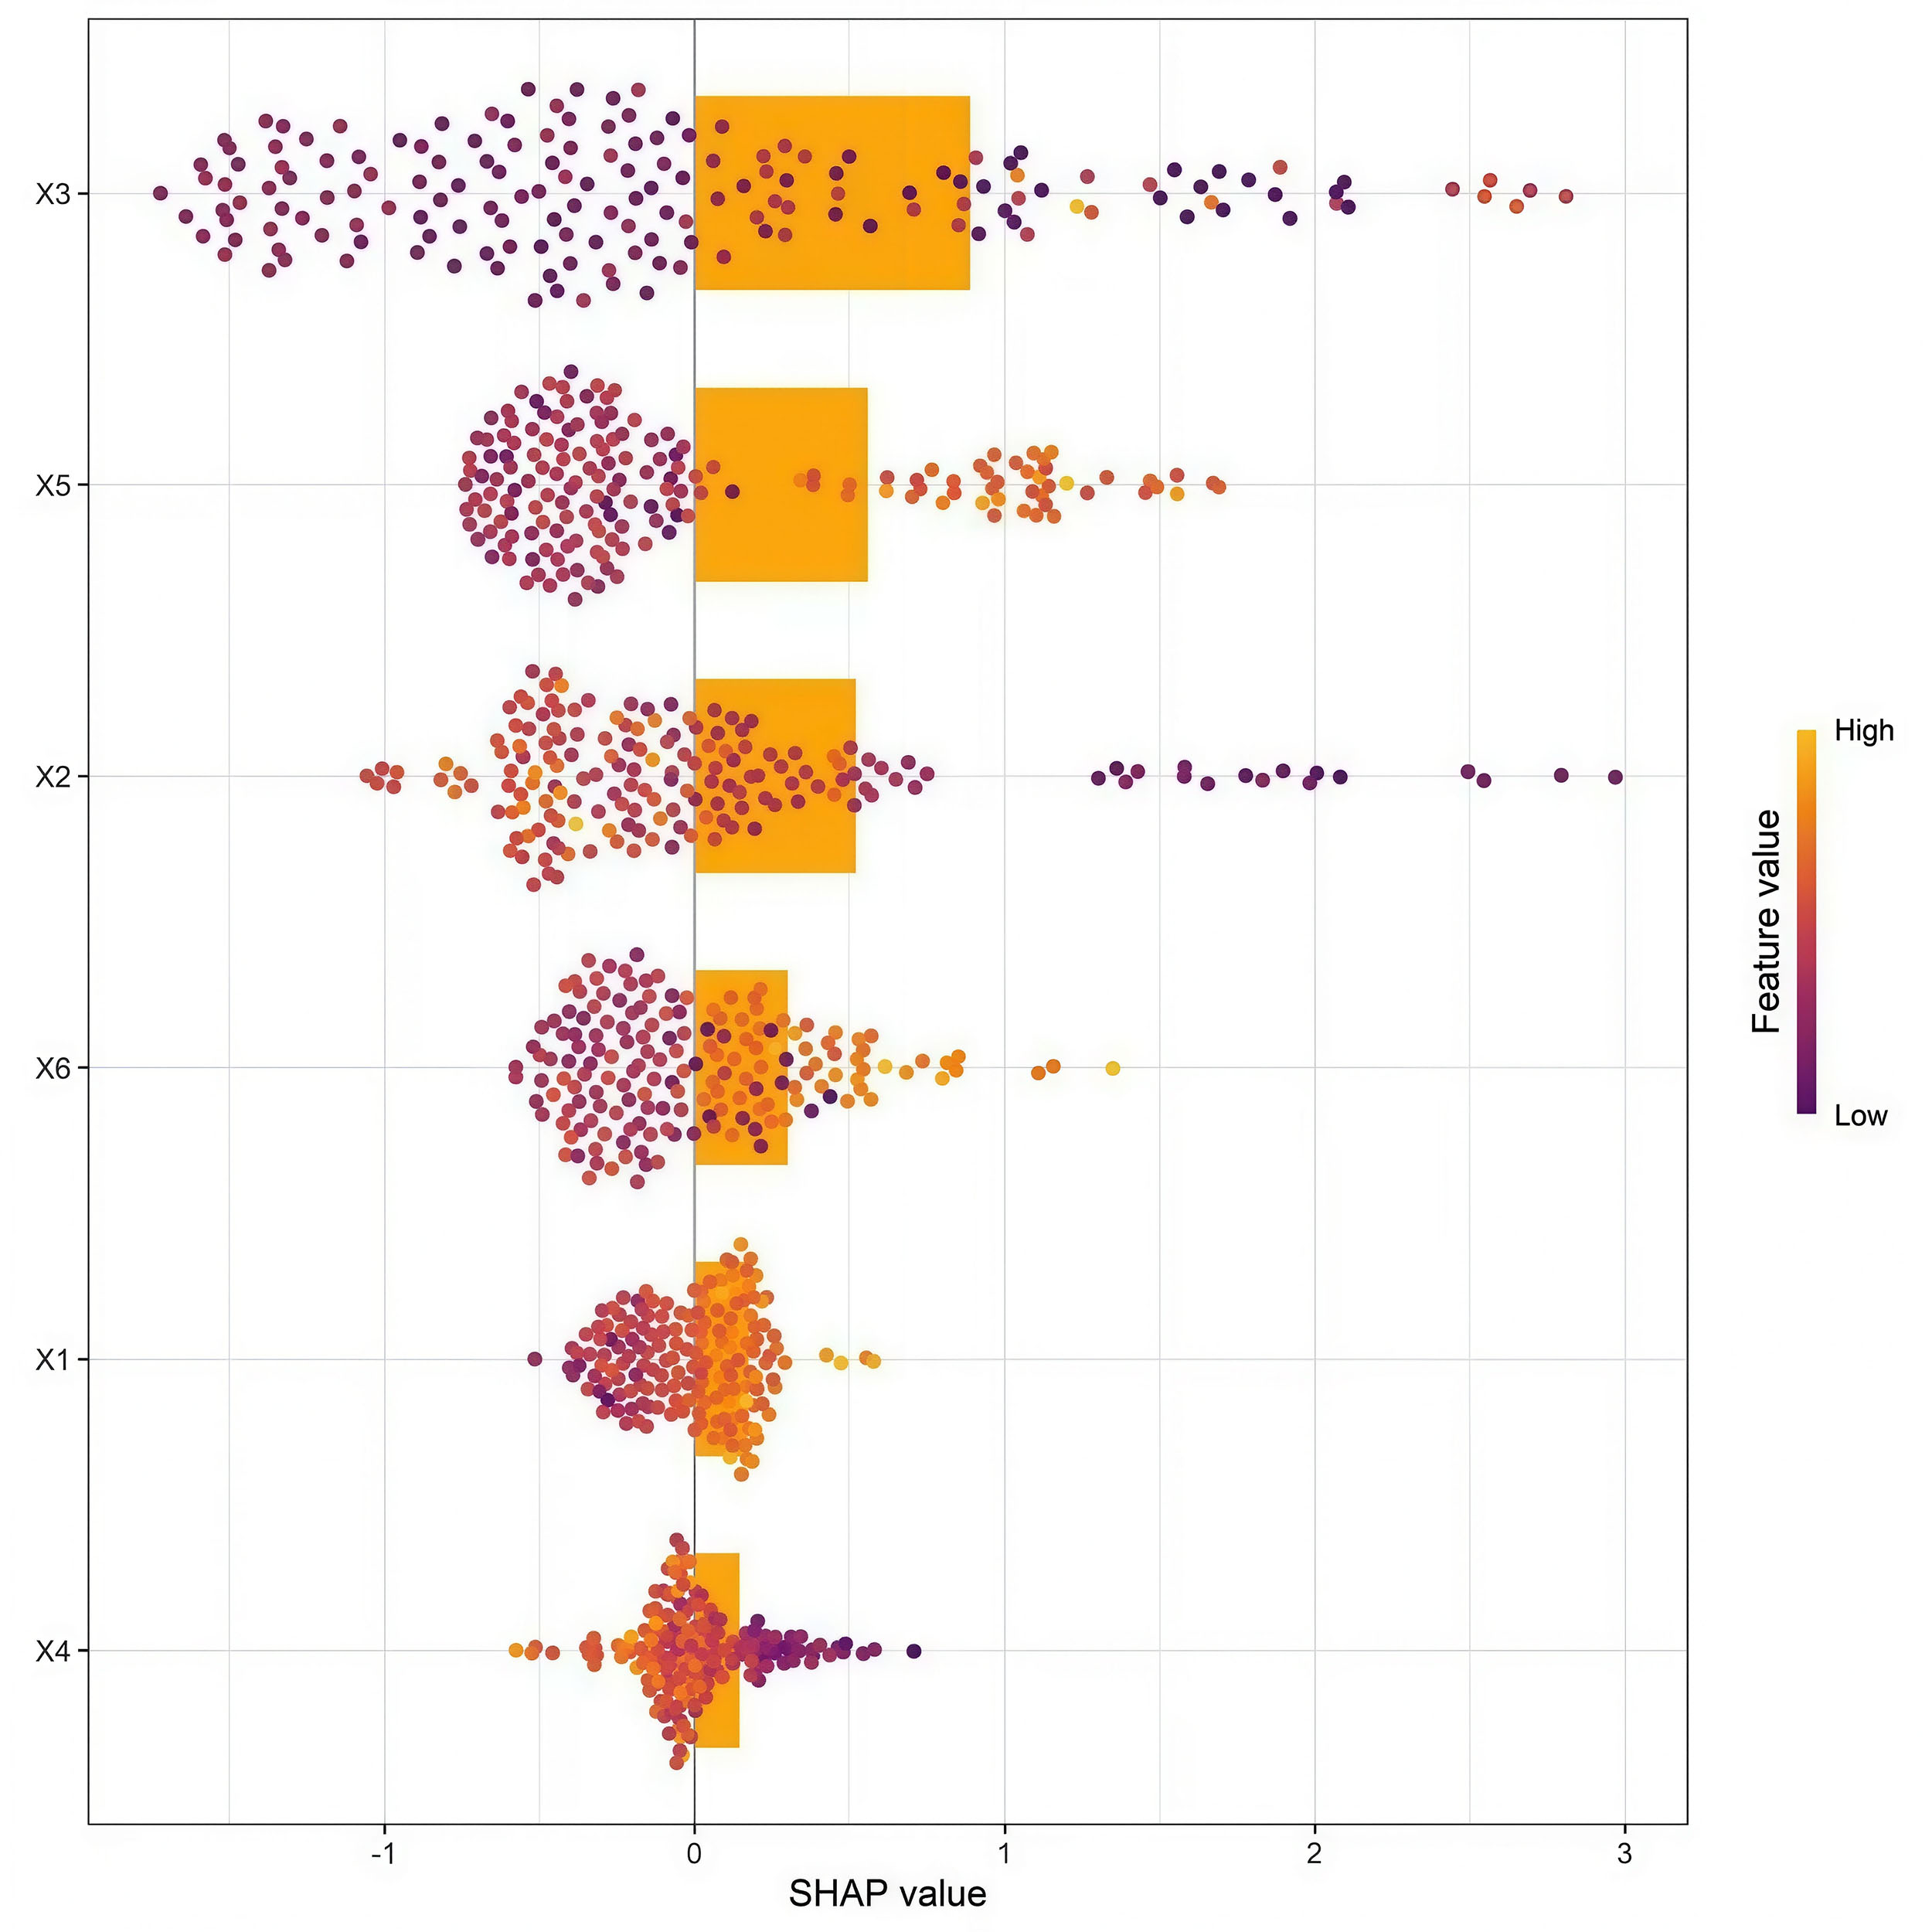
SHAP analysis was conducted to interpret the predictions of the optimal RF Model. The global feature importance ranking derived from mean absolute SHAP values was largely consistent with the Gini importance ranking reported earlier, with EuroSCORE II being the most influential predictor, followed by cardiopulmonary bypass time. Analysis of SHAP values showed the directional impact of each predictor: higher EuroSCORE II scores, longer cardiopulmonary bypass time, longer aortic cross-clamp time, and advanced age were associated with increased risk of MACE (positive SHAP values). Conversely, higher LVEF and serum albumin levels demonstrated a protective contribution, associated with a decrease in the model’s predicted risk. Furthermore, the SHAP dependence plots illustrated the non-linear relationships between key continuous predictors (e.g., cardiopulmonary bypass time) and the model’s predicted risk, demonstrating how risk increased with prolonged cardiopulmonary bypass time (Fig. 6).
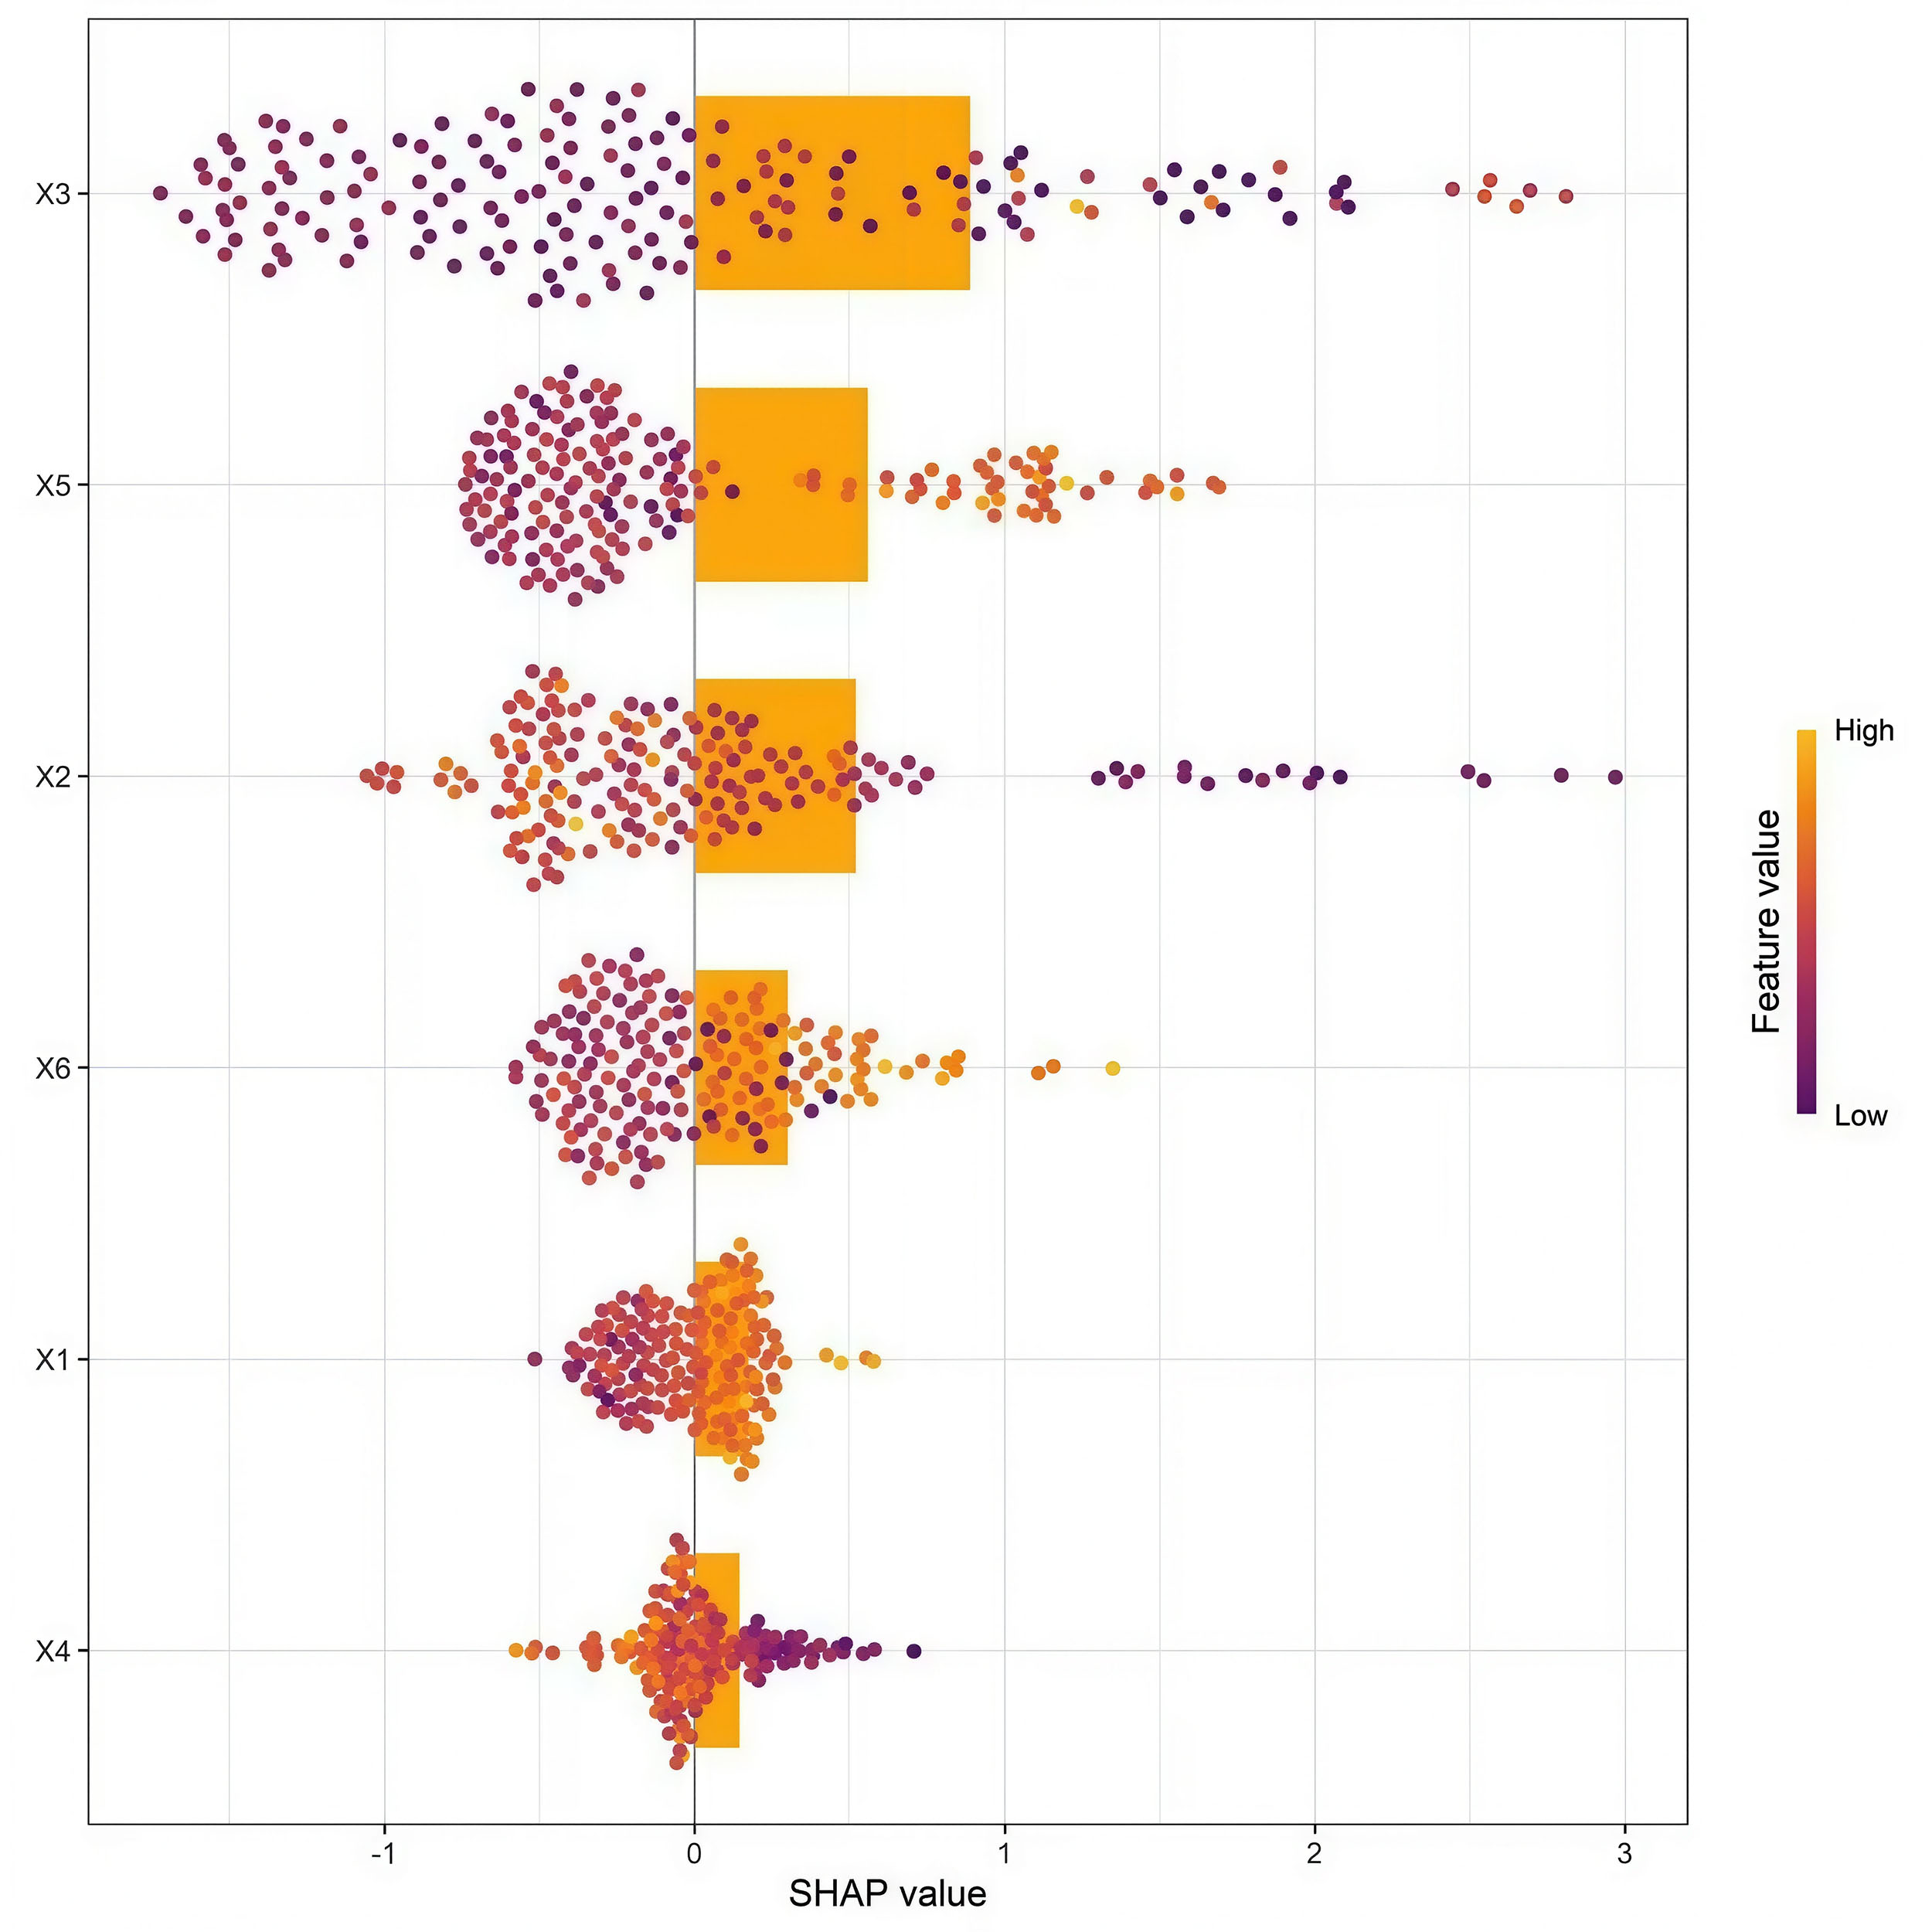 Fig. 6.
SHapley Additive exPlanations feature importance graph. X1, age; X2, left ventricular ejection fraction; X3, EuroSCORE II; X4, serum albumin; X5, cardiopulmonary bypass time; X6, aortic cross-clamp time.
In this study, a machine learning model for predicting MACE after HVR was successfully constructed and validated using the RF model. The model demonstrated excellent predictive performance, with its discriminative ability being significantly superior to the routinely used EuroSCORE II scoring system. In addition to superior discrimination, the model showed good calibration, indicating that its predicted risk probabilities are clinically reliable.
The key predictors identified by the model—EuroSCORE II, LVEF, cardiopulmonary bypass time, aortic cross-clamp time, serum albumin, and age—profoundly reflect the pathophysiological underpinnings of postoperative risk. EuroSCORE II, as a composite preoperative score, was assigned high importance, affirming its value as a summary risk indicator. LVEF, a core measure of cardiac systolic function, directly reflects preoperative cardiac reserve; its depression is linked to poorer tolerance of surgical stress and higher risk of low cardiac output syndrome [10]. Both cardiopulmonary bypass time and aortic cross-clamp time are modifiable surgical factors. Prolonged CPB is associated with hemolysis, systemic inflammatory response, and endothelial injury [11], while extended aortic cross-clamp time directly correlates with the duration of myocardial ischemia [12,13]. Serum albumin, beyond indicating nutritional status, is a sensitive marker of chronic disease burden and systemic inflammation [14]; hypoalbuminemia compromises colloid osmotic pressure, tissue repair, and immune function. Age represents the non-modifiable factor of diminished physiological reserve. Collectively, these variables underscore the multifactorial nature of postoperative risk, encompassing patient-specific factors, surgical complexity, and underlying physiological state.
The model holds promising potential for clinical translation. Its primary advantage lies in providing a more accurate and individualized risk assessment than EuroSCORE II, likely due to its capacity to capture complex, non-linear interactions among predictors. This capability translates into practical utilities: (1) as a preoperative decision-support tool to identify high-risk patients, prompting considerations such as multidisciplinary team discussions [15,16], selection of less invasive approaches, or intensified postoperative planning; (2) enabling predictive resource allocation in the intensive care unit, potentially allowing for earlier detection and intervention of complications; and (3) enhancing clinical education by visually elucidating the key determinants of prognosis for trainees, thereby bridging the gap between statistical models and bedside reasoning [17]. In clinical practice, the model can be applied in three key scenarios: (1) Preoperative risk stratification: For patients with a predicted MACE risk >30% (high-risk group), a multidisciplinary team discussion can be organized to optimize preoperative preparation (e.g., nutritional support to increase serum albumin, heart function improvement), and minimally invasive surgical approaches can be considered to reduce surgical trauma [18]. (2) Individualized treatment planning: For patients with long predicted cardiopulmonary bypass time, surgeons can optimize surgical procedures in advance to shorten aortic cross-clamp time, reducing myocardial ischemia [19]. (3) Postoperative resource allocation: High-risk patients can be admitted to the intensive care unit for extended monitoring, while medium-low risk patients can receive appropriate ward care, achieving optimal resource utilization. These applications can help translate the model’s predictive ability into tangible clinical benefits [20].
This study has several limitations. First, as a single-center, retrospective study, the model is derived from a specific patient population, which carries inherent risks of selection bias and may limit generalizability to other settings with different demographics or clinical practices. Although internal validation using cross-validation and bootstrap resampling showed good performance, external validation with multi-center, prospective cohorts is essential before clinical implementation to confirm robustness and universality. Second, the model relies on routinely available clinical variables and did not incorporatepotentially prognostic emerging biomarkers (e.g., N-terminal pro-brain natriuretic peptide (NT-proBNP), troponin) or genetic data. Future studies integrating multi-omics information could enhance predictive power. Third, while the model demonstrated superior discrimination and calibration compared to EuroSCORE II, a formal assessment of its clinical utility. Evaluating the model’s impact on real-world clinical decisions and patient outcomes is a crucial next step for prospective implementation research. Fourth, although we employed SHAP analysis to improve interpretability and reported global feature importance, the intrinsic complexity of the RF Model may still pose a “black-box” challenge for individual case interpretations. Future work could leverage more advanced explainable AI techniques to provide even clearer, patient-specific decision pathways. Finally, while hyperparameter tuning was conducted via grid search with cross-validation, and the performance of the RF Model was validated against other classical algorithms (K Model, GB Model), exploring more advanced ensemble methods (e.g., XGBoost, LightGBM) and automated machine learning (AutoML) frameworks in future research may yield further performance optimizations.
In summary, this study developed and validated a random forest-based model for predicting MACE after HVR, demonstrating superior performance over EuroSCORE II. The identified predictors are grounded in clinical pathophysiology. Although further external validation is required, the model shows promising potential as an efficient preoperative risk assessment and decision-support tool, contributing to the advancement of precision medicine in cardiac surgery.
The data used and analyzed during the current study are available from the corresponding author on reasonable request.
Conception and design: QZ, JCD. Method: QZ, JCD. Data Collection: QZ, JCD. Manuscript Writing: QZ. Manuscript revision: QZ, JCD. Research supervision: JCD. Both authors read and approved the final manuscript. Both authors have participated sufficiently in the work and agreed to be accountable for all aspects of the work.
The study was approved by the Ethics Committee of Suining Central Hospital (No. 2021-12-002), and written informed consent was obtained from all patients. This study was conducted in accordance with the Declaration of Helsinki.
Not applicable.
This research received no external funding.
The authors declare no conflicts of interest.
Supplementary material associated with this article can be found in the online version, at https://doi.org/10.31083/HSF46959.
References
Publisher’s Note: IMR Press stays neutral with regard to jurisdictional claims in published maps and institutional affiliations.