


 , Rıdvan Bora 2, Burak Toprak 3,*
 , Mustafa Demir 4, Cuma Yeşildaş 5, İsmail Türkay Özcan 6, Emrah Yeşil 6, Özcan Örsçelik 6
1 Department of Cardiology, Private Genesis Hospital, 21070 Diyarbakır, Turkey
2 Department of Cardiology, Tarsus State Hospital, 33460 Mersin, Turkey
3 Department of Cardiovascular Surgery, Mersin City Education and Research Hospital, 33240 Mersin, Turkey
4 Department of Cardiology, Defne State Hospital, 31000 Hatay, Turkey
5 Department of Cardiology, Dr. Ersin Arslan Education and Research Hospital, 27010 Gaziantep, Turkey
6 Department of Cardiology, Mersin University Faculty of Medicine Hospital, 33343 Mersin, Turkey
Abstract
Contrast-induced nephropathy (CIN) is a common complication after coronary angiography (CAG), especially in patients with diabetes. Sodium–glucose cotransporter-2 (SGLT-2) inhibitors are well known for their cardio–renal protective effects, but their impact on CIN remains unclear. This study aimed to evaluate the renal safety of SGLT-2 inhibitors in patients undergoing CAG and to examine the role of glycemic control in the risk of CIN.
This retrospective study included 270 patients with type 2 diabetes who underwent elective or urgent CAG. Patients were divided into SGLT-2 users (n = 127) or non-users (n = 143). Demographic characteristics, comorbidities, laboratory data, and antidiabetic therapies were collected. CIN was defined as a ≥25% or ≥0.5 mg/dL increase in serum creatinine within 48 hours after contrast exposure. Hemoglobin A1c (HbA1c) categories were used to perform subgroup analyses.
The incidence of CIN was similar between SGLT-2 inhibitor users and non-users (18.1% vs. 14.7%; p = 0.447). Patients administered SGLT-2 inhibitors had higher HbA1c but lower uric acid levels. Overall, renal function decline was more evident in patients with HbA1c >6.4%; however, SGLT-2 inhibitor users showed a milder decrease in estimated glomerular filtration rate (eGFR). The frequent use of metformin and insulin may also influence CIN outcomes.
SGLT-2 inhibitors appear to be safe during CAG and may reduce the risk of CIN in patients with poorly controlled diabetes. Larger prospective studies are required to confirm these findings.
Keywords
- sodium–glucose cotransporter-2 inhibitors
- contrast-induced nephropathy
- coronary angiography
- glycemic control
- renal safety
Contrast-induced nephropathy (CIN) is a clinically significant form of acute
kidney injury (AKI) that occurs following diagnostic or therapeutic procedures
involving the administration of intravenous contrast agents [1]. Moreover, CIN
has been reported to account for approximately 10–15% of all hospital-acquired
AKI cases. After excluding alternative etiologies, CIN is defined by an increase
in serum creatinine of at least 25% from baseline or an absolute increase of
Contrast agents exert direct cytotoxic effects on renal tubular epithelial and endothelial cells, triggering mitochondrial dysfunction, oxidative stress, and activation of apoptotic pathways. These mechanisms lead to structural damage and functional impairment of tubular cells. Outer medullary hypoxia in CIN does not primarily arise from altered glomerular hemodynamics, but rather from an intrinsic mismatch between regional medullary blood flow—supplied via the vasa recta—and the high oxygen consumption of tubular segments, especially the thick ascending limb (TAL). The TAL has one of the highest metabolic demands in the kidney, and contrast agents further increase tubular workload and viscosity, amplifying this imbalance and promoting hypoxia-driven oxidative stress [2]. The high osmolality and viscosity of contrast media slow tubular flow and increase intratubular pressure, further exacerbating oxygen consumption and intensifying medullary hypoxia. Collectively, these processes promote the accumulation of reactive oxygen species, endothelial dysfunction, and recurrent vasoconstriction, ultimately impairing renal perfusion and manifesting clinically as CIN [3, 4].
Sodium–glucose cotransporter-2 (SGLT-2) inhibitors are oral antidiabetic agents that block glucose and sodium reabsorption in the proximal renal tubules, thereby promoting glucosuria, natriuresis, and osmotic diuresis. These agents carry a low risk of hypoglycemia, while the associated beneficial effects, such as weight loss and blood pressure reduction, have brought these inhibitors to prominence. The cardioprotective and renoprotective properties of SGLT-2 inhibitors have been well established in large, multicenter randomized controlled trials extending beyond the diabetic population. These trials have demonstrated significant reductions in heart failure–related hospitalizations and renal outcomes, while effects on major adverse cardiovascular events (MACEs) have varied across studies [5, 6]. Furthermore, trials such as DAPA-HF and EMPEROR-Reduced have shown similar benefits in non-diabetic patients with heart failure, positioning SGLT-2 inhibitors as versatile agents along the cardiorenal axis [7, 8]. Consequently, SGLT-2 inhibitors are increasingly used not only for glycemic control but also as a cornerstone therapy for heart failure and chronic kidney disease (CKD).
As the evidence-based cardiorenal benefits of SGLT-2 inhibitors have become more apparent, the clinical use of these agents has expanded significantly. These agents have been shown to improve both cardiac and renal outcomes in patients with heart failure, type 2 diabetes, and atherosclerotic cardiovascular disease, resulting in a growing number of patients being on these medications before coronary angiography (CAG) or other contrast-enhanced interventional procedures [5, 6]. While the renal protective benefits of SGLT-2 inhibitors are well established in individuals with an estimated glomerular filtration rate (eGFR) greater than 30 mL/min/1.73 m2, evidence remains limited in patients with lower eGFRs, leading to uncertainty about initiating or continuing these agents in this subgroup [9]. Additionally, considering potential pharmacodynamic and pharmacokinetic interactions with other nephrotoxic agents, the net renal effects of SGLT-2 inhibitors in patients undergoing contrast exposure remain inadequately understood. Thus, more data are needed to clarify the impact of these agents on contrast-associated AKI in this specific patient population.
Therefore, this study aimed to assess the incidence of contrast-associated AKI in patients receiving SGLT-2 inhibitor therapy who underwent CAG and to provide clinical evidence regarding the renal safety of these agents in this setting. Accordingly, changes in renal function following contrast exposure were evaluated and compared between patients treated with SGLT-2 inhibitors and those not treated with SGLT-2 inhibitors.
This observational study was conducted using the medical records of patients who underwent CAG in the Department of Cardiology at Mersin University Faculty of Medicine Hospital, between September 1, 2021, and September 1, 2022. No modifications were made to the therapeutic approaches administered during the study period; instead, all analyses were based on a retrospective evaluation of routinely recorded clinical and laboratory data before and after diagnostic CAG. To reduce the potential for selection bias inherent in retrospective data analyses, the inclusion and exclusion criteria were clearly defined prior to study initiation and applied uniformly to all patients. All data were obtained from the electronic medical record system at the hospital, and information on contrast agents and procedural details was verified in the digital archives. Data accuracy and consistency were independently reviewed and confirmed by two investigators.
2.1.2.1 Exclusion Criteria
1. eGFR 2. Known CKD (stages 3–5). 3. Maintenance dialysis. 4. Active malignancy. 5. Pregnancy or lactation. 6. Acute infection, diarrhea, or volume depletion at presentation. 7. Recent (within 2 weeks) use of nephrotoxic antibiotics. 8. Missing baseline or follow-up creatinine values. 9. Incomplete or inconsistent medical records.
2.1.2.2 Inclusion Criteria
1. Age: 2. Undergoing diagnostic or urgent CAG between September 1, 2021, and September 1,
2022. 3. Diagnosis of type 2 diabetes mellitus. 4. Availability of baseline and post-contrast (48 5. Complete demographic, clinical, medication, and laboratory records. 6. eGFR 7. Use, or non-use of SGLT-2 inhibitors is clearly documented in electronic medical
records.
A total of 300 patients were retrospectively screened based on predefined
eligibility criteria. This study included patients aged 18 years and older who
underwent diagnostic CAG between the specified dates, with available pre- and
post-procedural serum creatinine levels and complete clinical and laboratory
records. Post-procedural serum creatinine was measured within 48
A total of 23 patients were excluded due to incomplete data. Additionally, 7 patients with malignancies or undergoing maintenance dialysis were excluded based on predefined criteria, resulting in a final study cohort of 270 patients (Fig. 1).
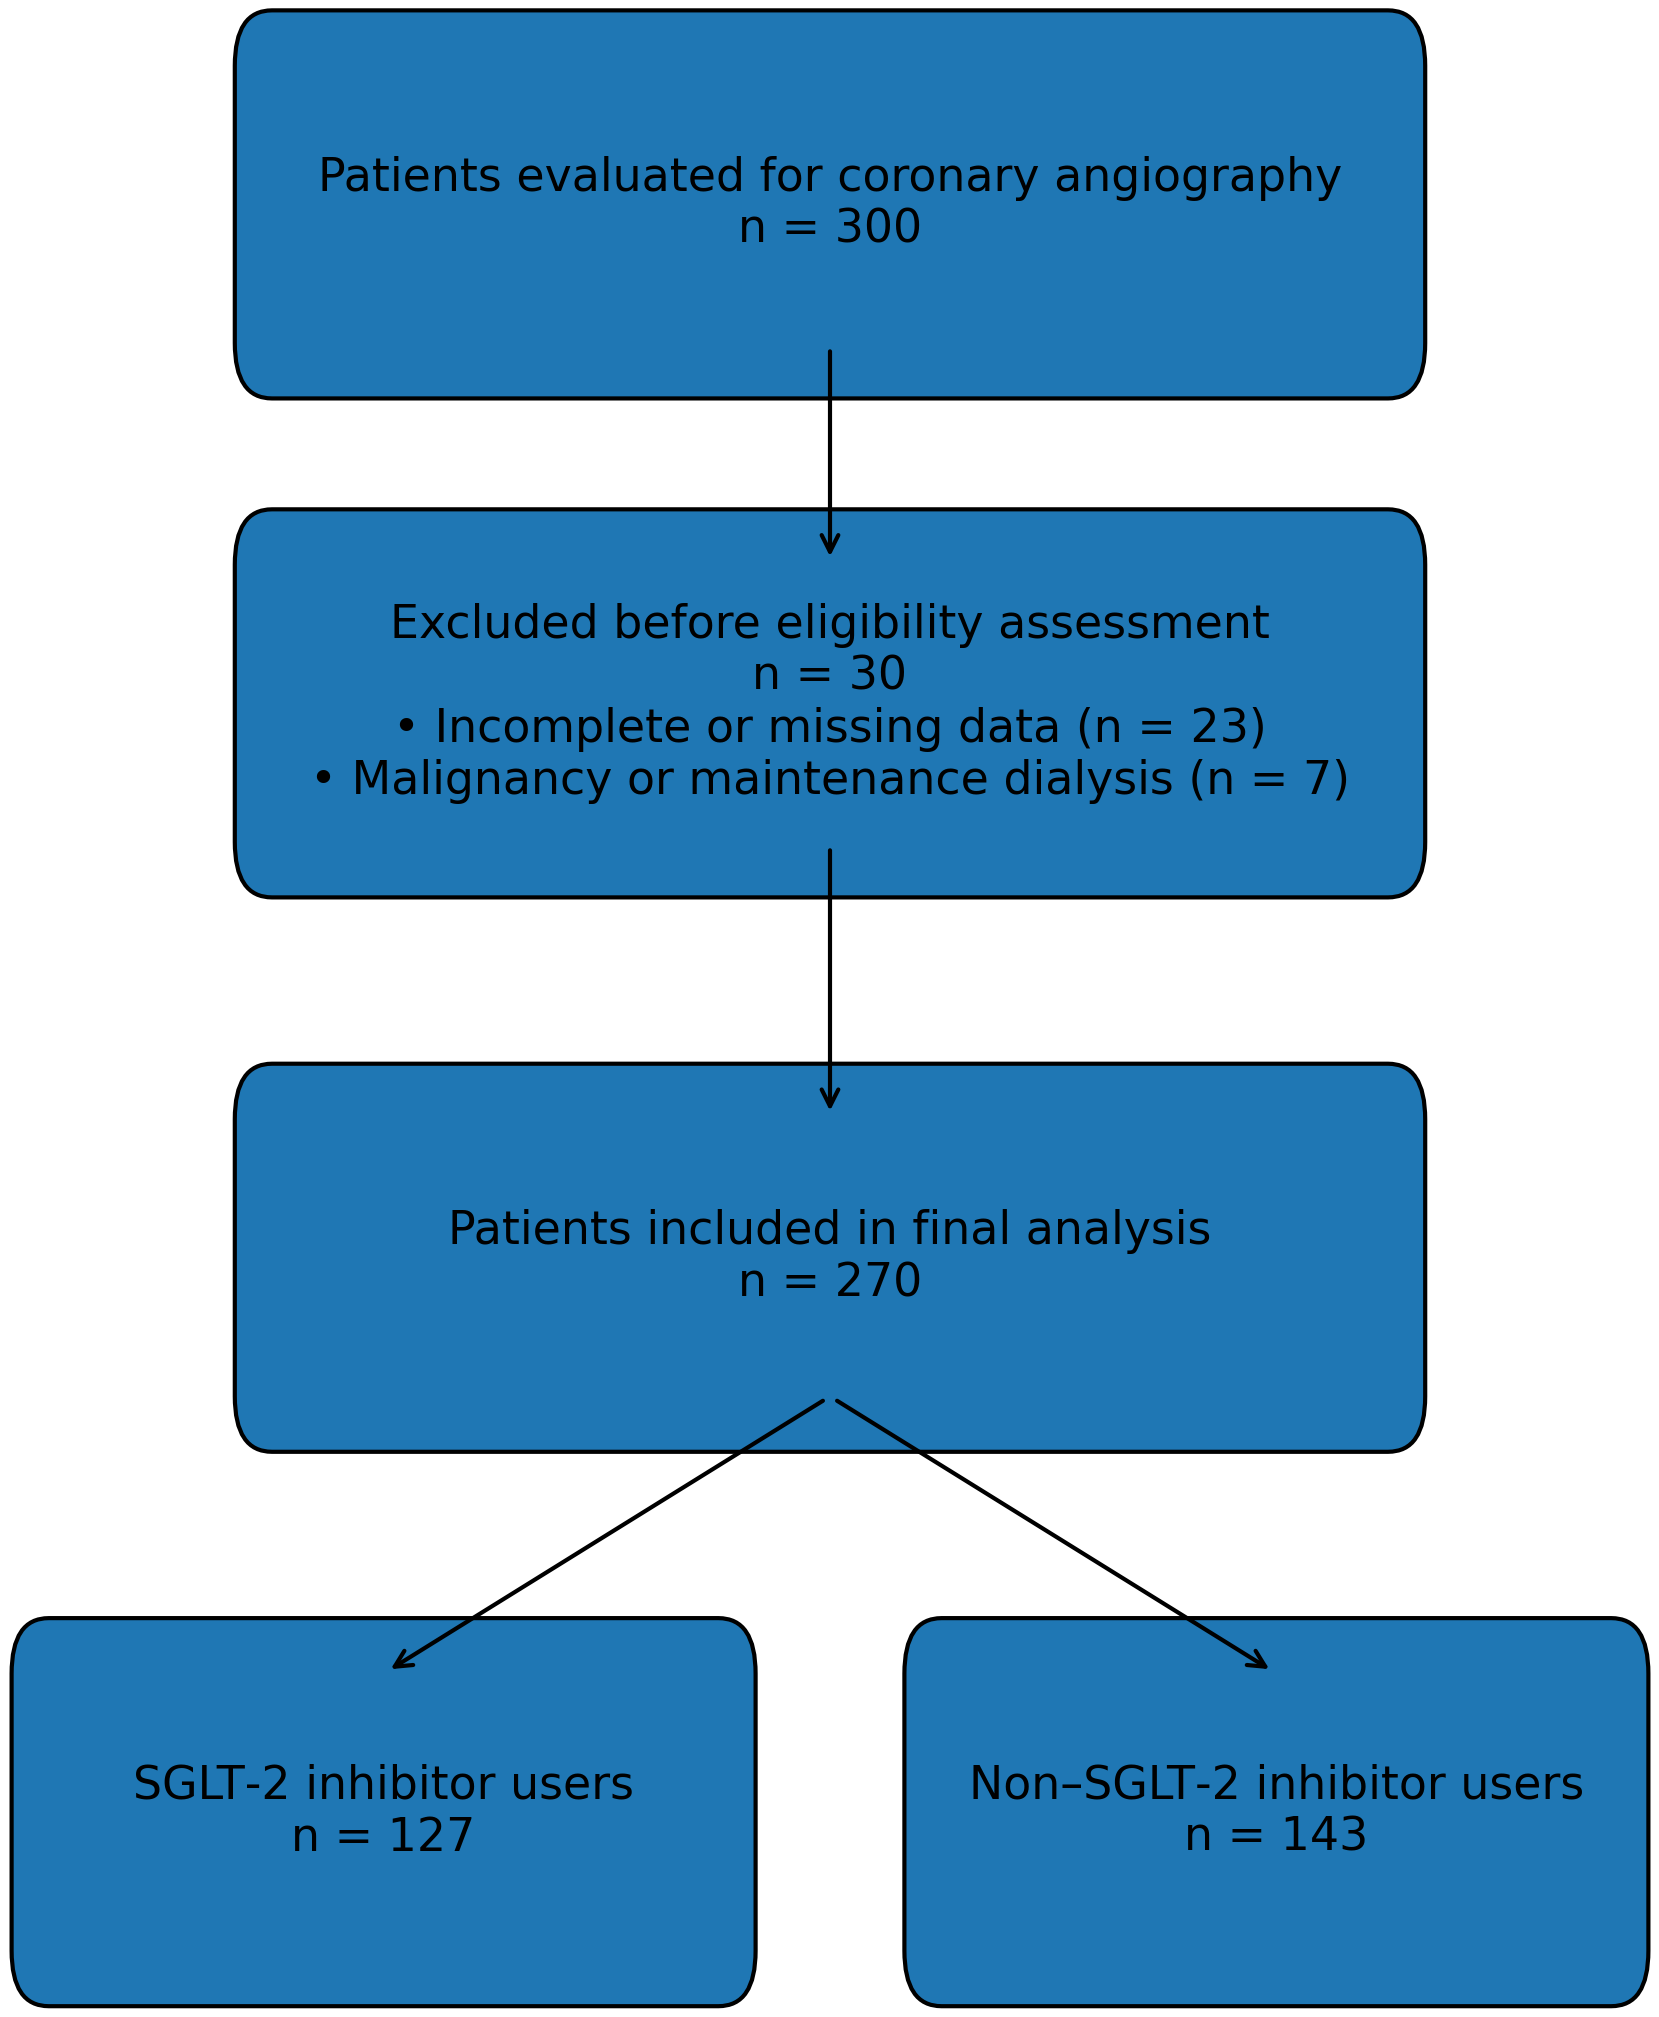 Fig. 1.
Flowchart of the screening of patients undergoing coronary angiography, sequential application of predefined exclusion criteria, and final enrollment into the study cohort. A total of 300 patients were retrospectively evaluated; after excluding those with incomplete data, malignancy, maintenance dialysis, and other predefined criteria, 270 patients were included in the final analysis and subsequently categorized according to SGLT-2 inhibitor use. eGFR, estimated glomerular filtration rate; KDIGO, Kidney Disease: Improving Global Outcomes; SGLT-2, sodium–glucose cotransporter-2.
Other exclusion criteria included an eGFR
The study population was subsequently stratified into two groups according to SGLT-2 inhibitor therapy: patients actively receiving SGLT-2 inhibitors (n = 127) and those not receiving these agents (n = 143). Patients allocated to the SGLT-2 inhibitor group had been on a stable SGLT-2 inhibitor regimen for at least 7 days before the index CAG; patients in whom SGLT-2 therapy was initiated during the index hospitalization or within the week preceding the procedure were classified in the non-SGLT-2 inhibitor group. All patients included in the study had a confirmed diagnosis of type 2 diabetes mellitus, which was a key inclusion criterion. In both groups, patient demographics, comorbid conditions, serum creatinine levels, and eGFR values (both at baseline and 48 hours post-procedure) were evaluated. Regarding peri-procedural management, SGLT-2 inhibitors were not routinely discontinued before CAG at our institution. All patients in the SGLT-2 inhibitor group continued therapy without interruption throughout the pre-procedural and post-procedural periods, except in cases of contraindications (e.g., hemodynamic instability, acute infection). Serum or urine ketone measurements were not routinely measured during the perioperative period as part of institutional practice, and postoperative hyperglycemia was monitored clinically rather than through standardized laboratory protocols. All patients underwent a uniform hydration protocol consisting of isotonic saline (1 mL/kg/hour) administered for 6 hours before and 6 hours after CAG, according to the standard institutional CIN-prevention protocol. Medication use was verified through electronic medical records and inpatient prescription data to ensure accurate classification. Therefore, all analyses reflect patients who were actively and continuously receiving SGLT-2 inhibitors at the time of contrast exposure. Additionally, contrast volume and the use of potentially nephrotoxic medications were recorded and considered in the comparative analyses. Changes in renal function and the incidence of contrast-associated AKI were compared between the two groups to assess the impact of SGLT-2 inhibitor use on the risk of CIN.
Normality of the data distribution was evaluated using the Kolmogorov–Smirnov
test. Variables exhibiting normal distribution were analyzed using parametric
methods, whereas non-normally distributed variables were assessed using
nonparametric tests. Data with a normal distribution are reported as the mean
All statistical analyses were performed using SPSS version 28.0 (trial version, IBM Corp., Armonk, NY, USA) and MedCalc® version 9.2.0.1 (MedCalc Software Ltd., Ostend, Belgium).
A total of 270 patients with complete renal function test records before and after CAG were included in this retrospective observational study. The patients were divided into two groups: those receiving SGLT-2 inhibitors (n = 127) and those not receiving these agents (n = 143). This study primarily aimed to evaluate the impact of SGLT-2 inhibitor use on the development of CIN. Among all patients, the indications for CAG were elective in 47.8%, non-ST-elevation myocardial infarction (NSTEMI) in 27.4%, ST-elevation myocardial infarction (STEMI) in 15.2%, and unstable angina in 9.6%. Additionally, demographic characteristics, cardiovascular risk factors, and laboratory parameters of the patients were comparatively analyzed. Correlation analyses were also conducted to explore the associations between SGLT-2 inhibitor use and renal function indicators, including serum creatinine, eGFR, and contrast volume. This approach aimed not only to assess the metabolic effects of SGLT-2 inhibitors but also to investigate the potential nephroprotective role at the clinical level.
The data in Table 1 demonstrate several statistically significant differences
between the groups. Coronary artery disease (CAD) was more common among patients
using SGLT-2 inhibitors compared with non-users (53.5% vs. 41.3%; p =
0.044). Metformin use was markedly higher in the SGLT-2 inhibitor group than in
the non-user group (68.5% vs. 25.2%; p
| Variable | Non-SGLT-2 inhibitor users (n = 143) | SGLT-2 inhibitor users (n = 127) | p-value | |
| Demographic characteristics | ||||
| Age (years) | 63.4 |
62.6 |
0.425 | |
| Female, n (%) | 61 (42.7%) | 54 (42.5%) | 0.982 | |
| BMI (kg/m2) | 28.8 |
28.6 |
0.590 | |
| Medical history | ||||
| Hypertension (HT), n (%) | 111 (77.6%) | 97 (76.4%) | 0.808 | |
| Coronary artery disease, n (%) | 59 (41.3%) | 68 (53.5%) | 0.044 | |
| Hyperlipidemia (HL), n (%) | 66 (46.2%) | 65 (51.2%) | 0.409 | |
| Cerebrovascular event (CVE), n (%) | 17 (11.9%) | 9 (7.1%) | 0.182 | |
| Smoking, n (%) | 46 (32.2%) | 40 (31.5%) | 0.906 | |
| HFrEF or HFpEF, n (%) | 16 (11.2%) | 17 (13.4%) | 0.582 | |
| Medications | ||||
| ACEi or ARB, n (%) | 71 (49.7%) | 66 (52.0%) | 0.704 | |
| Beta-blocker, n (%) | 51 (35.7%) | 47 (37.0%) | 0.819 | |
| Diuretic, n (%) | 56 (39.2%) | 53 (41.7%) | 0.667 | |
| NSAIDs, n (%) | 15 (10.5%) | 11 (8.7%) | 0.611 | |
| Metformin, n (%) | 36 (25.2%) | 87 (68.5%) | ||
| Insulin, n (%) | 37 (25.9%) | 54 (42.5%) | 0.006 | |
| DPP-4 inhibitors, n (%) | 48 (33.6%) | 67 (52.8%) | 0.002 | |
| Glitazones, n (%) | 14 (9.8%) | 7 (5.5%) | 0.279 | |
| Sulfonylureas, n (%) | 27 (18.9%) | 25 (19.7%) | 0.990 | |
| Laboratory parameters | ||||
| Sodium (mEq/L) | 136.7 |
136.4 |
0.460 | |
| Potassium (mEq/L) | 4.31 |
4.20 |
0.062 | |
| Baseline creatinine (mg/dL) | 0.86 (0.31–1.92) | 0.78 (0.36–1.65) | 0.068 | |
| Baseline eGFR (mL/min/1.73 m2) | 85.8 |
88.9 |
0.178 | |
| Urea (mg/dL) | 35 (14–101) | 32 (12–104) | 0.269 | |
| Uric acid (mg/dL) | 5.62 |
4.94 |
0.001 | |
| CRP (mg/L) | 4.8 (0–194) | 4.0 (0–177) | 0.756 | |
| Hemoglobin (g/dL) | 13.0 |
13.3 |
0.364 | |
| White blood cell count (103/µL) | 9.52 |
9.19 |
0.447 | |
| Platelet count (103/µL) | 269 |
260 |
0.379 | |
| HbA1c (%) | 7.6 |
8.21 |
0.012 | |
| LDL cholesterol (mg/dL) | 105 |
103 |
0.696 | |
| Ejection fraction (%) | 51.3 |
52.5 |
0.254 | |
| Contrast volume (mL) | 120 (35–450) | 120 (40–400) | 0.902 | |
| CIN present, n (%) | 21 (14.7%) | 23 (18.1%) | 0.447 | |
| CIN absent, n (%) | 122 (85.3%) | 104 (81.9%) | 0.447 | |
Statistical tests applied include the Student’s t-test for normally
distributed continuous variables (age, BMI, sodium, uric acid, hemoglobin,
platelet count, LDL cholesterol, ejection fraction), the Mann–Whitney U test for
non-normally distributed continuous variables (baseline creatinine, baseline eGFR
when distribution deviated from normality, urea, CRP, contrast volume), and the
chi-square test for categorical variables (female sex, hypertension, coronary
artery disease, hyperlipidemia, cerebrovascular event, smoking, HFrEF/HFpEF,
ACEi/ARB use, beta-blocker use, diuretic use, NSAID use, metformin use, insulin
use, DPP-4 inhibitor use, glitazone use, sulfonylurea use, CIN presence). A
p-value
The distribution of CIN (+) and CIN (–) cases between the SGLT-2 inhibitor and non-SGLT-2 inhibitor groups is presented in Fig. 2. Although the overall incidence of CIN was comparable, the graphical representation highlights the relative proportions within each treatment group (Fig. 2).
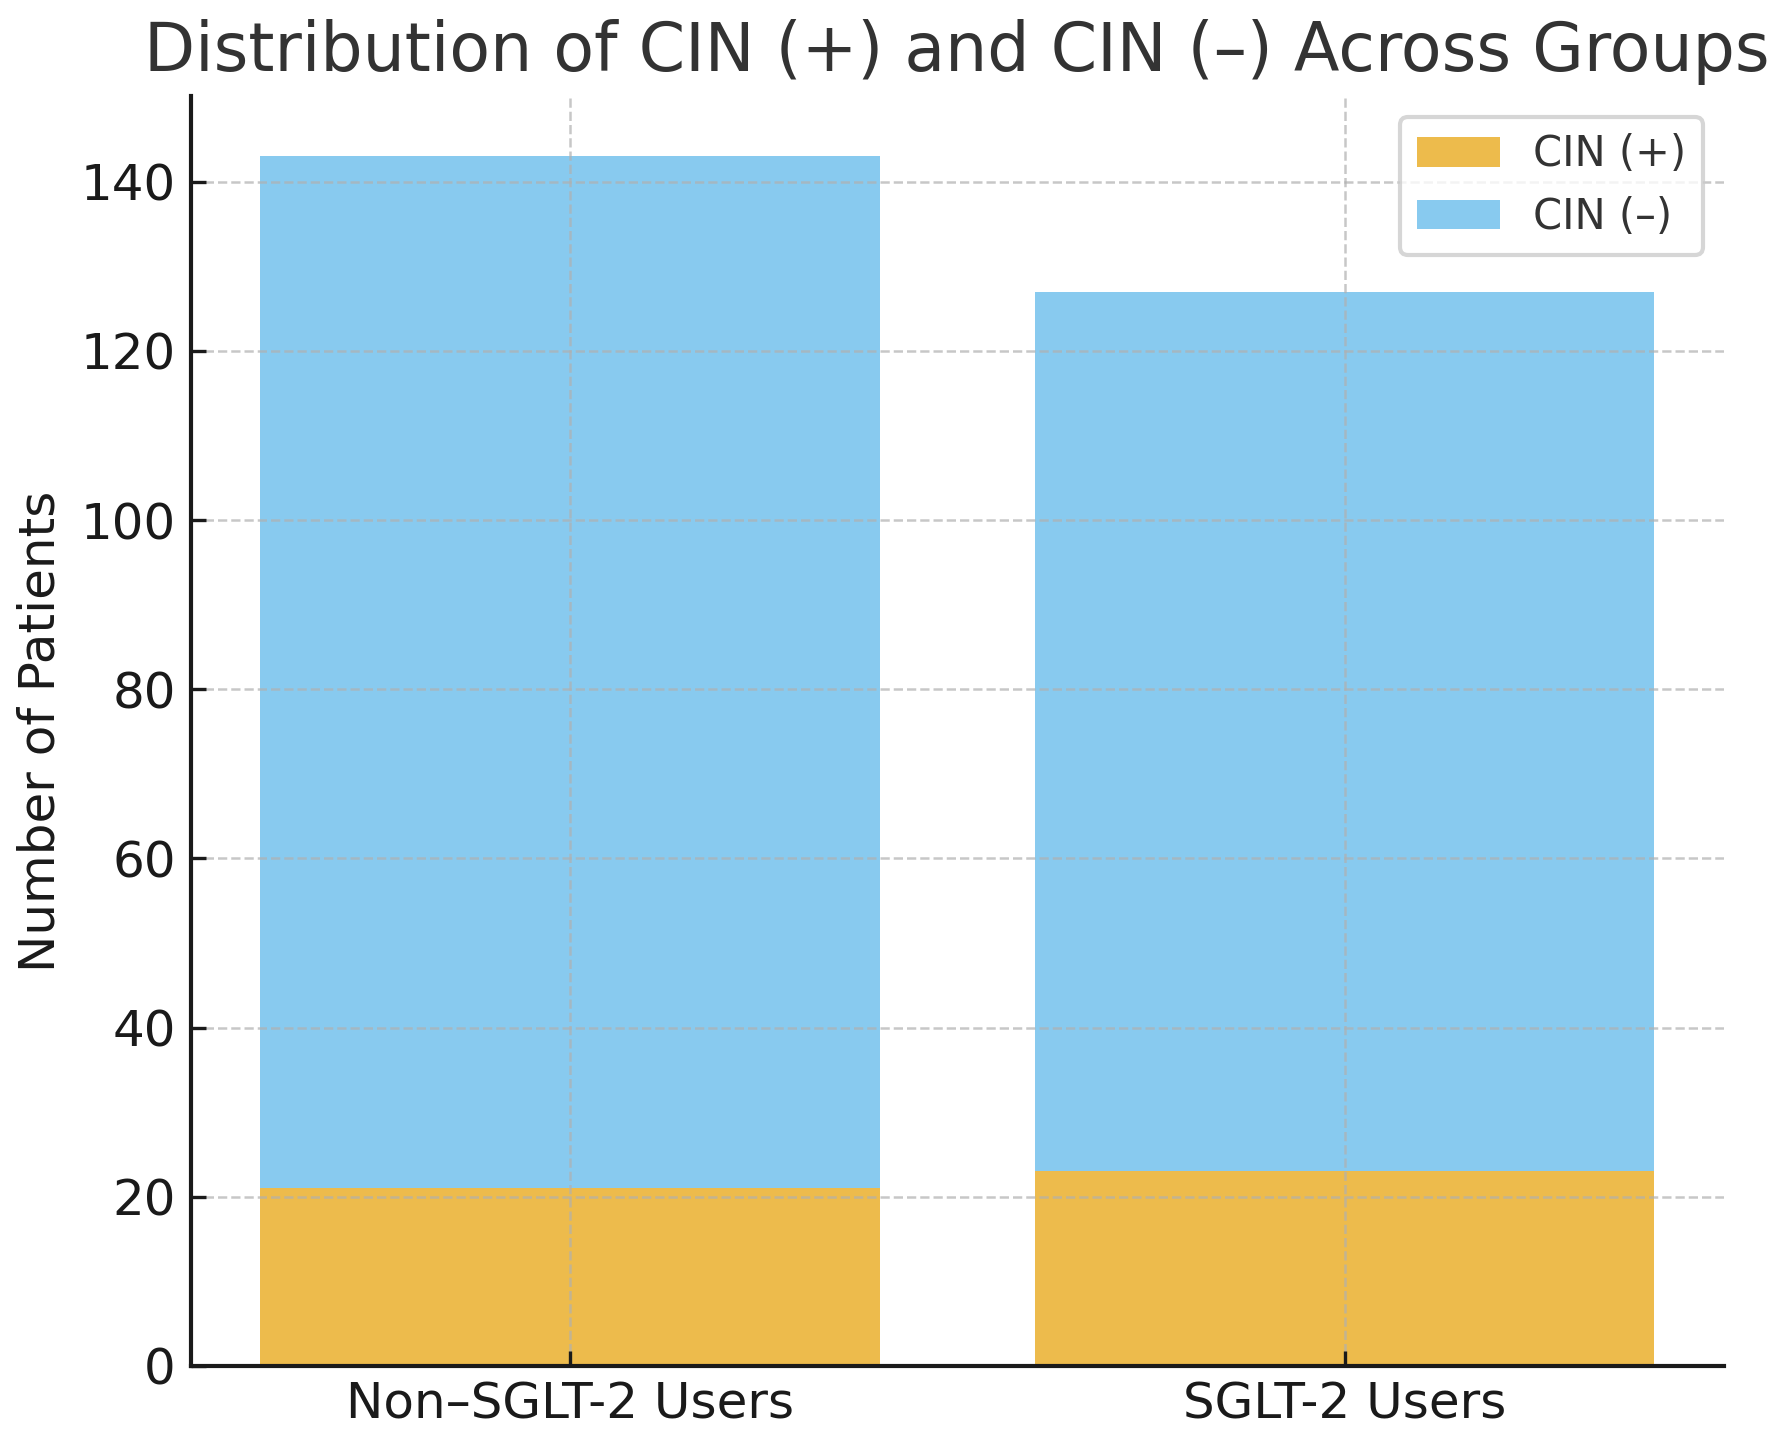 Fig. 2.
Distribution of CIN (+) and CIN (–) cases across SGLT-2 inhibitor users and non-users. Among non-SGLT-2 inhibitor users, 21 of 143 patients (14.7%) developed CIN, whereas 23 of 127 patients (18.1%) in the SGLT-2 inhibitor group developed CIN. The incidence of CIN did not differ significantly between the groups (chi-square test, p = 0.447).
As shown in Fig. 3, mean HbA1c levels were significantly higher in the SGLT-2
inhibitor group than in non-users (8.21
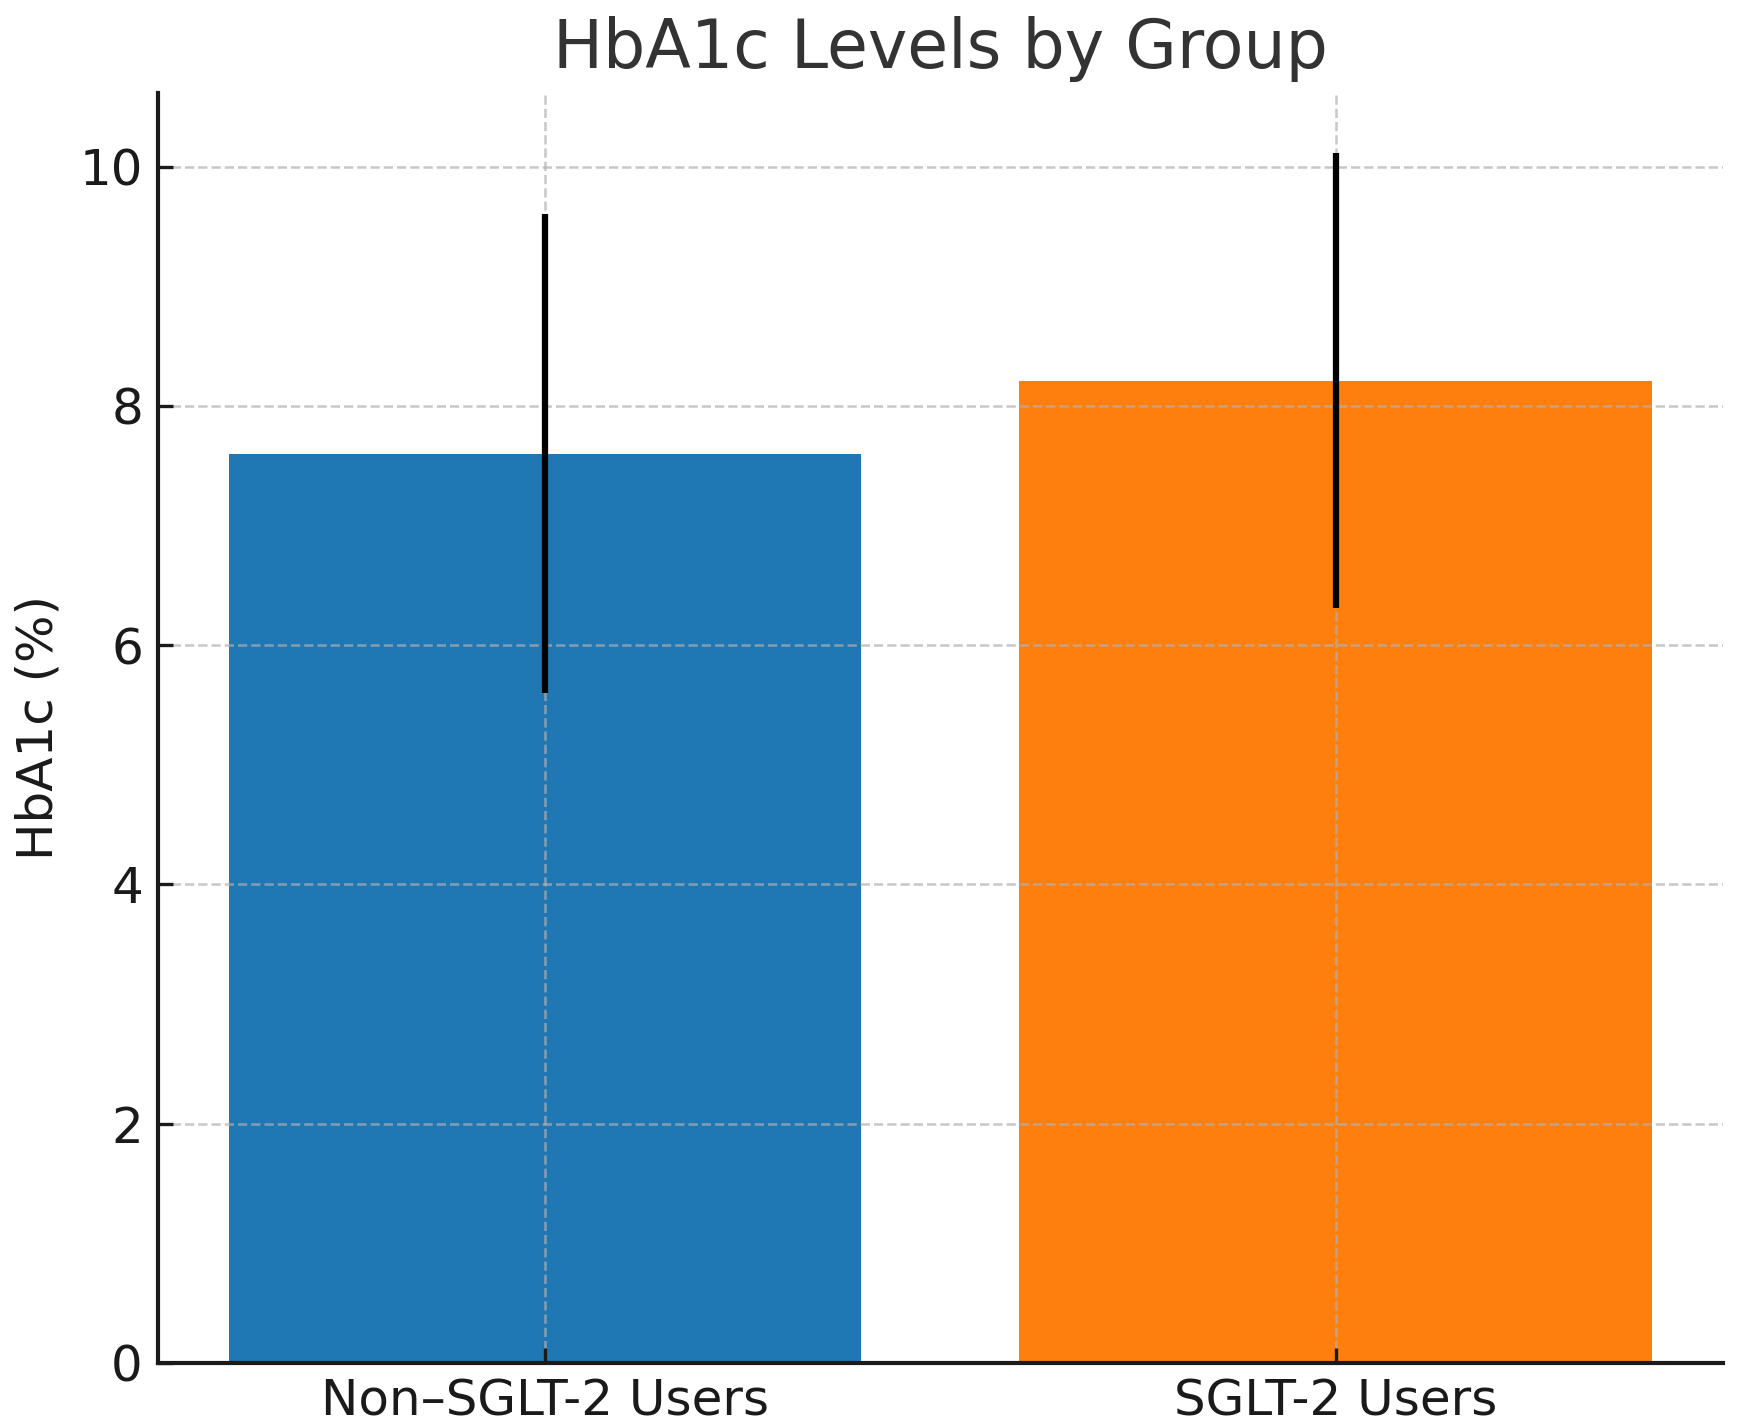 Fig. 3.
Mean HbA1c levels (
The data in Table 2 demonstrate that baseline serum creatinine levels were
significantly lower in patients who developed CIN (0.69 [0.36–1.92] mg/dL)
compared with those without CIN (0.84 [0.31–1.75] mg/dL; p = 0.001).
Similarly, baseline eGFR was significantly higher in the CIN group (90.3
| Parameter | No CIN (n = 228) | CIN present (n = 42) | p-value |
| Sodium (mEq/L) | 136.5 |
136.7 |
0.777 |
| Potassium (mEq/L) | 4.27 |
4.23 |
0.643 |
| Baseline creatinine (mg/dL) | 0.84 (0.31–1.75) | 0.69 (0.36–1.92) | 0.001 |
| Baseline eGFR (mL/min/1.73 m2) | 84.0 |
90.3 |
0.041 |
| Urea (mg/dL) | 35 (12–104) | 32 (17–86) | 0.519 |
| Uric acid (mg/dL) | 5.31 |
5.27 |
0.892 |
| CRP (mg/L) | 4.0 (0–194) | 6.0 (0–107) | 0.160 |
| Hemoglobin (g/dL) | 13.2 |
13.0 |
0.661 |
| White blood cell count (103/µL) | 9.28 |
9.77 |
0.440 |
| Platelet count (103/µL) | 266 |
262 |
0.838 |
| HbA1c (%) | 7.91 |
7.74 |
0.598 |
| LDL cholesterol (mg/dL) | 103 |
108 |
0.408 |
| Ejection fraction (%) | 52.0 |
51.4 |
0.742 |
| Contrast volume (mL) | 120 (35–450) | 110 (45–400) | 0.780 |
| Pre-existing chronic kidney disease | 4.8% | 0% | 0.611 |
| Contrast type/dose (mL) | 128.9 |
128.1 |
0.940 |
| Number of antidiabetic medications (mean |
2.32 |
2.26 |
0.710 |
Continuous variables with normal distribution were compared using Student’s
t-test, whereas those without normal distribution were evaluated using
the Mann–Whitney U test. Statistically significant p-values (
The data in Table 3 reveal that, overall, serum creatinine levels increased
significantly from 0.85
| Group | Baseline creatinine (mg/dL) | 48-hour creatinine (mg/dL) | % change in creatinine | p-value (creatinine) | Baseline eGFR (mL/min) | 48-hour eGFR (mL/min) | % change in eGFR | p-value (eGFR) |
| All patients | 0.85 |
0.89 |
+6.22 | 0.006 | 85.0 |
82.7 |
–1.69 | 0.006 |
| Non-SGLT-2 inhibitor users | 0.88 |
0.92 |
+5.61 | 0.074 | 85.8 |
82.3 |
–2.37 | 0.053 |
| SGLT-2 inhibitor users | 0.82 |
0.85 |
+6.92 | 0.032 | 88.9 |
87.3 |
–0.66 | 0.486 |
| HbA1c |
0.90 |
0.94 |
+5.33 | 0.360 | 81.1 |
79.4 |
–0.42 | 0.321 |
| HbA1c |
0.83 |
0.87 |
+6.56 | 0.008 | 86.5 |
84.0 |
–2.17 | 0.008 |
The Wilcoxon signed-rank test was used to evaluate repeated measurements within
the same group. Values that reached statistical significance are displayed in
bold in the table. A p-value
Fig. 4 demonstrates the changes in serum creatinine from baseline to 48 hours
after contrast administration in both groups. Creatinine increased modestly in
SGLT-2 inhibitor users (0.82
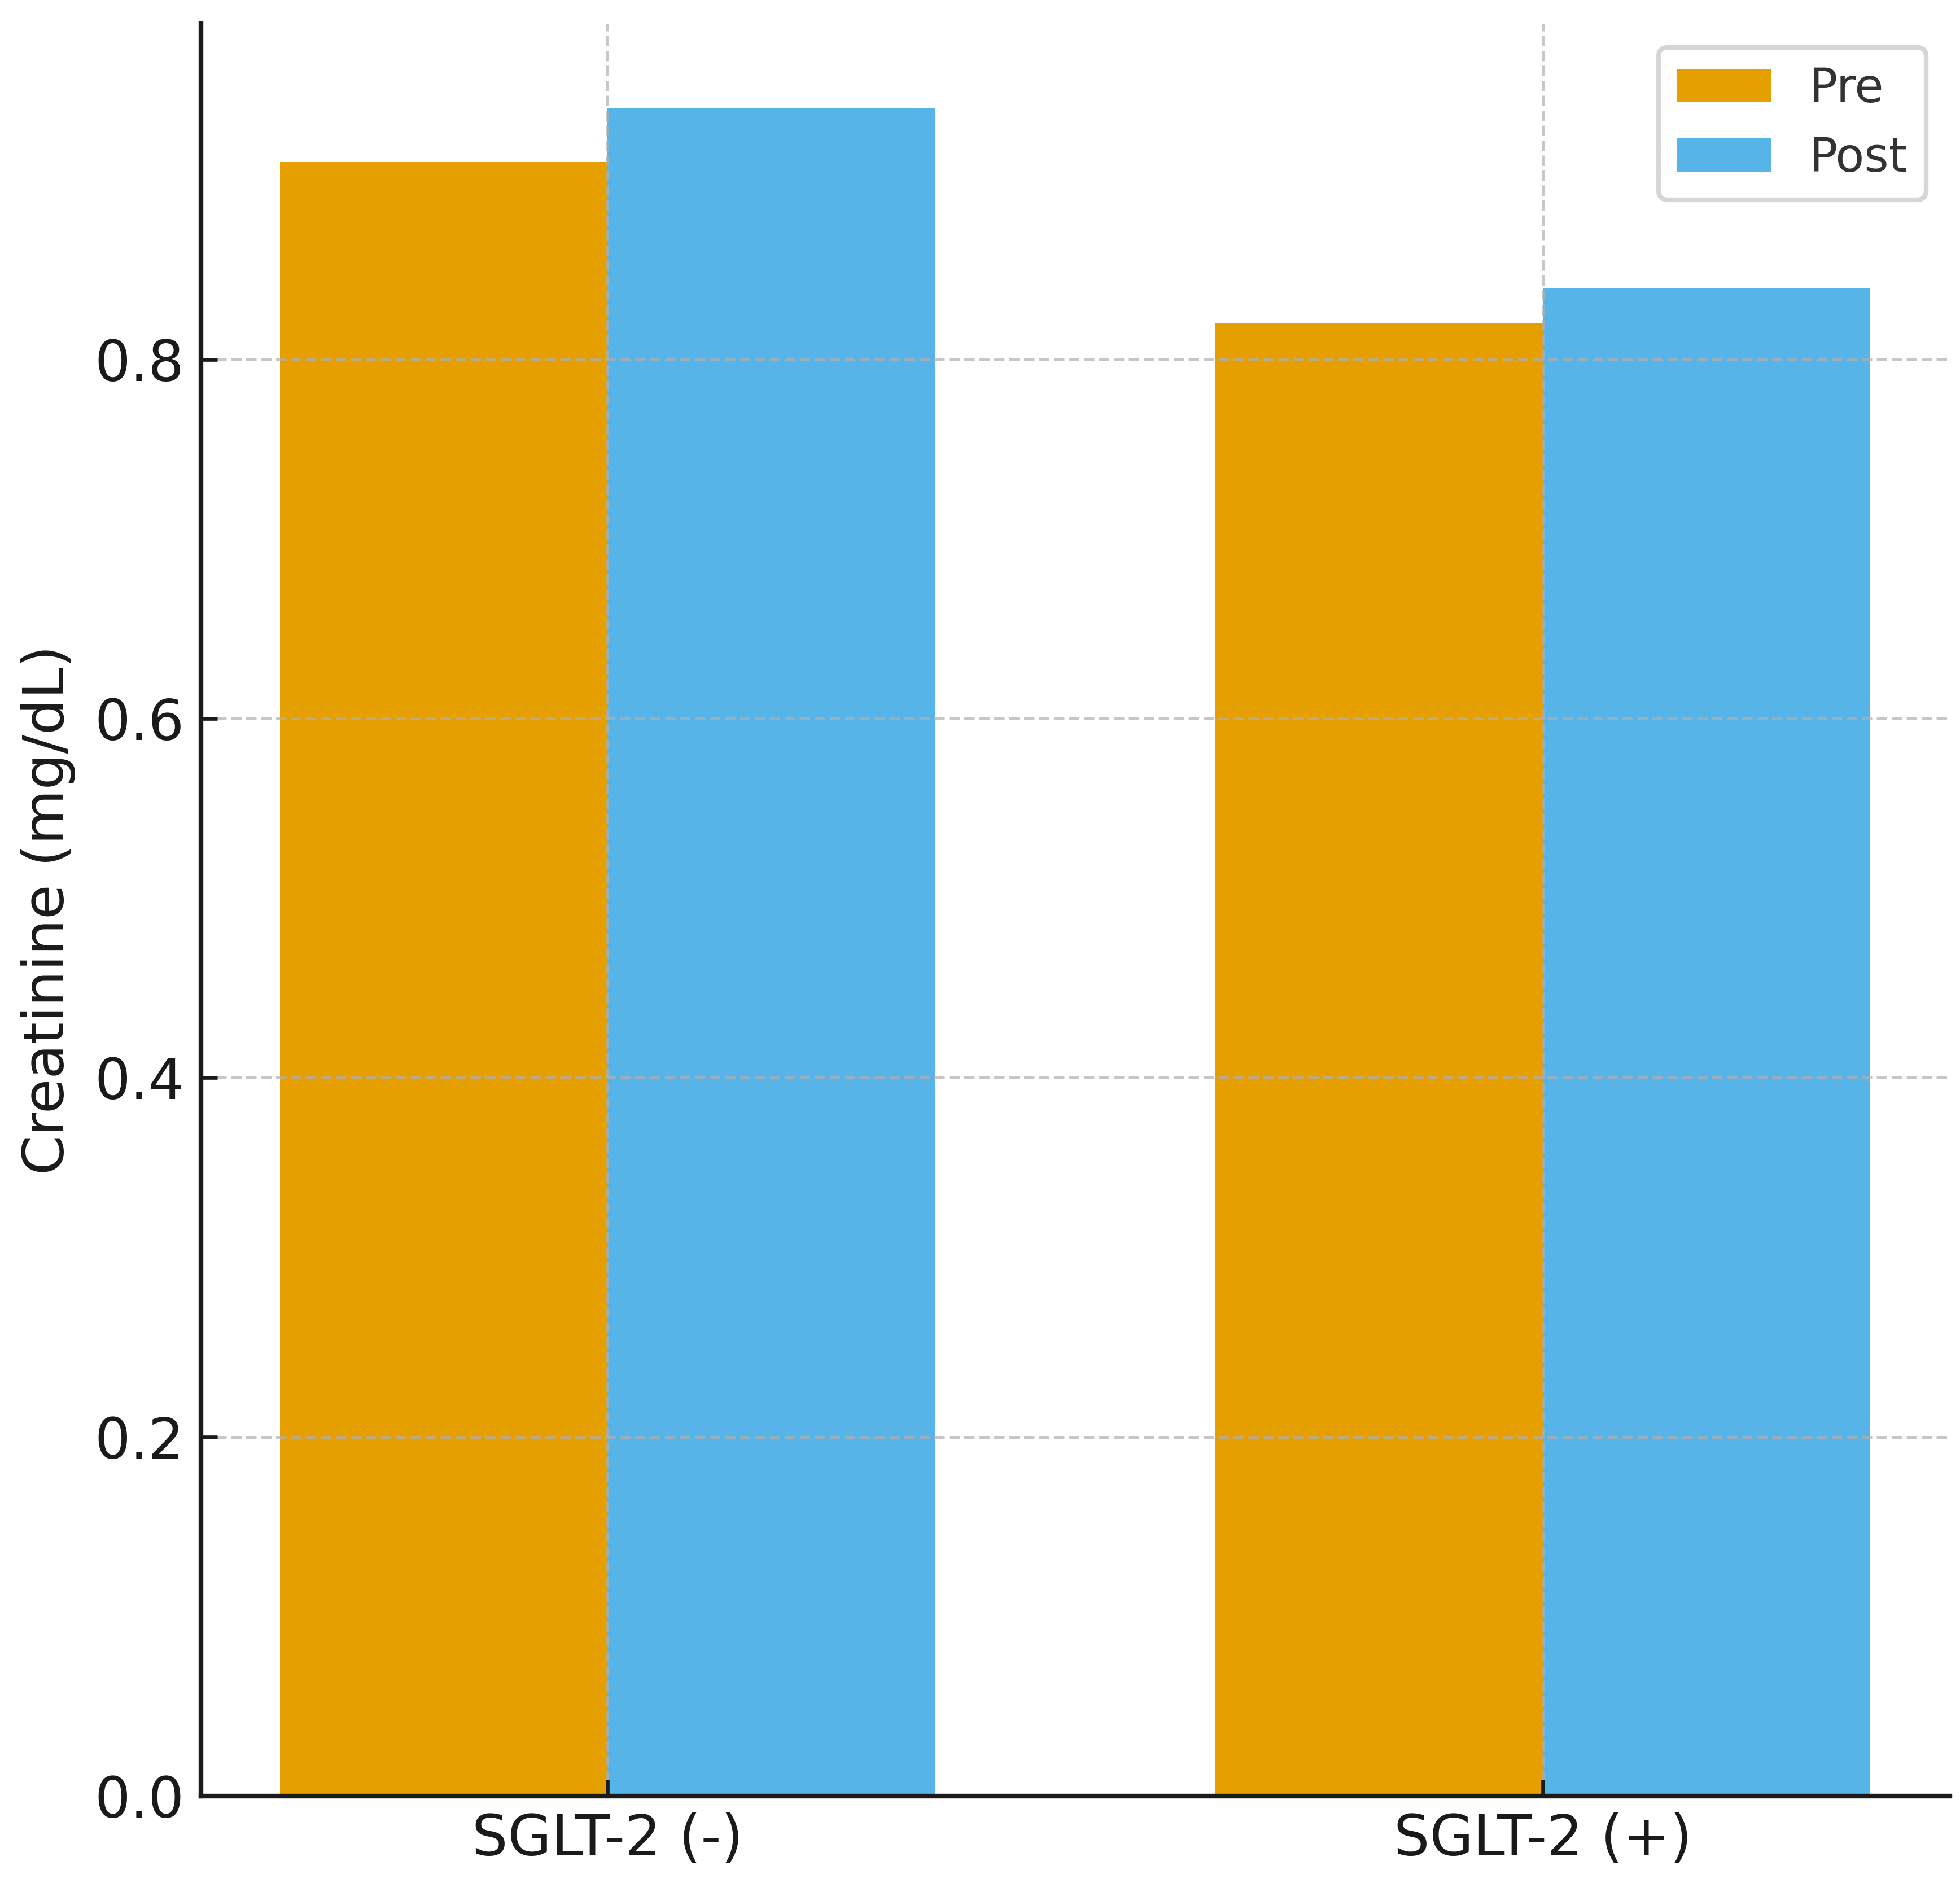 Fig. 4.
Creatinine change before and after contrast exposure. Changes in serum creatinine levels before and 48 hours after coronary angiography in patients receiving and not receiving SGLT-2 inhibitors. Both groups showed small but measurable increases in creatinine, with no significant difference between treatment groups.
According to Table 4, a significant increase in serum creatinine levels was
observed in the HbA1c
| Group | Baseline creatinine (mg/dL) | 48-hour creatinine (mg/dL) | % change in creatinine | p-value (creatinine) | Baseline eGFR (mL/min) | 48-hour eGFR (mL/min) | % change in eGFR | p-value (eGFR) |
| HbA1c |
0.92 |
0.96 |
+6.1 | 0.365 | 82.9 |
82.3 |
+1.85 | 0.847 |
| HbA1c |
0.86 |
0.87 |
+3.4 | 0.726 | 94.4 |
90.6 |
–3.36 | 0.742 |
| HbA1c |
0.86 |
0.90 |
+5.3 | 0.130 | 86.6 |
82.3 |
–3.62 | 0.032 |
| HbA1c |
0.81 |
0.85 |
+7.6 | 0.026 | 88.0 |
86.8 |
–0.25 | 0.605 |
The Wilcoxon signed-rank test was used to evaluate repeated measurements within
the same group. Results that reached statistical significance are highlighted in
bold in the table. A p-value
Fig. 5 shows the corresponding changes in eGFR. The SGLT-2 inhibitor group
exhibited minimal decline (88.0
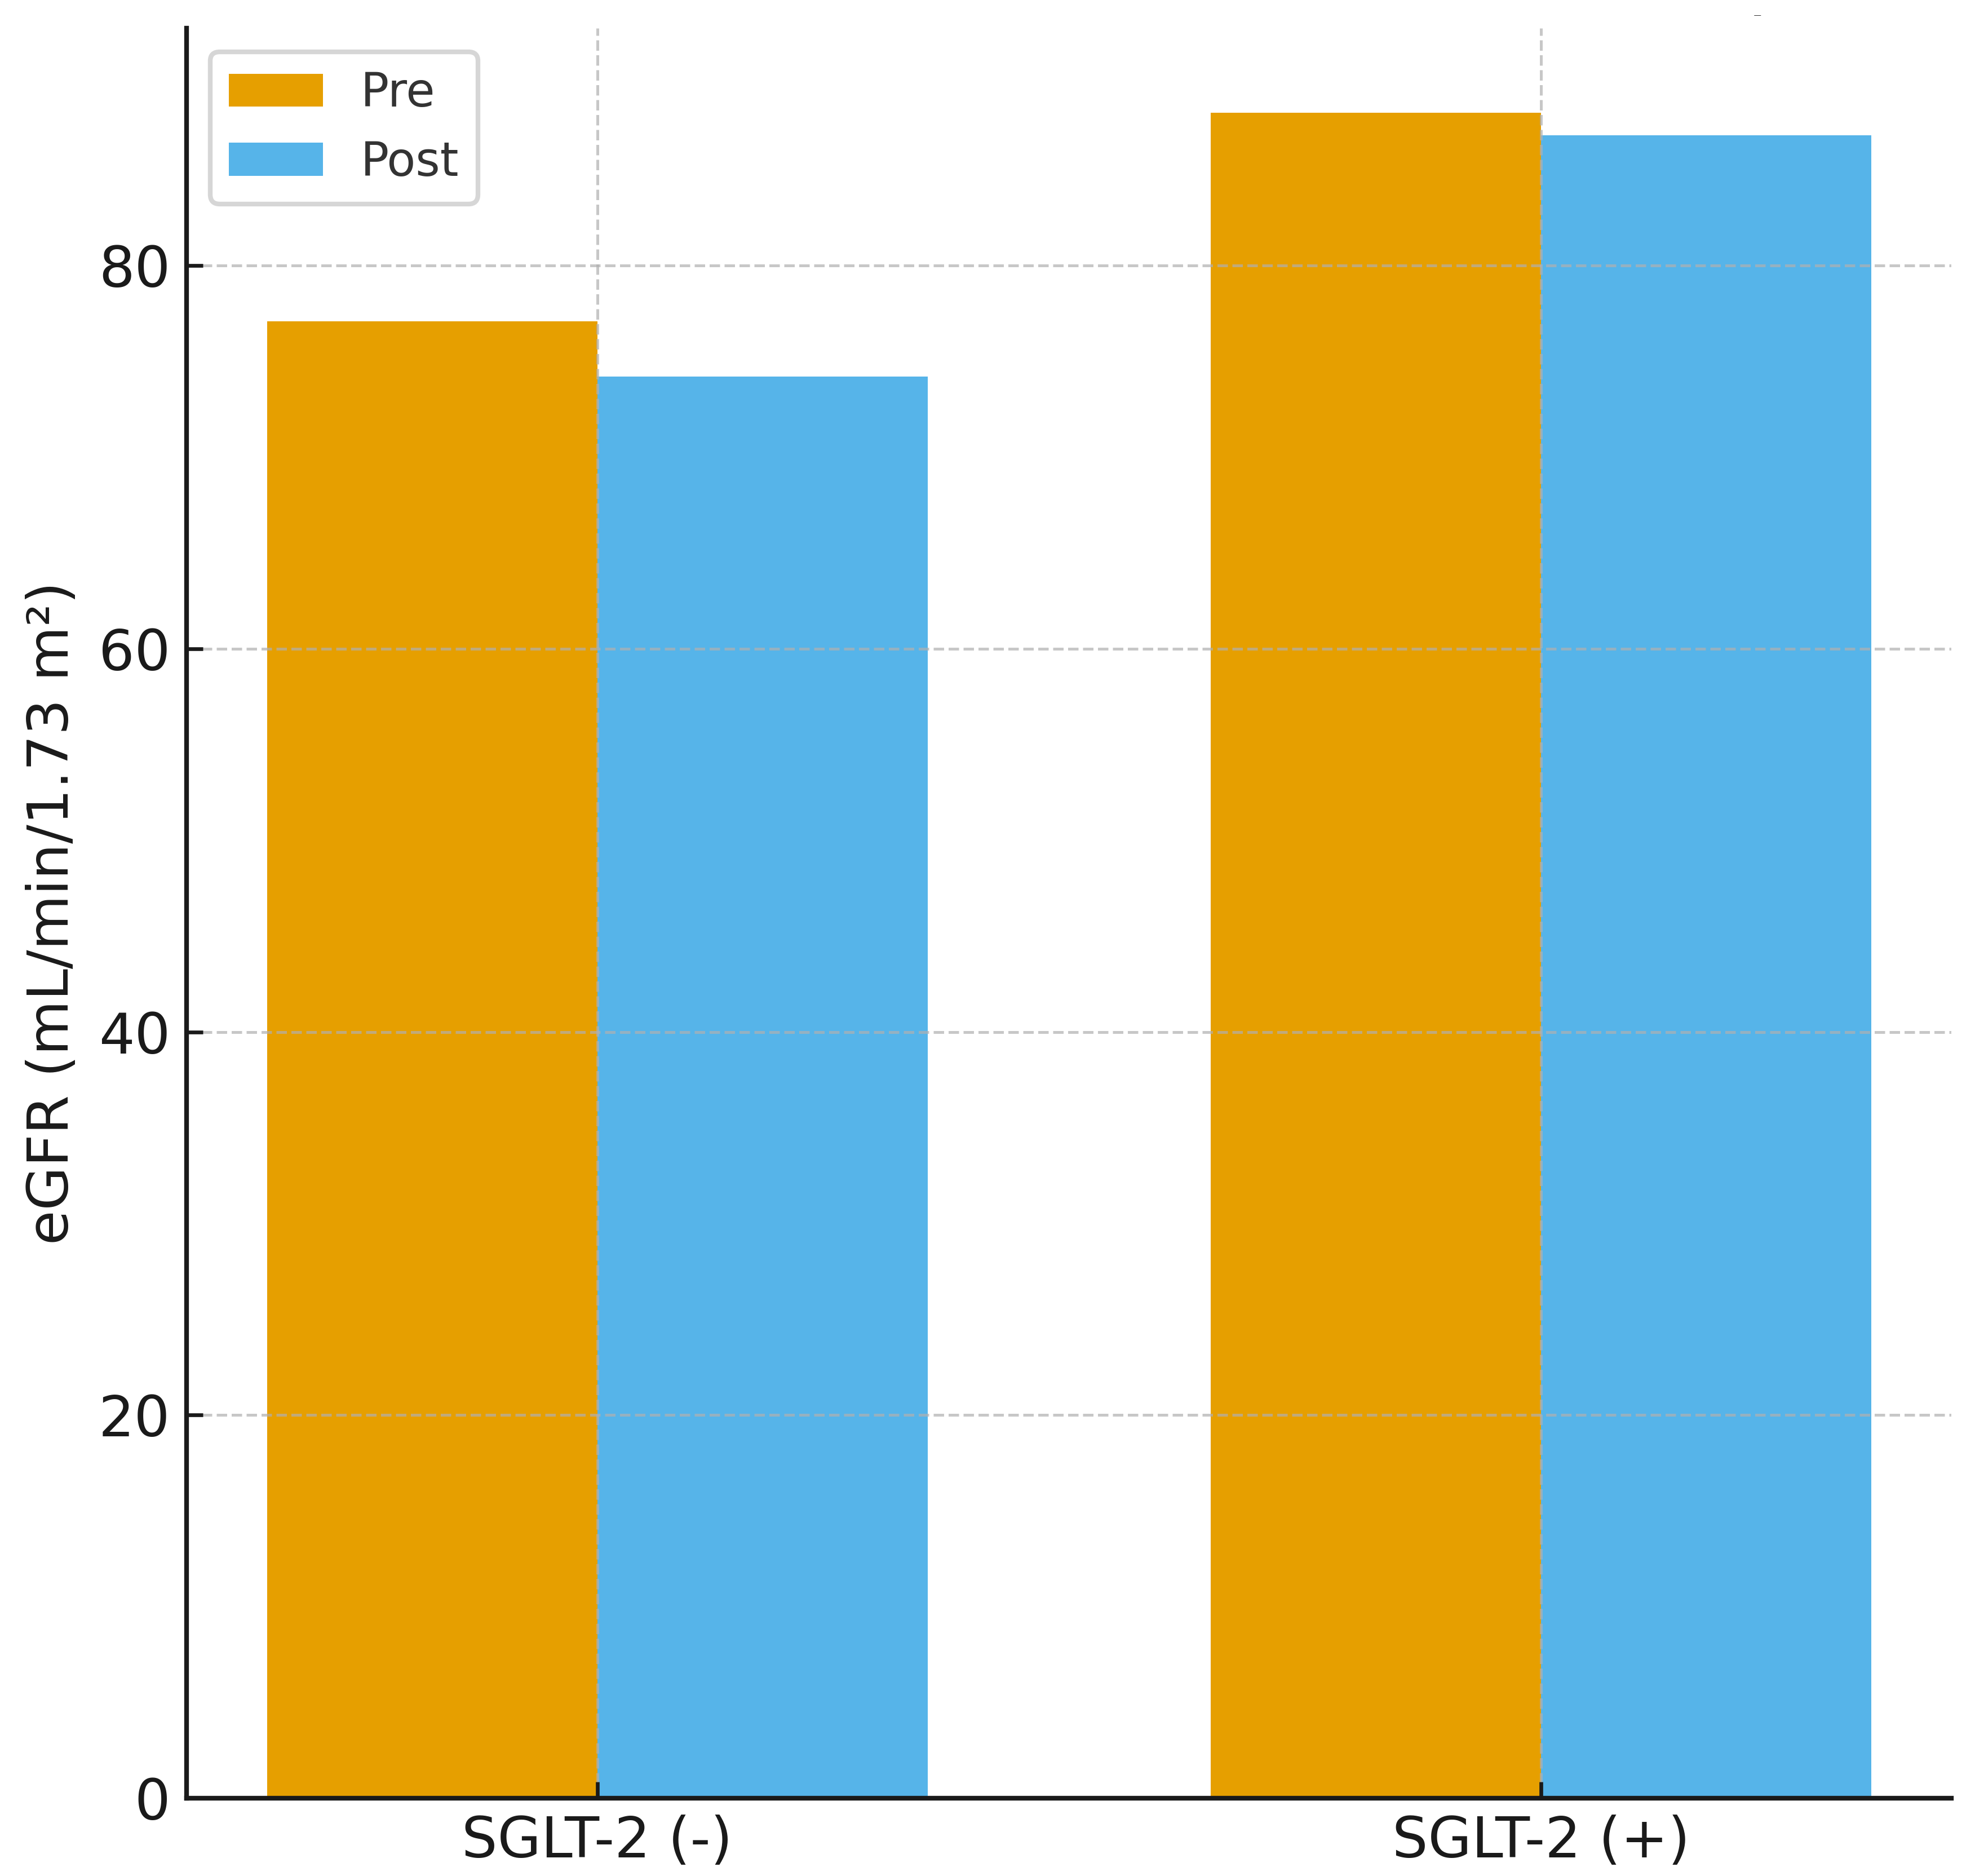 Fig. 5.
Estimated glomerular filtration rate change before and after contrast exposure. Pre-procedural and 48-hour post-procedural changes in eGFR. The SGLT-2 inhibitor group demonstrated minimal change, whereas the non-SGLT-2 inhibitor group exhibited a modest decline in eGFR.
According to Table 5, to further account for potential confounding, a multivariate logistic regression analysis was performed with CIN as the dependent variable, and SGLT-2 inhibitor use, age, baseline eGFR, and HbA1c entered as covariates (Table 5). In this adjusted model, SGLT-2 inhibitor use was not independently associated with the development of CIN (adjusted odds ratio (OR) 1.40, 95% CI 0.71–2.77; p = 0.330). Among the included variables, only higher baseline eGFR emerged as a significant predictor of CIN (adjusted OR 1.02 per mL/min/1.73 m2, 95% CI 1.00–1.05; p = 0.023), whereas age (p = 0.155) and HbA1c (p = 0.614) were not independently related to CIN risk (Table 5).
| Variable | Adjusted OR (95% CI) | p-value |
| SGLT-2 inhibitor use | 1.40 (0.71–2.77) | 0.330 |
| Age (per year) | 1.03 (0.99–1.08) | 0.155 |
| Baseline eGFR (per mL/min/1.73 m2) | 1.02 (1.00–1.05) | 0.023 |
| HbA1c (per 1% increase) | 0.95 (0.79–1.15) | 0.614 |
Statistical analyses include multivariate logistic regression with CIN as the
dependent variable. Covariates entered into the model were SGLT-2 inhibitor use,
age, baseline eGFR, and HbA1c, selected a priori based on the associated
biological relevance and to reduce the risk of model overfitting. Odds ratios
(ORs) are presented with 95% confidence intervals (CIs). Results that reached
statistical significance are highlighted in bold in the table. A p-value
In this study, the development of CIN was compared between patients who received SGLT-2 inhibitors and those who did not. The incidence of CIN following CAG was similar between the two groups (p = 0.447). In addition, demographic, clinical, and laboratory parameters were evaluated in both groups. The results revealed that serum uric acid levels were significantly lower and HbA1c levels were higher in patients using SGLT-2 inhibitors. These findings may be explained by the known uricosuric effect of SGLT-2 inhibitors. Meanwhile, the higher HbA1c levels observed in the SGLT-2 inhibitor group may reflect a tendency to prescribe these agents to patients with poorer glycemic control.
When changes in renal function before and after contrast exposure were analyzed,
decreases in eGFR and increases in creatinine levels were less pronounced in
patients administering SGLT-2 inhibitors than in those who were not. This
protective trend was especially notable in the subgroup with HbA1c
CIN accounts for approximately 10–15% of all hospital-acquired AKI cases and is recognized as a significant iatrogenic complication. CIN typically follows a non-oliguric, transient course, yet requires close clinical monitoring [11]. In recent years, the favorable effects of SGLT-2 inhibitors on both cardiac and renal outcomes have been strongly demonstrated, leading to a marked increase in their clinical use. Consequently, the relationship between SGLT-2 inhibitors and CIN has gained growing clinical relevance. Detailed investigation of this association is essential to optimize pre- and post-procedural therapeutic strategies and to identify approaches that preserve long-term renal function.
The kidney-protective properties of SGLT-2 inhibitors have been convincingly confirmed through several major randomized controlled trials. The CREDENCE study reported that canagliflozin decreased the risk of end-stage kidney disease, a doubling of serum creatinine, and renal mortality by 30% in patients with type 2 diabetes and CKD with albuminuria [14]. In the DAPA-CKD trial, dapagliflozin significantly lowered the likelihood of sustained renal function decline, progression to kidney failure, and cardiovascular death, independent of diabetes status [15]. Likewise, the EMPA-KIDNEY trial—which enrolled a more heterogeneous patient cohort—showed that empagliflozin reduced the combined risk of CKD progression or cardiovascular mortality by 28% in both diabetic and non-diabetic participants [16]. Furthermore, the DECLARE-TIMI 58 trial reported that dapagliflozin prevented declines in renal function and the progression of albuminuria, providing meaningful nephroprotection as well [6]. These findings indicate that SGLT-2 inhibitors play a significant role in cardiometabolic disease management not only through glycemic control but also via nephroprotective mechanisms.
The impact of SGLT-2 inhibitors on CIN has been extensively investigated at both
preclinical and clinical levels in recent years. Experimental models have shown
that dapagliflozin exerts a protective effect against CIN by suppressing the
HIF-1
In large-scale randomized controlled trials, patients with an eGFR below 20
mL/min/1.73 m2 or those dependent on dialysis were generally excluded.
Consequently, there is insufficient evidence regarding the safety and efficacy of
SGLT-2 inhibitors in this patient population. Reflecting this uncertainty, the
Kidney Disease: Improving Global Outcomes (KDIGO) 2022 guidelines do not
recommend initiating SGLT-2 inhibitors in individuals with an eGFR
When focusing on the primary aim of our study—evaluating the effect of SGLT-2 inhibitors on the development of CIN—no significant difference in CIN incidence was observed between patients receiving SGLT-2 inhibitors and those not; the occurrence of CIN was similar in both groups. This finding aligns with several recent studies in the literature [11, 12, 15, 16, 17, 18, 19, 20, 21]. In particular, observational studies and prospective analyses have shown that SGLT-2 inhibitors do not increase the risk of CIN and may even contribute to greater renal stability in certain subgroups. Therefore, our findings suggest that the use of SGLT-2 inhibitors does not increase the risk of contrast-induced AKI and that the safe use of these agents may be extended to broader clinical settings.
Among patients who developed CIN, baseline creatinine levels were lower, and eGFR values were higher. At first glance, this appears to contradict the classical literature, in which CIN is often associated with low eGFR and elevated creatinine [1, 11]. However, a more detailed analysis reveals that both parameters remained within reference ranges and showed only slightly better values than those in the non-CIN group. This suggests that the development of CIN may depend not only on baseline renal function but also on dynamic factors, including acute hemodynamic fluctuations, contrast agent tolerance, hydration status, and microvascular perfusion [3, 4]. Particularly, low baseline creatinine may lead to overestimation of GFR in some patients [9, 21]. Therefore, even with seemingly adequate eGFR values, patients may remain at risk of contrast exposure due to subclinical reductions in renal reserve.
Numerous clinical studies investigating the role of glycemic control in the
development of CIN have highlighted the predictive value of HbA1c levels. In a
prospective observational study involving 786 diabetic patients undergoing CAG,
the incidence of CIN was found to be significantly higher in patients with HbA1c
levels
SGLT-2 inhibitors, owing to their cardio- and renoprotective properties, have seen an expansion in use beyond diabetes management in recent years, with rapidly diversifying clinical indications. This growing utility necessitates a closer examination of its potential impact, particularly in settings that challenge renal function, such as exposure to iodinated contrast agents. The findings of our study suggest that this drug class is safe in the context of CIN and may even exert a nephroprotective effect. Nevertheless, current U.S. Food and Drug Administration (FDA) recommendations advise withholding SGLT-2 inhibitors for 3–4 days before major procedures to reduce the risk of euglycemic diabetic ketoacidosis (DKA); however, adherence to this guidance could not be evaluated in this retrospective dataset. However, to better delineate the role of SGLT-2 inhibitors in clinical practice, optimize medication strategies in the peri-procedural period, and accurately identify high-risk subgroups, further large-scale, multicenter, prospective studies are warranted.
This study has several limitations that should be considered when interpreting the results. First, the study was designed as a retrospective, observational analysis, which inherently limits the ability to establish causal relationships and confines the findings to associations. Furthermore, the retrospective nature of the study relies heavily on the completeness and accuracy of medical records, introducing potential risks of information bias and recording errors.
Second, this study was conducted at a single center, which restricts the generalizability of the findings. Variations in contrast agent types and dosages, hydration protocols, and patient management strategies across institutions may limit the generalizability of our results to more heterogeneous populations.
Third, renal function was assessed only using serum creatinine and eGFR values. More sensitive markers of kidney injury, such as urine output, urinary biomarkers (e.g., neutrophil gelatinase-associated lipocalin (NGAL), kidney injury molecule-1 (KIM-1)), and serum cystatin-C, were not evaluated, which may have led to missed cases of subclinical renal injury.
Fourth, while concomitant medication use (e.g., renin–angiotensin system inhibitors, NSAIDs, statins) was recorded, the timing, dosage, and duration of these agents were not analyzed. Similarly, the dosage and duration of SGLT-2 inhibitor therapy were not sufficiently detailed to assess potential dose–response effects on CIN risk. Given that some medications may increase or reduce the risk of CIN, this lack of detail may confound the interpretation of these findings.
Meanwhile, although the total sample size was appropriate based on the power
analysis, the number of patients in certain subgroups (e.g.,
those with HbA1c
Another important limitation relates to the definition of CIN used in our study.
The conventional definition, based on an increase in serum creatinine of
This study demonstrates that chronic SGLT-2 inhibitor therapy is not associated with short-term deterioration in renal function following diagnostic CAG. While these findings support the short-term renal safety of SGLT-2 inhibitors in this specific setting, they do not allow for broader conclusions regarding the overall safety profile of SGLT-2 inhibitors in the CAG population. Long-term prospective studies are required to more comprehensively evaluate renal outcomes, cardiovascular endpoints, and clinical safety across diverse patient subgroups.
AKI, acute kidney injury; CAG, coronary angiography; CIN, contrast-induced nephropathy; eGFR, estimated glomerular filtration rate; HbA1c, hemoglobin A1c; SGLT-2, sodium–glucose cotransporter-2; CAD, coronary artery disease; NSTEMI, non-ST-elevation myocardial infarction; STEMI, ST elevation myocardial infarction; CRP, C-reactive protein; WBC, white blood cell; PLT, platelet; EF, ejection fraction; ACEi, angiotensin-converting enzyme inhibitor; ARB, angiotensin II receptor blocker; NSAIDs, non-steroidal anti-inflammatory drugs; HFpEF, heart failure with preserved ejection fraction; HFrEF, heart failure with reduced ejection fraction; CVE, cerebrovascular event; PCI, percutaneous coronary intervention.
The data supporting the findings of this study are available from the corresponding author upon reasonable request.
MA: study conception and design, data collection, statistical analysis, and drafting of the manuscript. RB: data acquisition, interpretation of results, and critical revision of the manuscript. BT: contribution to study design, interpretation of clinical data, manuscript writing, and final approval. ÖÖ: supervision, critical revision for important intellectual content, and final approval of the version to be published. MD: data collection, data interpretation, and critical revision of the manuscript. CY: data acquisition and clinical data interpretation. İTÖ: data collection and contribution to manuscript review. EY: Data acquisition, interpretation of results, and critical revision of the manuscript. All authors contributed to the conception and editorial changes in the manuscript. All authors read and approved the final manuscript. All authors have participated sufficiently in the work and agreed to be accountable for all aspects of the work.
The study and the writing of the article were prepared in accordance with the Declaration of Helsinki. The study protocol was approved by the Local Ethics Committee of Mersin University Faculty of Medicine under decision number 2022/834. Informed written consent was obtained in the surgical consent form before the subjects were included in the study.
Not applicable.
This research received no external funding.
The authors declare no conflict of interest.
References
Publisher’s Note: IMR Press stays neutral with regard to jurisdictional claims in published maps and institutional affiliations.