


 , Eishan Ashwat 1,†, Michel Pompeu Sá 2, Andres Martinez Plotnikow 1, Sarah Yousef 1, Nishant Agrawal 1, Dustin Kliner 3, Catalin Toma 3, Amber Makani 3, Yisi Wang 1,3, Floyd W. Thoma 1,3, Derek Serna-Gallegos 1,3, Ibrahim Sultan 1,3,*
1 Division of Cardiac Surgery, Department of Cardiothoracic Surgery, University of Pittsburgh, Pittsburgh, PA 15213, USA
2 Department of Cardiovascular Surgery, Cleveland Clinic, Weston, Florida, FL 33331, USA
3 Division of Cardiac Surgery, UPMC Heart and Vascular Institute, Pittsburgh, PA 15213, USA
†These authors contributed equally.
Abstract
Evidence regarding the reliability of transthoracic echocardiography (TTE) in assessing valvular gradients immediately following transcatheter aortic valve implantation (TAVI) remains conflicting. Thus, this study aimed to compare post-procedural TTE and invasive mean aortic valve (AV) pressure gradients immediately after TAVI.
This was a retrospective, single-institution cohort study of consecutive TAVIs between 2012 and 2023. Immediate post-procedural mean AV pressure gradients were measured invasively via pigtail catheter and non-invasively via TTE. The Spearman coefficient was used to assess the correlation between TTE and invasive gradients. Multivariable Cox proportional-hazards regression was performed for long-term survival.
A total of 1589 patients underwent TAVI with available TTE and invasive pressure gradients. A total of 49.2% received self-expanding valves (SEVs), and 50.8% received balloon-expanding valves (BEVs); 7.2% underwent valve-in-valve (ViV); 17.6% received a small valve (Evolut ≤26 mm, Sapien ≤23 mm, and Portico/Navitor ≤25 mm). For the entire cohort, the TTE and invasive mean gradients showed a moderate correlation (Spearman ρ = 0.401), with a median absolute difference of 2.2 [1.0–4.0] mmHg. The SEV gradients were more strongly correlated than the BEV gradients (ρ = 0.447 vs. 0.345). Similarly, the small valve gradients were more strongly correlated than the large valve gradients (ρ = 0.455 vs. 0.375), while the ViV gradients were more strongly correlated than the native TAVI gradients (ρ = 0.575 vs. 0.357). A total of 1.6% of the patients had a difference >10 mmHg between the invasive and TTE gradients. In the multivariable Cox regression, a >10 mmHg discordance was not significantly associated with an increased hazard of death after TAVI (p = 0.326).
Following TAVI, we observed a moderate correlation between TTE and invasive measurements of mean AV pressure gradients, with only modest discordance noted between measurement modalities.
Keywords
- invasive AV gradient
- TTE
- transvalvular AV gradient
- TAVI
Transcatheter aortic valve implantation (TAVI) has been used increasingly in patients with severe aortic stenosis (AS) [1, 2, 3]. In the outpatient setting, transthoracic echocardiography (TTE) is the predominant tool used to assess transvalvular gradients [4]. Given its reliability in measuring gradients across calcified valves, TTE has also been applied to the evaluation of valvular function immediately following valve implantation, acting in conjunction with invasive catheterization as a metric of procedural success [5]. However, even after accounting for factors such as pressure recovery and sinotubular junction (STJ) dimensions, some reports suggest that TTE may misjudge valvular gradients across surgical prostheses due to various valve and aortic properties [6]. Though prior studies suggest that TTE may overestimate transvalvular pressure gradients after TAVI, evidence regarding the accuracy of TTE for assessment of valvular gradients in comparison to invasive catheter measurements remains lacking [7, 8]. This study aims to compare post-procedural echocardiographic and invasive mean pressure gradients immediately after TAVI, while also identifying predictors and clinical outcomes associated with discordance between these two measurement modalities.
This was an observational study using a prospectively maintained database of TAVI procedures performed at a single institution from 2012 to 2023. Definitions and terminology were consistent with the Society of Thoracic Surgeons (STS)–American College of Cardiology (ACC) Transcatheter Valve Therapy (TVT) Registry. All patients undergoing TAVI with both invasive and echocardiographic post-procedural mean aortic valve pressure gradients were included in the study. Mean valvular gradient measurements were collected in the immediate post-procedural setting after deployment of the transcatheter heart valve. Echocardiographic gradients were measured according to current recommendations from the American Society of Echocardiography [9]. Invasive gradients were obtained from simultaneous left ventricular (LV) and aortic pressures measured via pigtail catheters. This study was approved by the Institutional Review Board of the University of Pittsburgh on 4/17/2019 (STUDY18120143), with written consent waived.
This study aimed to assess the correlation between post-procedural TTE and invasive pigtail catheter mean aortic valve pressure gradients in patients undergoing TAVI. The correlation between the invasive and the TTE pressure gradient before TAVI was not assessed in this study. In severe AS, TTE is the gold standard for quantifying stenosis severity because of the simplified Bernoulli equation, which assumes laminar flow at a single level of stenosis and treats flow acceleration and viscous forces as negligible. However, these assumptions may not be true for non-restrictive transcatheter heart valves. For this reason, invasive pressure gradients are unlikely to significantly diverge from TTE pressure gradients when the valve is severely stenotic, while they are more likely to diverge when the valve is non-restrictive [10]. By implication, correlating TTE and invasive pressure gradients before TAVI is unlikely to be related to correlations after TAVI.
The primary outcome was the correlation between TTE and invasive mean pressure
gradient measurements after TAVI. Secondarily, this study sought to determine
risk factors for discordance between TTE and invasive pigtail gradients
Immediately after valve deployment, LV and aortic pressures were recorded simultaneously. LV pressure was obtained retrograde with a pigtail positioned as apically as feasible in the LV, while aortic pressure was obtained in the proximal ascending aorta via a second pigtail through contralateral access. All transducers were flushed and zeroed to atmospheric pressure. Waveforms were checked for dampening prior to acquisition. The mean transvalvular gradient was calculated from the difference between LV and aortic pressures integrated over systole, which were averaged across three consecutive beats at end-expiration.
Continuous variables were presented as mean
Spearman’s coefficient was used to assess the correlation between TTE and
invasive gradients (where coefficient values from 0.90 to 1.0 indicate very
strong correlation; 0.70 to 0.89 strong correlation; 0.40 to 0.69 moderate
correlation; and
A total of 1589 patients underwent TAVI with available TTE and invasive pressure
gradients. Baseline characteristics are reported in Table 1. In this cohort, 782
(49.2%) of the implanted valves were self-expanding valves (SEV) and 807
(50.8%) were balloon-expanding valves (BEV). Additionally, 1474 (92.8%)
procedures involved TAVI in native valves, while 115 (7.2%) were valve-in-valve
(ViV) procedures. Transcatheter heart valves were additionally stratified by
size, with small valves defined as Evolut (Medtronic, Minneapolis, MN, USA)
valves
| Variable | Total TAVI Cohort (n = 1589) | |
| Age (years) | 82.0 [77.0–87.0] | |
| Sex: Women | 750 (47.2%) | |
| Race: Caucasian | 1235 (77.7%) | |
| Body Mass Index (BMI) (kg/m2) | 27.8 [24.2–32.3] | |
| STS Predicted Risk of Mortality (%) | 4.4 [2.8–7.1] | |
| Creatinine (mg/dL) | 1.1 [0.9–1.4] | |
| Diabetes mellitus | 598 (37.6%) | |
| Cerebrovascular disease | 96 (6.0%) | |
| Peripheral vascular disease | 414 (26.1%) | |
| Hypertension | 1381 (86.9%) | |
| Prior aortic valve replacement | 155 (9.8%) | |
| History of heart failure | 353 (22.2%) | |
| History of myocardial infarction | 377 (23.7%) | |
| Atrial fibrillation | 602 (37.9%) | |
| Operative Variables | ||
| Variable | Total TAVI Cohort (n = 1589) | |
| Valve design | ||
| Balloon-expanding (BEV) | 807 (50.8%) | |
| Self-expanding (SEV) | 782 (49.2%) | |
| Valve size | ||
| Large valve* | 1309 (82.4%) | |
| Small valve* | 280 (17.6%) | |
| Valve-in-valve (ViV) | 115 (7.2%) | |
* Small valves were defined as Evolut valves
For the entire cohort, TTE and invasive mean gradients correlated moderately
well (Spearman
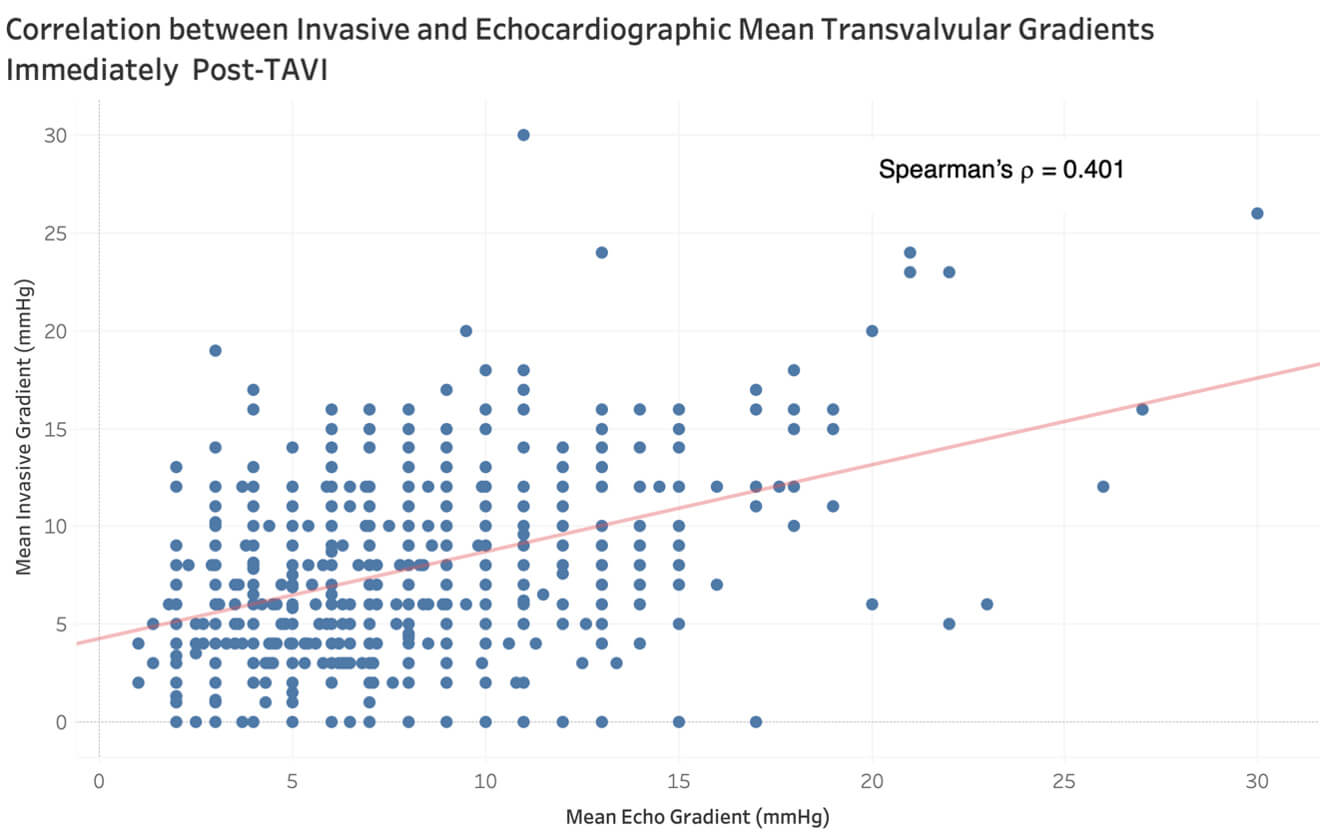 Fig. 1.
Correlation between invasive and echocardiographic mean transvalvular aortic gradients immediately post-TAVI.
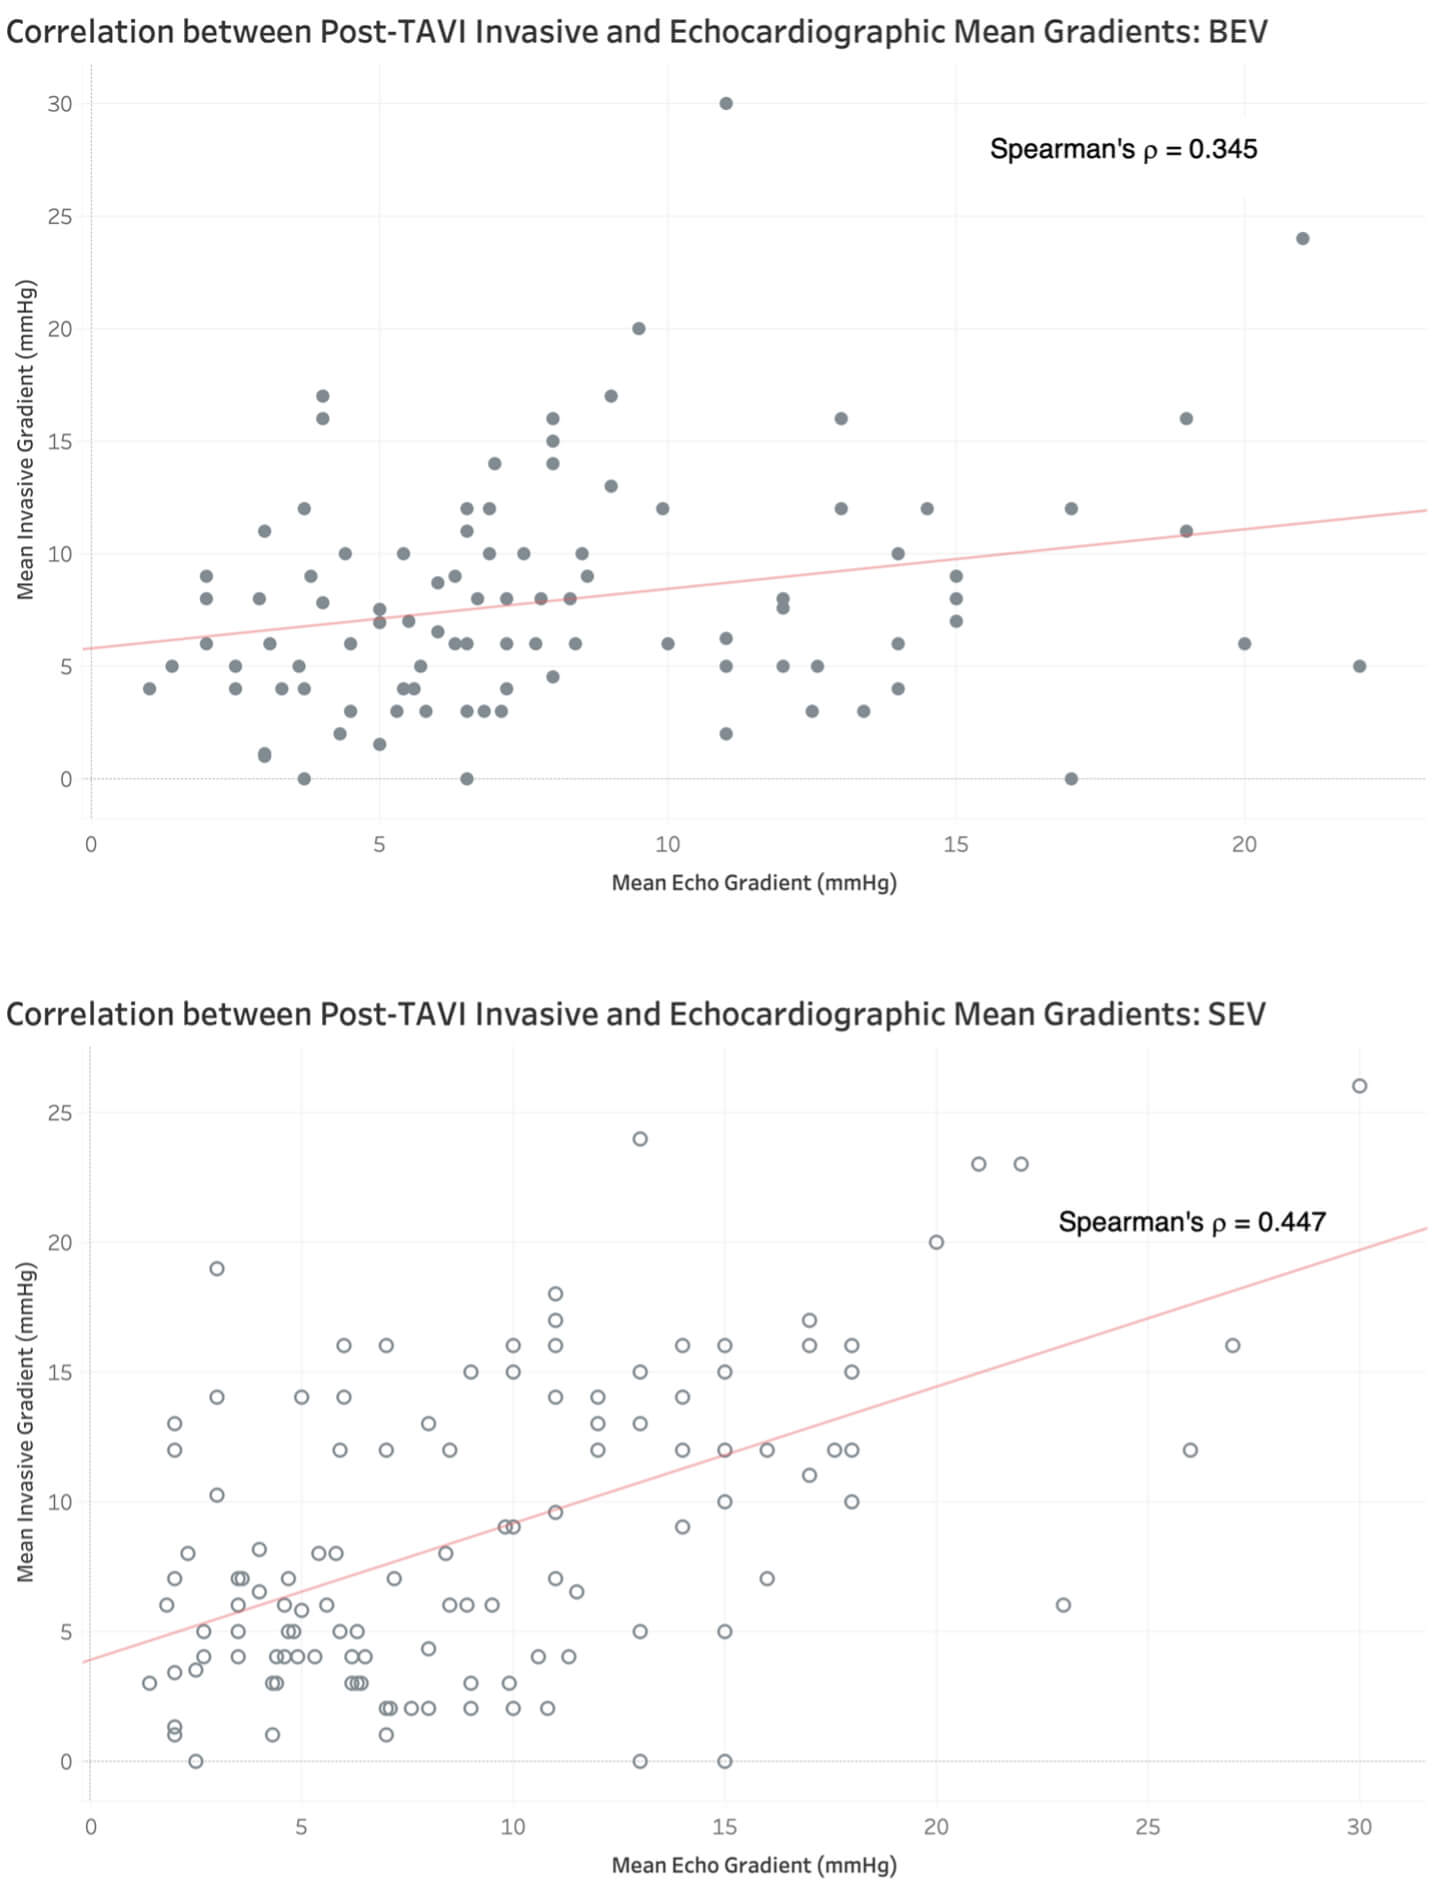 Fig. 2.
Correlation between post-TAVI invasive and echocardiographic mean gradients in balloon- vs. self-expanding valve designs.
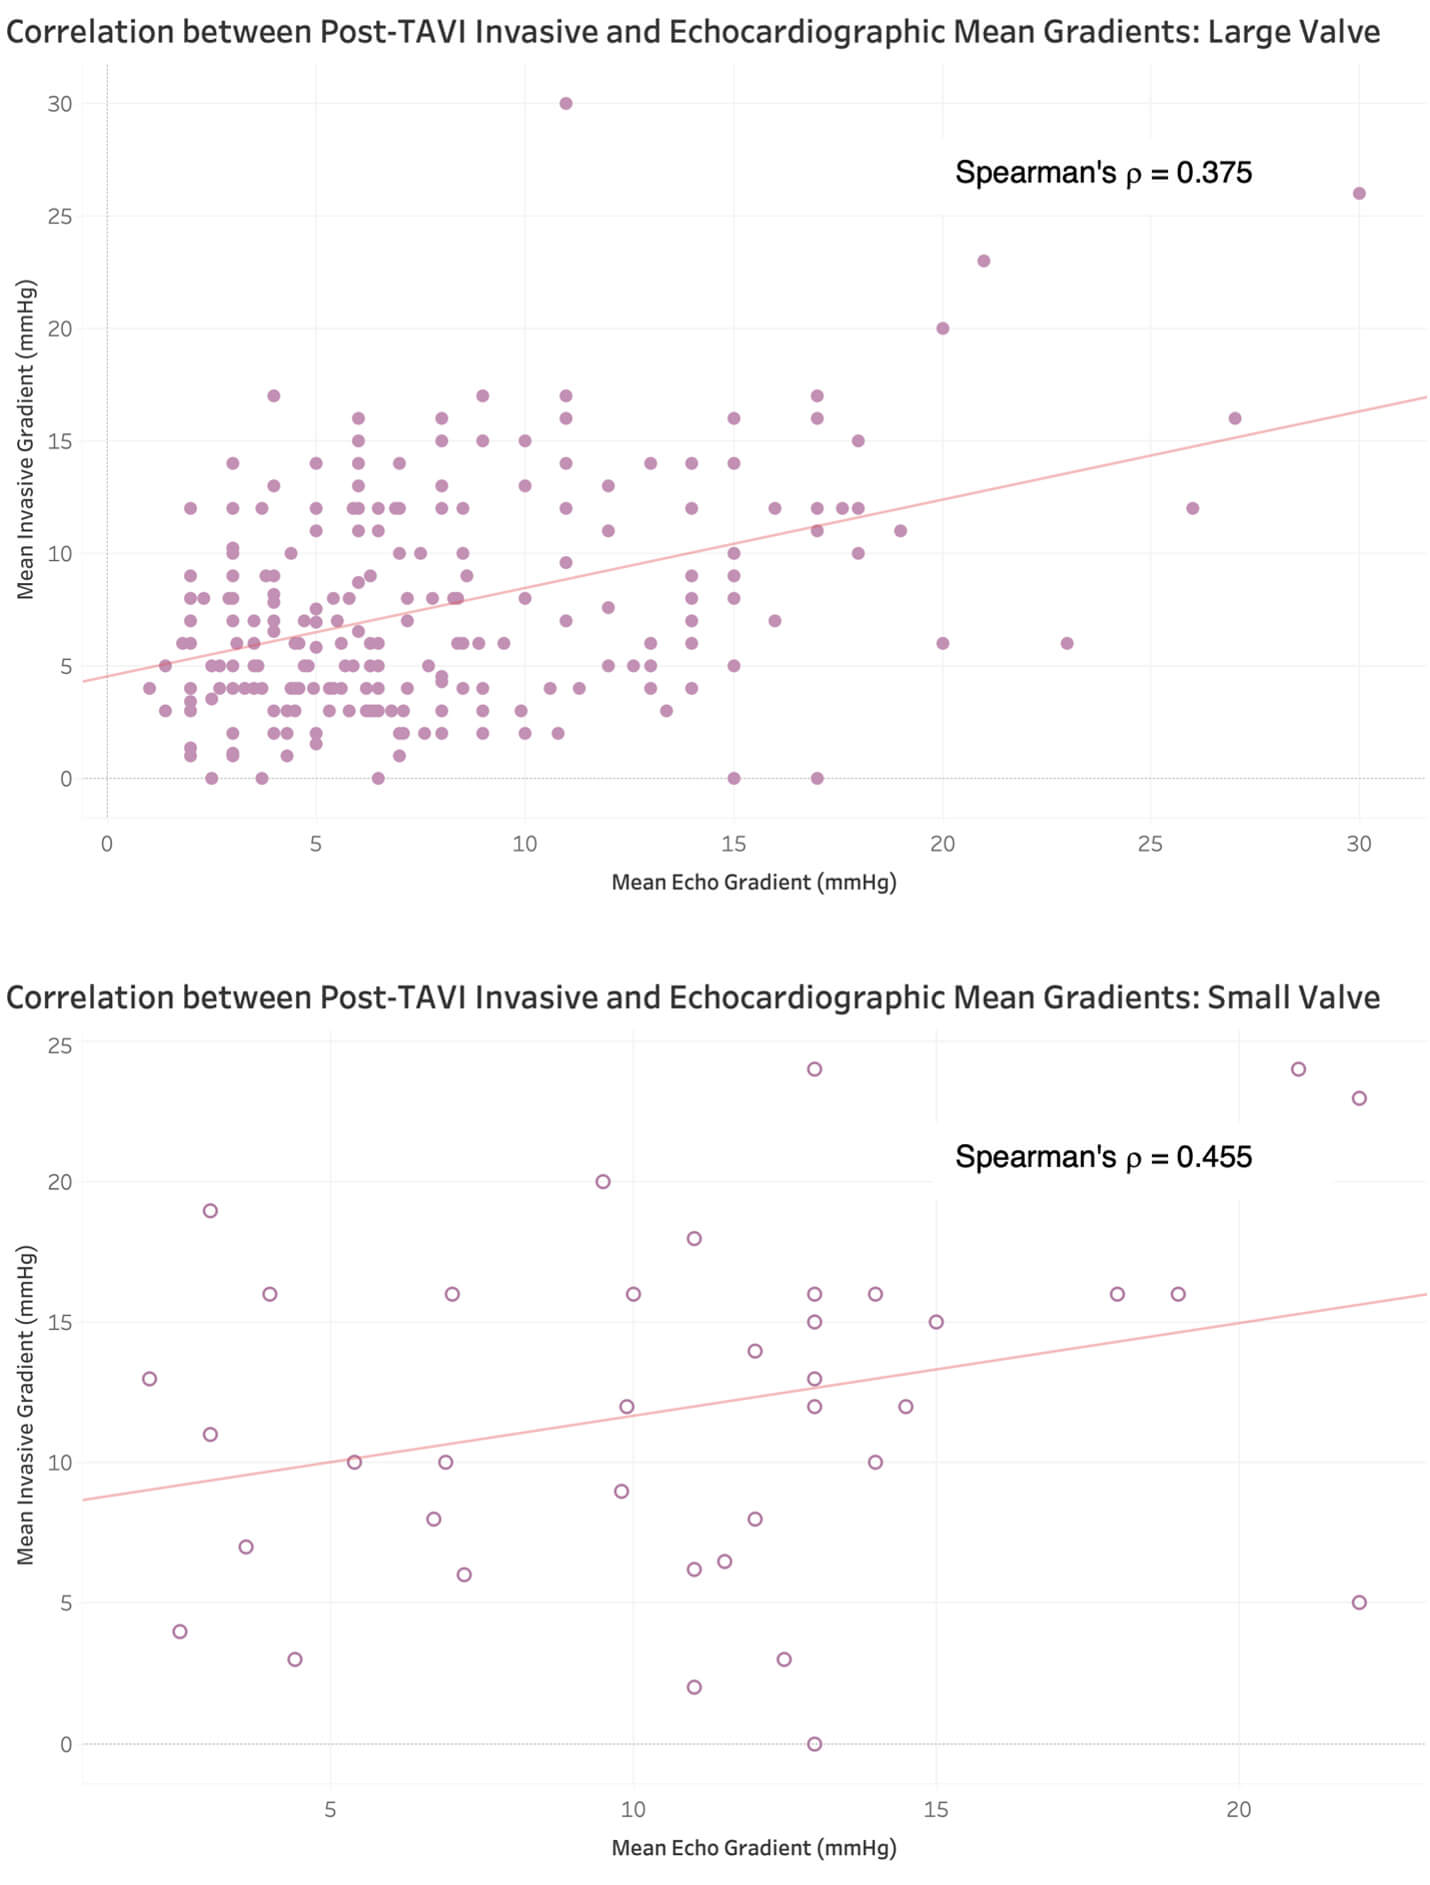 Fig. 3.
Correlation between post-TAVI invasive and echocardiographic mean gradients in large vs. small valve implantation.
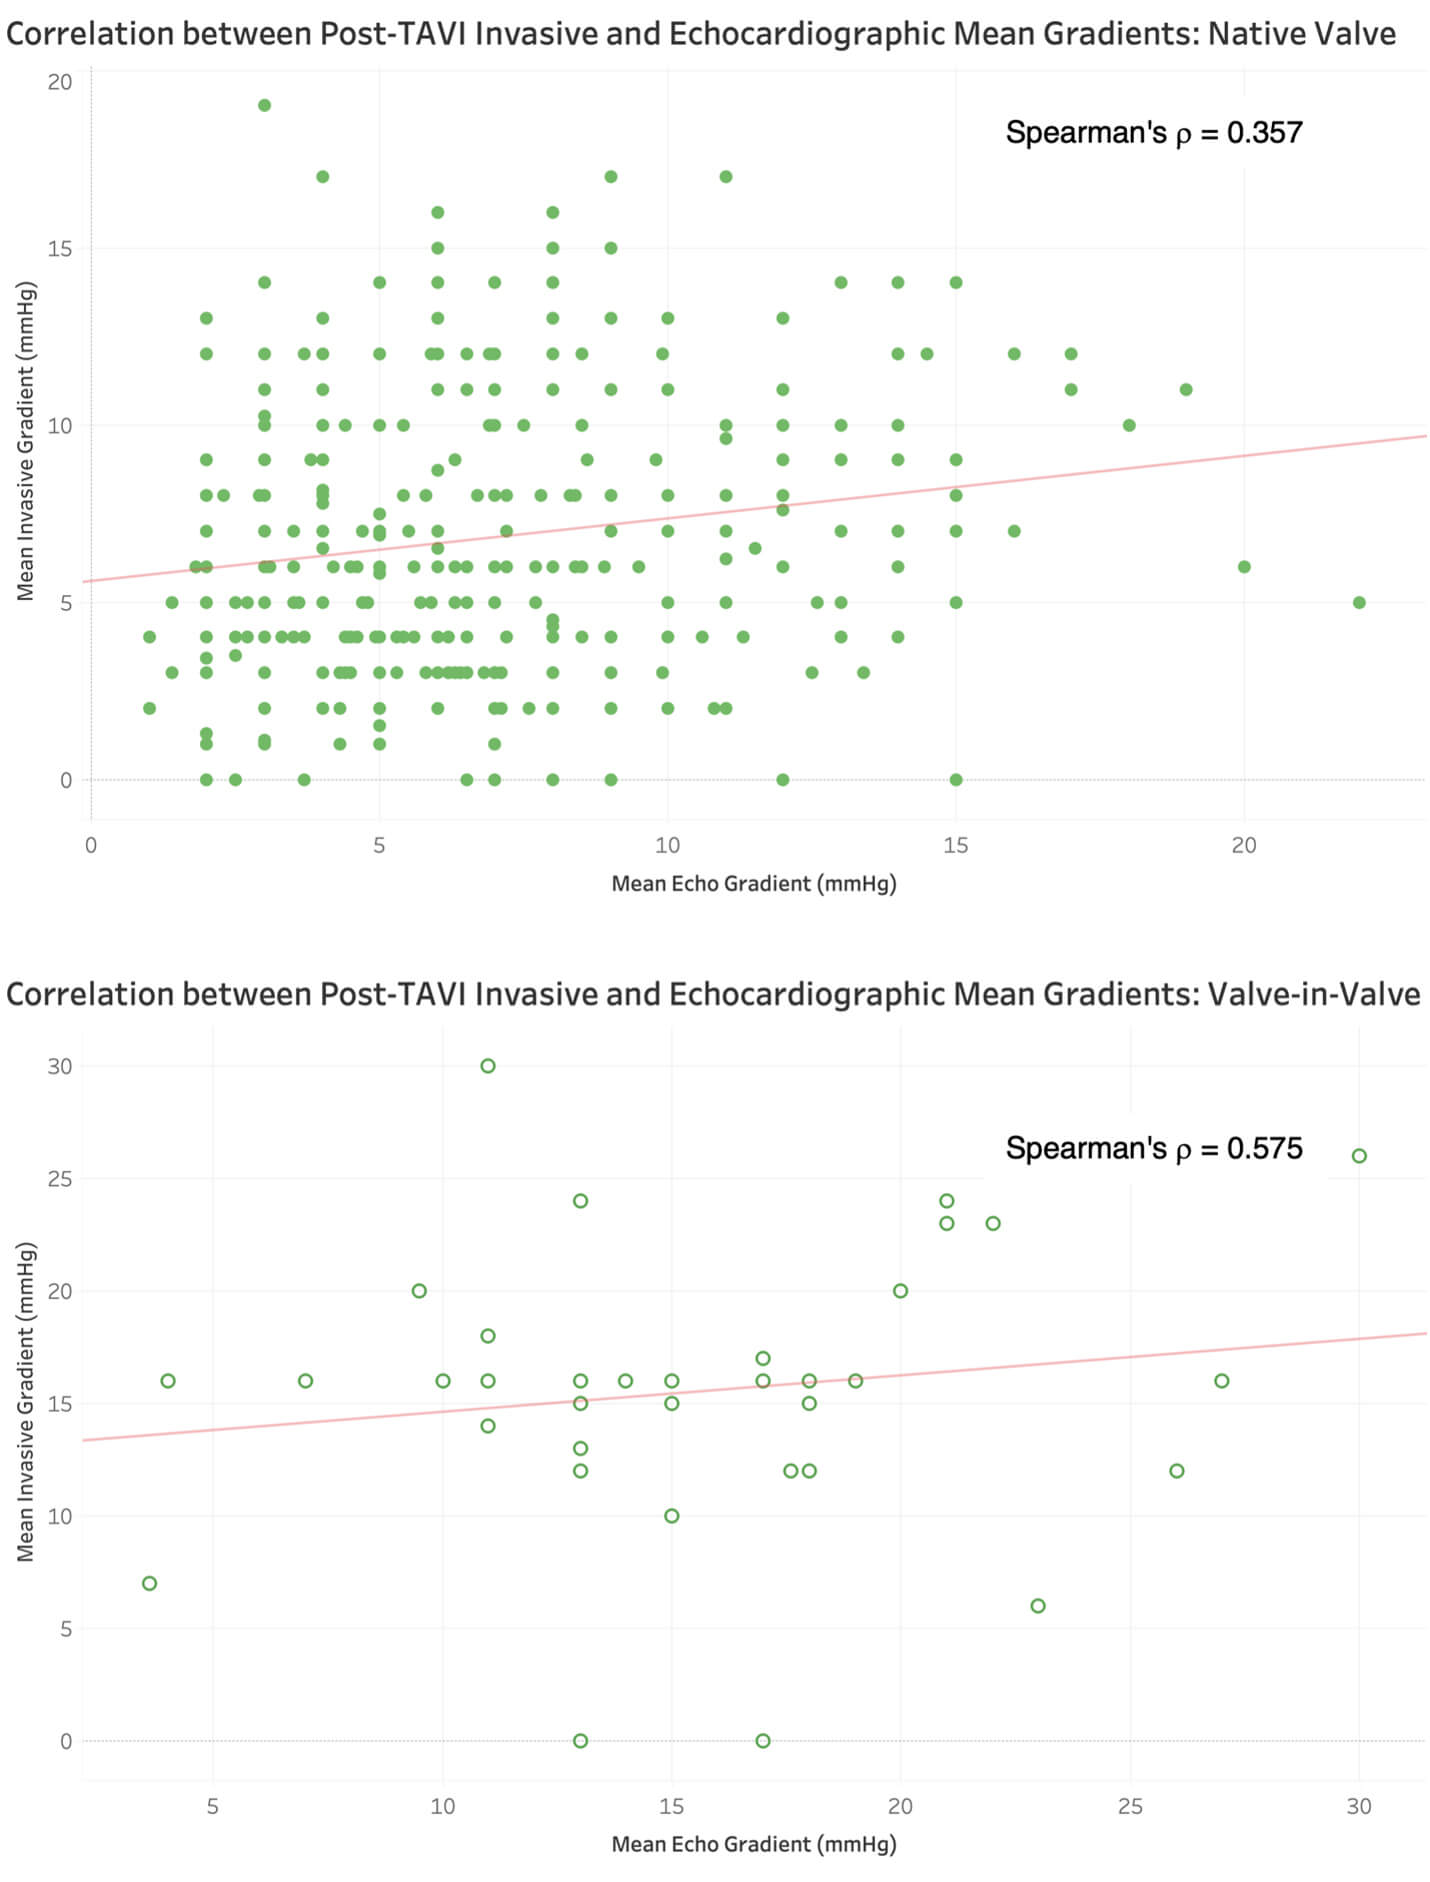 Fig. 4.
Correlation between post-TAVI invasive and echocardiographic mean gradients in native vs. valve-in-valve implantations.
| Variable | Total Cohort (n = 1589) |
| Invasive mean gradient (mmHg) | 6.0 [4.0–9.0] |
| TTE mean gradient (mmHg) | 6.0 [4.0–8.0] |
| TTE-Invasive Discordance (mmHg) | 2.2 [1.0–4.0] |
| Spearman correlation coefficient between TTE and invasive gradients ( |
0.401 (0.360–0.440) |
| Variable | Balloon-expanding valves (n = 807) | Self-expanding valves (n = 782) | p-value |
| Invasive mean gradient (mmHg) | 6.0 [4.0–8.0] | 6.0 [4.0–9.0] | 0.665 |
| TTE mean gradient (mmHg) | 6.0 [4.5–8.0] | 6.0 [4.0–8.0] | 0.936 |
| TTE-Invasive Discordance (mmHg) | 2.0 [1.0–4.0] | 3.0 [1.0–4.0] | 0.028 |
| Spearman correlation coefficient between TTE and invasive gradients ( |
0.345 (0.283–0.404) | 0.447 (0.390–0.504) | N/A |
| Variable | Large valve (n = 1309) | Small valve (n = 280) | p-value |
| Invasive mean gradient (mmHg) | 6.0 [4.0–9.0] | 7.0 [5.0–10.0] | |
| TTE mean gradient (mmHg) | 6.0 [4.0–8.0] | 8.0 [5.0–10.0] | |
| TTE-Invasive Discordance (mmHg) | 2.5 [1.0–4.0] | 2.0 [1.0–4.0] | 0.099 |
| Spearman correlation coefficient between TTE and invasive gradients ( |
0.375 (0.327–0.421) | 0.455 (0.358–0.544) | N/A |
| Variable | Native valve (n = 1474) | Valve-in-valve (n = 115) | p-value |
| Invasive mean gradient (mmHg) | 6.0 [4.0–8.0] | 10.0 [6.0–15.0] | |
| TTE mean gradient (mmHg) | 6.0 [4.0–8.0] | 10.0 [7.0–13.0] | |
| Discordance (mmHg) | 2.0 [1.0–4.0] | 3.0 [1.0– 5.0] | 0.075 |
| Spearman correlation coefficient between TTE and invasive gradients ( |
0.357 (0.312–0.401) | 0.575 (0.438–0.690) | N/A |
To assess agreement between TTE and invasive pressure gradients, we constructed a Bland-Altman plot. The bias (i.e., mean difference between TTE and invasive pressure gradients) was –0.31 mmHg (SD 3.88), with 95% limits of agreement of –7.92 to 7.30 mmHg (Supplementary Fig. 1). This near-zero bias indicated no systematic difference between each modality of measuring pressure gradients. 95% of pairs differed by less than 8 mmHg, and visual inspection of the Bland-Altman plot showed no proportional bias across the measurement range.
The difference between the TTE and invasive pressure gradient was calculated and
called the “TTE-invasive discordance”. The TTE-invasive discordance was
compared to the TTE gradient to determine if the TTE-invasive discordance changed
as the TTE gradient increased. Correlation between TTE-invasive discordance and
TTE mean gradients was weak (Spearman
Twenty-five patients (1.6%) had a TTE-invasive discordance that exceeded 10
mmHg. Patients with a TTE-invasive discordance
| Variable | Discordance |
Discordance |
p-value |
| In-hospital mortality | 6 (0.4%) | 0 (0.0%) | 0.756 |
| Permanent pacemaker placement | 163 (10.4%) | 2 (8.0%) | 0.910 |
| Renal failure requiring dialysis | 3 (0.2%) | 0 (0.0%) | 0.827 |
| Stroke | 42 (2.7%) | 0 (0.0%) | 0.406 |
| Blood product transfusion | 60 (3.8%) | 3 (12.0%) | 0.038 |
| Major vascular complications | 3 (0.2%) | 1 (4.0%) |
| Effect | Odds ratio | 95% confidence interval | p-value |
| Race: Caucasian | 0.50 | 0.22–1.15 | 0.103 |
| Sex: Female | 1.43 | 0.64–3.17 | 0.377 |
| Cerebrovascular disease | 0.41 | 0.06–3.06 | 0.385 |
| Prior aortic valve replacement | 7.75 | 3.45–17.39 | |
| Hypertension | 0.79 | 0.27–2.32 | 0.664 |
| Diabetes mellitus | 1.81 | 0.82–4.00 | 0.141 |
| Atrial fibrillation | 1.52 | 0.69–3.36 | 0.297 |
| History of heart failure | 0.47 | 0.14–1.59 | 0.226 |
| Valve-in-valve TAVI | 11.03 | 4.89–24.90 | |
| Balloon-expanding | 0.64 | 0.29–1.44 | 0.281 |
| Small valve | 3.20 | 1.42–7.19 | 0.005 |
| Age (years) | 0.93 | 0.89–0.97 | 0.001 |
| Body mass index (BMI) (kg/m2) | 1.02 | 1.00–1.04 | 0.071 |
| Creatinine (mg/dL) | 1.22 | 0.96–1.53 | 0.099 |
Median [IQR] follow-up for the entire cohort was 3.3 [2.1–4.9] years and there
were a total 505 (31.8%) deaths. On multivariable Cox regression, a TTE-invasive
discordance
| Variable | Hazard ratio | 95% confidence interval | p value |
| Discordance |
1.37 | 0.73–2.54 | 0.326 |
| Valve-in-valve (ref: native TAVI) | 1.02 | 0.54–1.94 | 0.946 |
| Balloon-expanding valve (ref: self-expanding valve) | 0.99 | 0.77–1.26 | 0.912 |
| Race: Caucasian | 1.20 | 0.97–1.48 | 0.097 |
| Sex: female | 0.94 | 0.74–1.20 | 0.622 |
| History of heart failure | 1.72 | 0.99–2.97 | 0.053 |
| Cerebrovascular disease | 1.15 | 0.84–1.57 | 0.383 |
| Prior aortic valve replacement | 0.95 | 0.58–1.55 | 0.836 |
| Peripheral vascular disease | 1.00 | 0.81–1.24 | 1.000 |
| Hypertension | 1.22 | 0.93–1.60 | 0.150 |
| Diabetes mellitus | 1.37 | 1.04–1.53 | 0.016 |
| Atrial fibrillation | 1.30 | 1.08–1.57 | 0.006 |
| History of heart failure | 0.79 | 0.52–1.19 | 0.259 |
| Age (years) | 1.00 | 0.98–1.01 | 0.401 |
| Body mass index (BMI) (kg/m2) | 1.00 | 0.99–1.01 | 0.326 |
| Creatinine (mg/dL) | 1.21 | 1.08–1.36 | 0.001 |
| Small valve (ref: large valve) | 1.09 | 0.77–1.55 | 0.628 |
To determine if the raw pressure gradients measured by either modality were separately more predictive of survival, another Cox model was built, with the post-procedural TTE and invasive pressure gradients being treated as independent variables for predicting death. For this model, the same covariates listed in Table 5 were utilized. Neither the TTE pressure gradient (HR: 1.02 [per 1 unit increase in mmHg], 95% CI: 0.90–1.16, p = 0.750) nor the invasive pressure gradient (HR: 1.10 [per 1 unit increase in mmHg], 95% CI: 0.99–1.22, p = 0.080) were independently associated with mortality.
In this study, we present a single-center analysis of concordance between
post-TAVI TTE and invasively measured prosthetic AV pressure gradients. Moderate
correlation was seen between TTE and invasive measurement modalities immediately
post-TAVI. Moreover, the median discordance between TTE and invasive measurements
was modest (2.2 mmHg). Out of all subgroups analysed, ViV, SEVs, and small-valve
TAVIs had the strongest correlation between TTE and invasive measurements,
relative to native TAVI, BEV, and large-valve TAVI. TTE–invasive discordance
The use of echocardiography for measurement of mean valvular gradients and subsequent aortic valve function is longstanding. Earliest reports date back to 1980 when echocardiography was first used by Hatle et al. [13] in conjunction with Bernoulli’s equation to derive pressure gradients across stenotic aortic valves. Since then, understanding of pressure differences across the aortic valve has broadened to incorporate the idea of pressure recovery, with modification of Bernoulli’s equation to account for structural cardiac measurements, such as LVOT diameter and STJ diameter [14]. As such, in the preoperative setting, TTE is regarded to be the most important diagnostic tool for AS [4, 15]. Stenosed aortic valves allow for TTE to be an accurate measurement tool due to minimal contributions of certain unmeasurable parameters, such as viscous forces, that are treated as negligible in the modified Bernoulli’s equation [10]. However, after implantation, several studies have questioned the application of TTE to evaluate transvalvular pressure gradients. Because TAVI relieves the stenosis, there may be overestimation of the post-TAVI transvalvular pressure gradient by TTE when compared to invasive hemodynamic assessment [6, 16, 17]. It is argued that, while the increased aortic velocity across a severely stenotic aortic valve is primarily due to convective acceleration, this may not be true for non-restrictive prosthetic valves, where flow acceleration and viscous forces may play a larger role.
Similar to the current study, previous analyses have also been performed in patients undergoing TAVI. A series of studies by Abbas et al. [7, 8] have highlighted high levels of discordance between echocardiographic and invasive measurements of pressure gradients after prosthetic valve implantation. Additional reports have examined variance in echocardiographic data for different TAVI valve shapes, specifically observing high Doppler gradient measurements in smaller BEVs [18, 19]. In an attempt to understand flow patterns after TAVI, a recent study by Johnson et al. [20] observed higher post-TAVI valve resistances (mean transvalvular pressure loss over transvalvular flows) in SEVs vs. BEVs, further contributing to the notion that the frame and skirt dimensions of transcatheter valves may variably impact gradient assessment by TTE versus invasive hemodynamics.
In contrast to previous reports suggesting a weak correlation between
measurement modalities, the results of our current study demonstrate a moderate
correlation (total cohort
This study has several important limitations. First, the retrospective observational design of the study may introduce considerable selection bias. Gradient data were measured and collected by a single operator, thereby introducing a potential source of measurement bias. Moreover, TTE gradients were acquired immediately following TAVI, with patients in a supine position. This may have resulted in improper capturing of peak aortic velocities, potentially leading to underestimation of TTE mean gradients. Finally, this study’s data are from a single centre, which may limit the generalizability of the findings to other institutions with different experiences with TAVI.
Invasive and TTE pressure gradients were obtained in close temporal succession after valve deployment, but not simultaneously. Thus, interval changes in several parameters — such as blood pressure, heart rate/rhythm, preload/afterload, respiration, and level of sedation — may have introduced variability between modalities. Additionally, this is a single-center retrospective study, presenting inherent limitations for generalizability and leaving room for residual or unmeasured confounding despite multivariable adjustment.
After TAVI, transvalvular mean pressure gradients measured via TTE presented a moderate correlation with invasive measurements, with a modestly higher TTE gradient compared to the invasive gradient. This finding differs from prior reports which suggest that invasive and TTE gradients present a poor correlation after TAVI.
Data to support the findings of this study are available on reasonable requests from the corresponding author.
JAB, EA, MPS, AMP, SY, NA, DK, CT, AM, YW, FWT, DSG and IS contributed to the design, data collection, analysis, interpretation, and writing. All authors read and approved the final manuscript. All authors have participated sufficiently in the work and agreed to be accountable for all aspects of the work.
The study was carried out in accordance with the guidelines of the Declaration of Helsinki and approved by the Ethics Committee of the University of Pittsburgh (Protocol No. 18120143). Consent was waived because this study involved secondary analysis of existing patient data, which was derived from a prospectively maintained database in a deidentified fashion.
Not applicable.
This research received no external funding.
IS receives institutional research support from Abbott, Atricure, Artivion, Edwards Lifesciences, Medtronic, and Terumo Aortic. None of these are related to this manuscript.
Supplementary material associated with this article can be found, in the online version, at https://doi.org/10.31083/HSF50776.
References
Publisher’s Note: IMR Press stays neutral with regard to jurisdictional claims in published maps and institutional affiliations.