


 , Evan P. Rotar 1, Paranjay D. Patel 2, James Keiler 3, Kenan W. Yount 1, Leora T. Yarboro 1, Robert B. Hawkins 4, Nicholas R. Teman 1,*
1 Division of Cardiac Surgery, University of Virginia, Charlottesville, VA 22903 USA
2 Department of Vascular Surgery, Houston Methodist, Houston, TX 77030, USA
3 Department of Surgery, Emory University, Atlanta, GA 30322, USA
4 Department of Cardiac Surgery, University of Michigan, Ann Arbor, MI 48109, USA
Abstract
Psoas muscle cross-sectional area predicts morbidity and mortality as a surrogate for frailty in cardiac surgery patients, but routine preoperative abdominal imaging is uncommon. We hypothesized that pectoralis and psoas muscle cross-sectional area correlate, and pectoralis area may predict morbidity and mortality for patients undergoing surgical aortic valve replacement (SAVR).
A psoas muscle area validation cohort of moderate to high-risk patients undergoing SAVR (1/2009–12/2016) were identified from the University of Virginia. Pectoralis muscle area identified on preoperative computed tomography (CT) was indexed to body surface area to define pectoralis index. Sarcopenia was defined as pectoralis index below sex-specific 25th percentile. Patients were stratified by sarcopenic status, and regression analysis identified risk-adjusted associations utilizing Society of Thoracic Surgeons (STS) predicted risk scores.
Preoperative chest imaging was available for 228 patients. Sarcopenic patients were significantly older (median 82 vs 80 years, p = 0.041) and had greater mean society of thoracic surgeons predicted risk of mortality (STS PROM) (7.0% vs 5.7%, p = 0.047). There was no difference by sarcopenic status for operative mortality (8.8% vs 4.1%, p = 0.171) or major morbidity (21.1% vs 19.9%, p = 0.849). Risk-adjusted pectoralis index was associated with greater STS major morbidity (OR 0.998, p = 0.021), likelihood of discharge to a facility (OR 0.998, p = 0.014), and one-year mortality (OR 0.997, p = 0.025).
Lower pectoralis index may be associated with worse risk-adjusted outcomes after SAVR. Pectoralis defined sarcopenia may serve as a useful measure of frailty in cardiac surgery patients.
Keywords
- pectoralis index
- aortic valve replacement
- frailty
- psoas index
- cardiac surgery
- preoperative
- outcomes
The US population is aging at a rapid rate, with 55.8 million people over 65 in 2021. This number is expected to double over the next several decades [1]. There is a significant association between advanced age and aortic stenosis, and the latest population-wide trends reported for incidence of aortic stenosis support this [1]. This upward trend underscores the increasing frequency of transcatheter aortic valve replacement (TAVR) as the preferred intervention in elderly patients, which has likely contributed to a decrease in surgical aortic valve replacement (SAVR) in this population. These changes highlight the critical need for improved predictive methods to accurately assess surgical risk and guide decision-making between TAVR and SAVR, ensuring optimal patient outcomes [1].
Increasing age, comorbidities, and frailty of patients undergoing cardiac surgery present challenges to today’s cardiac surgeon [2]. However, over the last two decades, the advancement of surgical techniques, myocardial protection, and cardiac anesthesia have led to a reduction in the morbidity and mortality of cardiac surgery [3, 4]. While significant improvements have been made in outcomes, hurdles such as stroke, renal failure, and operative morbidity and mortality persist [5]. In order to guide surgeons in operative decision making there are numerous risk models that have been developed. These risk models include standard risk factors and comorbidities. However, despite these predictive models there is still an emphasis on preoperative surgeon assessment or the use of the “eye-ball test” to assess a patient’s preoperative readiness for surgery [6, 7].
Previously, the psoas muscle index as a measure of sarcopenia has been correlated to frailty and utilized successfully as a predictor of SAVR outcomes in moderate to high-risk patients [8]. The utility of this model is limited by the lack of preoperative abdominal imaging in many patients undergoing cardiac surgery. Because computed tomography (CT) scans of the chest are often performed for cardiac surgical planning, a similar predictive metric utilizing thoracic structures would be of greater utility. The purpose of this study was to validate the use of pectoralis cross-sectional area as an objective measure of frailty and demonstrate its utility as a prognostic tool for moderate to high-risk patients undergoing SAVR. We hypothesized that the pectoralis index would be as effective a predictor of outcomes after SAVR as the established psoas index model.
This study was approved by the University of Virginia Institutional Review
Board, #23305. This study utilized institutional first-time SAVR patients with
severe aortic stenosis and a society of thoracic surgeons predicted risk of
mortality (STS PROM)
Cost data was obtained from the Clinical Data Repository and was derived from finance department records. Each patient has charges identified by Current Procedural Terminology code and converted to costs based on monthly updates that include direct and indirect component costs. The sum cost was then adjusted for inflation to 2016 dollars using the market basket for the inpatient prospective payment system at the Centers for Medicare and Medicaid Services.
Mid-term mortality was determined by data provided by clinical records, the Virginia Department of Health, and the Social Security Death Master file. Cross-sectional area of the pectoralis minor and major muscles were measured using preoperative CT scans. All measurements were taken in triplicate by two independent reviewers (PP and JK) at the level of the superior most aspect of the aortic arch (Supplementary Fig. 1). The summed average of three values for the left and right pectoralis major/minor were divided by body surface area to calculate the pectoralis index. Those with a pectoralis index below the 25th sex-specific percentile was defined as sarcopenic based on definitions used in the original description of the frailty phenotype and prior analyses [9, 10, 11].
A previously defined psoas index was utilized as a validation cohort [8]. The psoas index had near identical inclusion and exclusion criteria with exception of requiring computed tomography of the chest. Outcomes measured included operative mortality, 1-year mortality, in-hospital complications, postoperative length of stay, and cost.
Categorical variables are presented as count (%) while continuous variables are
presented as mean
All measures of pectoralis major, pectoralis minor, and total pectoral cross-sectional area were performed by two independent reviewers and were found to be highly reproducible (R2 = 0.92, 0.72, and 0.91 respectively) (Fig. 1). Previously measured values of total psoas cross sectional area weakly correlated with total pectoralis area (R2 = 0.28) (Fig. 2). Sarcopenic patients, as defined by the pectoralis index, were also found to have a significantly lower psoas index (9.1 vs 9.7 cm2/m2, p = 0.026).
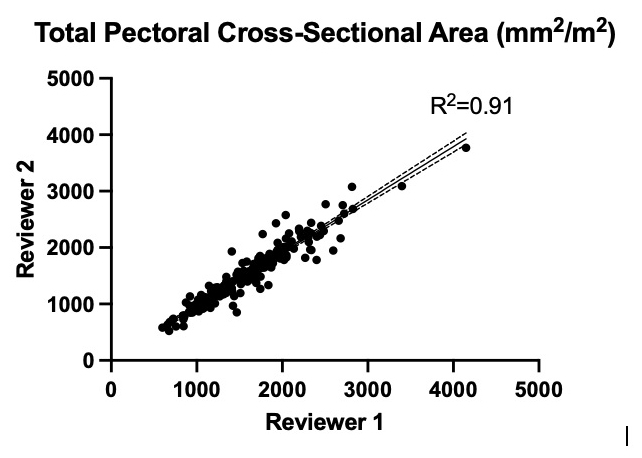 Fig. 1.
Inter-reviewer plot of total pectoral cross-sectional area with Pearson correlation coefficient.
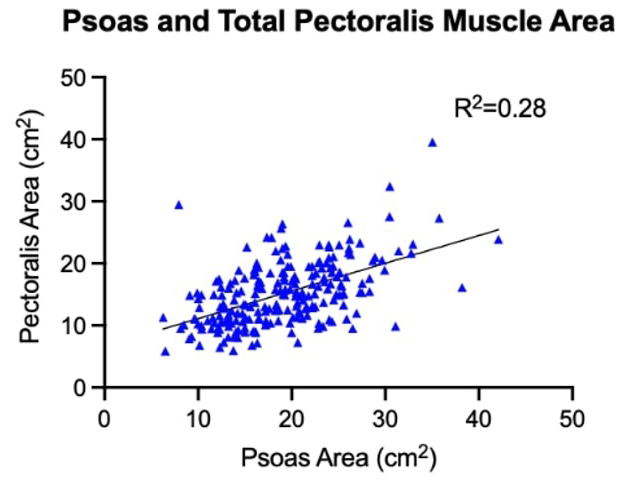 Fig. 2.
Pectoralis and psoas cross-sectional area with Pearson correlation coefficient.
Table 1 shows the baseline and operative characteristics for sarcopenic patients (25%; n = 57) and non-sarcopenic patients (75%; n = 171). Sarcopenic patients were significantly older (82 vs 80 years, p = 0.041) and had a higher STS PROM (7.0% vs 5.7%, p = 0.047) when compared to their non-sarcopenic counterparts. Non-sarcopenic patients were more likely to have had prior cardiac surgery than sarcopenic patients (33.3% vs 17.5%, p = 0.023). Other baseline characteristics, including smoking status, hypertension, prior stroke, and mitral disease were not significantly different.
| Sarcopenic | Non-Sarcopenic | p value | ||
| (n = 57) | (n = 171) | |||
| Baseline characteristics | ||||
| Psoas index (cm2/m2) | 9.1 (8.1–10.8) | 9.7 (8.0–11.8) | 0.026 | |
| Age (years) | 82 [76–86] | 80 [76–84] | 0.041 | |
| Body surface area (m2) | 1.93 |
1.93 |
0.221 | |
| Female | 23 (40.4%) | 69 (40.4%) | 1.000 | |
| Smoker | 10 (17.5%) | 38 (22.2%) | 0.453 | |
| Hypertension | 51 (89.0%) | 152 (89.0%) | 0.903 | |
| Diabetes | 23 (40.4%) | 79 (46.2%) | 0.442 | |
| Dialysis dependent renal failure | 1 (1.8%) | 2 (1.2%) | 0.737 | |
| Prior stroke | 8 (14.0%) | 18 (10.5%) | 0.470 | |
| Chronic lung disease, moderate/severe | 13 (23.2%) | 41 (24.0%) | 0.907 | |
| Prior myocardial infarction | 21 (36.8%) | 60 (35.1%) | 0.811 | |
| Heart failure within 2 weeks | 47 (82.5%) | 141 (82.5%) | 1.000 | |
| Ejection fraction (%) | 55 (38–63) | 57 (45–63) | 0.179 | |
| Aortic insufficiency (moderate/severe) | 6 (10.5%) | 15 (8.8%) | 0.692 | |
| Mitral insufficiency (moderate/severe) | 17 (31.5%) | 34 (20.9%) | 0.111 | |
| Predicted risk of mortality (%) | 7.0% (4.5–9.1%) | 5.7% (3.9–8.0%) | 0.047 | |
| Operative characteristics | ||||
| Prior cardiac surgery | 10 (17.5%) | 57 (33.3%) | 0.023 | |
| Urgent or Emergent status | 16 (28.1%) | 44 (25.7%) | 0.728 | |
| Coronary artery bypass grafting | 23 (40.4%) | 54 (31.6%) | 0.225 | |
| Cross clamp time (min) | 74 (60–89) | 71 (59–88.5) | 0.929 | |
| Cardiopulmonary bypass time (min) | 103 (84–127) | 103 (88–121) | 0.861 | |
There were no significant differences in unadjusted operative mortality, one year mortality, major morbidity, or measures of resource utilization between sarcopenic and non-sarcopenic patients (Table 2). Mid-term survival by Kaplan-Meier analysis showed similar results for both patient populations, but there was a trend toward improved survival in non-sarcopenic patients (Fig. 3).
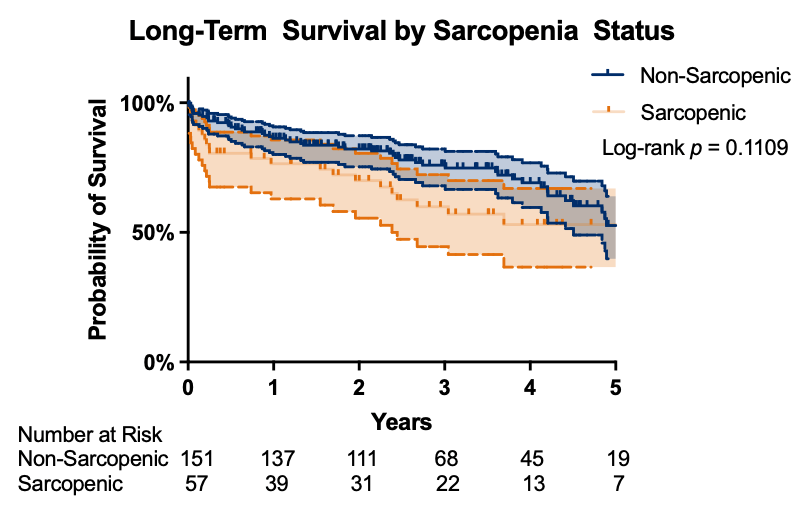 Fig. 3.
Kaplan-Meier survival analysis by sarcopenia status. Number at risk displayed below graph to corresponding time point. Log-rank p = 0.1109.
| Sarcopenic | Non-Sarcopenic | p value | |
| (n = 57) | (n = 171) | ||
| STS operative mortality | 5 (8.8%) | 7 (4.1%) | 0.171 |
| One-year mortality (n = 174) | 13 (31.0%) | 23 (17.4%) | 0.059 |
| STS major morbidity | 12 (21.1%) | 34 (19.9%) | 0.849 |
| Permanent stroke | 2 (3.5%) | 6 (3.5%) | 1.000 |
| Cardiac arrest | 1 (1.8%) | 4 (2.3%) | 0.794 |
| Prolonged ventilation | 9 (15.8%) | 18 (10.5%) | 0.287 |
| Renal failure requiring dialysis | 3 (5.3%) | 6 (3.5%) | 0.556 |
| Deep sternal wound infection | 0 (0%) | 1 (0.6%) | 0.563 |
| Atrial fibrillation | 16 (28.1%) | 45 (26.3%) | 0.796 |
| Pneumonia | 4 (7.0%) | 8 (4.7%) | 0.493 |
| Transfusion, packed red blood cells | 37 (64.9%) | 92 (53.8%) | 0.143 |
| Reoperation for any reason | 4 (7.0%) | 17 (9.9%) | 0.509 |
| Readmission | 8 (14.6%) | 28 (16.9%) | 0.686 |
| Discharge to facility | 33 (61.1%) | 83 (50.3%) | 0.167 |
| Hospital cost (median) | $52,269 | $51,840 | 0.738 |
| Length of stay (days; median, IQR) | 7 (5–11) | 7 (6–10) | 0.862 |
| ICU stay (hrs; median, IQR) | 115.7 (43.0–163.4) | 75 (37.7–118.0) | 0.288 |
ICU, intensive care unit; STS, Society of Thoracic Surgeons; IQR, interquartile range.
Risk-adjusted outcomes for each of the logistic regression models are shown in Table 3. When analyzed as a continuous variable, pectoralis index was predictive of one-year mortality (odds ratio 0.997, p = 0.025) and major morbidity (odds ratio 0.998, p = 0.021). Pectoralis index was an independent predictor of likelihood of discharge to a facility (odds ratio 0.998, p = 0.014).
| Odds ratio | 95% confidence limit | p-value | ||
| STS operative mortality | 0.999 | 0.996 | 1.002 | 0.460 |
| One-year mortality (n = 174) | 0.997 | 0.995 | 1 | 0.025 |
| STS major morbidity | 0.998 | 0.996 | 1 | 0.021 |
| Prolonged ventilation | 0.998 | 0.996 | 1 | 0.095 |
| Dialysis dependent renal failure | 0.998 | 0.994 | 1.002 | 0.316 |
| Permanent stroke | 0.999 | 0.995 | 1.003 | 0.621 |
| Atrial fibrillation | 0.999 | 0.997 | 1 | 0.069 |
| Readmission | 0.999 | 0.997 | 1.001 | 0.204 |
| Discharge to a facility | 0.998 | 0.997 | 1 | 0.014 |
| Estimate | 95% confidence limit | p-value | ||
| Postoperative length of stay (d) | –0.004 | –0.008 | –0.001 | 0.004 |
| ICU length of stay (hr) | –0.073 | –0.109 | –0.037 | |
We demonstrated that quantitative measurements of pectoralis muscle cross-sectional area may have utility as a marker for sarcopenia and is predictive of outcomes in moderate to high-risk surgical aortic valve replacement. Pectoralis muscle measurements were performed with standard chest CT imaging and highly reproducible. When the pectoralis index was utilized as a continuous variable, it correlated with one-year mortality and major morbidity.
Sarcopenia, defined as diminished muscle mass and/or quality, is a measurable component of frailty and has been associated with adverse health outcomes [13]. Several definitions of frailty exist, but conceptually it can be thought of as the expression of accelerated aging resulting in multi-organ dysfunction and/or increased vulnerability to stressors [8]. Frailty status has been noted to predict 6-month morbidity along with short, mid-term, and long term mortality in patients undergoing cardiac surgery [11, 12, 13, 14, 15, 16, 17, 18, 19, 20, 21, 22, 23]. While frailty assessments in preoperative surgery patients are often thought to be subjective, there have been validated objective methods to assess for frailty. Afilalo et al. [24] reported an adverse relationship with gait speed, a marker for frailty, and early mortality and morbidity following cardiac surgery. Similarly, Weig et al. [25], showed that psoas muscle mass, an additional marker for frailty, was inversely associated with respiratory complications and 6-min walking distance in lung transplant candidates.
It has been previously shown that the psoas index when used as a marker for sarcopenia and frailty is associated with an increased risk of mortality [19, 20]. However, psoas index as a metric for frailty is not readily available given that cross sectional imaging of the abdomen is not routinely ordered preoperatively for cardiac surgery patients.
Our study is unique in that it is the first study to show the use of pectoralis index to predict worse outcomes in the SAVR population. Our findings are in line with the literature as we have shown that the pectoralis index as a measure of sarcopenia is associated with a significant increased risk of major morbidity in our patient population [13]. We demonstrate that there is a trend towards lower 5-year survival in sarcopenic patients as determined by pectoralis index. Previous studies have demonstrated that pectoralis muscle mass in conjunction with muscle strength as a measure of sarcopenia has been shown to be predictive of long term-survival in patients undergoing non-small cell lung cancer resection [26]. We believe that defining sarcopenia with both pectoralis muscle mass and utilizing the pectoralis index may be a viable and reproducible strategy to determine midterm survival in the SAVR population. This index is more readily available as a metric than the psoas index since preoperative chest CT imaging is obtained routinely in SAVR patients. Additionally, other measures for frailty such as grip strength, are more cumbersome to obtain and require the use of special equipment to measure [21, 25, 27, 28].
Current risk stratification measures in cardiac surgery do not adequately incorporate frailty. This may be due to the lack of consensus on the most appropriate way to assess frailty. There have been several subjective and objective methods to assess frailty preoperatively in surgical patients. A recent meta-analysis by Lee et al. [29] of over 66,000 patients being assessed for frailty saw that the majority (63%) of measurement instruments were subjective as opposed to objective. The objective measurements of frailty used were walking velocity (71%), 6-min walk test (14%) and psoas muscle measurement (14%) [27, 28, 29]. The reason for this variability most likely lies in the ease and reproducibility of these measurements [29]. There has been data to show the addition of frailty measures to the STS PROMM confers increased value to preoperative risk assessment [10]. The ideal measurement for frailty would be an objective measurement that is easy to reproduce, consistent, and is a strong independent risk factor for surgical outcomes. We believe our data shows that the pectoralis index fits these criteria, may increase the accuracy of preoperative risk stratification and, can be a useful adjunct to current risk models for the SAVR population.
Limitations to this study include selection bias given its single center, retrospective nature. Furthermore, patient selection was limited to moderate and high-risk patients, limiting generalizability to all patients undergoing SAVR. Importantly, the changing landscape of transcatheter therapies may limit the external validity of these data. However, we feel that the increased availability of non-SAVR options only provides more of an impetus for better risk stratification methods and broader recognition of the impact of frailty on surgical outcomes. Additional limtations include the modest sample size, which may have limited the statistical power of our analyses and contributed to borderline significance in some associations. The study was also restricted by the lack of available CT derived muscle quality parameters such as pectoralis density or thickness, which could further regine assement of sarcopenia. Functional measures of frailty, including grip strength or timed-up and go testing were not routinely collected during the study period and therefore could not be correlated with pectoralis index. Lastly, while we defined sarcopenia using sex-specific 25th percentile cutoffs to normalize withon our cothor, absolute reference values were not derived. Future larger, multicenter studies incorporating both functional and radiographic frailtiy metrics are warranted.
Frailty is a known predictor of morbidity, mortality, and increased resource utilization in cardiac surgery. We have demonstrated that pectoralis size is a reproducible measure of sarcopenia, a component of frailty, that is associated with short and mid-term outcomes after SAVR similar to that of the psoas size. This makes the pectoralis index an additional simple tool to add to a surgeon’s armamentarium for preoperative decision making and patient education.
All data points generated or analyzed during this study are included in this published article.
RMA: Conceptualization, methodology, formal analysis, investigation, data curation, writing-reviewing and editing. EPR: Conceptualization, methodology, data curation, writing-reviewing and editing. PDP: Conceptualization, methodology, investigation, data curation, writing-reviewing and editing. JK: Conceptualization, methodology, investigation, writing-reviewing and editing. KWY: Methodology, conceptualization, resources, writing-reviewing and editing, supervision. LTY: Conceptualization, methodology, resources, Writing-reviewing and editing, supervision. RBH: Conceptualization, resources, data curation, formal analysis, writing-reviewing and editing, supervision. NRT: Conceptualization, resources, data curation, writing-reviewing and editing, supervision. All authors read and approved the final manuscript. All authors have participated sufficiently in the work and agreed to be accountable for all aspects of the work.
The study was carried out in accordance with the guidelines of the Declaration of Helsinki and approved by the University of Virginia’s Institutional Review Board (#23305). This was a deidentified retrospective review, so informed consent was not needed.
Not applicable.
This research received no external funding.
The authors declare no conflict of interest. Nicholas R. Teman is serving as one of the Editorial Board members of this journal. We declare that Nicholas R. Teman had no involvement in the peer review of this article and has no access to information regarding its peer review. Full responsibility for the editorial process for this article was delegated to Giuseppe Santarpino.
Supplementary material associated with this article can be found, in the online version, at https://doi.org/10.31083/HSF50003.
References
Publisher’s Note: IMR Press stays neutral with regard to jurisdictional claims in published maps and institutional affiliations.