


 , Lei Yang 2,†, Yu Zhang 3, Yongqiang Zheng 3, Ding Wang 3, Lixin Yin 3, Xianping Meng 3, Wei Xing 1,*
1 Department of Radiology, Third Affiliated Hospital of Soochow University, 213000 Changzhou, Jiangsu, China
2 Department of Radiology, The Affiliated Jiangyin Hospital of Nantong University, 214400 Jiangyin, Jiangsu, China
3 Department of Radiology, Xintai People’s Hospital, 271200 Xintai, Shandong, China
†These authors contributed equally.
Abstract
Patients with ST-segment elevation myocardial infarction (STEMI) remain at risk for major adverse cardiovascular events (MACE) following percutaneous coronary intervention (PCI). Current risk scores lack detailed myocardial tissue characteristics from cardiac magnetic resonance (CMR) imaging for long-term prediction. The aim of this study was therefore to develop and validate a prognostic nomogram that integrates CMR and clinical data to better predict 1- to 3-year MACE in new-onset STEMI patients post-PCI.
This retrospective study included patients who underwent PCI for new-onset STEMI between January 2020 and June 2022. Data from two centers were pooled. The combined cohort was then randomly divided into a derivation cohort (n = 107) for model development and an internal validation cohort (n = 46) for performance assessment. Univariate and multivariate Cox proportional hazards regression analyses were performed to identify independent risk factors and construct a nomogram. The predictive performance of this nomogram was assessed using C-indexes, time-dependent Receiver Operating Characteristic (ROC) curves, calibration curves, and decision curve analysis (DCA).
A total of 107 new-onset STEMI patients were included in the derivation cohort and 46 in the internal validation cohort. Cumulative MACE incidence rates at 1-, 2-, and 3- years were 20.6%, 34.6%, and 44.9% in the derivation cohort, and 21.7%, 34.8%, and 50.0% in the internal validation cohort, respectively. The final nomogram incorporated six independent predictors derived from both clinical and CMR data: the Gensini Score (hazard ratio [HR]: 1.012, 95% confidence interval [CI]: 1.003–1.020, p = 0.006), albumin (HR: 0.849, 95% CI: 0.769–0.938, p = 0.001), low-density lipoprotein cholesterol (LDL-C; HR: 1.377, 95% CI: 1.037–1.828, p = 0.027), Left Ventricular Ejection Fraction (LVEF; HR: 0.890, 95% CI: 0.833–0.951, p = 0.001), Left Ventricular End-Diastolic Volume (LVEDV; HR: 1.014, 95% CI: 1.003–1.025, p = 0.015), and the mean of Left Ventricular Wall Motion (LVWM; HR: 0.464, 95% CI: 0.288–0.747, p = 0.002), derived from both clinical and CMR data. The nomogram demonstrated good discriminatory ability in the derivation cohort (C-index: 0.803; 95% CI: 0.739–0.867) and moderate discrimination in the internal validation cohort (C-index: 0.693; 95% CI: 0.570–0.816). Calibration plots indicated good agreement between the predicted and observed MACE probabilities in both cohorts. DCA confirmed the potential clinical utility of the nomogram.
Our validated prognostic nomogram, integrates CMR parameters and clinical data. It effectively discriminates high- and low-risk new-onset STEMI patients for 1-, 2-, and 3-year MACE following PCI. This tool may assist with risk stratification and in guiding personalized therapeutic strategies.
Keywords
- ST-segment elevation myocardial infarction
- cardiac magnetic resonance
- nomogram
- major adverse cardiovascular events
- prognosis
Despite significant advancements in percutaneous coronary intervention (PCI) and pharmacological therapy [1, 2, 3], the occurrence of major adverse cardiovascular events (MACE) following PCI in patients with new-onset ST-segment elevation myocardial infarction (STEMI) remains a major clinical challenge. Recurrent MACE in this population not only significantly increases patient morbidity and mortality, and imposes a heavy medical and economic burden [4, 5]. Studies have reported that the incidence of MACE within the first year after PCI for STEMI can be as high as 15%–20%, and even higher in certain subgroups. Therefore, accurate identification and proactive intervention for high-risk STEMI patients are crucial for improving their long-term prognosis [6].
Accurately predicting which patients with new-onset STEMI are at high risk for MACE after PCI is of great importance for guiding individualized secondary prevention strategies, optimizing the follow-up frequency, and selecting more appropriate treatment regimens. However, currently used clinical risk scoring systems, such as the Global Registry of Acute Coronary Events (GRACE) score and the Thrombolysis in Myocardial Infarction (TIMI) score [7, 8], while valuable for early risk assessment in acute settings, have limitations in predicting long-term risk after PCI for STEMI. These scoring systems are primarily designed for acute phase prognostication and often do not incorporate detailed myocardial tissue characteristics, or comprehensive cardiac functional parameters from advanced imaging modalities like cardiac magnetic resonance (CMR), which are crucial for long-term risk stratification [9]. Consequently, the development of more precise and comprehensive prediction models for this specific patient group is an area of intense research.
CMR is a powerful, non-invasive imaging modality capable of comprehensively assessing cardiac structure, function, and myocardial tissue characteristics, including myocardial infarction size, edema, microvascular obstruction, and intramyocardial hemorrhage [10, 11]. It can be performed in a single examination, thus offering particular value in the post-STEMI setting. Accumulating evidence indicates that CMR-derived parameters, such as infarct size, the presence of microvascular obstruction, and myocardial strain, provide crucial prognostic information that extends beyond traditional clinical risk factors and standard functional indices like left ventricular ejection fraction (LVEF) [12, 13]. This makes CMR a potent tool for risk stratification and prognostic assessment in STEMI patients following PCI. Despite the prognostic value shown by CMR parameters in STEMI patients and the pressing clinical need for improved risk stratification, a clinically applicable predictive tool that integrates CMR findings with routine clinical data for long-term MACE risk assessment specifically after PCI for new-onset STEMI is still lacking. Existing clinical risk scores often fall short in predicting these long-term outcomes because they typically rely on acute clinical and angiographic data, lacking the detailed and dynamic assessment of myocardial injury, function, and remodeling provided by advanced cardiac imaging techniques such as CMR [14].
Therefore, this study aimed to develop and validate a Cox regression-based nomogram, incorporating CMR parameters and clinical variables, to accurately predict the risk of MACE at 1-, 2-, and 3- years following emergency PCI in patients with new-onset STEMI [15]. The model was constructed in a derivation cohort and subsequently validated in an internal cohort, with the aim of providing a more precise basis for clinical risk stratification and individualized therapeutic strategies for these patients.
This retrospective cohort study enrolled patients with new-onset STEMI undergoing PCI between January 2020 and June 2022 at the Affiliated Jiangyin Hospital of Nantong University (n = 120) and Xintai People’s Hospital (The Affiliated Hospital of Qilu Medical College) (n = 33). The pooled data from these 153 eligible patients were subsequently randomly allocated (7:3 ratio) into a derivation cohort (n = 107) for model development and an internal validation cohort (n = 46) for performance assessment.
The study protocol was approvaled by the ethics committees of both participating institutions (Affiliated Jiangyin Hospital of Nantong University, Approval No. 2025 Lun Shen Yan No. 014; Xintai People’s Hospital/The Affiliated Hospital of Qilu Medical College, Approval No. 2025-S021) and adhered to the Declaration of Helsinki. Given the retrospective nature of the study and expedited review, the requirement for written informed consent was waived by the ethics committees of both participating institutions.
STEMI diagnosis followed the 2021 American Heart Association/American College of
Cardiology/American Society of Echocardiography/American College of Chest
Physicians/Society for Academic Emergency Medicine/Society of Cardiovascular
Computed Tomography/Society for Cardiovascular Magnetic Resonance
(AHA/ACC/ASE/CHEST/SAEM/SCCT/SCMR) Guideline for Chest Pain [16]. Key inclusion
criteria were first-onset STEMI, successful PCI (TIMI flow
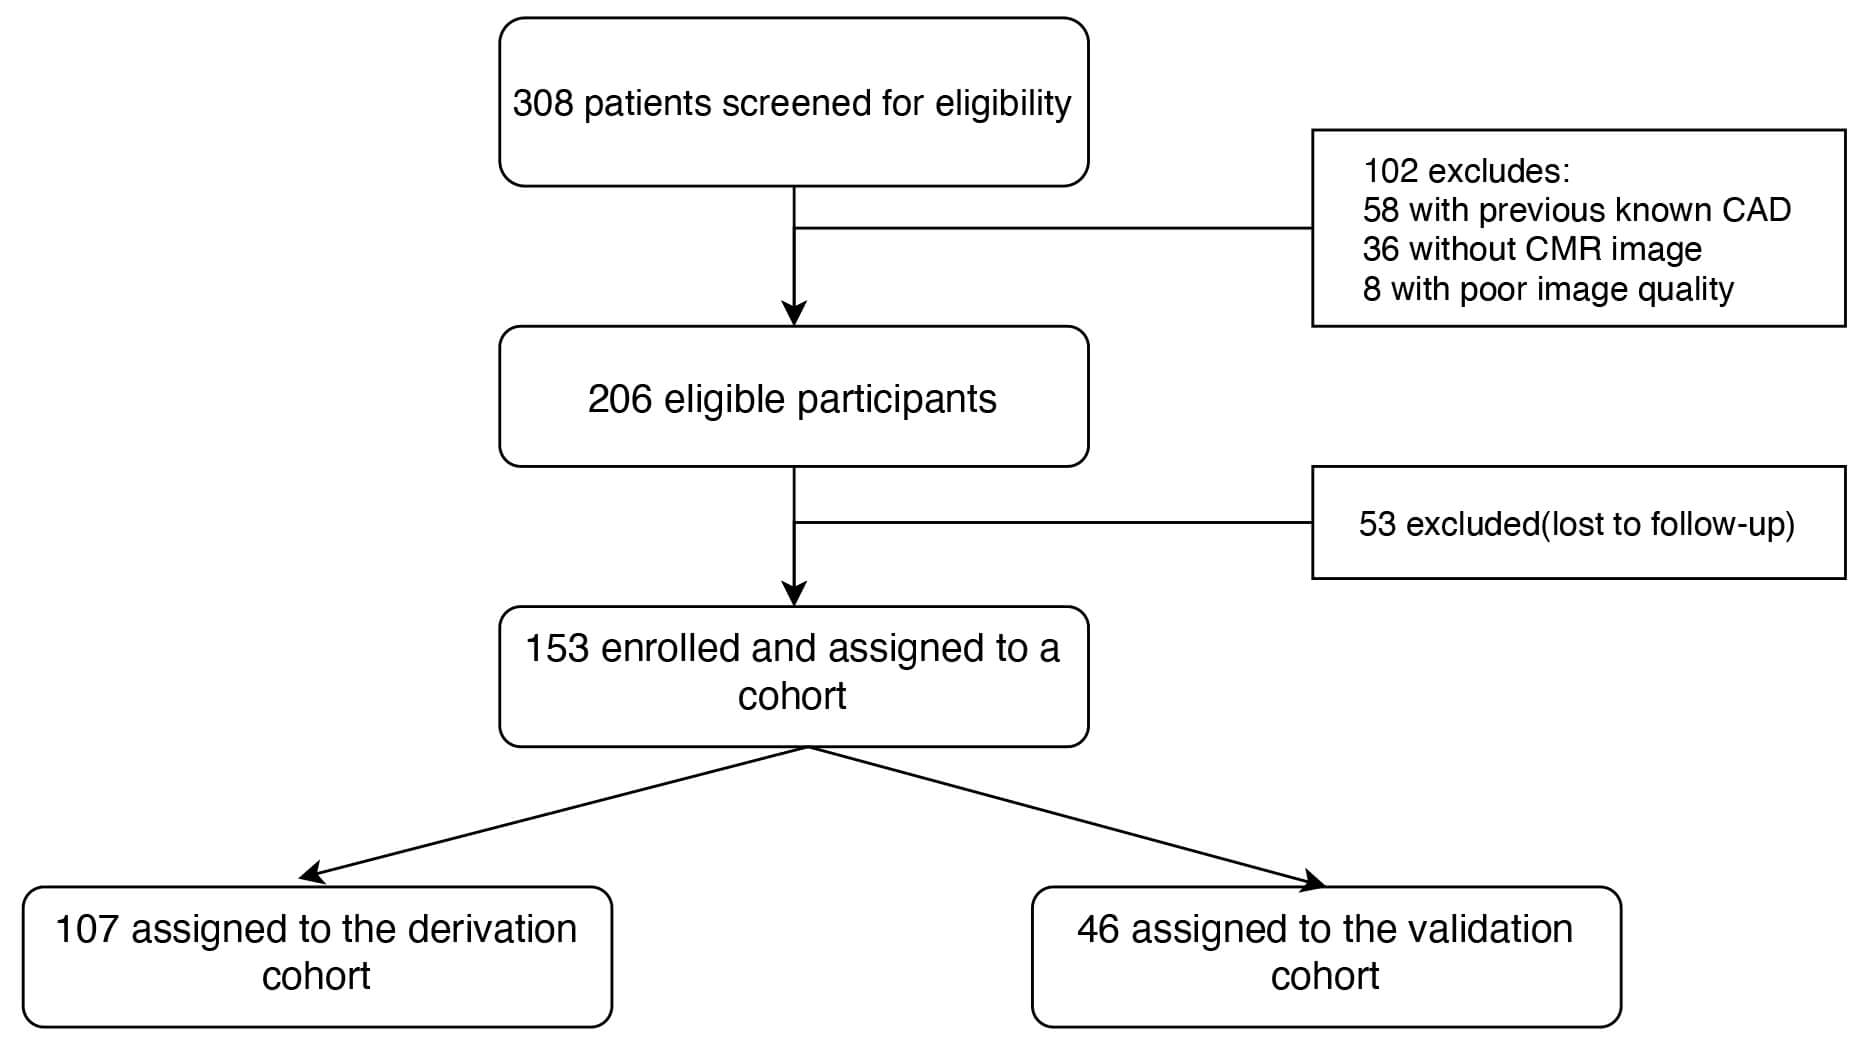 Fig. 1.
Flowchart for patient selection. Of 308 STEMI patients post-PCI, 102 were excluded (prior coronary artery disease, no CMR, poor image quality). From 206 eligible patients, 53 were lost to follow-up. The remaining 153 patients were enrolled and randomized to a derivation cohort (n = 107) for nomogram development, and a validation cohort (n = 46) for performance assessment. CAD, coronary artery disease; CMR, cardiac magnetic resonance.
Upon approval from the institutional ethics committees and obtaining informed consent, data for eligible patients with new-onset STEMI undergoing PCI were retrospectively extracted from the electronic medical record systems of the participating centers.
Baseline data collected included demographics (age, sex), clinical characteristics (cardiovascular risk factors, Killip class, comorbidities), and angiographic/procedural details (culprit vessel, diseased vessel number, PCI specifics). Angiographic severity was quantified using the Gensini Score, calculated by experienced cardiologists who were blinded to other data. Standard admission laboratory profiles encompassed hematology, renal and liver function, comprehensive lipid panels (total cholesterol, triglycerides, high-density lipoprotein cholesterol (HDL-C), low-density lipoprotein cholesterol (LDL-C), ApoA1, ApoB, Lp(a)), fasting glucose, HbA1c, cardiac enzymes, N-terminal pro-B-type natriuretic peptide (NT-proBNP), serum albumin, electrolytes, homocysteine, etc.
All patients underwent CMR imaging, typically 3–7 days post-PCI on a Philips Ingenia 3.0T scanner (Philips Healthcare, Netherlands) system. The protocol included ECG-gated steady-state free precession (SSFP) cine sequences for LV volumes, mass, LVEF, and regional wall motion, and late gadolinium enhancement (LGE) imaging 10–15 minutes post-contrast (Magnevist, Bayer, gadopentetate dimeglumine, 0.1–0.2 mmol/kg) to assess the myocardial scar [17].
CMR images were analyzed offline by two experienced radiologists (blinded to outcomes) using the Philips IntelliSpace Portal (ISP) workstation V6 (Philips Healthcare, Best, Netherlands). The key parameters quantified included Left Ventricular End-Diastolic Volume (LVEDV), Left Ventricular End-Systolic Volume (LVESV), LVEF, myocardial mass, mean Left Ventricular Wall Motion (LVWM) score (AHA 17-segment model), infarct size (IS), and microvascular obstruction (MVO). A representative case demonstrating comprehensive CMR assessment in a 57-year-old male patient with acute anterior STEMI post-PCI is illustrated in Fig. 2, showcasing the multiparametric evaluation approach employed in this study.
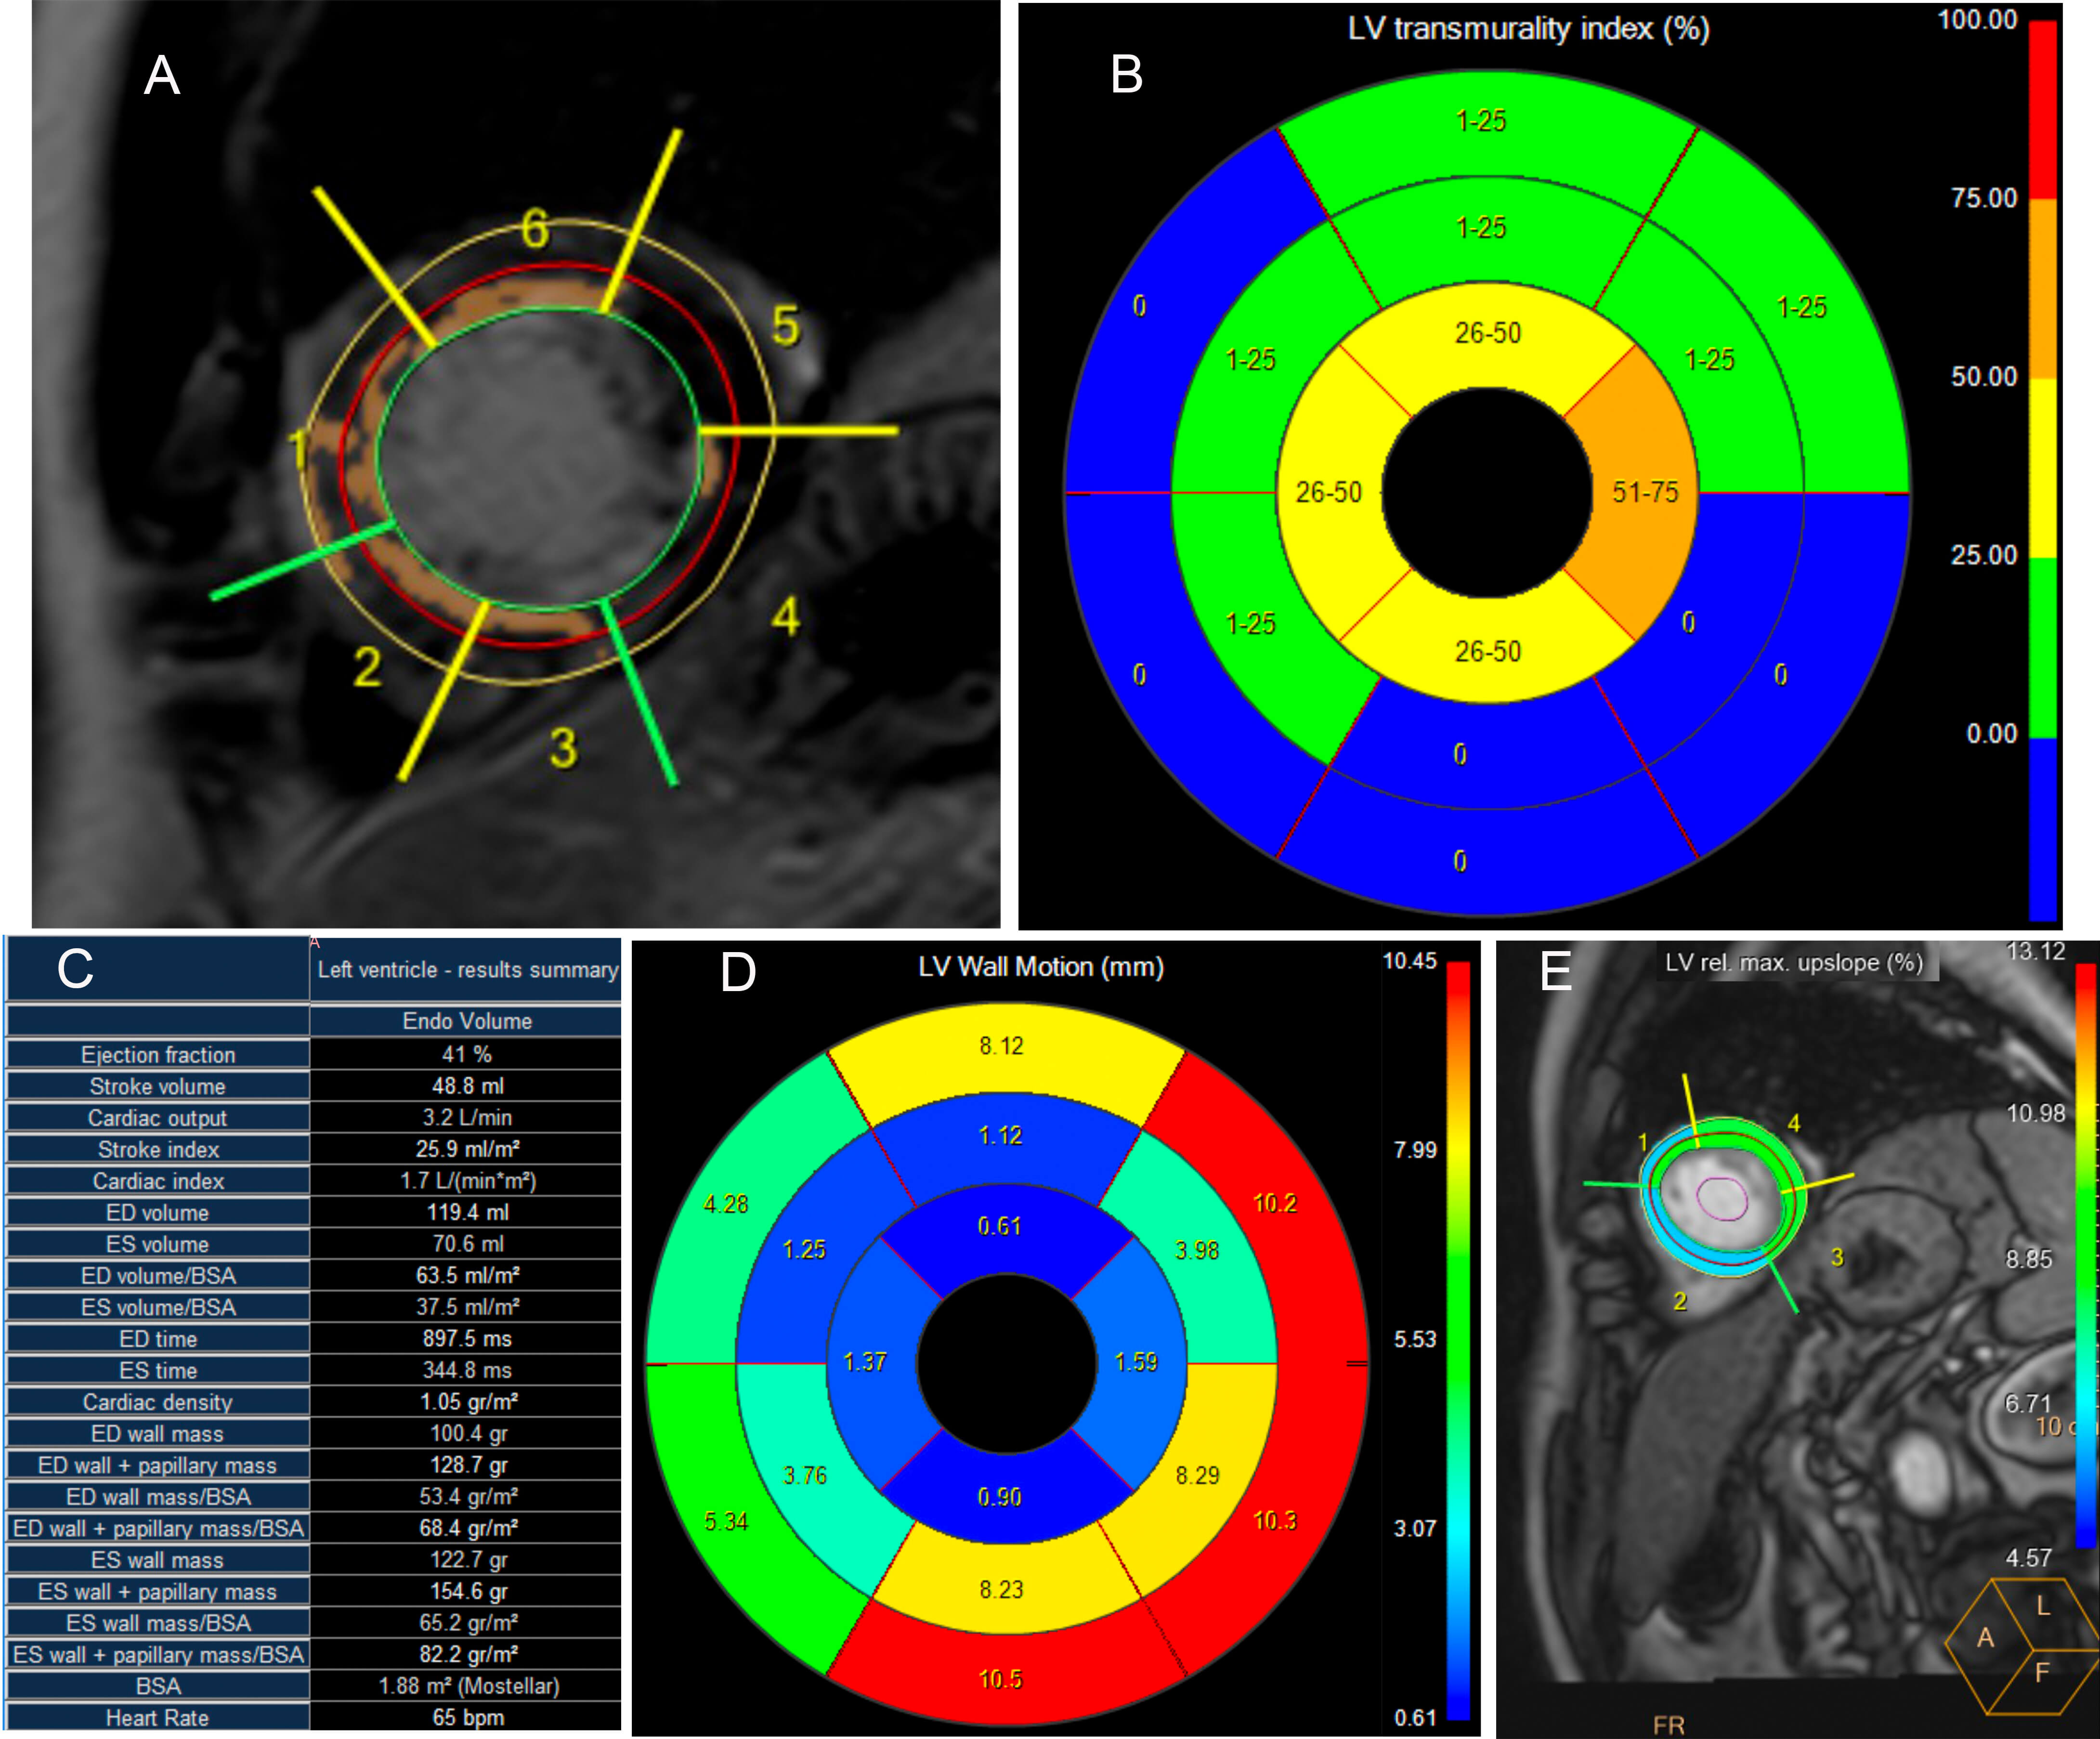 Fig. 2.
Cardiac magnetic resonance assessment of myocardial viability and function following primary PCI for acute anterior STEMI. Patient: 57-year-old male with acute anterior STEMI treated with primary PCI. (A) Short-axis LGE image with AHA 17-segment labeling (1–6). Hyperintense regions (arrows) indicate myocardial scar. (B) LGE transmurality bulls-eye plot: blue (0%), green (1–25%), yellow (26–50%), orange (51–75%), red (76–100%). Predominant blue indicates preserved viability. (C) LV functional parameters: EF 41%, EDV 119.4 mL, SV 48.8 mL, CO 3.2 L/min. (D) Wall motion analysis showing apical-to-basal gradient consistent with anterior wall abnormality. (E) First-pass perfusion with ROI 1–4 for microvascular assessment. PCI, percutaneous coronary intervention; STEMI, ST-segment elevation myocardial infarction; LGE, late gadolinium enhancement; AHA, American Heart Association; LV, left ventricular; EF, ejection fraction; EDV, end-diastolic volume; SV, stroke volume; CO, cardiac output; ROI, region of interest.
The primary outcome was MACE, which is a composite of all-cause death, recurrent myocardial infarction, heart failure hospitalization, clinically driven in-stent restenosis, and repeat unplanned revascularization [18]. All patients underwent systematic follow-up after discharge through outpatient visits, telephone interviews, and medical record reviews at 1, 3, 6, 12, 24, and 36 months post-PCI.
Continuous variables were described as the mean
A nomogram was constructed from the final model to estimate the 1-, 2-, and
3-year risk of MACE. Model performance was assessed in both derivation and
internal validation cohorts via Harrell’s C-index (discrimination),
time-dependent AUCs, calibration plots (Hosmer-Lemeshow test for
goodness-of-fit), and decision curve analysis (DCA) for clinical utility [19].
The analyses were performed with R software (version 4.2.2, R Foundation for
Statistical Computing, Vienna, Austria) and SPSS software (version 26.0, IBM
Corp., Armonk, NY, USA). A p-value of
A total of 153 patients with new-onset STEMI who underwent PCI were included in
this study. Patients were divided into a derivation cohort (n = 107) and an
internal validation cohort (n = 46). The baseline clinical, laboratory, and CMR
characteristics of the patients in both cohorts are detailed in Tables 1,2.
Overall, the two cohorts were well-balanced for most baseline characteristics.
However, statistically significant differences were found between the derivation
and internal validation cohorts for diastolic blood pressure (85.83
| Characteristic | Level | Overall (n = 153) | Derivation dataset (n = 107) | Validation dataset (n = 46) | p |
| MACE | No | 82 (53.59) | 59 (55.14) | 23 (50.00) | 0.103 |
| Yes | 71 (46.41) | 48 (44.86) | 23 (50.00) | ||
| Gender (%) | Female | 34 (22.22) | 27 (25.23) | 7 (15.22) | 0.248 |
| Male | 119 (77.78) | 80 (74.77) | 39 (84.78) | ||
| Age (mean (SD), years) | 55.67 (11.58) | 55.75 (11.49) | 55.50 (11.93) | 0.904 | |
| Diabetes mellitus (%) | No | 115 (75.16) | 80 (74.77) | 35 (76.09) | |
| Yes | 38 (24.84) | 27 (25.23) | 11 (23.91) | ||
| Hypertension (%) | No | 47 (30.72) | 32 (29.91) | 15 (32.61) | 0.888 |
| Yes | 106 (69.28) | 75 (70.09) | 31 (67.39) | ||
| Hyperlipidemia (%) | No | 69 (45.10) | 49 (45.79) | 20 (43.48) | 0.931 |
| Yes | 84 (54.90) | 58 (54.21) | 26 (56.52) | ||
| Hyperuricemia (%) | No | 128 (83.66) | 92 (85.98) | 36 (78.26) | 0.344 |
| Yes | 25 (16.34) | 15 (14.02) | 10 (21.74) | ||
| Thyroid dysfunction (%) | No | 139 (90.85) | 98 (91.59) | 41 (89.13) | 0.859 |
| Yes | 14 (9.15) | 9 (8.41) | 5 (10.87) | ||
| Smoking (%) | No | 74 (48.37) | 52 (48.60) | 22 (47.83) | |
| Yes | 79 (51.63) | 55 (51.40) | 24 (52.17) | ||
| Alcohol (%) | No | 103 (67.32) | 69 (64.49) | 34 (73.91) | 0.341 |
| Yes | 50 (32.68) | 38 (35.51) | 12 (26.09) | ||
| Gensini score (mean (SD)) | 45.02 (37.72) | 45.29 (37.48) | 44.40 (38.69) | 0.895 | |
| Left anterior descending artery (%) | No | 79 (51.63) | 56 (52.34) | 23 (50.00) | 0.929 |
| Yes | 74 (48.37) | 51 (47.66) | 23 (50.00) | ||
| Left circumflex artery (%) | No | 127 (83.01) | 89 (83.18) | 38 (82.61) | |
| Yes | 26 (16.99) | 18 (16.82) | 8 (17.39) | ||
| Right coronary artery (%) | No | 109 (71.24) | 74 (69.16) | 35 (76.09) | 0.501 |
| Yes | 44 (28.76) | 33 (30.84) | 11 (23.91) | ||
| Systolic blood pressure (mean (SD), mmHg) | 132.42 (24.48) | 131.46 (25.01) | 134.65 (23.32) | 0.462 | |
| Diastolic blood pressure (mean (SD), mmHg) | 84.35 (13.58) | 85.83 (14.04) | 80.91 (11.89) | 0.040 | |
| Renal Function Classification (%) | eGFR |
114 (74.51) | 82 (76.64) | 32 (69.57) | 0.473 |
| eGFR |
39 (25.49) | 25 (23.36) | 14 (30.43) |
Baseline characteristics of new-onset STEMI patients
post-PCI in the derivation (n = 107) and validation (n = 46) cohorts. Data: mean
| Characteristic | Overall (n = 153) | Derivation dataset (n = 107) | Validation dataset (n = 46) | p |
| hs-TnI (mean (SD), ng/L) | 12.34 (11.40) | 12.77 (11.70) | 11.34 (10.74) | 0.481 |
| NT-proBNP (mean (SD), pg/mL) | 1164.51 (1491.59) | 1165.46 (1425.66) | 1162.30 (1651.44) | 0.990 |
| White blood cell count (mean (SD), |
9.23 (3.56) | 9.08 (3.36) | 9.59 (4.01) | 0.414 |
| Red blood cell count (mean (SD) |
4.62 (0.56) | 4.60 (0.60) | 4.67 (0.46) | 0.493 |
| Hemoglobin (mean (SD), g/L) | 140.70 (16.17) | 140.79 (16.70) | 140.50 (15.05) | 0.920 |
| Hematokrit (mean (SD), %) | 41.84 (4.49) | 41.85 (4.62) | 41.82 (4.22) | 0.972 |
| Mean corpuscular volume (mean (SD), fL) | 90.80 (4.33) | 91.26 (4.47) | 89.72 (3.82) | 0.043 |
| Coefficient of variation of RBC volume (mean (SD)) | 13.03 (2.52) | 13.16 (2.98) | 12.73 (0.70) | 0.334 |
| Standard deviation of the width of red blood cell volume distribution (mean (SD)) | 42.27 (4.02) | 42.55 (4.43) | 41.60 (2.77) | 0.181 |
| Mean erythrocyte hemoglobin content (mean (SD), pg) | 30.49 (1.64) | 30.65 (1.69) | 30.10 (1.48) | 0.055 |
| Mean corpuscular-hemoglobin concentration (mean (SD), g/L) | 335.98 (10.03) | 336.18 (10.62) | 335.52 (8.61) | 0.711 |
| Percentage of lymphocytes (mean (SD), %) | 21.03 (10.66) | 21.30 (10.99) | 20.40 (9.94) | 0.636 |
| Percentage of monocytes (mean (SD), %) | 6.03 (1.70) | 6.01 (1.66) | 6.07 (1.82) | 0.851 |
| Percentage of neutrophilic (mean (SD), %) | 71.24 (12.18) | 71.00 (12.74) | 71.81 (10.87) | 0.709 |
| Percentage of eosinophils (mean (SD), %) | 1.27 (1.41) | 1.28 (1.47) | 1.27 (1.28) | 0.966 |
| Percentage of basophilic (mean (SD), %) | 0.43 (0.24) | 0.41 (0.23) | 0.46 (0.25) | 0.269 |
| Absolute value of lymphocytes (mean (SD), |
1.71 (0.70) | 1.72 (0.73) | 1.70 (0.61) | 0.869 |
| Absolute value of monocytes (mean (SD), |
0.55 (0.24) | 0.53 (0.21) | 0.58 (0.30) | 0.285 |
| Absolute value of neutrophilic (mean (SD), |
6.86 (3.45) | 6.73 (3.22) | 7.18 (3.96) | 0.464 |
| Absolute value of eosinophils (mean (SD), |
0.10 (0.11) | 0.10 (0.11) | 0.10 (0.09) | 0.979 |
| Absolute value of basophilic (mean (SD), |
0.04 (0.02) | 0.04 (0.02) | 0.04 (0.02) | 0.210 |
| Blood platelet count (mean (SD), |
216.48 (59.09) | 212.76 (57.88) | 225.11 (61.59) | 0.237 |
| Thrombocytocrit (mean (SD), %) | 0.23 (0.05) | 0.23 (0.05) | 0.24 (0.06) | 0.224 |
| Mean platelet volume (mean (SD), fL) | 10.70 (1.17) | 10.68 (1.19) | 10.74 (1.13) | 0.751 |
| Platelet distribution width (mean (SD), %) | 12.94 (2.75) | 12.95 (2.88) | 12.90 (2.47) | 0.907 |
| High platelet ratio (mean (SD), %) | 30.84 (9.04) | 30.77 (9.18) | 31.00 (8.80) | 0.884 |
| Neutrophil/lymphocyte ratio (mean (SD)) | 5.19 (5.04) | 4.99 (4.20) | 5.64 (6.61) | 0.470 |
| Platelet/lymphocyte ratio (mean (SD)) | 148.80 (84.56) | 146.48 (82.16) | 154.21 (90.61) | 0.605 |
| Alkaline phosphatase (mean (SD), U/L) | 81.09 (23.31) | 82.87 (23.10) | 76.94 (23.50) | 0.149 |
| 43.26 (38.83) | 45.09 (41.78) | 38.99 (30.90) | 0.375 | |
| Aspartate aminotransferase (mean (SD), U/L) | 136.66 (156.18) | 139.91 (150.96) | 129.12 (169.19) | 0.697 |
| Alanine aminotransferase (mean (SD), U/L) | 46.37 (56.25) | 42.75 (32.45) | 54.78 (90.01) | 0.226 |
| Lactate dehydrogenase (mean (SD), U/L) | 510.24 (450.77) | 509.11 (416.67) | 512.87 (526.65) | 0.962 |
| Total bile acid (mean (SD), µmol/L) | 4.24 (3.74) | 4.35 (3.98) | 4.00 (3.13) | 0.601 |
| Total bilirubin (mean (SD), µmol/L) | 13.33 (6.17) | 13.31 (6.54) | 13.38 (5.27) | 0.948 |
| Direct bilirubin (mean (SD), µmol/L) | 4.83 (1.87) | 4.79 (1.89) | 4.92 (1.86) | 0.697 |
| Total protein (mean (SD), g/L) | 64.55 (5.07) | 64.92 (5.28) | 63.71 (4.49) | 0.176 |
| Albumin (mean (SD), g/L) | 40.93 (3.62) | 40.97 (3.67) | 40.86 (3.56) | 0.864 |
| Globulin (mean (SD), g/L) | 23.62 (3.58) | 23.95 (3.83) | 22.85 (2.79) | 0.081 |
| Albumin/globulin ratio (mean (SD)) | 1.77 (0.31) | 1.75 (0.32) | 1.82 (0.30) | 0.202 |
| Total cholesterol (mean (SD), mmol/L) | 4.72 (1.45) | 4.74 (1.39) | 4.67 (1.60) | 0.765 |
| Triacylglycerol (mean (SD), mmol/L) | 1.90 (1.25) | 1.85 (1.18) | 2.01 (1.40) | 0.478 |
| HDL-C (mean (SD), mmol/L) | 1.02 (0.25) | 1.04 (0.26) | 0.97 (0.23) | 0.102 |
| LDL-C (mean (SD), mmol/L) | 3.06 (1.23) | 3.08 (1.20) | 3.00 (1.30) | 0.698 |
| Apolipoprotein A1 (mean (SD), g/L) | 1.19 (0.22) | 1.20 (0.22) | 1.19 (0.22) | 0.731 |
| Apolipoprotein B (mean (SD), g/L) | 1.05 (0.35) | 1.05 (0.34) | 1.06 (0.37) | 0.776 |
| Lipoprotein(a) (mean (SD), mg/dL) | 60.16 (75.70) | 69.47 (83.62) | 38.51 (46.90) | 0.020 |
| Bicarbonate (mean (SD), mmol/L) | 23.70 (6.07) | 24.09 (6.65) | 22.81 (4.37) | 0.236 |
| Potassium (mean (SD), mmol/L) | 4.87 (11.09) | 3.98 (0.49) | 6.93 (20.21) | 0.132 |
| Sodium (mean (SD), mmol/L) | 139.19 (11.82) | 140.09 (3.06) | 137.10 (21.05) | 0.153 |
| Chloride (mean (SD), mmol/L) | 103.49 (4.73) | 103.06 (4.00) | 104.50 (6.03) | 0.084 |
| Magnesium (mean (SD), mmol/L) | 1.19 (0.47) | 1.21 (0.48) | 1.16 (0.46) | 0.603 |
| Calcium (mean (SD), mmol/L) | 2.04 (0.48) | 2.04 (0.47) | 2.04 (0.48) | 0.966 |
| Phosphorus (mean (SD), mmol/L) | 1.06 (0.22) | 1.04 (0.19) | 1.11 (0.27) | 0.089 |
| Blood urea nitrogen (mean (SD), mmol/L) | 5.33 (1.57) | 5.30 (1.62) | 5.39 (1.48) | 0.755 |
| Creatinine (mean (SD), µmol/L) | 77.53 (16.95) | 76.54 (14.85) | 79.84 (21.05) | 0.270 |
| Uric acid (mean (SD), µmol/L) | 328.33 (91.41) | 321.84 (88.99) | 343.42 (96.10) | 0.181 |
| Glucose (mean (SD), mmol/L) | 6.28 (2.36) | 6.24 (2.25) | 6.37 (2.64) | 0.757 |
| Homocysteine (mean (SD), µmol/L) | 17.88 (9.74) | 17.89 (10.51) | 17.87 (7.76) | 0.992 |
| Fucosidase (mean (SD), U/L) | 28.83 (8.57) | 28.40 (8.72) | 29.81 (8.20) | 0.353 |
| Prothrombin time (mean (SD), s) | 11.29 (0.86) | 11.32 (0.80) | 11.22 (0.99) | 0.484 |
| International normalized ratio (mean (SD)) | 0.98 (0.08) | 0.98 (0.07) | 0.97 (0.09) | 0.492 |
| Activated partial thromboplastin time (mean (SD), s) | 30.47 (10.88) | 30.61 (12.12) | 30.16 (7.33) | 0.814 |
| Fibrinogen (mean (SD), g/L) | 3.44 (1.22) | 3.41 (1.21) | 3.50 (1.24) | 0.652 |
| Thrombin time (mean (SD), s) | 19.22 (11.89) | 19.05 (10.25) | 19.60 (15.17) | 0.797 |
| D_Dimer (median (IQR)) | 0.31 (0.19, 0.59) | 0.33 (0.20, 0.69) | 0.24 (0.16, 0.45) | 0.437 |
Baseline
laboratory characteristics of new-onset STEMI patients post-PCI in the derivation
(n = 107) and validation (n = 46) cohorts. Data: mean
The median follow-up duration for the entire cohort was 35 months (IQR, 24–36 months). During the follow-up period, MACE occurred in 48/107 patients (44.86%) in the derivation cohort, and 23/46 patients (50.00%) in the internal validation cohort. The cumulative MACE incidence rates at 1-, 2-, and 3- years were 20.6%, 34.6%, and 44.9% in the derivation cohort, and 21.7%, 34.8%, and 50.0% in the internal validation cohort. Kaplan-Meier analysis showed no significant difference in overall MACE-free survival between the derivation and internal validation cohorts prior to model development (p = 0.73, as shown in Supplementary Fig. 1, Kaplan-Meier Curve for MACE in the Derivation and Validation Datasets).
Univariate Cox proportional hazards regression analysis was performed to
identify potential predictors of MACE from a comprehensive set of baseline
clinical, laboratory, and CMR parameters. This initial screening identified 34
variables as being associated with MACE (all p
| Variable | Univariate | Multivariate | ||
| HR (95%CI) | p | HR (95%CI) | p | |
| Diabetes mellitus | 1.972 (1.09–3.567) | 0.025 | ||
| Hypertension | 0.527 (0.295–0.942) | 0.031 | ||
| Gensini score | 1.016 (1.01–1.022) | 1.012 (1.003–1.02) | 0.006 | |
| Left anterior descending artery involvement | 2.735 (1.498–4.995) | 0.001 | ||
| Systolic blood pressure | 0.985 (0.975–0.995) | 0.003 | ||
| hsTnI | 1.027 (1.002–1.052) | 0.036 | ||
| NT-proBNP | 1.000 (1.000–1.000) | 0.026 | ||
| Aspartate aminotransferase | 1.003 (1.001–1.004) | 0.001 | ||
| Lactate dehydrogenase | 1.001 (1.000–1.001) | 0.007 | ||
| Total protein | 0.944 (0.893–0.997) | 0.041 | ||
| Albumin | 0.916 (0.846–0.992) | 0.031 | 0.849 (0.769–0.938) | 0.001 |
| LDL-C | 1.251 (1.015–1.541) | 0.036 | 1.377 (1.037–1.828) | 0.027 |
| Bicarbonate | 0.861 (0.756–0.98) | 0.024 | ||
| Sodium | 0.913 (0.834–0.999) | 0.047 | ||
| Magnesium | 5.122 (3.098–8.467) | |||
| Calcium | 0.204 (0.124–0.334) | |||
| Phosphorus | 0.16 (0.035–0.742) | 0.019 | ||
| Thrombin time | 0.79 (0.634–0.983) | 0.034 | ||
| EF | 0.978 (0.96–0.996) | 0.018 | 0.890 (0.833–0.951) | 0.001 |
| EDV | 1.007 (1.001–1.012) | 0.015 | 1.014 (1.003–1.025) | 0.015 |
| End-systolic volume | 1.007 (1.002–1.012) | 0.007 | ||
| End-diastolic volume/body surface area | 1.013 (1.003–1.022) | 0.008 | ||
| End-systolic volume/body surface area | 1.013 (1.004–1.022) | 0.005 | ||
| Weighted left ventricular thickness 2 | 0.779 (0.65–0.935) | 0.007 | ||
| Weighted left ventricular thickness 3 | 0.236 (0.083–0.671) | 0.007 | ||
| Weighted left ventricular thickness 4 | 0.219 (0.075–0.641) | 0.006 | ||
| Mean of LVWM | 0.781 (0.659–0.926) | 0.004 | 0.464 (0.288–0.747) | 0.002 |
| Standard deviation/coefficient of variation | 9.909 (2.249–43.662) | 0.002 | ||
| Abnormal segment proportion | 9.539 (2.434–37.384) | 0.001 | ||
| Wall motion score index | 1.967 (1.235–3.133) | 0.004 | ||
| Atrioventricular block | 1.877 (1.019–3.46) | 0.043 | ||
Univariate analysis identified potential predictors (p
Candidate variables from the univariate analysis were then included in a multivariate Cox proportional hazards regression model using a stepwise backward elimination strategy based on the Akaike Information Criterion (AIC). This process yielded a final parsimonious model that identified six independent predictors for MACE: Gensini Score (Hazard Ratio [HR]: 1.012, 95% Confidence Interval [CI]: 1.003–1.020, p = 0.006), albumin (HR: 0.849, 95% CI: 0.769–0.938, p = 0.001), LDL-C (HR: 1.377, 95% CI: 1.037–1.828, p = 0.027), LVEF (HR: 0.890, 95% CI: 0.833–0.951, p = 0.001), LVEDV (HR: 1.014, 95% CI: 1.003–1.025, p = 0.015), and Mean of LVWM (HR: 0.464, 95% CI: 0.288–0.747, p = 0.002). Final results from the multivariate model results are detailed in Table 4. The correlation matrix for these six predictors showed no significant multicollinearity (Supplementary Fig. 2, Correlation Matrix of the Six Independent Predictors Included in the Nomogram).
| MRI characteristic | Level | Overall (n = 153) | Derivation dataset (n = 107) | Validation dataset (n = 46) | p |
| Percentage of enhanced volume (mean (SD)) | 8.42 (9.27) | 8.72 (9.04) | 8.29 (9.40) | 0.793 | |
| Global slope of first-pass perfusion (mean (SD)) | 27.76 (9.06) | 25.56 (7.39) | 28.70 (9.57) | 0.049 | |
| Global time to peak of first-pass perfusion (mean (SD)) | 276.37 (196.29) | 266.20 (153.84) | 280.74 (212.46) | 0.676 | |
| Global peak of first-pass perfusion (mean (SD)) | 96.86 (23.71) | 96.54 (23.74) | 97.00 (23.80) | 0.912 | |
| Global parameter 9 of first-pass perfusion (mean (SD)) | 48.50 (9.88) | 47.06 (9.43) | 49.12 (10.05) | 0.238 | |
| EF (mean (SD), %) | 57.85 (13.79) | 60.13 (12.21) | 56.87 (14.37) | 0.181 | |
| Stroke volume (mean (SD), mL) | 54.25 (11.67) | 53.98 (11.66) | 54.37 (11.72) | 0.851 | |
| Cardiac output (mean (SD), L/min) | 3.69 (0.81) | 3.66 (0.78) | 3.70 (0.82) | 0.740 | |
| Stroke index (mean (SD), mL/m2) | 30.38 (6.47) | 30.21 (6.88) | 30.46 (6.31) | 0.830 | |
| Cardiac index (mean (SD), L/min/m2) | 2.07 (0.46) | 2.05 (0.48) | 2.08 (0.46) | 0.663 | |
| EDV (mean (SD), mL) | 100.02 (36.65) | 91.90 (21.48) | 103.52 (41.11) | 0.072 | |
| End-systolic volume (mean (SD), mL) | 45.75 (34.38) | 37.92 (18.00) | 49.11 (38.98) | 0.065 | |
| End-diastolic volume/body surface area (mean (SD)) | 55.83 (19.93) | 51.36 (12.23) | 57.76 (22.22) | 0.068 | |
| End-systolic volume/body surface area (mean (SD)) | 25.44 (18.94) | 21.15 (10.01) | 27.29 (21.45) | 0.066 | |
| End-diastolic time (mean (SD)) | 722.68 (309.31) | 717.99 (338.36) | 724.70 (297.61) | 0.902 | |
| End-systolic time (mean (SD)) | 308.21 (77.71) | 295.59 (43.87) | 313.63 (88.00) | 0.189 | |
| End-diastolic wall mass (mean (SD), g) | 92.44 (38.31) | 93.92 (36.66) | 91.80 (39.15) | 0.754 | |
| End-diastolic wall papillary muscle mass (mean (SD), g) | 119.31 (40.78) | 118.83 (37.99) | 119.51 (42.09) | 0.924 | |
| End-diastolic wall mass/body surface area (mean (SD)) | 55.29 (23.75) | 55.25 (22.26) | 55.30 (24.47) | 0.991 | |
| End-diastolic wall papillary muscle mass/body surface area (mean (SD)) | 66.19 (20.88) | 65.71 (18.60) | 66.40 (21.86) | 0.852 | |
| End-systolic wall mass (mean (SD), g) | 124.81 (36.48) | 127.85 (36.89) | 123.51 (36.40) | 0.501 | |
| End-systolic wall papillary muscle mass (mean (SD), g) | 146.23 (41.17) | 147.22 (39.75) | 145.81 (41.95) | 0.846 | |
| End-systolic wall mass/body surface area (mean (SD)) | 73.19 (25.32) | 73.87 (23.46) | 72.89 (26.18) | 0.827 | |
| End-systolic wall papillary muscle mass/body surface area (mean (SD)) | 81.31 (20.93) | 81.61 (19.28) | 81.19 (21.68) | 0.910 | |
| Weighted left ventricular thickness 1 (mean (SD)) | 10.54 (13.93) | 10.50 (12.22) | 10.55 (14.66) | 0.985 | |
| Weighted left ventricular thickness 2 (mean (SD)) | 4.53 (1.51) | 4.76 (1.48) | 4.44 (1.51) | 0.229 | |
| Weighted left ventricular thickness 3 (mean (SD)) | 2.63 (12.02) | 2.02 (9.04) | 2.89 (13.12) | 0.684 | |
| Weighted left ventricular thickness 4 (mean (SD)) | 0.67 (0.29) | 0.67 (0.28) | 0.67 (0.29) | 0.901 | |
| Mean of LVWM (mean (SD)) | 6.88 (1.71) | 7.04 (1.93) | 6.82 (1.62) | 0.460 | |
| Standard deviation/coefficient of variation (mean (SD)) | 0.45 (0.16) | 0.43 (0.14) | 0.46 (0.16) | 0.380 | |
| Abnormal segment proportion (mean (SD), %) | 0.25 (0.19) | 0.24 (0.21) | 0.25 (0.19) | 0.718 | |
| Wall motion score index (mean (SD)) | 2.24 (0.59) | 2.20 (0.63) | 2.25 (0.58) | 0.611 | |
| Atrioventricular block (%) | No | 134 (87.58) | 39 (84.78) | 95 (88.79) | 0.674 |
| Yes | 19 (12.42) | 7 (15.22) | 12 (11.21) | ||
| Mitral valve (%) | No | 10 (6.54) | 3 (6.52) | 7 (6.54) | |
| Yes | 143 (93.46) | 43 (93.48) | 100 (93.46) | ||
| Aortic valve (%) | No | 116 (75.82) | 33 (71.74) | 83 (77.57) | 0.571 |
| Yes | 37 (24.18) | 13 (28.26) | 24 (22.43) | ||
| Global radial strain (mean (SD), %) | 40.57 (11.95) | 40.58 (11.21) | 40.57 (12.31) | 0.996 | |
| Global circumferential strain (mean (SD), %) | –15.66 (4.52) | –15.95 (4.74) | –15.54 (4.44) | 0.612 | |
| Global Longitudinal Strain (mean (SD), %) | –11.13 (5.97) | –10.43 (6.59) | –11.44 (5.69) | 0.342 |
Cardiac magnetic resonance characteristics of new-onset STEMI
patients post-PCI in the derivation (n = 107) and validation (n = 46) cohorts.
Data: mean
Based on these independent predictors, a prognostic nomogram was constructed to predict the 1-, 2-, and 3-year probability of MACE (Fig. 3).
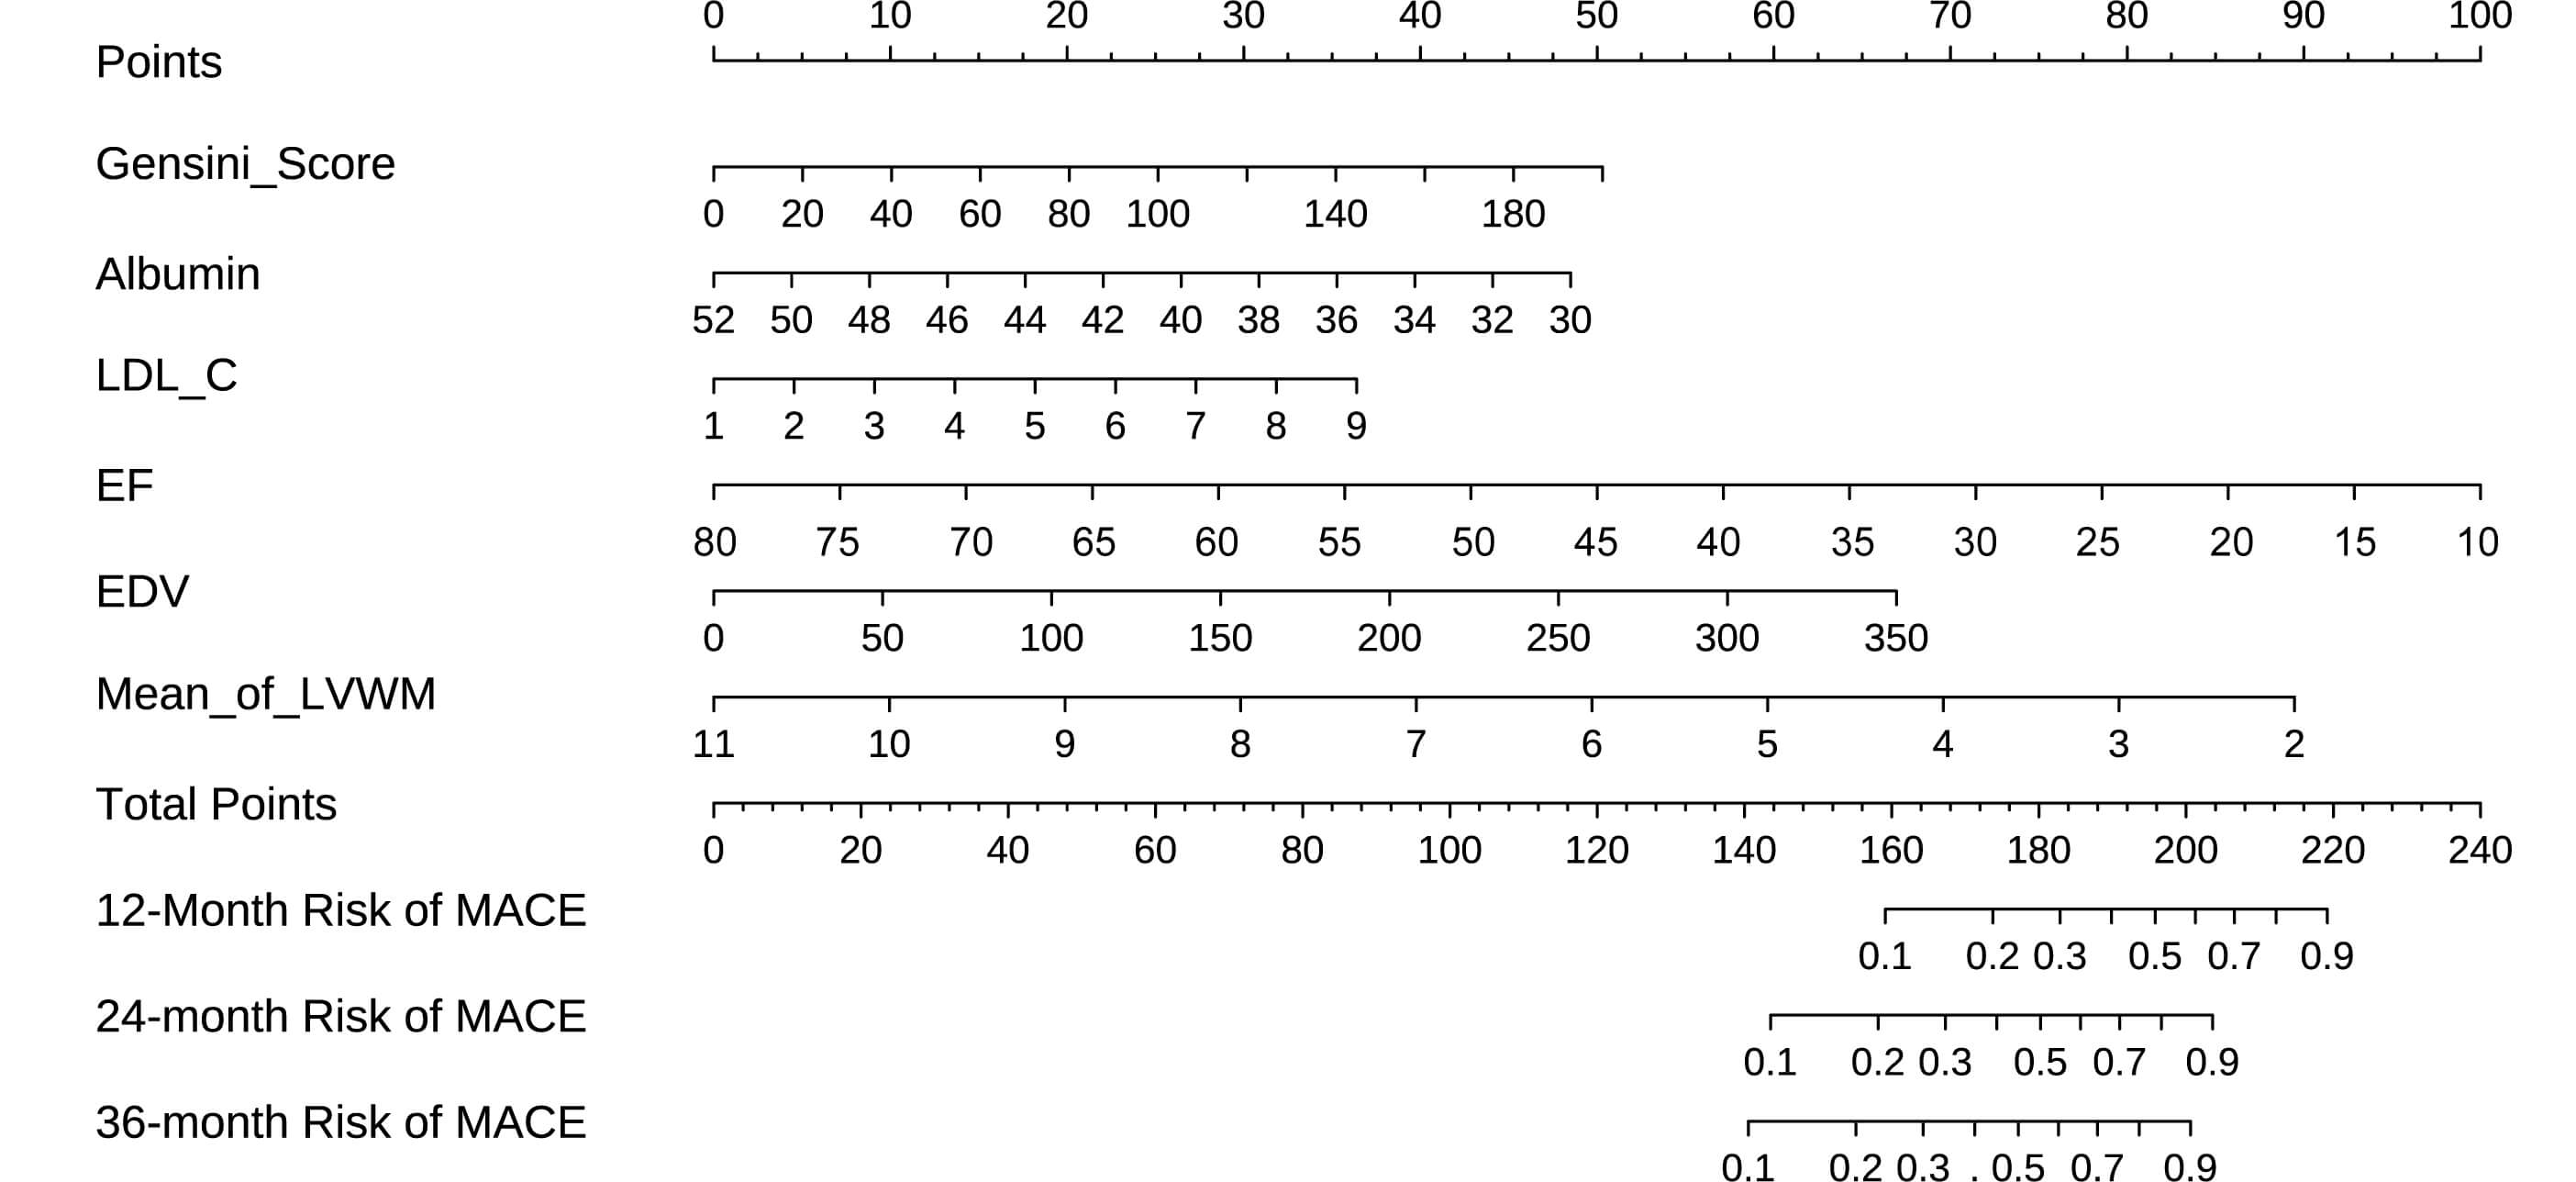 Fig. 3.
Nomogram of Cox regression model for predicting the risk of MACE after PCI. Prognostic nomogram for predicting 1-, 2-, and 3-year probability of major adverse cardiovascular events (MACE) after percutaneous coronary intervention (PCI) in patients with new-onset ST-segment elevation myocardial infarction (STEMI). The nomogram was developed based on the final Cox regression model and incorporated six independent predictors: Gensini Score, albumin, LDL-C, Ejection Fraction (EF), End-Diastolic Volume (EDV), and Mean of Left Ventricular Wall Motion (Mean_of_LVWM).
The nomogram demonstrated good discrimination in the derivation cohort, with a Harrell’s C-index for predicting MACE of 0.803 (95% CI: 0.739–0.867). The time-dependent AUC values at 1-, 2-, and 3-years were 0.771, 0.835, and 0.795, respectively (Fig. 4A). In the internal validation cohort, the C-index was 0.693 (95% CI: 0.570–0.816), with time-dependent AUC values at 1-, 2-, and 3-years of 0.629, 0.619, and 0.667, respectively (Fig. 4B).
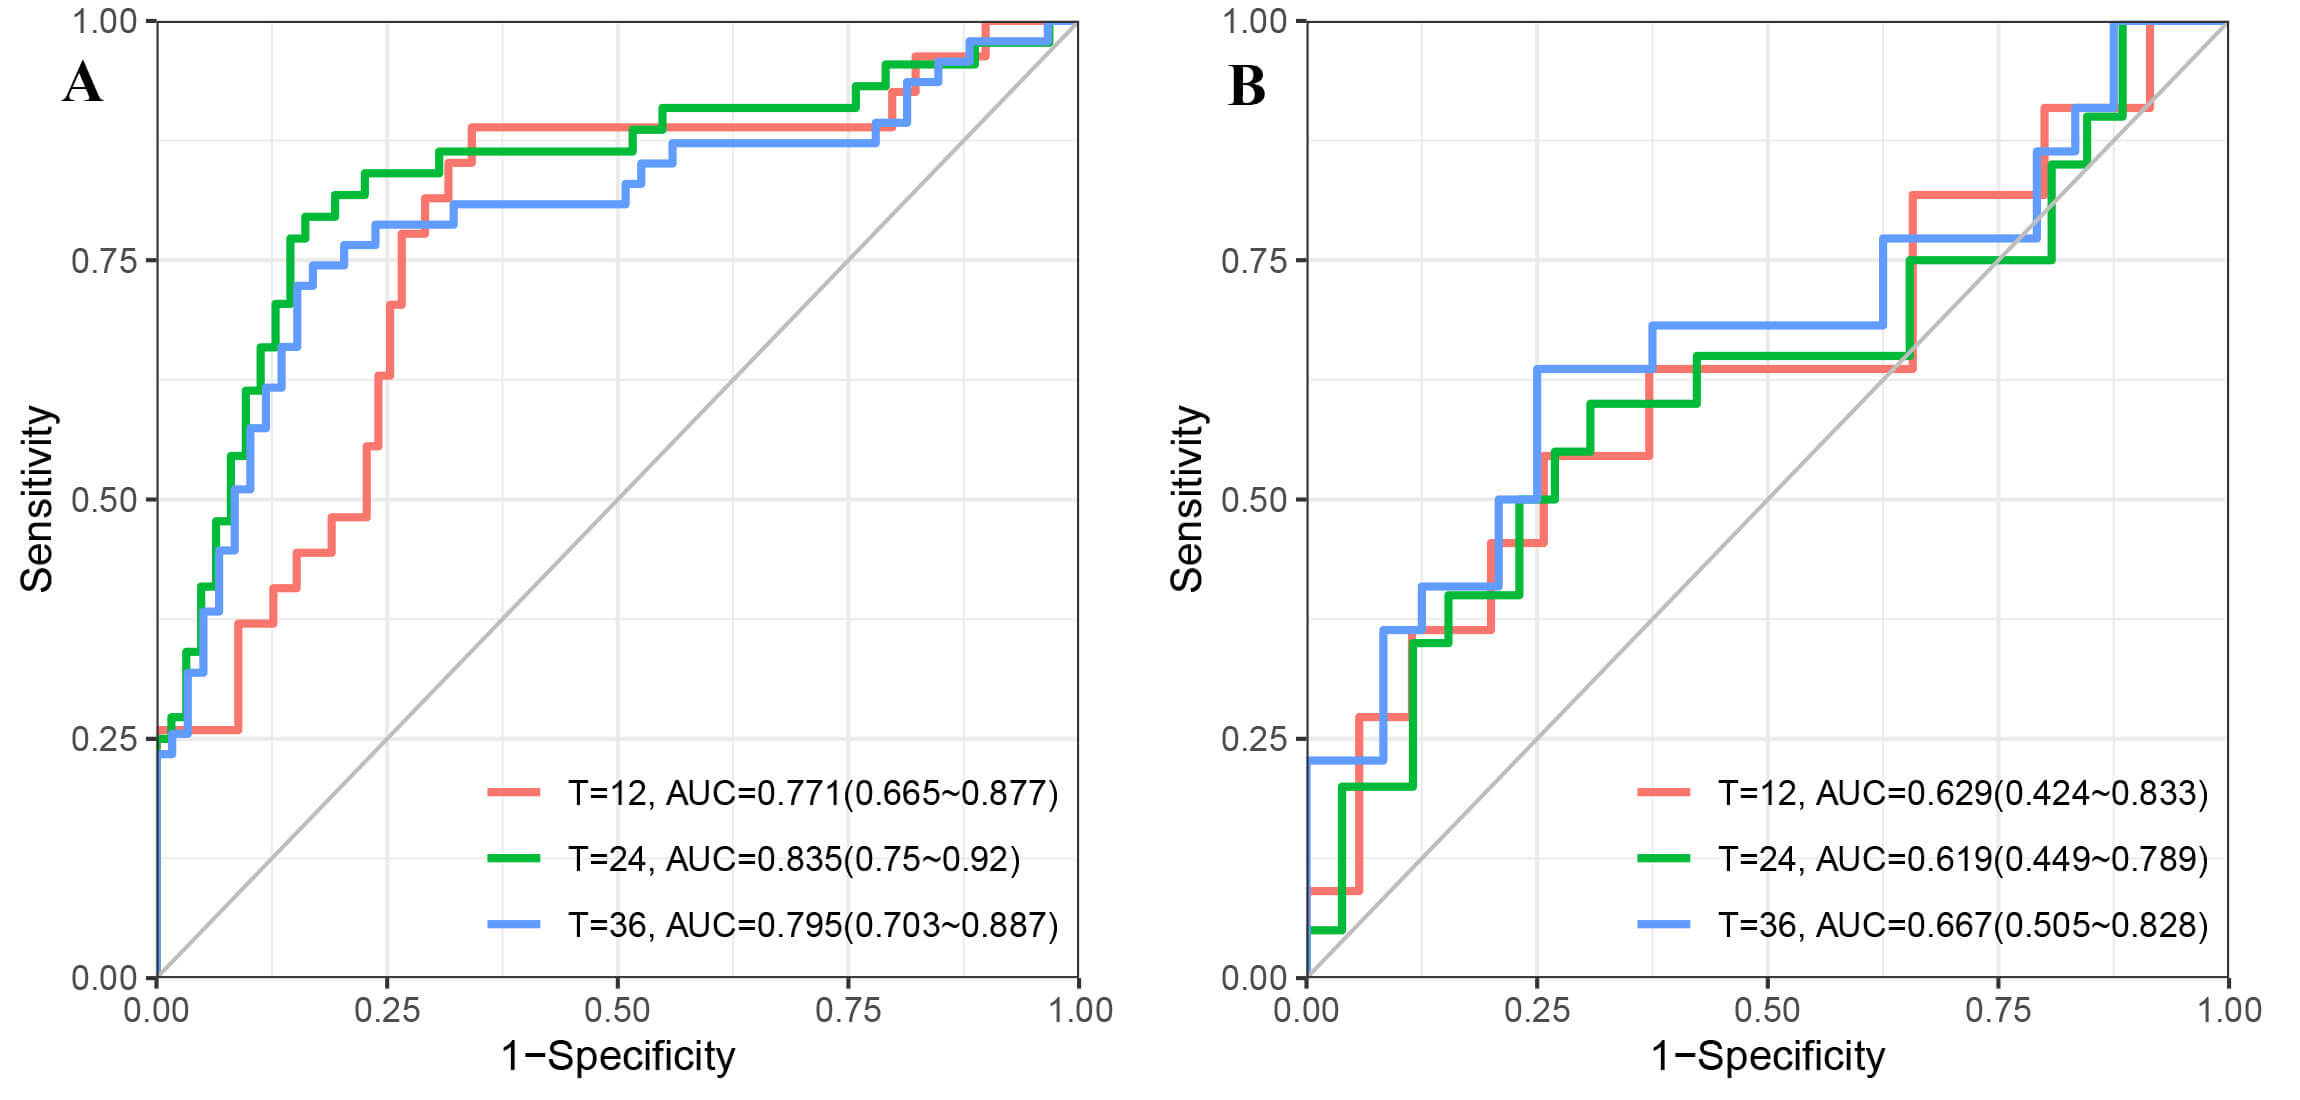 Fig. 4.
Time-dependent Receiver Operating Characteristic (ROC) curves showing the predictive performance of the nomogram for MACE at 12, 24, and 36 months. (A) ROC curves for the derivation cohort. (B) ROC curves for the internal validation cohort. The diagonal grey line represents an Area Under the Curve (AUC) of 0.5.
Calibration of the nomogram was carried out using calibration plots, which
compared the nomogram-predicted probabilities with the Kaplan-Meier estimated
probabilities of MACE. These demonstrated excellent agreement at 1-, 2-, and
3-years in both the derivation cohort (Fig. 5A) and the internal validation
cohort (Fig. 5B). The concordance was further confirmed by quantitative analysis
of the calibration slopes, which were found to be optimal in both cohorts
(p
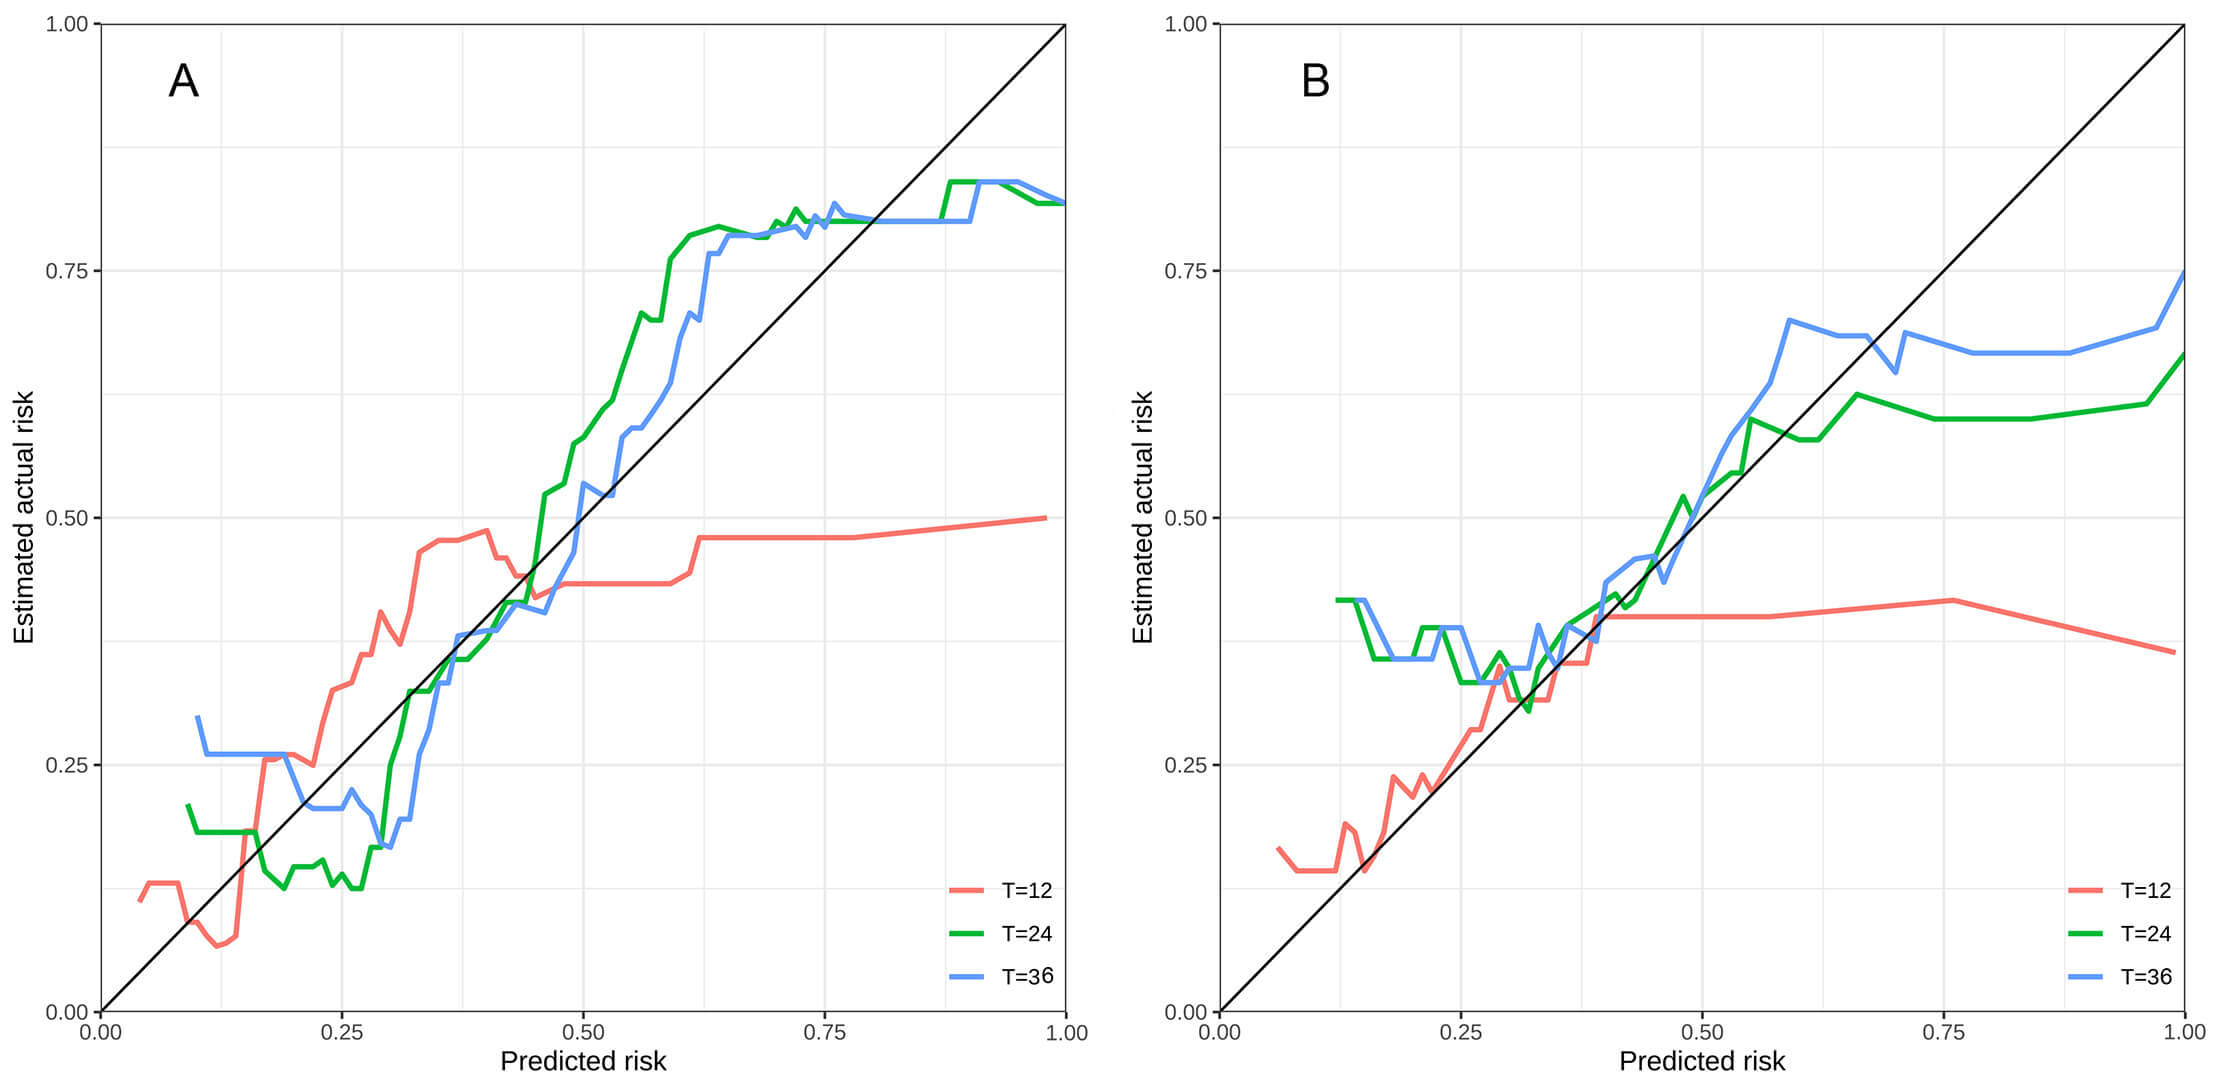 Fig. 5.
Calibration curves for the prognostic nomogram. These assessed the agreement between nomogram-predicted probabilities of major adverse cardiovascular events (MACE) and the observed rates at 12-, 24-, and 36- months. (A) Derivation cohort. (B) Internal validation cohort. The diagonal dashed line indicates perfect calibration.
DCA was performed to evaluate the clinical usefulness of the nomogram. In both the derivation (Fig. 6A1–A3) and internal validation cohorts (Fig. 6B1–B3), DCA revealed that the nomogram provided a superior net benefit for predicting 1-, 2-, and 3-year MACE risk across a wide range of threshold probabilities compared to treat-all or treat-none strategies.
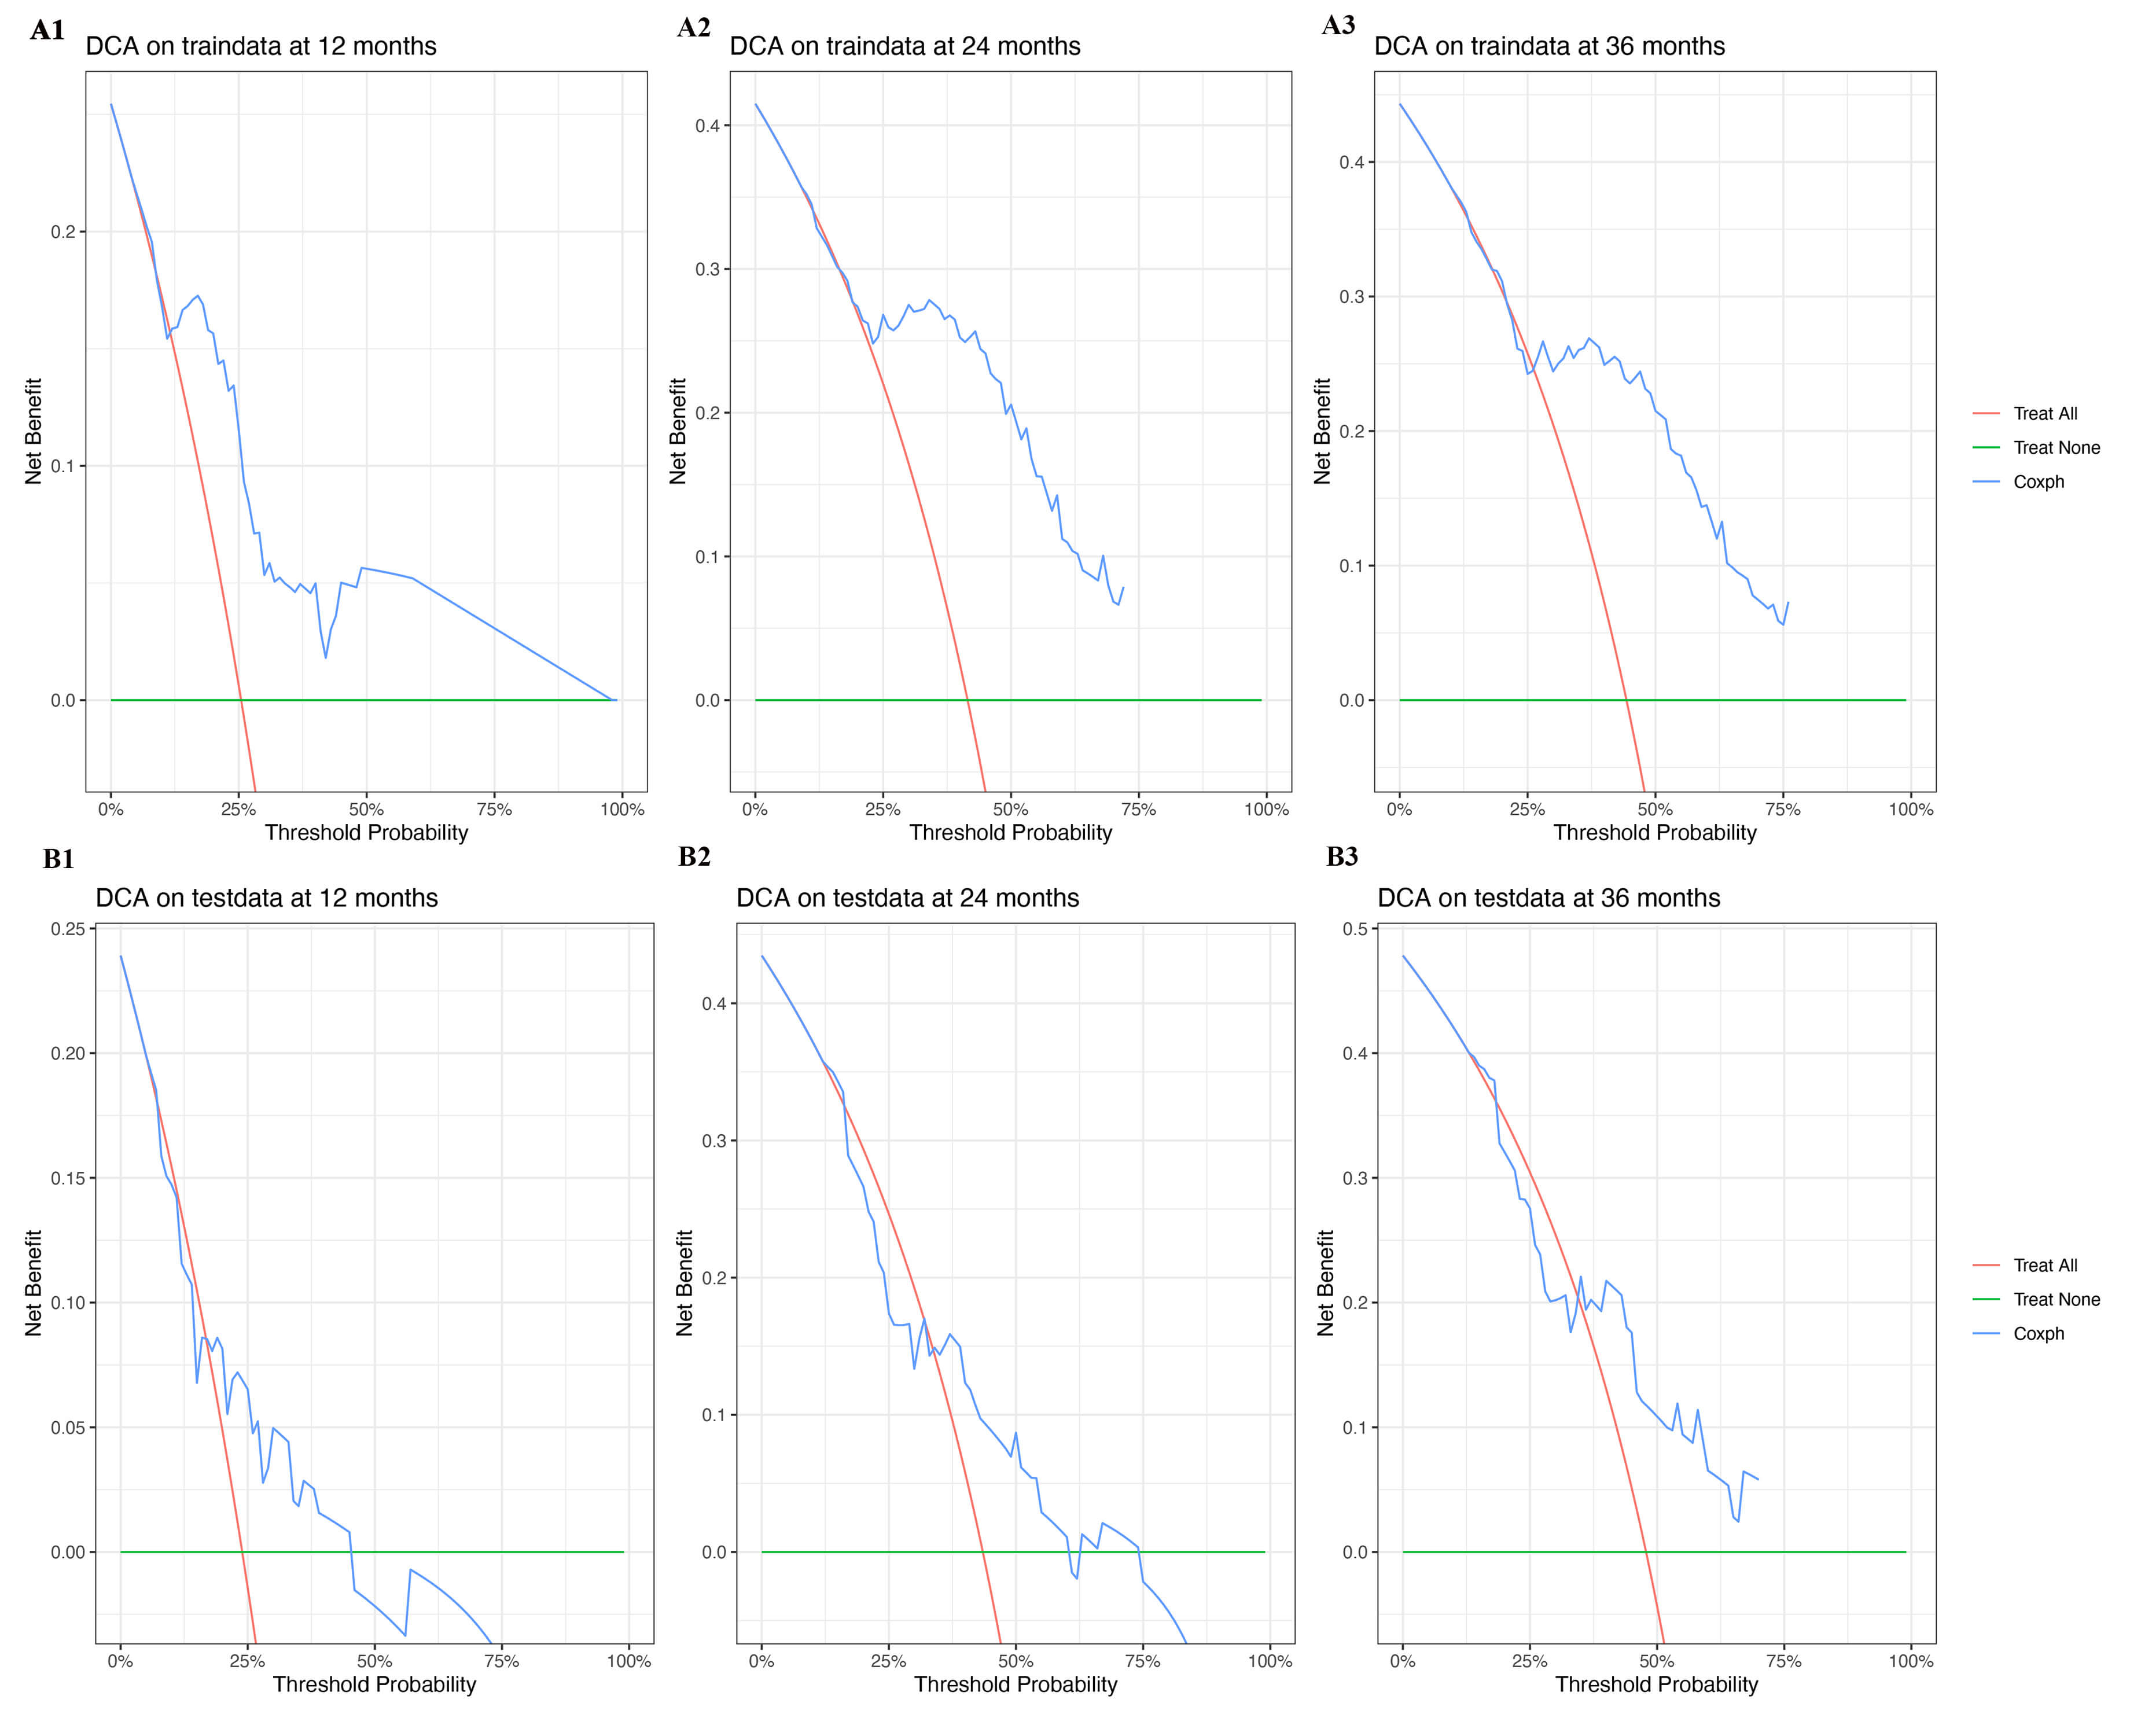 Fig. 6.
Decision curve analysis (DCA) for the prognostic nomogram. Evaluating the net benefit for predicting major adverse cardiovascular events (MACE) at 12, 24, and 36 months across a range of threshold probabilities. Top row: DCA for the derivation cohort (traindata) at 12 months (A1), 24 months (A2), and 36 months (A3). Bottom row: DCA for the internal validation cohort (testdata) at 12 months (B1), 24 months (B2), and 36 months (B3). The red line represents the “Treat All” strategy, the green line represents the “Treat None” strategy, and the blue line represents the nomogram-based “Coxph” strategy.
Furthermore, the nomogram effectively stratified patients into distinct risk
groups. Kaplan-Meier curves for high-risk and low-risk groups, categorized
according to the median of the nomogram’s total points showed significantly
different MACE-free survival rates in both the derivation cohort (p
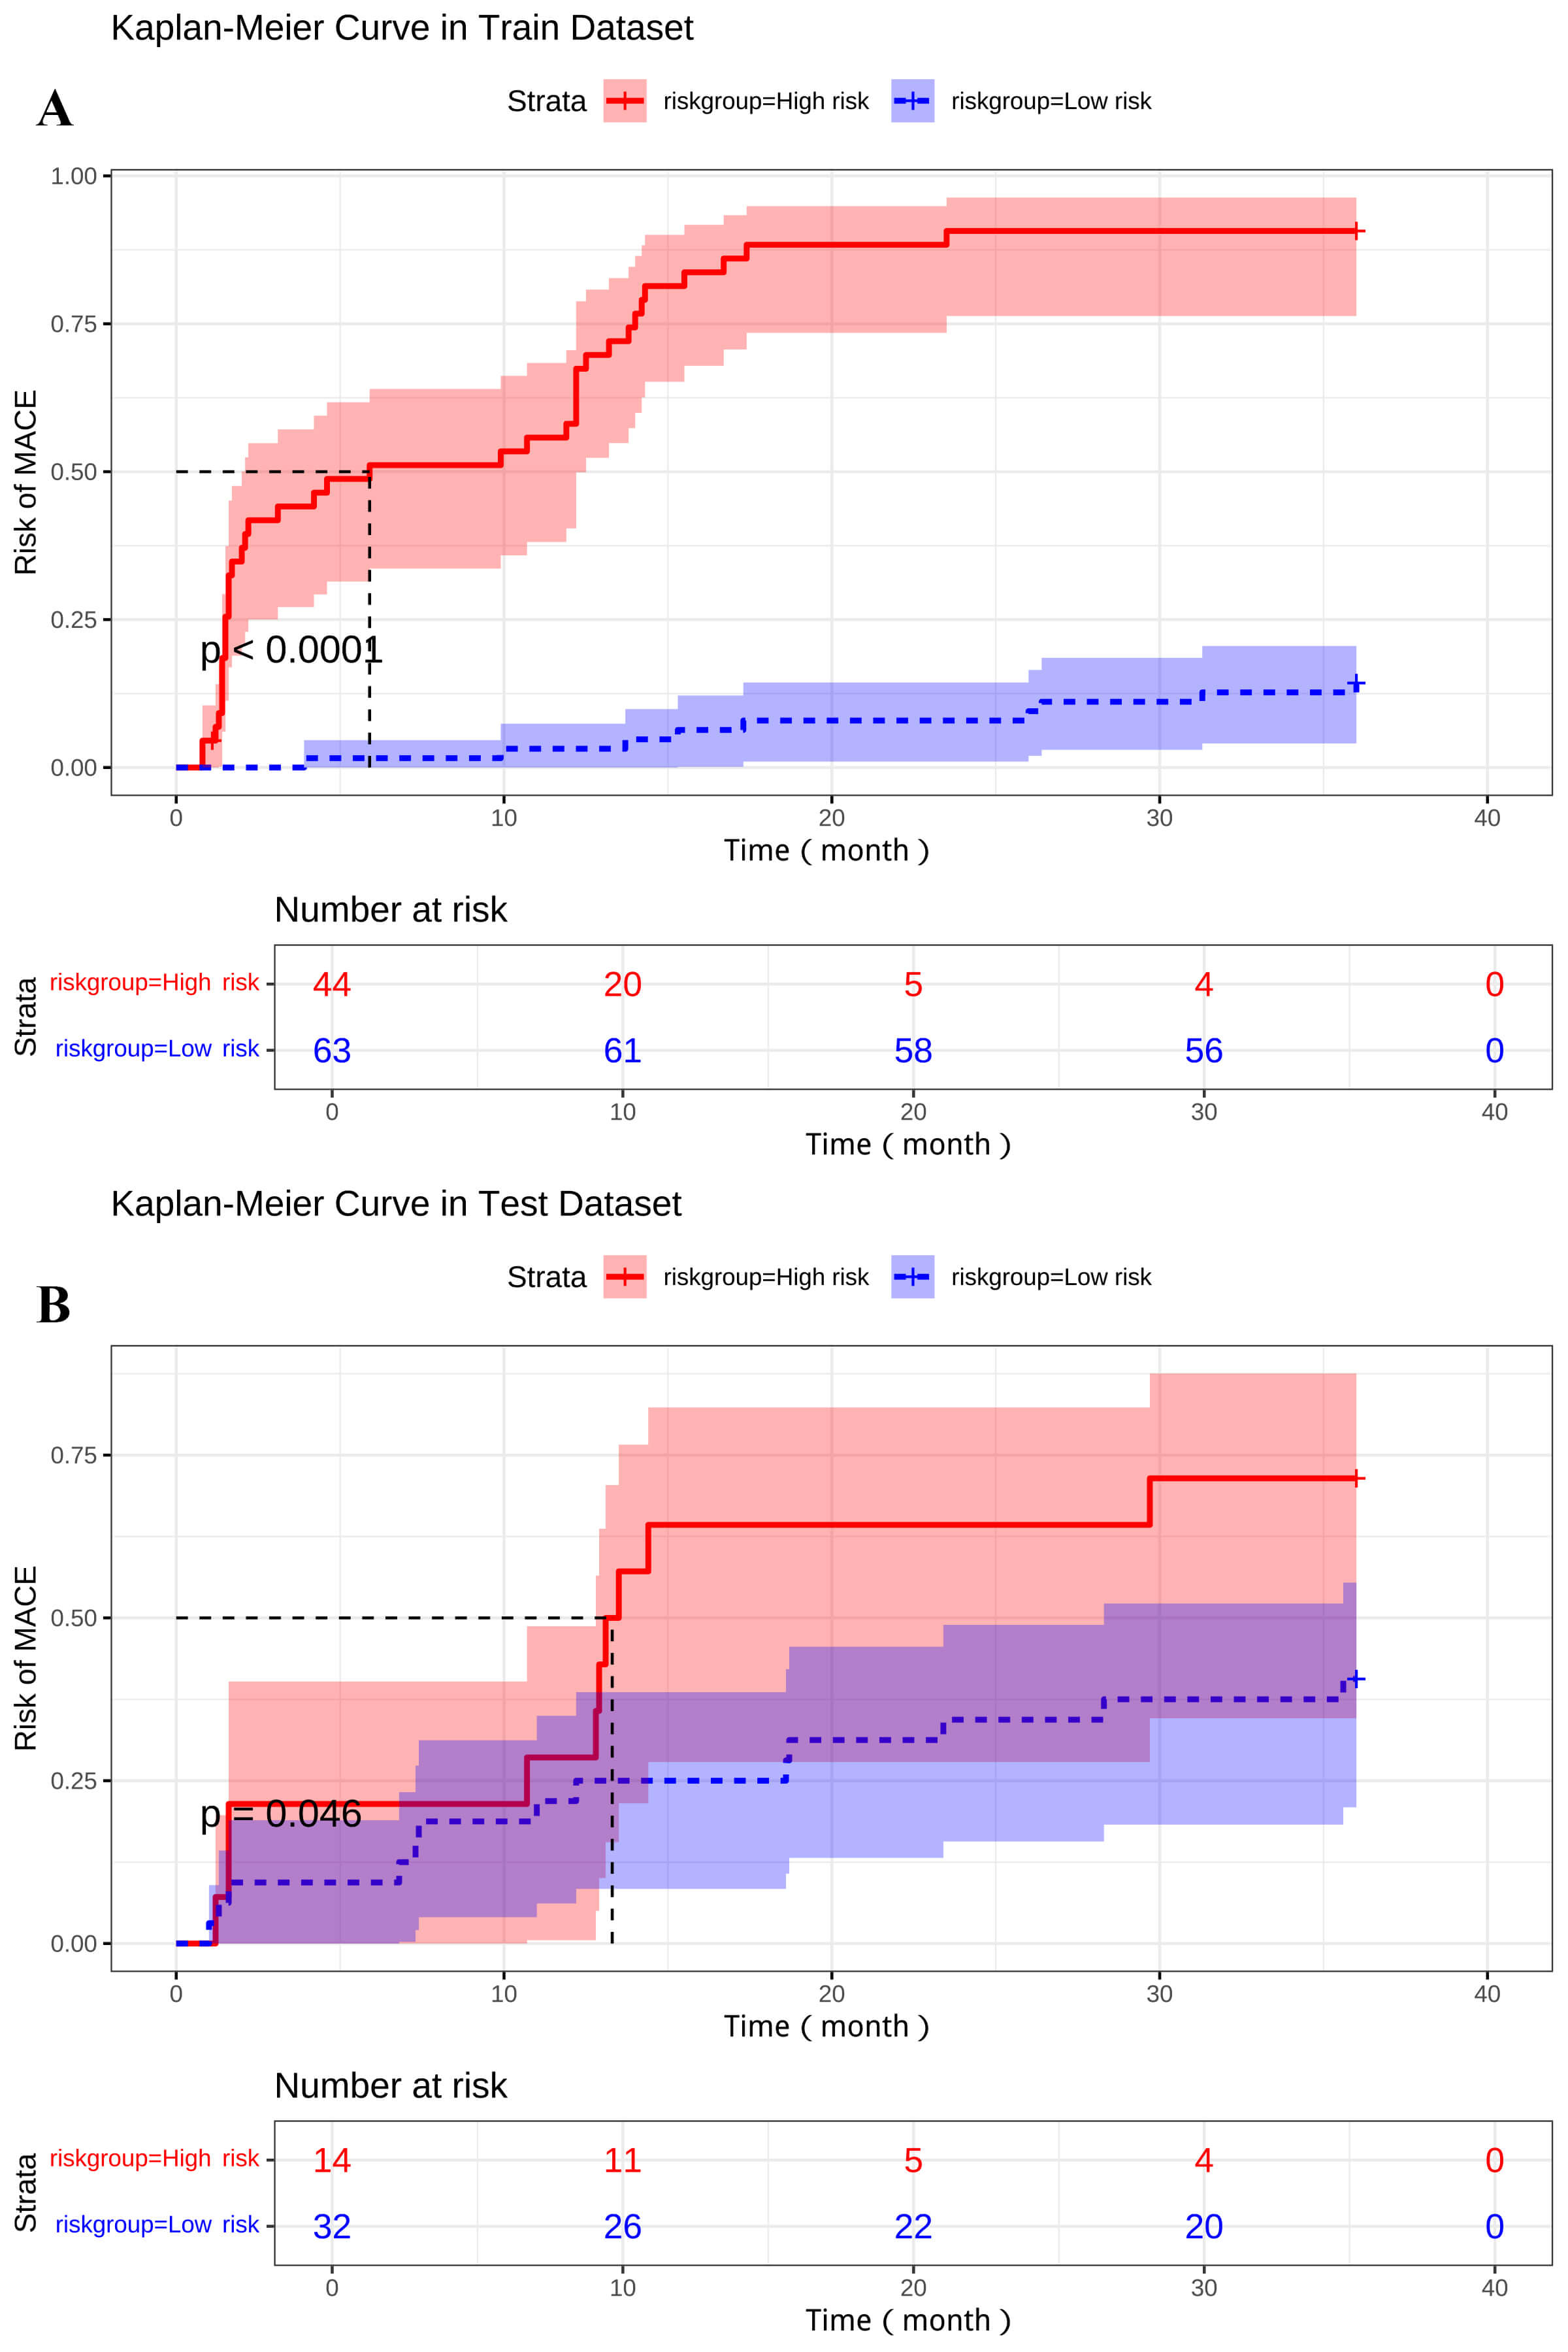 Fig. 7.
Kaplan-Meier curves for MACE-free survival based on nomogram-defined stratification into high-risk and low-risk groups according to the median total nomogram score. Shaded areas represent 95% confidence intervals. Tables below each plot show the number of patients at risk at different time points. (A) Derivation cohort. (B) Internal validation cohort.
This study successfully developed and internally validated a prognostic nomogram that integrates six clinical and CMR-derived predictors (Gensini score, serum albumin, LDL-C, LVEF, LVEDV) and mean LVWM to estimate the 1- to 3-year risk of MACE in patients with newly diagnosed STEMI after PCI. The model demonstrated good discrimination in the derivation cohort (C-index: 0.803), and moderate predictive accuracy in the internal validation cohort (C-index: 0.693), with stable calibration. DCA supported the clinical utility of the nomogram and its capability for effective risk stratification [20].
A substantial body of evidence has consolidated the role of CMR for post-STEMI risk prediction, encompassing markers of irreversible injury (IS), microcirculatory damage (MVO), and quantitative function/remodeling metrics. Contemporary syntheses have highlighted that CMR captures complementary structural and functional phenotypes, thereby extending prognostication beyond bedside clinical scores (e.g., GRACE/TIMI) and conventional indices such as LVEF [7, 8, 9, 10, 11, 12]. Notably, recent multicenter analyses have refined earlier views by demonstrating that intramyocardial hemorrhage (IMH) is the decisive adverse phenotype of microvascular injury: patients with IMH+ carry a substantially higher risk of MACE, whereas those with MVO+/IMH– exhibit outcomes comparable to patients without microvascular injury [21]. In parallel, longitudinal imaging has shown that persistent MVO can be detected beyond the subacute phase and portends unfavorable remodeling and events, reinforcing the importance of both injury severity and its temporal evolution [22, 23].
Beyond tissue injury, feature-tracking CMR (FT-CMR) strain provides incremental prognostic information. In particular, global longitudinal strain (GLS) confers risk discrimination that complements or surpasses LVEF in post-STEMI cohorts and related ischemic populations, supporting the use of regional/global deformation as a summary of spatially heterogeneous damage and recovery [24, 25]. Tissue characterization via mapping adds further nuance. T1/T2-based signatures of microvascular injury and edema, extending even to the non-infarcted myocardium, have been independently linked to subsequent cardiovascular events, suggesting that diffuse or peri-infarct changes convey vulnerability beyond scar size per se [26, 27]. Methodologically, the timing of acquisition materially affects the magnitude and stability of CMR biomarkers. Expert recommendations and contemporary reviews agree that a subacute window of around 3–7 days post-MI is optimal for quantifying key endpoints (e.g., IS, edema-defined area-at-risk, and microvascular injury), facilitating comparisons across studies [11, 28].
Against this backdrop, our approach of combining routine clinical factors (Gensini score, albumin, LDL-C) with quantitative measures of pump function and remodeling (LVEF, LVEDV), plus a regional functional summary (mean LVWM), aligns with the general direction in this field. A transparent Cox framework, together with a nomogram presentation, favor interpretability and clinical translation while preserving reproducibility. Our performance assessment (discrimination, time-dependent AUCs, calibration, and decision-curve analysis) mirrors contemporary guidance on model evaluation and reporting. The stable calibration across derivation and validation cohorts is particularly relevant for individualized risk estimation, an attribute not uniformly documented in prior CMR-integrated tools [5, 29, 30, 31, 32].
The six independent predictors in our final model map to complementary pathophysiologic axes, i.e., coronary disease burden (Gensini score), systemic milieu (albumin, LDL-C), and myocardial function/remodeling (LVEF, LVEDV, mean LVWM). From the CMR domain, reduced LVEF and increased LVEDV reaffirm well-established associations with adverse remodeling and MACE, while the strong protective association of higher mean LVWM underscores the incremental value of regional functional integrity beyond the performance of global ejection [25, 33, 34, 35, 36]. Among the clinical variables, lower albumin likely reflects systemic inflammation and poor physiologic reserve, consistent with literature linking hypoalbuminemia to adverse outcomes after PCI-treated STEMI, while higher LDLC denotes residual atherothrombotic risk despite revascularization [37, 38].
The absence of IS/MVO in the final multivariable model should be interpreted
cautiously, rather than indicating negation of their biological importance.
First, functional/remodeling measures often act as integrators of acute necrosis,
microvascular damage (including IMH), and early remodeling, thereby attenuating
the residual signal of tissue-centric variables previously considered jointly
[21, 33, 34]. Second, the imaging window is important. Subacute scans
(
Overall, these considerations are consistent with our findings: a concise, interpretable model anchored in function and remodeling delivered good derivation-cohort discrimination, while maintaining calibration and clinical net benefit on internal validation. The converging literature emphasizes the prognostic salience of IMH, the trajectory of MVO, the incremental value of FT-CMR strain, and standardized subacute imaging, all of which support the biological plausibility of our selected predictors. This warrants prospective external validation and head-to-head augmentation with strain/mapping in larger, multi-center datasets [11, 21, 22, 23, 25, 26, 27, 28].
Key strengths of our study include: (1) a long-term (1–3 years) focus on MACE risk stratification after PCI in newly diagnosed STEMI patients addresses a critical clinical gap; (2) incorporation of high-resolution CMR-derived phenotypic parameters, particularly LVEDV and mean LVWM; (3) a graphical nomogram interface facilitating individualized risk estimation; (4) rigorous methodology, including systematic variable selection, multidimensional performance evaluation (discrimination, calibration, time-dependent AUC), and decision curve analysis; and (5) inclusion of data from two centers, enhancing generalizability.
The nomogram presented here may support tailored secondary prevention strategies post-PCI by identifying high-risk patients eligible for intensified pharmacotherapy or surveillance, while guiding appropriate follow-up frequency in lower-risk individuals. Its visual format may also enhance clinician–patient communication and promote treatment adherence. Future integration into clinical decision support systems could facilitate its application in routine practice.
This study has several limitations that warrant consideration. First, its retrospective design inevitably introduces the potential for selection and information bias, which could affect the generalizability of our findings. While rigorous efforts were made to ensure data completeness and consistency, further prospective studies are needed to validate these results and establish causality more definitively. Furthermore, the relatively small size of our internal validation cohort (n = 46) may limit the statistical precision of our performance estimates and could render them more susceptible to sampling variability. Despite this, the consistent calibration observed across both cohorts provides a reassuring indication of the model’s reliability in estimating actual risks [30].
Second, our study performed only internal validation. While this is a critical initial step in the development of predictive models, establishing true external generalizability requires rigorous validation across diverse, independent cohorts from different institutions or geographical regions. Such external validation is essential to confirm the robustness and transferability of our nomogram to broader clinical practice settings with varying patient demographics and treatment protocols [31].
Third, while our model successfully integrates a comprehensive set of clinical and CMR parameters that proved highly predictive, we did not assess the incremental value of all emerging biomarkers, or even more advanced CMR techniques such as detailed myocardial strain imaging or quantitative T1/T2 mapping. These advanced modalities may offer additional nuanced insights into myocardial tissue characterization and function. However, it is important to note that our current model effectively leverages readily available and clinically routine CMR parameters alongside clinical data. This provides a practical and robust tool for risk stratification that can be more easily implemented in many clinical settings, while also laying the groundwork for future investigations that incorporate these novel markers [5].
Fourth, it should be noted that CMR is not yet part of routine clinical practice for STEMI patients and remains a relatively expensive imaging modality. The practical implementation of our CMR-based nomogram may be limited by equipment availability, costs, and the need for specialized expertise. Future studies should evaluate the cost-effectiveness and feasibility of routine CMR-based risk stratification in diverse healthcare settings.
Future research should also aim to: (1) externally validate the model in large, prospective, multicenter cohorts; (2) explore the integration of novel biomarkers, genetic data, or advanced CMR parameters to refine predictive accuracy; (3) assess the clinical utility of dynamic risk prediction and develop digital tools for clinical implementation; and (4) conduct head-to-head comparisons with existing risk scores across diverse populations to determine incremental benefit [32].
This study successfully developed and internally validated a Cox regression-based nomogram that integrates key clinical and quantitative CMR parameters to predict 1- to 3-year MACE in patients with new-onset STEMI following PCI. The nomogram demonstrated good predictive accuracy and calibration, thus offering a promising and practical tool to improve risk stratification in this high-risk population, potentially helping to tailor surveillance and improve secondary prevention. Further prospective external validation is crucial to confirm its widespread clinical utility.
Data to support the findings of this study are available on reasonable requests from the corresponding author.
SCW and WX designed and conducted this research, including study conception, protocol development, and overall supervision. YZ and LY were responsible for patient enrollment and clinical data collection. YQZ and DW contributed to systematic patient follow-up and comprehensive outcome data acquisition. LXY performed statistical analysis and data interpretation. XPM was responsible for CMR image acquisition, quality control, and technical optimization. All authors made substantial contributions to either drafting the manuscript or critically revising it for important intellectual content. All authors have read and approved the final version of the manuscript and agree to be accountable for all aspects of the work, ensuring that questions related to the accuracy or integrity of any part of the work are appropriately investigated and resolved.
The study protocol received approval from the ethics committees of both participating institutions (Affiliated Jiangyin Hospital of Nantong University, Approval No. (2025) Lun Shen Yan No. 014; Xintai People’s Hospital, Approval No. 2025-S021) and adhered to the principles of the Declaration of Helsinki. Given the retrospective design of the study and the use of de-identified clinical and imaging data, the requirement for obtaining informed consent from individual patients was formally waived by the above ethics committees.
The authors wish to express their gratitude to all patients who participated in this study for their cooperation. We also acknowledge the dedicated staff at the participating institutions for their valuable assistance and support throughout the research process.
This work was supported by the 2024 Nantong University Clinical Medicine Special Research Fund [grant number 2024LY049].
The authors declare no conflict of interest.
Supplementary material associated with this article can be found, in the online version, at https://doi.org/10.31083/HSF49261.
References
Publisher’s Note: IMR Press stays neutral with regard to jurisdictional claims in published maps and institutional affiliations.