

 , Du-An Wu 4,*
 , Bang-Gee Hsu 2,5,*
1 Division of Nephrology, Department of Medicine, Hualien Armed Forces General Hospital, 97144 Hualien, Taiwan
2 Institute of Medical Sciences, Tzu Chi University, 97144 Hualien, Taiwan
3 Division of Nephrology, Department of Internal Medicine, Tri-Service General Hospital, National Defense Medical Center, 11490 Taipei, Taiwan
4 Division of Metabolism and Endocrinology, Hualien Tzu Chi Hospital, Buddhist Tzu Chi Medical Foundation, 97144 Hualien, Taiwan
5 Division of Nephrology, Hualien Tzu Chi Hospital, Buddhist Tzu Chi Medical Foundation, 97144 Hualien, Taiwan
Abstract
Background: The global number of people living with diabetes mellitus
(DM) continues to grow. Obesity, smoking, hypercholesterolemia, and hypertension
are independently correlated with the risk of cardiovascular disease (CVD) in
diabetic patients regardless of differences in race or ethnicity. We aimed to
investigate the relationship between serum leptin levels and aortic stiffness in
patients with type 2 DM to identify cardiovascular risk at the early stage.
Methods: A total of 128 diabetic patients were enrolled after screening
for eligibility at a medical center in Eastern Taiwan. Aortic stiffness was
defined as having a carotid-femoral pulse wave velocity (cfPWV) of
Keywords
- aortic stiffness
- type 2 diabetes mellitus
- insulin resistance
- leptin
- obesity
- carotid-femoral pulse wave velocity
The estimated global number of people living with diabetes mellitus (DM) increased by over 400 million in the past 40 years (from 1980 to 2021), with the greatest relative increase expected to occur in middle-income countries [1, 2]. Besides nonmodifiable factors such as genetic predisposition, previous gestational DM, and aging, several factors, including obesity, diet, physical activity, and smoking, could be modified to alleviate the disease course. For example, obesity can lead not only to increased circulating volume-related right and left ventricular hypertrophy but also leptin resistance, insulin resistance, and/or inflammation-mediated vascular and myocardial injury [3, 4, 5]. In a cross-sectional survey of American adults, a body mass index (BMI) of 40 or greater was associated with the development of DM (odds ratio (OR): 7.37, 95% confidence interval (CI): 6.39–8.50), elevated blood pressure (OR: 6.39, 95% CI: 5.67–7.16), and elevated cholesterol levels (OR: 1.88, 95% CI: 1.67–2.13) compared with normal BMI [6]. In diabetic patients of different races or ethnicities, obesity, smoking, hypercholesterolemia, and hypertension were all proven to be independent risk factors of cardiovascular disease (CVD), which accounts for 44% and 52% of deaths in type 1 and 2 DM, respectively [7, 8]. However, the initial presentations of CVD in the diabetic population could be subtle. The most common CVD is peripheral arterial disease (16.2%), followed by heart failure (14.1%) and stable angina [9]. These findings suggest that early recognition of CVD is crucial, and pulse wave velocity (PWV) is considered a golden standard measurement of aortic stiffness—subclinical but significant alterations of aortic vascular function which can predict the future cardiovascular dysfunction [10, 11, 12, 13].
Encoded by the obese (ob) gene, leptin is a 16-kDa cytokine that is mostly expressed in adipocytes, released into circulation and correlated with whole-body adipose tissue mass. Leptin mainly serves as a long-term system to control feeding behaviors and energy expenditure [14, 15]. Generally speaking, elevated circulating leptin levels are positively associated with hypertension, atherosclerosis, myocardial infarction, cerebrovascular accidents, inflammation, and angiogenesis in obese individuals, albeit some paradoxical observations and controversies remain [16]. Although leptin exerts protective effects on cardiomyocytes against apoptosis induced by hydrogen peroxides or ischemia-reperfusion injury [17, 18], unfavorable consequences, including enhanced atherosclerosis, are evident via mechanisms such as endothelial dysfunction, monocyte recruitment into intimal layers, macrophages-to-foam-cell transformation, vascular smooth muscle cell proliferation, and proatherogenic cytokine secretion [19]. In the present study, we aimed to determine the relationship between serum leptin levels and aortic stiffness in type 2 DM patients.
Patients with type 2 DM who regularly visited the endocrinology and metabolism clinic of an Eastern Taiwan medical center from March 2018 to December 2018 were screened. The exclusion criteria included acute infection, acute coronary syndrome, amputation, heart failure, or malignancy upon enrollment. One-hundred twenty-eight patients were included, and all provided signed informed consents. This study was approved by the Research Ethics Committee, Hualien Tzu Chi Hospital, Buddhist Tzu Chi Medical Foundation (IRB106-111-A). All recruited participants were assigned to the aortic stiffness group or control group according to their carotid-femoral PWV measurement specified in the following section.
Standing body height and body weight were measured and rounded up to the nearest 0.5 cm and 0.5 kg, respectively, while the participant wore light clothes without shoes. Waist circumference was taken midway through the abdomen using a tape measure during exhalation. Hip circumference was recorded by wrapping the same tape measure around the widest portion of the buttocks. BMI was calculated as body weight in kilograms divided by the square of body height in meters. Body composition was evaluated by an analyzer equipped with single-frequency (50 kHz) (Biodynamic-450, Biodynamics Corporation, Seattle, WA, USA). All aforementioned measurements were performed by the same research staff.
After an overnight or at least 8-h fast, approximately 5 mL of venous blood was
drawn from each participant. The sample was processed immediately after 10-min
centrifugation at 3000
The systolic (SBP) and diastolic blood pressure (DBP) of the dominant arm was
measured using a standard mercury sphygmomanometer with an appropriately sized
cuff after a 10-min seated rest in the morning. The mean SBP and DBP measured
three times with a 5-min interval was taken. Carotid-femoral PWV (cfPWV) was
measured with a manual sphygmomanometer (SphygmoCor system, AtCor Medical,
Sydney, New South Wales, Australia) by detecting the arterial pulse waveform at
the participant’s common carotid and femoral arteries after resting in the supine
position for longer than 10 min in a quiet and temperature-controlled room [22, 23]. Simultaneous electrocardiography (ECG) recording provided R references that
gated the time delay between the arrival of the pulse wave at the carotid and
femoral detection sites. The “distance” was obtained by subtracting the
carotid-sternal notch length from the femoral-sternal notch length. An integral
software was utilized to process each set of the pulse wave and ECG recordings on
a beat-to-beat basis for an average of 10 consecutive cardiac cycles. The cfPWV
was calculated as the distance in meters divided by the mean time delay in
seconds between the two detection sites (m/s). The built-in quality indices of
the software ensured the uniformity of the data. Participants with a cfPWV of
The Kolmogorov–Smirnov test was used to examine the distribution of continuous
variables. Normally distributed variables were expressed as mean
The demographic characteristics, biochemical data, and medications of 128
patients with type 2 DM are summarized in Table 1. Forty-six diabetic patients
with a cfPWV of
| Variables | All patients (n = 128) | Control group (n = 82) | Aortic stiffness group (n = 46) | p |
| Age, years | 62.27 |
60.34 |
65.70 |
0.019* |
| Height, cm | 162.65 |
163.50 |
161.12 |
0.112 |
| Body weight, kg | 71.44 |
70.85 |
72.51 |
0.492 |
| Waist circumference, cm | 90.88 |
89.40 |
93.52 |
0.019* |
| Body mass index, kg/m |
26.89 |
26.36 |
27.83 |
0.033* |
| Body fat mass, % | 30.45 |
28.97 |
33.08 |
0.002* |
| cfPWV, m/s | 9.53 |
7.96 |
12.35 |
|
| SBP, mmHg | 141.77 |
136.57 |
151.02 |
|
| DBP, mmHg | 82.77 |
80.59 |
86.65 |
0.003* |
| Total cholesterol, mg/dL | 162.64 |
162.39 |
163.09 |
0.904 |
| Triglyceride, mg/dL | 114.50 (85.25–180.02) | 109.00 (79.50–149.75) | 130.50 (97.75–211.00) | 0.020* |
| HDL-C, mg/dL | 46.55 |
47.55 |
44.78 |
0.227 |
| LDL-C, mg/dL | 100.38 |
101.24 |
98.85 |
0.621 |
| Fasting glucose, mg/dL | 140.00 (121.00–176.75) | 130.50 (118.75–166.50) | 153.00 (125.50–197.00) | 0.044* |
| Glycated hemoglobin, % | 8.02 |
7.78 |
8.43 |
0.049* |
| Blood urea nitrogen, mg/dL | 16.00 (13.00–19.75) | 16.00 (12.00–18.00) | 18.00 (14.00–22.00) | 0.044* |
| Creatinine, mg/dL | 0.90 (0.70–1.00) | 0.90 (0.70–1.00) | 0.90 (0.80–1.30) | 0.076 |
| eGFR, mL/min | 86.29 |
92.04 |
76.05 |
0.001* |
| Total calcium, mg/dL | 9.14 |
9.16 |
9.09 |
0.462 |
| Phosphorus, mg/dL | 3.59 |
3.54 |
3.67 |
0.167 |
| UACR, mg/g | 18.50 (8.28–101.45) | 12.35 (7.27–36.28) | 36.05 (14.78–347.25) | |
| Insulin, uIU/mL | 6.53 (3.17–12.99) | 6.03 (3.04–11.27) | 8.83 (4.44–16.30) | 0.095 |
| HOMA-IR | 2.44 (1.23–4.65) | 2.15 (1.02–3.63) | 2.67 (1.58–5.86) | 0.026* |
| Leptin, ng/mL | 22.01 |
19.06 |
27.27 |
|
| Male, n (%) | 76 (59.4) | 53 (64.6) | 23 (50.0) | 0.106 |
| Hypertension, n (%) | 64 (50.0) | 39 (47.6) | 25 (54.3) | 0.461 |
| Metabolic syndrome, n (%) | 87 (68.0) | 49 (59.8) | 38 (82.6) | 0.008* |
| ACE inhibitor use, n (%) | 6 (4.7) | 4 (4.9) | 2 (4.3) | 0.892 |
| ARB use, n (%) | 52 (40.6) | 29 (35.4) | 23 (50.0) | 0.106 |
| 17 (13.3) | 8 (9.8) | 9 (19.6) | 0.117 | |
| CCB use, n (%) | 37 (28.9) | 21 (25.6) | 17 (31.5) | 0.991 |
| Statin use, n (%) | 62 (48.4) | 39 (47.6) | 23 (50.0) | 0.791 |
| Fibrate use, n (%) | 4 (3.1) | 2 (2.4) | 2 (4.3) | 0.551 |
| Metformin use, n (%) | 72 (56.3) | 46 (56.1) | 26 (56.5) | 0.963 |
| Sulfonylureas use, n (%) | 69 (53.9) | 44 (53.7) | 25 (54.3) | 0.940 |
| DDP-4 inhibitor use, n (%) | 76 (59.4) | 50 (61.0) | 26 (56.5) | 0.623 |
| Insulin use, n (%) | 33 (25.8) | 21 (25.6) | 12 (26.1) | 0.953 |
The correlations between the severity of aortic stiffness and clinical variables
of patients with type 2 DM were then examined in the simple linear regression
analysis. We found that age (r = 0.359; p
| Variables | Carotid-femoral pulse wave velocity (m/s) | ||||
| Simple linear regression | Multivariable linear regression | ||||
| r | p | Beta | p | ||
| Female | 0.116 | 0.194 | — | — | — |
| Hypertension | 0.163 | 0.065 | — | — | — |
| Age (years) | 0.359 | 0.291 | 0.055 | ||
| Height (cm) | –0.114 | 0.200 | — | — | — |
| Body weight (kg) | 0.064 | 0.475 | — | — | — |
| Waist circumference (cm) | 0.231 | 0.009* | — | — | — |
| Body mass index (kg/m |
0.168 | 0.058 | — | — | — |
| Body fat mass (%) | 0.250 | 0.004* | — | — | — |
| Systolic blood pressure (mmHg) | 0.391 | 0.176 | 0.087 | 0.033* | |
| Diastolic blood pressure (mmHg) | 0.226 | 0.010* | — | — | — |
| Total cholesterol (mg/dL) | –0.032 | 0.719 | — | — | — |
| Log-Triglyceride (mg/dL) | 0.250 | 0.004* | — | — | — |
| HDL-C (mg/dL) | –0.120 | 0.178 | — | — | — |
| LDL-C (mg/dL) | –0.118 | 0.183 | — | — | — |
| Log-Glucose (mg/dL) | 0.123 | 0.168 | — | — | — |
| Glycated hemoglobin (%) | 0.134 | 0.132 | — | — | — |
| Log-BUN (mg/dL) | 0.189 | 0.033* | — | — | — |
| Log-Creatinine (mg/dL) | 0.232 | 0.008* | — | — | — |
| eGFR (mL/min) | –0.350 | — | — | — | |
| Log-UACR (mg/g) | 0.367 | 0.256 | 0.048 | 0.002* | |
| Total calcium (mg/dL) | –0.063 | 0.479 | — | — | — |
| Phosphorus (mg/dL) | 0.050 | 0.574 | — | — | — |
| Log-Insulin (uIU/mL) | 0.167 | 0.060 | — | — | — |
| Log-HOMA-IR | 0.190 | 0.030* | — | — | — |
| Leptin (ng/mL) | 0.401 | 0.244 | 0.154 | 0.002* | |
Next, we performed multivariable logistic regression analysis to adjust for the aforementioned factors that were associated with aortic stiffness. Only serum leptin levels were correlated with a higher probability of developing aortic stiffness (OR: 1.055, 95% CI: 1.005–1.107, p = 0.031) in patients with type 2 DM (Table 3).
| Variables | Odds ratio | 95% confidence interval | p |
| Leptin, 1 ng/mL | 1.055 | 1.005–1.107 | 0.031* |
| Age, 1 year | 1.035 | 0.983–1.089 | 0.194 |
| Body mass index, 1 kg/m |
1.019 | 0.811–1.281 | 1.019 |
| Waist circumference, 1 cm | 1.000 | 0.916–1.093 | 0.992 |
| Body fat mass, 1% | 1.050 | 0.976–1.130 | 0.194 |
| Systolic blood pressure, 1 mmHg | 1.011 | 0.977–1.046 | 0.547 |
| Diastolic blood pressure, 1 mmHg | 1.016 | 0.957–1.078 | 0.609 |
| Estimated glomerular filtration rate, 1 mL/min | 0.986 | 0.964–1.008 | 0.217 |
| Urine albumin-to-creatinine ratio, 1 mg/g | 1.000 | 1.000–1.001 | 0.392 |
| Fasting glucose, 1 mg/dL | 1.007 | 0.994–1.020 | 0.296 |
| Triglyceride, 1 mg/dL | 0.998 | 0.991–1.005 | 0.617 |
| Insulin, 1 uIU/mL | 0.997 | 0.845–1.177 | 0.974 |
| HOMA-IR | 1.048 | 0.712–1.542 | 0.814 |
In this study, we found that type 2 DM patients with aortic stiffness tended to be older; more obese; and have higher blood pressures, poorer blood sugar control, and significant kidney disease compared to those without. Among these well-known confounding factors, serum leptin levels were proven to be independently correlated with aortic stiffness. With a 1 ng/mL increment in serum leptin levels, the risk of aortic stiffness in patients with type 2 DM would increase by 5.5%.
Biologically, leptin contributes to maintaining metabolic homeostasis via modulating insulin secretion, hepatic glucose generation, and lipid metabolism [24, 25, 26, 27, 28]. Leptin increases in response to adequate fat storage to further diminish the drive to feed and to enable energy expenditure via various neuroendocrine and autonomic pathways. When individuals experience calorie restriction or stable weight reduction, the falling leptin concentration promotes behavioral adaptations to increase the desire to eat and decrease energy utilization and stores [29, 30]. In our study, the aortic stiffness group had higher serum leptin levels and was more obese than the control group. A previous study found a correlation between leptin and unfavorable cardiovascular outcomes [31]. Obesity-induced perivascular adipose tissue dysfunction was also found to participate in the dysregulation of vascular tone or vascular smooth muscle cell proliferation [32, 33]. Nevertheless, the coexistence of obesity and hyperleptinemia cannot be simply coined as “leptin resistance”. The concentration of leptin does not ensure the activation of leptin receptors and downstream pathways, or “responsiveness”; thus, it cannot be used to directly examine the molecular mechanism underlying leptin resistance in humans. Given the lack of clinically available and quantifiable biomarkers (behavioral or metabolic) to evaluate leptin responsiveness, the more important issue would be to identify patients who may benefit from leptin therapy [34].
The direct adverse effects of leptin on the heart can be contributed to
metabolic effects (reduced glucose oxidation, increased fatty acid oxidation)
with a subsequent decrease in cardiac efficiency [35, 36], hypertrophic effect
(partial through a p38 MAPK-dependent signaling pathway) [37, 38], and
inflammatory effect (through regulating Tolllike receptor expression and inmate
immunity activation) [39]. Leptin also has direct effects on the vasculature,
including atherosclerotic effects [18, 40], endothelial dysfunction resulting
from the long-term effect of leptin on NO synthesis and disturbed bioavailability
[41], and thrombosis induction (through platelet aggregation via cGMPinhibited
3
Although several studies have attempted to analyze the relationship between
serum leptin and arterial stiffness to provide evidence of leptin as an
independent cardiovascular risk factor in different cohorts, inconsistencies, and
heterogeneities still exist. In a meta-analysis of observational studies
published by D’Elia et al. [47], 11 cohorts with a total of 7580
participants of different disease backgrounds were included. Their pooled
analysis demonstrated a positive correlation between serum leptin level and PWV
value, albeit great heterogeneity existed across these studies. To address this
issue specifically in diabetic cohorts, we reviewed the studies of Teoh
et al. [48] and Khiyami et al. [49] and found that
log-transformed leptin was not associated with arterial stiffness. Another study
published by Yu et al. [50] included patients with obesity and diabetes.
After pooling with our own data, we demonstrated a significant and positive
correlation between leptin and PWV (r = 0.38, 95% CI: 0.24–0.50, p
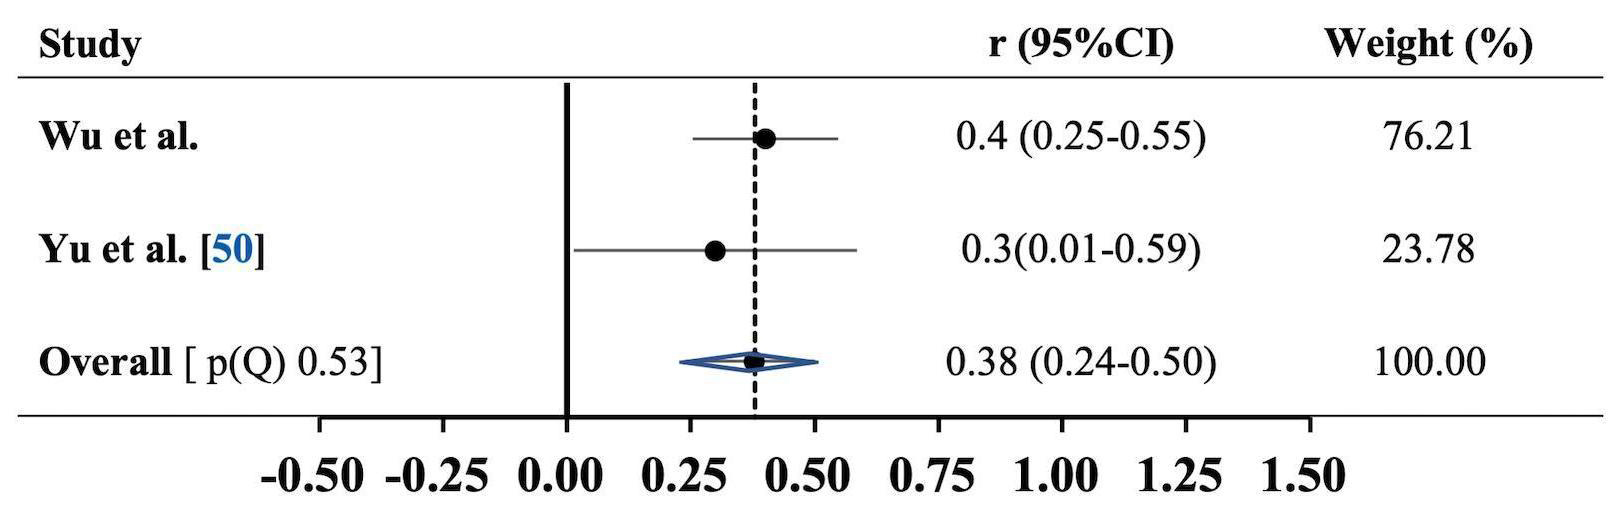 Fig. 1.
Association between carotid-femoral pulse wave velocity and serum leptin levels. Results are expressed as correlation (r) and 95% confidence intervals (95% CI). Horizontal lines represent 95% CI. Diamond indicates the overall correlation with its 95% CI. Heterogeneity p-value of Cochrane Q test, (p(Q)).
We acknowledge that there are still some limitations in this study. The small size and single-center, cross-sectional design of this study might hamper the generalizability of our findings to the whole population. Although the multivariable regression analysis was performed, age, SBP, albuminuria, and leptin still affected cfPWV. Although we analyzed the major components of metabolic syndrome in the multivariable logistic regression model, only leptin positively correlated with aortic stiffness. Whether the metabolic syndrome exerts a mediator effect between leptin and aortic stiffness in diabetes patients is still unresolved, given its high prevalence in our study participants (68%). Nevertheless, leptin is found to positively correlate with arterial stiffness across patients with different diseases [47]. Therefore, a population-based, longitudinal cohort study might be worthy to establish in order to address the long-term effect of leptin on cardiovascular disease.
Our study suggested that higher serum leptin levels were significantly associated with aortic stiffness that was diagnosed by carotid-femoral pulse wave velocity in type 2 DM patients.
The dataset that used, analyzed, or generated in this research is available from the corresponding author, BGH., upon reasonable request.
BGH and DAW designed and performed the research study. DAW provided help and advices. BGH and TJW analyzed the data. TJW wrote the manuscript. All authors contributed to editorial changes in the manuscript. All authors read and approved the final manuscript. All authors have participated sufficiently in the work to take public responsibility for appropriate portions of the content and agreed to be accountable for all aspects of the work in ensuring that questions related to its accuracy or integrity.
The Research Ethics Committee, Hualien Tzu Chi Hospital, Buddhist Tzu Chi Medical Foundation had granted the ethical approval of this study (IRB106-111-A). All of the patients provided signed informed consent.
The authors are grateful to all the participants in our study for their time and cooperation.
This research was funded by grants from the Buddhist Tzu Chi Medical Foundation, Taiwan (TCRD109-71).
The authors declare no conflict of interest.
References
Publisher’s Note: IMR Press stays neutral with regard to jurisdictional claims in published maps and institutional affiliations.