


 , Dražan Butorac 2, Ivka Djaković 3, Marijo Čukelj 2, Sandra Stasenko 4, Marija Grdić Rajković 5
1 Department of Clinical Chemistry, Sestre Milosrdnice University Hospital Center, 10000 Zagreb, Croatia
2 Department of Obstetrics and Gynecology, Sestre Milosrdnice University Hospital Center, 10000 Zagreb, Croatia
3 Department of Gynecology, Bethesda Hospital, 4052 Basel, Switzerland
4 Department of Obstetrics and Gynecology, Merkur University Hospital, 10000 Zagreb, Croatia
5 Department of Medical Biochemistry and Haematology, Faculty of Pharmacy and Biochemistry, University of Zagreb, 10000 Zagreb, Croatia
Abstract
Hypertensive disorders in pregnancy, such as gestational hypertension (GH), pose significant risks to maternal and fetal health, affecting a substantial proportion of pregnancies worldwide. Despite their prevalence, the dynamics of various biomarkers across the peripartum period remain poorly understood, limiting comprehensive insight into their pathophysiology. This study aimed to evaluate changes in neuroendocrine, angiogenic, and inflammatory biomarkers before and after delivery in women with GH and to compare these profiles with those of normotensive controls.
This prospective study included women with singleton vaginal deliveries, assigned to GH and control groups (n = 20 per group). Clinical data were collected, and blood samples (pre- and 2 hours post-delivery) were analyzed for chromogranin A (CgA), catestatin (CST), soluble fms-like tyrosine kinase-1 (sFlt-1), placental growth factor (PlGF), interleukin-6 (IL-6), and C-reactive protein (CRP). Peripartum changes were evaluated using rank-based repeated-measures analysis.
CgA concentrations decreased significantly after delivery in both groups (pTime < 0.001), with comparable peripartum kinetics (pGroup×Time = 0.718; median difference [MD]: 2.3 ng/mL; 95% confidence interval [CI]: –5.4 to 7.8). PlGF concentrations were significantly lower in the GH group (pGroup = 0.002) and declined after birth (pTime < 0.001), with a clinically meaningful trend toward a greater decline in the GH group (MD: 78 pg/mL; 95% CI: 30 to 220). IL-6 increased 10-fold after delivery (pTime < 0.001), with a comparable shift between groups (pGroup×Time = 0.456; MD: 6.9 pg/mL; 95% CI: –9.1 to 21.2). CRP concentrations increased after delivery (pTime < 0.001), with no difference in peripartum kinetics between groups (pGroup×Time = 0.257). Pre-delivery CgA and sFlt-1 were strongly correlated in the control group (rs = 0.636, p = 0.003). Sex-stratified analyses revealed significantly lower IL-6 concentrations in female fetuses within the control group (1.9 vs. 3.6 pg/mL; p = 0.037), and significantly lower PlGF concentrations in female fetuses within the GH group (73 vs. 153 pg/mL; p = 0.039).
Our results align with established patterns for angiogenic and inflammatory markers, but these novel neuroendocrine findings require validation in larger groups. Incorporating neuroendocrine regulation into models of GH is a key area for future study.
The study has been registered on https://zenodo.org/ (registration number: zenodo. 18958924; registration link: https://zenodo.org/records/18958924).
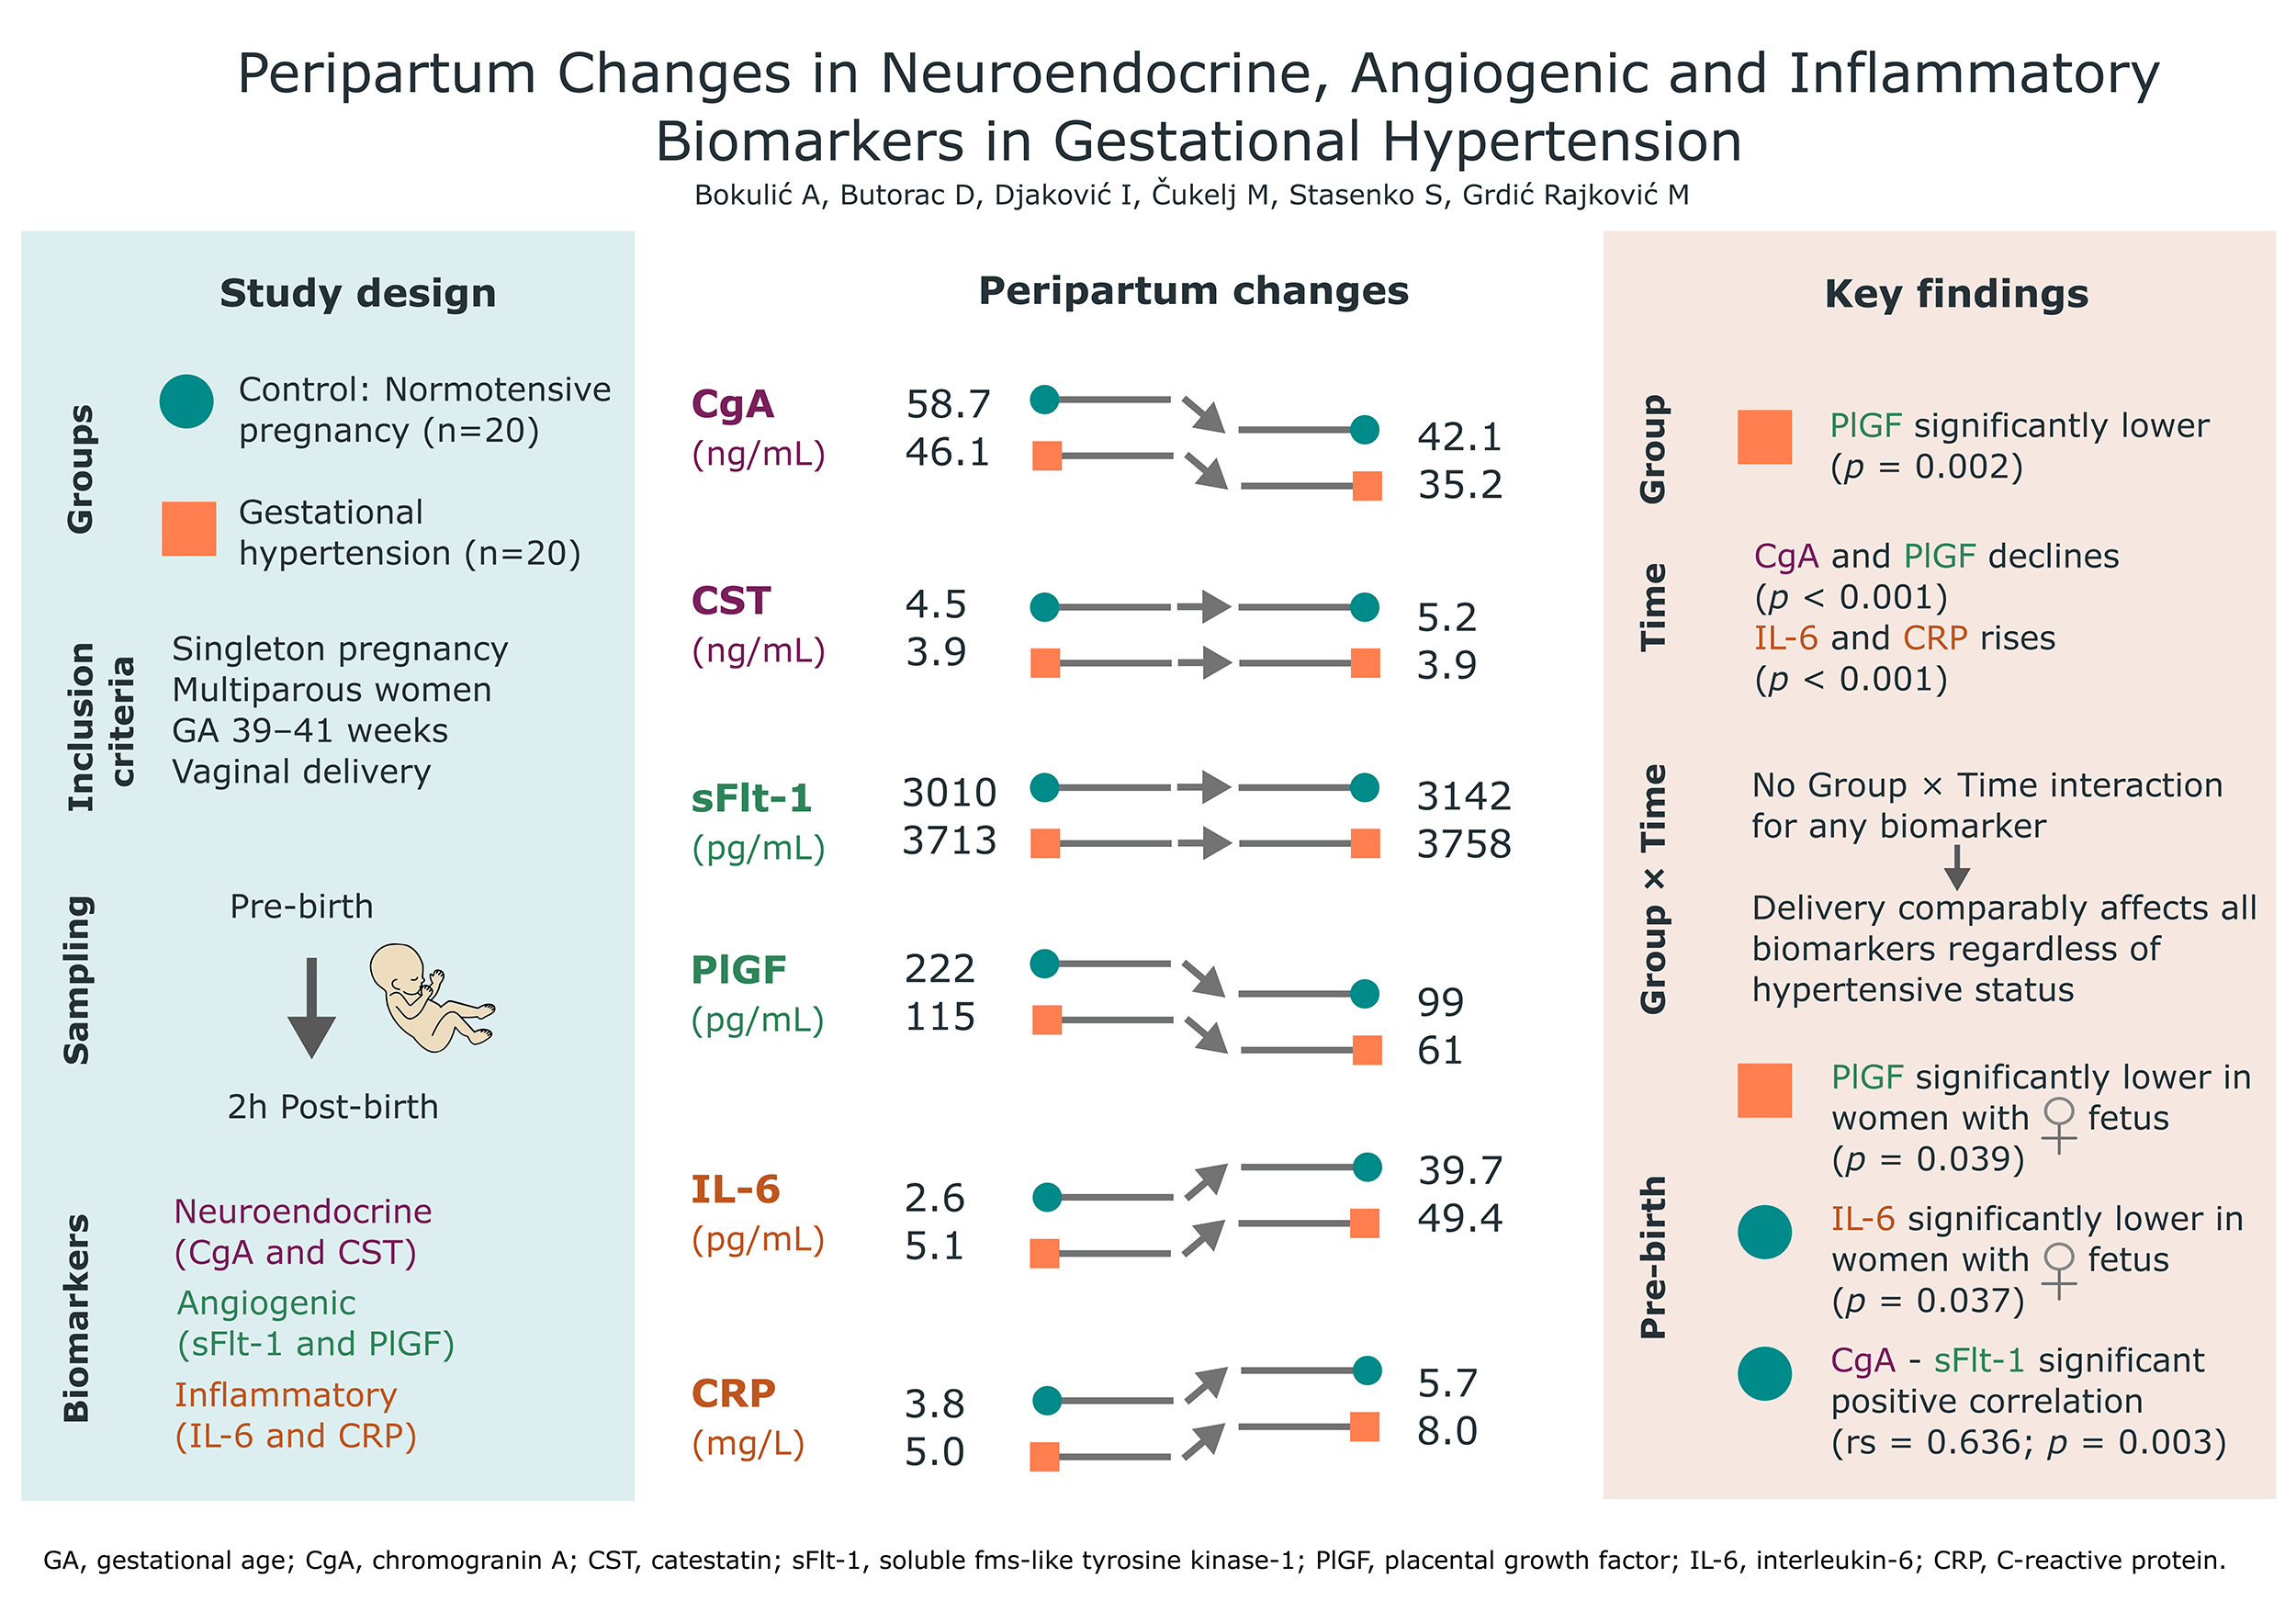
Graphical Abstract
Keywords
- gestational hypertension
- peripartum changes
- neuroendocrine biomarkers
- angiogenic biomarkers
- inflammatory biomarkers
Hypertensive disorders in pregnancy represent a spectrum of conditions characterized by elevated blood pressure during pregnancy, including gestational hypertension (GH), preeclampsia, eclampsia, and chronic hypertension with superimposed preeclampsia. These disorders affect approximately 5–8% of pregnancies worldwide and are a significant cause of maternal and perinatal morbidity and mortality [1, 2]. GH is the most common hypertensive disorder of pregnancy. Although its complications are generally less severe compared with preeclampsia, it is not without risk, as GH can progress to preeclampsia, and it is associated with adverse maternal and fetal outcomes. The severity of blood pressure elevation and the gestational age at presentation influence the risk of complications [1, 2]. Despite extensive research, the precise etiology remains unclear, although placental dysfunction is widely recognized as a key pathogenic event, alongside angiogenic imbalance, systemic inflammation, and neuroendocrine dysregulation [3]. This complex interplay of factors contributes to the full clinical presentation of the disorder. Beyond hypertensive disorders, dysregulation of neuroendocrine, inflammatory, and angiogenic signaling pathways is frequently associated with other pregnancy complications, such as intrauterine growth restriction (IUGR), gestational diabetes mellitus (GDM), and premature membrane rupture (PROM) [4, 5, 6].
Neuroendocrine dysregulation also contributes to these disease pathogeneses, with evidence indicating changes in maternal autonomic function and increased sympathetic nervous system activity in hypertensive disorders of pregnancy [3]. Chromogranin A (CgA) is a glycoprotein widely expressed in neuroendocrine cells and serves as a precursor for multiple biologically active peptides. CgA and its peptides are involved in a range of biological processes, including the maintenance of cardiovascular homeostasis and the regulation of the immune system [7]. Catestatin (CST), a peptide derived from CgA, exhibits immunomodulatory properties and has been linked to various inflammatory conditions [8, 9]. It displays vasodilatory and anti-adrenergic effects, reducing catecholamine release. Altered CST levels have been associated with blood pressure regulation in nonpregnant populations, with evidence suggesting a protective role against hypertension. Both CgA and CST are produced by the placenta and show promising theoretical potential based on their functions in vascular regulation. However, clinical evidence remains limited and inconsistent across studies [10].
Angiogenic factors, including soluble fms-like tyrosine kinase-1 (sFlt-1) and placental growth factor (PlGF), provide the strongest clinical evidence for diagnosing and monitoring hypertensive disorders in pregnancy. An imbalance between the antiangiogenic factor sFlt-1 and the proangiogenic factor PlGF results in a higher sFlt-1/PlGF ratio in pregnancies with hypertension [2]. Elevated sFlt-1 enhances inflammation by increasing endothelial sensitivity to proinflammatory factors [11], whereas PlGF deficiency impairs immunomodulatory responses and angiogenesis, further exacerbating endothelial dysfunction [12, 13].
Inflammatory markers are consistently elevated in hypertensive pregnancies and correlate with disease severity. However, their nonspecific nature limits their diagnostic utility as standalone markers [14]. The proinflammatory cytokine interleukin-6 (IL-6), produced by several cell types, including trophoblasts, mediates the acute-phase response and promotes endothelial activation [15]. C-reactive protein (CRP), an acute-phase protein synthesized by the liver, is a nonspecific marker of inflammation that may reflect systemic inflammation. This inflammatory condition contributes to widespread endothelial dysfunction throughout the maternal vasculature [14].
The process of labor and delivery induces significant physiological changes that influence circulating biomarker levels through mechanisms such as placental separation, tissue injury, and acute inflammation. Neuroendocrine markers are not well characterized during the peripartum period. Although CgA and CST have been examined in pregnancy complications data on their peripartum kinetics remain limited. Angiogenic markers change rapidly after delivery, with sFlt-1 decreasing sharply and PlGF declining more gradually [16]. Inflammatory markers also show notable fluctuations during the peripartum period. IL-6 levels increase substantially with the onset and progression of labor [17], and CRP levels exhibit an early postpartum spike that correlates with labor duration, the number of vaginal examinations, and intrapartum interventions [18].
This study investigates six biomarkers representing distinct pathophysiological pathways: neuroendocrine markers (CgA, CST), angiogenic factors (sFlt-1, PlGF), and inflammatory markers (IL-6, CRP), along with their potential interconnections and temporal patterns before and after delivery in GH. The primary aim of this study was to compare the peripartum kinetic shifts of the neuroendocrine markers CgA and CST between normotensive pregnant women and those with GH. Secondary and exploratory objectives included assessing peripartum changes in angiogenic and inflammatory biomarkers, analyzing relationships among biomarkers, and investigating the potential influence of fetal sex on these profiles. To our knowledge, this is the first study to characterize the immediate peripartum kinetics of neuroendocrine markers in GH.
The study was conducted at the Department of Gynecology and Obstetrics at Sestre
Milosrdnice University Hospital Center, Zagreb, Croatia, from January 2023 to
March 2025. The hospital’s Ethics Review Board (ERB) approved the study. Written
informed consent was obtained from all participants. The study included
multiparous women with singleton pregnancies undergoing vaginal delivery.
Exclusion criteria included preexisting autoimmune, coronary, and renal diseases;
use of proton pump inhibitors; known fetal anomalies; and IUGR. To exclude Hemolysis, Elevated Liver enzymes, Low Platelets (HELLP)
syndrome, pregnancies with creatinine levels
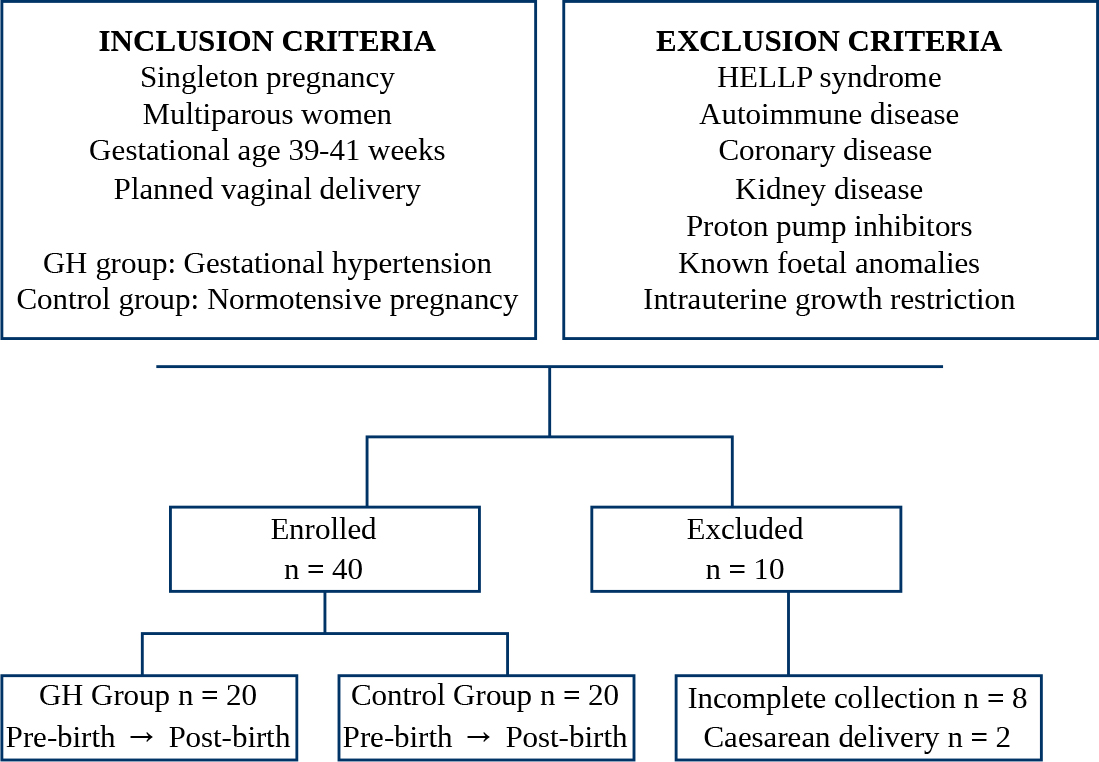
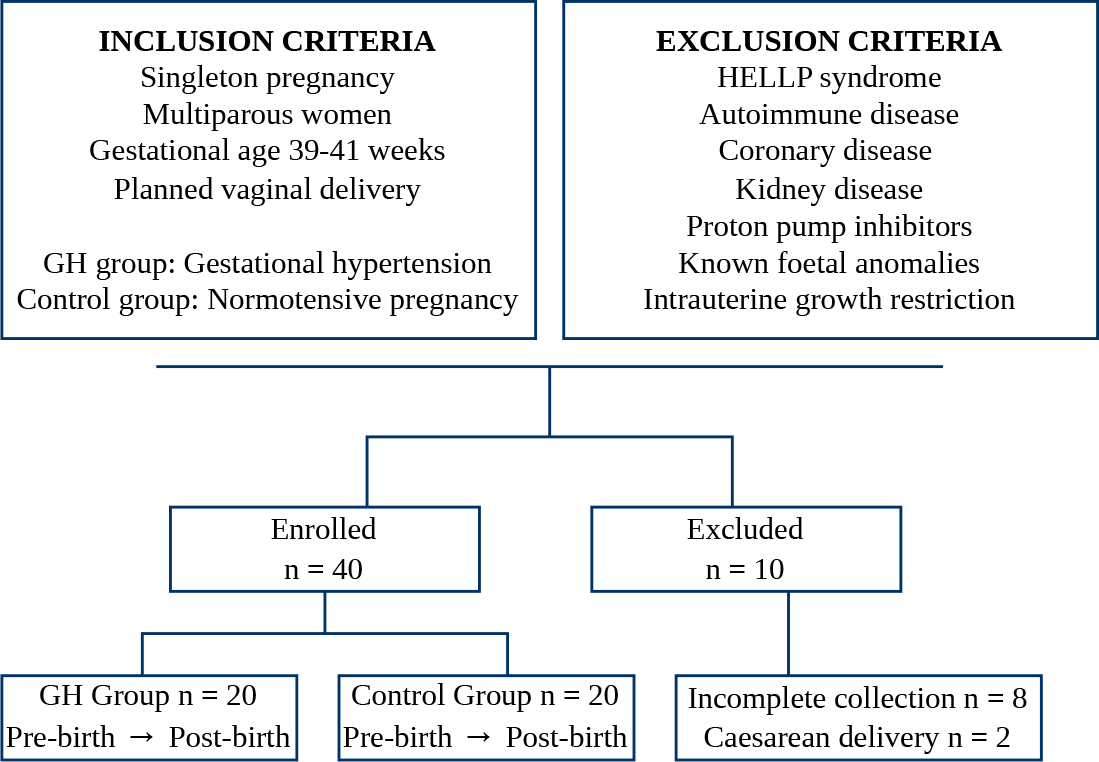 Fig. 1.
Study flowchart showing initial inclusion and exclusion criteria, the number of participants enrolled with peripartum sample collection, and the number of participants subsequently excluded. GH, gestational hypertension; HELLP, Hemolysis, Elevated Liver enzymes, Low Platelets.
Women were divided into either the GH group (n = 20) or the control group (n =
20). GH was defined according to the American College of Obstetricians and
Gynecologists criteria [1] as systolic blood pressure (sBP)
Maternal, pregnancy, and neonatal characteristics were recorded, including age, blood pressure, height, weight, gestational weight gain, smoking status, gestational age at delivery, birth weight and length, and the neonatal sex. Birth weight centiles were calculated according to Nicolaides et al. [19]. Body mass index (BMI) was calculated as body mass (kg) divided by the square of height (m2).
Blood samples were collected before labor (pre-birth) and 2 hours postpartum
after expulsion of the placenta (post-birth). Samples were obtained by
venipuncture into tubes containing a clot activator (7 mL Vacuette, Greiner
Bio-One GmbH, Kremsmünster, Austria). After clot formation, samples were
centrifuged at 2200
In all samples, concentrations of CgA, CST, sFlt-1, PlGF, IL-6, and CRP were
measured. CgA and CST concentrations were measured using enzyme-linked
immunosorbent assay (ELISA). The manufacturer of the CgA assay (cat. no. TM
E-9000, LDN Labor Diagnostika Nord GmbH & Co. KG, Nordhorn, Germany) reports a
measurement range of 2.3–900 ng/mL, with an intra-assay coefficient of variation
(CV)
Results were analyzed using MedCalc (v22.014, MedCalc Software Ltd., Ostend,
Belgium) and RStudio (v2025.09.02, Posit Software, PBC, Boston, MA, USA). Sample
size was determined based on peripartum CgA concentrations to achieve 80%
statistical power (
For baseline maternal and neonatal characteristics, as well as fetal sex
effects, differences between independent groups were assessed using the
Mann-Whitney U test, and categorical data were analyzed using Fisher’s exact
test. A p-value of 0.05 was considered statistically significant. To
evaluate peripartum biomarker dynamics, a unified rank-based longitudinal model
was applied using the Wald-type statistic to simultaneously assess the main
effects of group (control vs. GH) and time (pre-birth vs.
post-birth), as well as their interaction (Group
To determine correlations between CgA and CST and clinical and laboratory
variables, Spearman’s rank correlation test was used. Bonferroni correction was
applied separately for each neuroendocrine marker, with an adjusted significance
threshold of
The study included 20 pregnant women in the control group and 20 in the GH
group, all with full-term deliveries between 39 and 41 weeks of gestation.
Maternal and neonatal characteristics are summarized in Table 1. The GH group
demonstrated significantly higher sBP and dBP, as expected by the study design
(both p
| Control | GH | MD (95% CI) | p-value | ||
| Maternal characteristics | |||||
| Age (years) | 35 (30; 38) | 32 (30; 38) | –1 (–4; 3) | 0.786 | |
| BMI (kg/m2) | 27.1 (26.4; 28.2) | 32.0 (29.7; 37.4) | 4.9 (2.7; 8.5) | ||
| Weight gain (kg) | 13 (9; 17) | 12 (11; 14) | –1 (–4; 2) | 0.694 | |
| sBP (mmHg) | 110 (110; 120) | 143 (135; 157) | 30 (25; 40) | ||
| dBP (mmHg) | 70 (65; 80) | 88 (80; 90) | 15 (10; 20) | ||
| Smoking | 1 (5%) | 0 (0%) | – | 1.000 | |
| Neonatal characteristics | |||||
| Sex (male) | 11 (55%) | 12 (60%) | – | 1.000 | |
| Birth weight (g) | 3645 (3320; 3990) | 3375 (3210; 3835) | –190 (–460; 80) | 0.164 | |
| Birth length (cm) | 51 (50; 52) | 50 (49; 52) | –1 (–2; 1) | 0.352 | |
| Birth weight (centile) | 69 (48; 88) | 72 (52; 92) | 2 (–15; 18) | 0.655 | |
The values presented as median (Q1; Q3) were tested using the Mann-Whitney U test, and the values presented as frequency (percentage) were tested using Fisher’s exact test. Effect size is expressed as the Hodges-Lehmann MD for continuous variables with 95% CI. Effect size is not applicable for categorical variables. n = 20 per group. CI, confidence interval; BMI, body mass index; sBP, systolic blood pressure; dBP, diastolic blood pressure; MD, median difference.
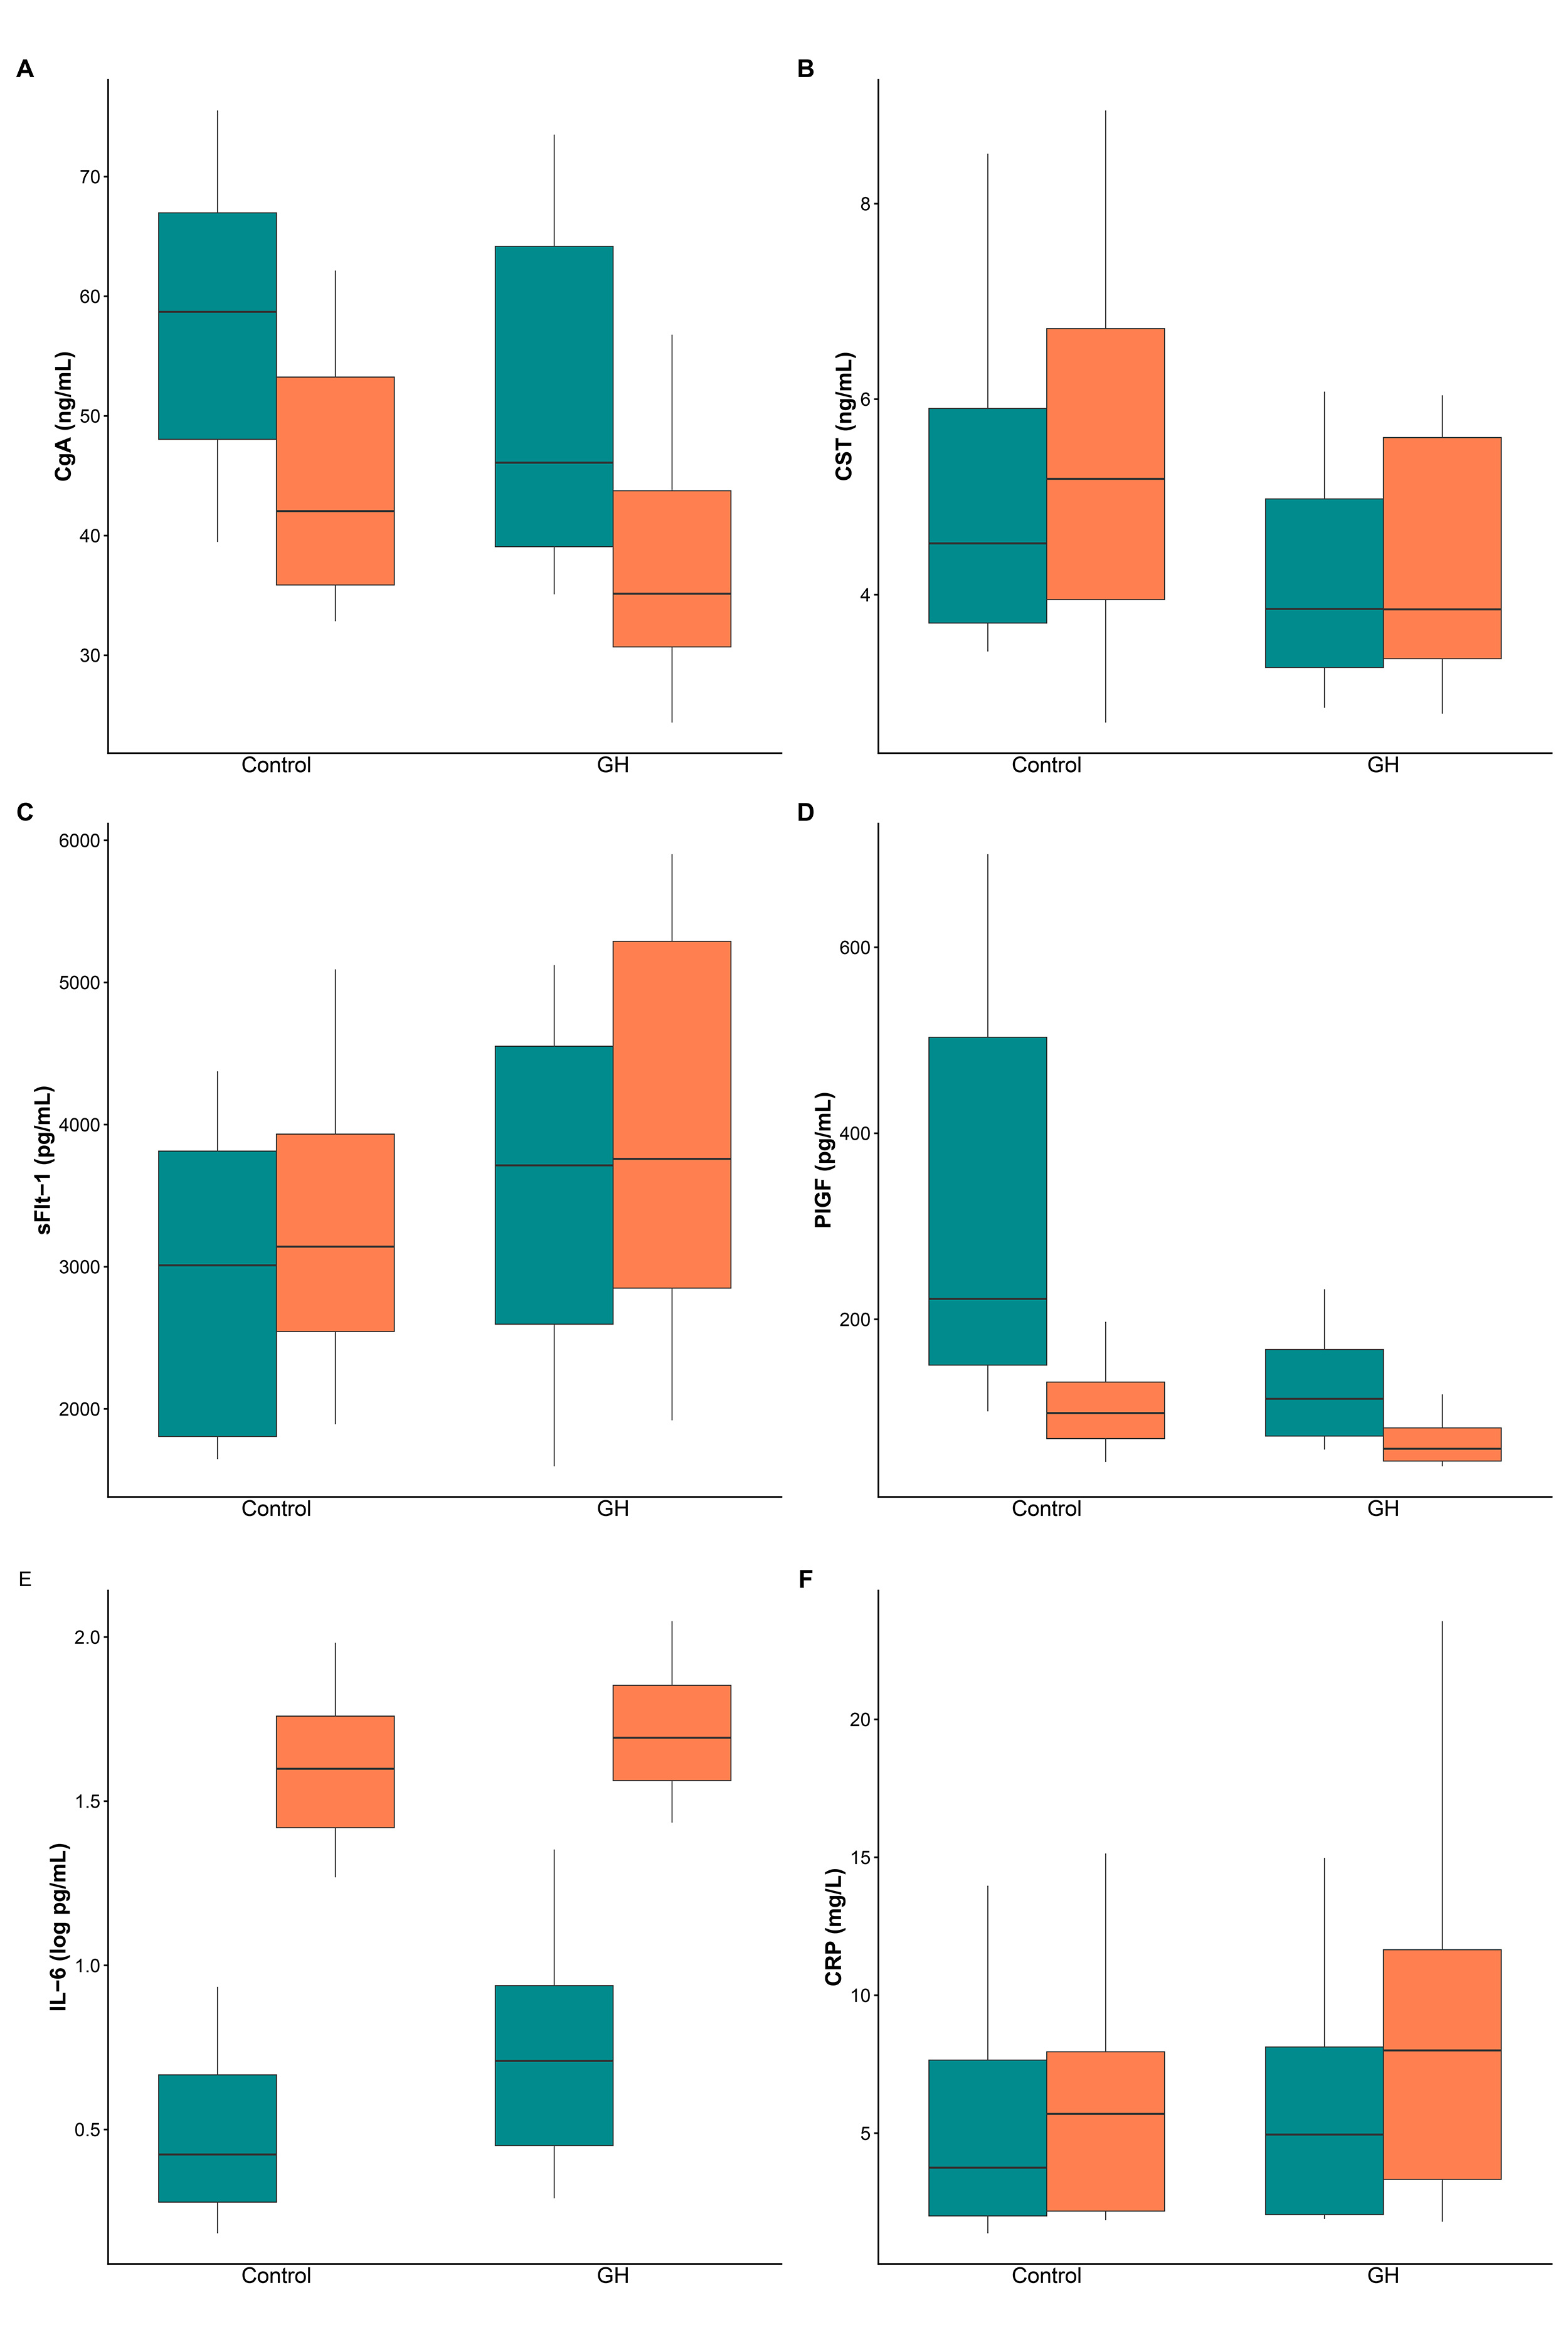
Fig. 2 presents box plots for CgA (A), CST (B), sFlt-1 (C), PlGF (D), IL-6 (E), and CRP (F) in the control and GH groups before and after birth. Table 2 presents medians with interquartile ranges for each biomarker at the pre- and post-birth time points for both groups, as well as the results for the main effects and time-by-group interaction. To evaluate peripartum changes in biomarkers, an integrated rank-based longitudinal model was employed to assess the main effects of group (p𝐺𝑟𝑜𝑢𝑝) and time (p𝑇𝑖𝑚𝑒), as well as their interaction (p𝐺𝑟𝑜𝑢𝑝×𝑇𝑖𝑚𝑒), using Wald-type statistics. The interaction effect size is expressed as the Hodges-Lehmann MD in peripartum changes between the GH and control groups, with 95% CIs.
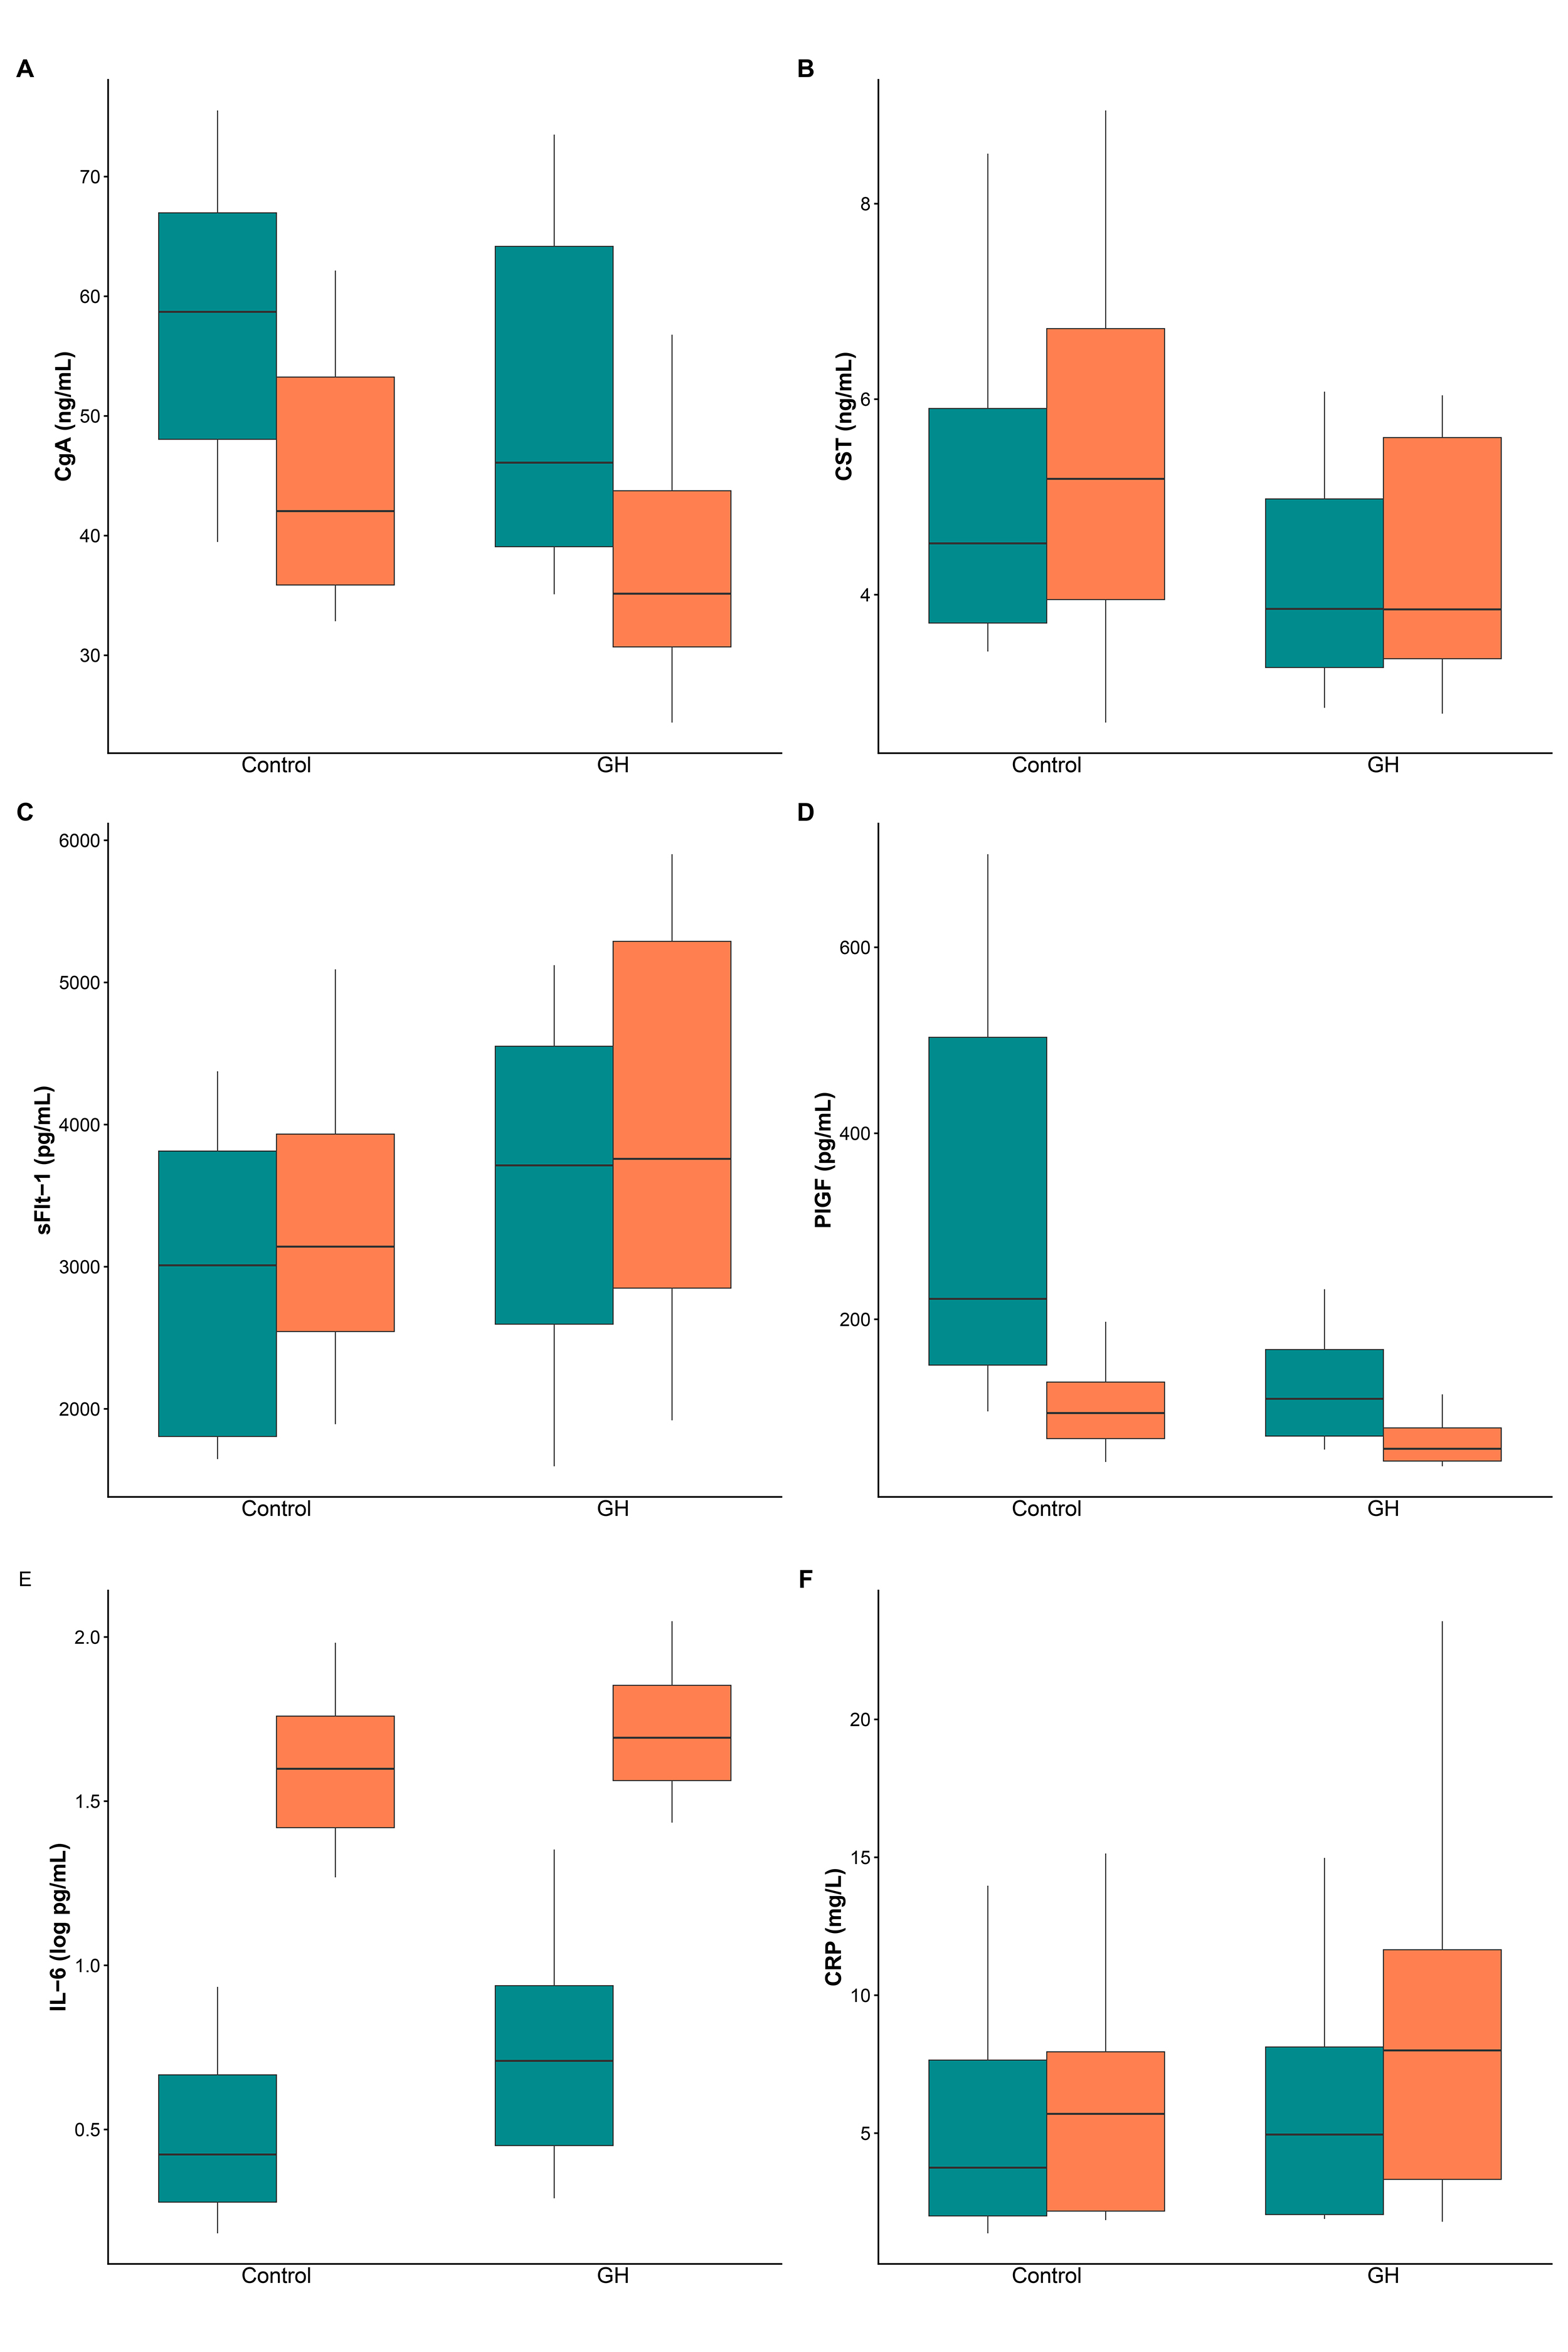 Fig. 2.
Biomarker levels before and after birth in control and GH groups. Box plots display the median (central line), the interquartile range (box), and whiskers that extend to the 10th and 90th percentiles. (A) CgA. (B) CST. (C) sFlt-1. (D) PlGF. (E) IL-6 (log scale). (F) CRP. Pre-birth results are shown in green, while post-birth samples are in orange. n = 20 per group. CgA, chromogranin A; CST, catestatin; sFlt-1, soluble fms-like tyrosine kinase-1; PlGF, placental growth factor; IL-6, interleukin-6; CRP, C-reactive protein.
| Control | GH | Main effect | Interaction | |||||
| Pre-birth | Post-birth | Pre-birth | Post-birth | p𝐺𝑟𝑜𝑢𝑝 | p𝑇𝑖𝑚𝑒 | p𝐺𝑟𝑜𝑢𝑝×𝑇𝑖𝑚𝑒 | MD (95% CI) | |
| CgA (ng/mL) | 58.7 (47.0; 67.8) | 42.1 (35.8; 53.4) | 46.1 (40.0; 65.1) | 35.2 (30.5; 45.5) | 0.072 | 0.7181 | 2.3 (–5.4; 7.8) | |
| CST (ng/mL) | 4.5 (3.7; 6.1) | 5.2 (3.9; 6.7) | 3.9 (3.2; 5.1) | 3.9 (3.3; 5.7) | 0.088 | 0.560 | 0.8151 | –0.2 (–1.3; 0.8) |
| sFlt-1 (pg/mL) | 3010 (1804; 3840) | 3142 (2450; 4101) | 3713 (2412; 4565) | 3758 (2675; 5381) | 0.106 | 0.077 | 0.672 | –139 (–755; 402) |
| PlGF (pg/mL) | 222 (146; 507) | 99 (70; 136) | 115 (73; 171) | 61 (48; 85) | 0.002 | 0.312 | 78 (30; 220) | |
| IL-6 (pg/mL) | 2.6 (1.9; 5.3) | 39.7 (24.4; 57.6) | 5.1 (2.8; 8.8) | 49.4 (36.0; 72.6) | 0.091 | 0.456 | 6.9 (–9.1; 21.2) | |
| CRP (mg/L) | 3.8 (2.0; 8.4) | 5.7 (2.2; 8.5) | 5.0 (2.0; 8.2) | 8.0 (3.0; 11.7) | 0.330 | 0.257 | 0.7 (–0.8; 2.8) | |
Data for pre- and post-birth groups are presented as median (Q1; Q3).
p-values for main effects (Group and Time) and the interaction (Group
For the primary neuroendocrine endpoints, CgA and CST, trends toward lower
concentrations in the GH group were observed (CgA pGroup = 0.072;
CST p𝐺𝑟𝑜𝑢𝑝 = 0.088), but these did not reach statistical
significance. A significant main effect of group was identified for PlGF
(p𝐺𝑟𝑜𝑢𝑝 = 0.002), with markedly lower concentrations in the GH
group at both pre- and post-birth time points compared with controls. A highly
significant main effect of time was observed for most biomarkers
(p𝑇𝑖𝑚𝑒
No significant interaction effects (p𝐺𝑟𝑜𝑢𝑝×𝑇𝑖𝑚𝑒) were detected for any of the analyzed biomarkers, indicating that peripartum changes were similar between the control and GH groups. For PlGF, although the interaction was not statistically significant (p𝐺𝑟𝑜𝑢𝑝×𝑇𝑖𝑚𝑒 = 0.312), the GH group showed a greater peripartum decline than controls (MD: 78 pg/mL; 95% CI: 30 to 220).
Due to multiple comparisons, Bonferroni correction was applied, with an adjusted
significance threshold of p
Additionally, pre-birth neuroendocrine markers were tested in relation to sBP and dBP. In the control group, CST was positively correlated with both sBP (rs = 0.536, 95% CI: 0.122 to 0.791; p = 0.015) and dBP (rs = 0.470, 95% CI: 0.035 to 0.756; p = 0.036). However, these associations did not remain statistically significant after Bonferroni corrections for multiple comparisons. No other correlations were found in the GH group, nor for CgA in either group.
As some studies suggest that fetal sex may influence concentrations, we analyzed
potential sex-related variations within each group in pre-birth samples.
Sex-stratified analyses were conducted using Mann-Whitney U tests within each
group, and the results are presented in Table 3, together with
Hodges-Lehmann MDs and 95% CIs. In the control group, IL-6 concentrations were
significantly lower in women carrying female fetuses (MD: –1.2 pg/mL; 95% CI:
–4.96 to –0.02; p = 0.037), whereas PlGF concentrations showed a trend
toward higher levels in the female subgroup (MD: 246 pg/mL; 95% CI: –9 to 542;
p = 0.067). In the GH group, PlGF concentrations were significantly
lower in cases with female fetuses (MD: –63 pg/mL; 95% CI: –112 to –11;
p = 0.039). Furthermore, trends toward lower neuroendocrine marker
concentrations in female fetuses were observed within the GH group for CgA (MD:
–11.6 ng/mL; 95% CI: –25.3 to 0.5; p = 0.054) and CST (MD: –1.0
ng/mL; 95% CI: –2.7 to 0.2; p = 0.083). No other sex-related
differences were observed for the remaining biomarkers in either the control or
GH groups. Given the limited sample size of these subgroups and the exploratory
nature of this analysis, these findings are reported at the nominal significance
level (p
| Control | GH | |||||||
| Male | Female | MD (95% CI) | p-values | Male | Female | MD (95% CI) | p-values | |
| CgA (ng/mL) | 55.0 (40.9; 65.7) | 59.1 (55.1; 69.9) | 5.1 (–14.6; 19.9) | 0.370 | 51.7 (44.9; 65.1) | 38.8 (34.3; 56.5) | –11.6 (–25.3; 0.5) | 0.054 |
| CST (ng/mL) | 4.5 (3.8; 5.6) | 4.6 (3.5; 7.6) | 0.6 (–1.1; 3.1) | 0.648 | 4.0 (3.7; 5.8) | 3.3 (2.6; 4.6) | –1.0 (–2.7; 0.2) | 0.083 |
| sFlt-1 (pg/mL) | 3038 (2329; 3897) | 2458 (1673; 3227) | –691 (–1545; 470) | 0.261 | 3345 (1763; 4763) | 3891 (3316; 4514) | 658 (–840; 2224) | 0.427 |
| PlGF (pg/mL) | 185 (127; 289) | 500 (218; 751) | 246 (–9; 542) | 0.067 | 153 (106; 180) | 73 (65; 113) | –63 (–112; –11) | 0.039 |
| IL-6 (pg/mL) | 3.6 (2.1; 7.2) | 1.9 (1.5; 2.6) | –1.24 (–4.96; –0.02) | 0.037 | 4.5 (2.3; 7.3) | 7.7 (3; 16) | 2.6 (–1.7; 11.4) | 0.231 |
| CRP (mg/L) | 4.0 (2.3; 12.0) | 2.1 (1.6; 6.7) | –1.8 (–6.5; 1.5) | 0.223 | 3.7 (2.0; 7.6) | 7.9 (3.1; 8.7) | –1.1 (–3.8; 6.0) | 0.354 |
Data presented as median (Q1; Q3). p-values were derived using the Mann-Whitney and were not adjusted for multiple comparisons (exploratory analysis). Effect size is expressed as the Hodges-Lehmann MD with 95% CI. Control group (male: n = 11, female: n = 9); GH group (male: n = 12, female: n = 8).
This study offers insights into the interrelationships among biomarkers across various pathophysiological pathways in GH. Our analysis of six biomarkers representing neuroendocrine, angiogenic, and inflammatory pathways demonstrated distinct patterns of expression and regulation in GH pregnancies compared with normotensive pregnancies, both before and after delivery. The current findings align with existing literature in some areas while also providing new information, especially regarding neuroendocrine markers and their relationships with other biomarker systems. To our knowledge, this is the first study to characterize immediate peripartum changes of neuroendocrine markers (CgA and CST) in GH, as well as to examine their potential interactions with angiogenic and inflammatory factors. While previous research has documented altered CgA and CST concentrations in preeclampsia [10, 21, 22], the acute peripartum changes of these markers in GH, and their relationship with angiogenic dysregulation, have not yet been investigated.
The similar decrease in CgA observed in both groups suggests that this decline reflects universal physiological changes during delivery. As the placenta is a major contributor to CgA production, a sharp decline in CgA following placental expulsion likely reflects the removal of this primary source [22]. The consistent magnitude of decline in both groups suggests that placental CgA production is not differentially affected by GH, despite other aspects of placental dysfunction. The literature on peripartum CgA kinetics in hypertensive disorders remains limited, making direct comparisons challenging.
Recent literature has begun to establish the relevance of CST in preeclampsia, with some studies reporting reduced [21, 23] and others reporting increased concentrations [24]. Our finding of unchanged CST in GH, with no significant interaction between group and time, does not clarify these discrepancies. However, CST concentrations may differ across hypertensive phenotypes, potentially reflecting disease severity or the timing of sample collection. The lack of significant CST changes during birth in either group suggests that CST concentrations are relatively stable across the peripartum transition, at least within the 2-hour timeframe examined. Current literature provides insufficient data on CST half-life and clearance mechanisms; therefore, the similar postpartum concentrations observed may reflect insufficient time for clearance to reach non-pregnant values.
In summary, the absence of significant differences in CgA and CST between the control and GH groups at either time point suggests that these markers are not specific for distinguishing GH from normal pregnancy in our cohort.
The absence of elevated sFlt-1 in GH aligns with established literature indicating that this disorder represents a milder placental dysfunction compared with preeclampsia [25, 26]. Severe preeclampsia is characterized by marked elevations in sFlt-1 and markedly elevated sFlt-1/PlGF ratios that predict adverse outcomes [27, 28], whereas GH typically shows minimal or absent sFlt-1 elevation [25, 26, 29, 30]. This distinction reflects fundamental differences in placental pathology between these conditions.
Our finding of significantly lower PlGF concentrations in the GH group at both time points supports PlGF as a marker of placental dysfunction in GH. This is consistent with extensive literature establishing PlGF as a key biomarker in hypertensive disorders of pregnancy [27]. Lower PlGF concentrations observed are consistent with studies across the spectrum of hypertensive pregnancy disorders, although the reductions are typically more pronounced in severe preeclampsia than in GH. These variations in biomarker concentrations likely indicate a generalized placental response that is not exclusive to a single hypertensive condition, aligning with the evidence that specific signaling pathways are fundamental for maintaining overall placental function and health throughout gestation [31].
Literature reports an sFlt-1 half-life of approximately 1.4 days, with
concentrations falling to less than 1% of pre-delivery values within the first
week, while PlGF has a longer half-life of approximately 3.7 days and stabilizes
at approximately 30% of pre-delivery values within the first week [16]. Our
sampling at 2 hours post-birth likely captures only the earliest phase of this
clearance. For sFlt-1, this timeframe may be too early to detect a significant
decline, as initial release from the separating placenta may maintain circulating
concentrations before clearance mechanisms predominate, resulting in no
significant difference in peripartum kinetics between groups. In contrast, our
measurements at the 2-hour time point captured the early decline in PlGF
concentrations, with substantially lower levels in the GH group. Although the
Group
In clinical practice, the sFlt-1/PlGF ratio is used as a diagnostic tool for short-term prediction of preeclampsia after 20 weeks of gestation [27, 28]. However, the present analysis focused on behavior of individual biomarkers during the peripartum period to characterize their specific kinetic patterns and responses to delivery without introducing additional analytical complexity.
The higher pre-birth IL-6 concentrations in the GH group suggest chronic low-grade inflammatory activation in GH, consistent with extensive literature linking proinflammatory cytokines to hypertensive pregnancy disorders [14]. Although the group effect did not reach statistical significance, the magnitude of baseline difference suggests that systemic inflammation is an intrinsic feature of the pathophysiology of GH, rather than simply a consequence of clinical complications or interventions. The pre-existing elevation of IL-6 may contribute to the hypertensive phenotype through IL-6-mediated endothelial activation and vascular dysfunction [14, 15].
The marked post-birth increase in IL-6 in both groups (approximately 10-fold) likely reflects the combined inflammatory stimuli of delivery, tissue injury, and placental separation [17, 32]. The absence of a between-group difference in the magnitude of this increase suggests that the labor and delivery process produces a stimulus that overrides baseline differences between groups, resulting in a parallel inflammatory response in both normotensive and GH pregnancies.
The non-significant differences in CRP between groups are consistent with the literature reporting heterogeneous CRP responses across hypertensive disorder phenotypes. Although CRP is often elevated in preeclampsia, variability across studies likely reflects differences in disease severity, timing, and cohort characteristics [14]. The modest post-delivery CRP increase aligns with the literature, which shows that CRP typically peaks at 24 hours postpartum [18]. Our 2-hour sampling precedes this peak, explaining the modest magnitude of change compared with IL-6. As a downstream acute-phase reactant produced in response to IL-6 stimulation, CRP response is delayed, and this pattern appears unaffected by GH during the immediate peripartum period.
The absence of a correlation between CgA and CST at any time point or across groups is a significant negative finding. Since CST is a cleavage product of CgA, a correlation between their concentrations might be expected. The lack of correlation suggests that CST levels are not solely determined by CgA availability but may instead depend on specific proteolytic processing, clearance rates, or tissue-specific regulation. Bralewska et al. [21] similarly reported no correlation between CgA and CST in both control and preeclamptic placentas.
The strong positive correlation between CgA and sFlt-1 in the control group, which was absent in the GH group, represents a novel and potentially important finding. CgA and its derived peptides are involved in cardiovascular homeostasis and have been linked to blood pressure regulation [7], whereas sFlt-1 modulates angiogenic balance and vascular permeability [27]. The positive correlation, which remained significant after Bonferroni correction for multiple comparisons, suggests that in normal pregnancy these systems may work together to maintain appropriate vascular adaptation and placental function. While CgA and sFlt-1 showed a positive association in the control group, the GH group exhibited a contrasting pattern, with lower CgA and higher sFlt-1 concentrations, although these differences did not reach statistical significance. As shared regulatory pathways between CgA and sFlt-1 remain unknown, this dissociation likely reflects a disruption of a previously synchronized physiological state rather than a direct influence of one marker on the other.
Although diminished CST concentrations have been linked to hypertension, data on the relationship between CST and blood pressure in pregnancy remain limited. Recent studies in nonpregnant populations have shown a negative correlation between CST and blood pressure [33, 34], consistent with CST’s vasodilatory properties and its proposed protective role against hypertension [35]. However, other studies report opposite findings, indicating a positive correlation between CST and blood pressure [24, 36, 37]. Our analysis identified positive correlations between CST and both sBP and dBP in the control group only, although these associations did not remain significant after Bonferroni correction for multiple comparisons. Further, larger studies are needed to clarify these inconsistencies in both the published literature and our findings.
Fetal sex may influence the concentrations of both CgA and CST in preeclamptic placental cells. CST protein concentrations were significantly lower, while CHGA gene expression was higher in preeclamptic pregnancies with female fetuses compared with controls [21]. In the general population, healthy female subjects typically exhibit higher CST concentrations than males, which may reflect enhanced CgA processing into CST. On the other hand, males generally have higher plasma CgA concentrations [35]. Our results showed a downward trend in both maternal CgA and CST concentrations in the GH group in pregnancies with female fetuses. However, data on sex-related differences in neuroendocrine markers remain limited.
Fetal sex also appears to influence concentrations of angiogenic markers. Male fetal sex has been associated with lower sFlt-1 concentrations [38]. In our study, no such differences were observed, consistent with Rahman et al. [39]. Women carrying male infants exhibit higher PlGF concentrations than those carrying female infants [39, 40]. Our results show sex-specific differences in PlGF, with a trend toward higher concentrations in pregnancies with female fetuses within the control group and significantly lower concentrations in the GH group. This opposing pattern suggests that fetal sex may differently modulate maternal angiogenic balance in normal versus pathological pregnancies.
Current evidence suggests that fetal sex influences the maternal immune response, although data remain inconsistent and limited [40, 41, 42]. One study indicates that pregnant women carrying a female fetus exhibit greater stimulated cytokine production throughout pregnancy [41], whereas another shows that carrying a male fetus is associated with higher concentrations of inflammatory cytokines during pregnancy, with these differences subsiding postpartum [40]. Our study shows a lower IL-6 concentration in pregnancies with female fetuses, albeit only in the control group. This difference was not maintained in the GH group, suggesting that the systemic inflammation characteristic of GH may override baseline sex-specific immune profiles.
However, given the small subgroup sizes and the exploratory nature of sex-stratified analyses, all findings related to fetal sex should be interpreted with caution. While these findings suggest potentially relevant maternal-fetal interactions, they should be considered preliminary. Larger studies are needed to confirm these patterns before drawing definitive conclusions about how fetal sex influences the biology of hypertensive disorders.
This mechanistic study was designed as a hypothesis-generating investigation to explore potential biomarker interactions in GH. Several limitations should be acknowledged when interpreting these findings. The sample size (n = 20 per group), while sufficient for the primary neuroendocrine endpoints, restricts the statistical power to detect subtle effects in secondary and exploratory analyses. Therefore, findings related to angiogenic and inflammatory markers, biomarker correlations, and sex-stratified analyses should be considered exploratory and hypothesis-generating rather than confirmatory. These observations regarding peripartum biomarker dynamics require external validation in larger, preferably multicenter, and adequately powered cohorts. The timing of postpartum sampling (2 hours after placental expulsion) captures acute peripartum changes but may not reflect longer-term recovery patterns.
This study demonstrates that the neuroendocrine marker CgA and inflammatory
markers (IL-6, CRP) showed consistent peripartum changes, whereas CST
concentrations remained stable, regardless of hypertensive status. Although no
significant Group
These findings highlight the potential importance of neuroendocrine pathways in the pathophysiology of hypertensive pregnancy disorders. Future research should integrate neuroendocrine regulation into comprehensive models of GH, alongside established angiogenic and inflammatory mechanisms.
The datasets used and analysed during the current study are available from the corresponding author upon reasonable request and have been publicly deposited in Zenodo (https://zenodo.org/records/18958924).
AB: Methodology, writing—original draft, writing—review & editing, visualisation; DB: Methodology, writing—original draft, writing—review & editing; ID: Writing—original draft, writing—review & editing, analysis; MČ: Writing—original draft, writing—review & editing, acquisition of data; SS: Writing—original draft, writing—review & editing, acquisition of data; MGR: Writing—original draft, writing—review & editing, analysis, supervision. All authors contributed to editorial changes in the manuscript. All authors read and approved the final manuscript. All authors have participated sufficiently in the work and agreed to be accountable for all aspects of the work.
The study was conducted in accordance with the Declaration of Helsinki. The research protocol was approved by the Ethics Committee of Sestre Milosrdnice University Hospital Center (Ethics Approval Number: 003-06/20-03/004), and all of the participants provided signed informed consent.
We would like to thank all the patients who participated in the study as everyone who contributes to making this work possible.
The study was carried out on equipment purchased through the grant KK.01.1.1.02-0014 of the European Regional Development Fund.
The authors declare no conflicts of interest.
During the preparation of this work the authors used Grammarly v 1.2 in order to check spell and grammar. After using this tool, the authors reviewed and edited the content as needed and takes full responsibility for the content of the publication.
Supplementary material associated with this article can be found, in the online version, at https://doi.org/10.31083/CEOG50841.
References
Publisher’s Note: IMR Press stays neutral with regard to jurisdictional claims in published maps and institutional affiliations.