


 , Mustafa Sengul 2
1 Department of Obstetrics and Gynecology, Izmir Atatürk Training and Research Hospital, 35140 Izmir, Turkey
2 Department of Obstetrics and Gynecology, Faculty of Medicine, Izmir Katip Celebi University, 35140 Izmir, Turkey
Abstract
Intrahepatic cholestasis of pregnancy (ICP) is a pregnancy-related liver disease that occurs during the third trimester. Both maternal and fetal complications are common in pregnant women with cholestasis. The risk and severity of complications increase with higher serum bile acid levels. 25-hydroxycholecalciferol [25(OH)D3], folate, and vitamin B12 supplementation during pregnancy improves maternal and fetal outcomes. This study aimed to evaluate the association between serum 25(OH)D3, folate, and vitamin B12 levels in pregnant women with and without ICP. Data from 29 pregnant women diagnosed with ICP and 85 healthy pregnant women admitted to Izmir Atatürk Training and Research Hospital were compared.
Izmir Atatürk Training and Research Hospital’s electronic data record system was reviewed retrospectively, and vitamin D, folate, and vitamin B12 levels, which are routinely screened during pregnancy, were determined for both groups.
Contrary to previous studies, no significant differences were found between the serum vitamin D, folate, or vitamin B12 levels between pregnant women with ICP and healthy pregnant women. These values, except for folate, were below the reference range in both groups.
Limited access to a healthy and balanced diet in our country, irregular use of vitamin supplements, and seasonal conditions may have influenced our results.
Keywords
- intrahepatic cholestasis of pregnancy
- folate
- bile acid
- pregnancy
Intrahepatic cholestasis of pregnancy (ICP) is the most common
pregnancy-associated liver disease, typically occurring in the third trimester
[1]. In pregnant women with cholestasis, quality of life decreases due to
symptoms such as pruritus, jaundice, and fat malabsorption. Although the maternal
prognosis is generally favorable, poorly managed ICP can lead to preterm labor,
meconium-stained amniotic fluid, and even fetal death [1, 2]. Elevated bile acid
(cholic acid and chenodeoxycholic acid) levels
Vitamin D deficiency during pregnancy may lead to adverse maternal and neonatal outcomes such as recurrent pregnancy loss, maternal infections, preeclampsia, gestational diabetes mellitus (GDM), preterm labor, and low birth weight [5]. Furthermore, maternal vitamin B12 deficiency during pregnancy or breastfeeding can cause neural tube defects (NTDs), developmental delay, failure to thrive, hypotonia, ataxia, and anemia [6, 7, 8].
A 2015 meta-analysis of randomized trials concluded that folic acid supplementation, when used alone or in combination with vitamins and minerals, had no clear effect on the frequency of congenital anomalies other than NTDs [9]. However, some anomalies, including cleft lip/palate, congenital heart defects, urinary tract anomalies, and congenital hydrocephalus, are considered folate-sensitive, based in part on the observation that the incidence of these conditions has decreased following the implementation of universal folic acid supplementation [10, 11]. Folic acid supplementation does not appear to reduce the risk of most adverse pregnancy and neonatal outcomes, except congenital anomalies. However, the available data are of low quality and are insufficient to exclude the possibility of a small, dose-related benefit [12].
This study aimed to evaluate the association between serum 25-hydroxycholecalciferol [25(OH)D3], folate, and vitamin B12 levels in pregnant women with and without ICP.
Data from pregnant women admitted for delivery to the Department of Obstetrics
and Gynecology at Izmir Katip Celebi University Ataturk Training and Research
Hospital between 2019 and 2023, who were diagnosed with ICP, as well as those
selected for the control group, were reviewed retrospectively hrough the
electronic data recording system and included in the study. Our hospital’s
electronic data record system was reviewed retrospectively, and vitamin D,
folate, and vitamin B12 levels, which are routinely screened upon hospital
admission for delivery, were determined for both groups. Serum 25(OH)D3, folate,
and vitamin B12 concentrations (ng/mL), measured by a chemiluminescent
immuno-enzymatic method, were analyzed using the Beckman Coulter DxI 800 (Beckman
Coulter, Inc., Brea, CA, USA) device. The reference ranges for analytes measured
in our hospital laboratory are as follows: 20–70 ng/mL for 25(OH)D3,
Serum bile acid levels have been categorized as follows:
Prior to the study, ethical approval was obtained from the Non-Interventional Clinical Research Ethics Committee of Izmir Katip Celebi University on March 21, 2024 Approval No. 0110).
Data were analyzed using the Statistical Package for the Social Sciences
(IBM® SPSS Statistics for Windows, Version 23.0, Armonk, NY, USA)
software package. Descriptive statistics were used, and quantitative variables
were characterized using median (interquartile range [IQR]), and qualitative
variables were expressed as percentages. Pearson’s chi-square test was used for
comparative analysis of qualitative variables; however, when the sample size was
small (
Spearman correlation analysis was performed to examine the individual
correlations between bile acids and vitamin D3, folate, and vitamin B12, and the
correlation coefficient (rho) was calculated. The reference ranges for analytes
measured in our hospital laboratory are as follows: 20–70 ng/mL for 25(OH)D3,
A p-value of
The mean age of the 114 pregnant women included in the study was 29.5 years (min = 18 years, max = 42 years, median = 30 years). The mean body mass index (BMI) was 26.4 kg/m2 (min = 16.4 kg/m2, max = 43.1 kg/m2, median = 25.8 kg/m2). ICP was not detected in 85 participants (control group) but was present in 29 (case group). Among thosewith ICP, 20 had moderate cholestasis and nine had severe disease.
The comparison of the control group and the case group in terms of demographic and clinical characteristics is presented in Table 1. No significant differences were observed between the two groups in terms of age (p = 0.477), gravida (p = 0.874), parity (p = 0.962), comorbidity status (p = 0.901), history of previous cesarean section (p = 0.238), or BMI (p = 0.180).
| Control group (n = 85) | Case group (n = 29) | p-value | ||
| Age (years), median (IQR) | 30 (9) | 33 (10) | 0.477 | |
| Gravida, n, median (IQR) | 2 (2) | 2 (1) | 0.874 | |
| Parity, n, median (IQR) | 1 (2) | 1 (2) | 0.962 | |
| Additional diseases, n (%) | 0.901 | |||
| None | 75 (88.2) | 25 (86.2) | ||
| GDM | 6 (7.1) | 2 (6.9) | ||
| HT | 4 (4.7) | 2 (6.9) | ||
| C/S, n (%) | 42 (49.4) | 18 (62.1) | 0.238 | |
| BMI (kg/m2), median (IQR) | 25.7 (3.4) | 27.2 (3.4) | 0.180 | |
IQR, interquartile range; n, number; GDM, gestational diabetes mellitus; HT, hypertension; C/S, cesarean section; BMI, body mass index.
The comparison of the two groups with respect to routine blood tests is shown in
Table 2. AST, ALT, lactate dehydrogenase (LDH), and bile acid levels were
statistically higher in the case group compared to the control group (p
| Control group (n = 85) | Case group (n = 29) | p-value | |
| AST (U/L), median (IQR) | 17 (8) | 40 (74) | |
| ALT (U/L), median (IQR) | 12 (9) | 32 (69) | |
| GGT (U/L), median (IQR) | 24 (48) | 42 (31.2) | 0.547 |
| LDH (U/L), median (IQR) | 112 (53) | 153 (60) | 0.003 |
| Bile acid (µmol/L), median (IQR) | 5.8 (1.5) | 17.0 (29.0) | |
| Total bilirubin (mg/dL), median (IQR) | 0.37 (0.24) | 0.41 (0.27) | 0.827 |
| Direct bilirubin (mg/dL), median (IQR) | 0.10 (0.12) | 0.12 (0.13) | 0.158 |
| Indirect bilirubin (mg/dL), median (IQR) | 0.28 (0.23) | 0.30 (0.26) | 0.889 |
| 25(OH)D3 (ng/mL), median (IQR) | 10.0 (10.5) | 11.0 (11.0) | 0.547 |
| Folate (ng/mL), median (IQR) | 9.0 (5.8) | 8.0 (5.8) | 0.747 |
| VitB12 (pg/mL), median (IQR) | 147 (104) | 153 (79) | 0.349 |
Bold p-values indicate statistical significance.
n, number; AST, aspartate transaminase; ALT, alanine transaminase; GGT, gamma glutamyl transaminase; LDH, lactate dehydrogenase; 25(OH)D3, 25-hydroxycholecalciferol; VitB12, vitamin B12.
A comparison of the two groups in terms of birth and neonatal outcomes is
presented in Table 3. No statistically significant differences were found between
the two groups in mode of delivery, birth weight, gender, and APGAR scores at 1
and 5 minutes. None of the neonates born to mothers without cholestasis required
admission to the neonatal intensive care unit (NICU), whereas 17.2% (n = 5) of
those born to mothers with cholestasis required NICU admission, this difference
being statistically significant (p
| Control group (n = 85) | Case group (n = 29) | p-value | ||
| Type of delivery, n (%) | 0.220 | |||
| SVD | 21 (24.7) | 4 (13.8) | ||
| C/S | 64 (75.3) | 25 (86.2) | ||
| Birth weight (g), median (IQR) | 3235 (420) | 3080 (845) | 0.149 | |
| Sex of newborn, n (%) | 0.314 | |||
| Female | 53 (62.4) | 15 (51.7) | ||
| Male | 32 (37.6) | 14 (48.3) | ||
| APGAR 1 m, median (IQR) | 9 (1) | 9 (1) | 0.723 | |
| APGAR 5 m, median (IQR) | 10 (1) | 10 (1) | 0.900 | |
| NICU, n (%) | 0 (0) | 5 (17.2) | ||
| IUGR, n (%) | 2 (2.4) | 5 (17.2) | 0.004 | |
Bold p-values indicate statistical significance.
SVD, spontaneous vaginal delivery; NICU, neonatal intensive care unit; IUGR, intrauterine growth restriction.
No correlation was observed between bile acid and vitamin D3 (Fig. 1), bile acid and folate (Fig. 2), or bile acid and vitamin B12 (Fig. 3).
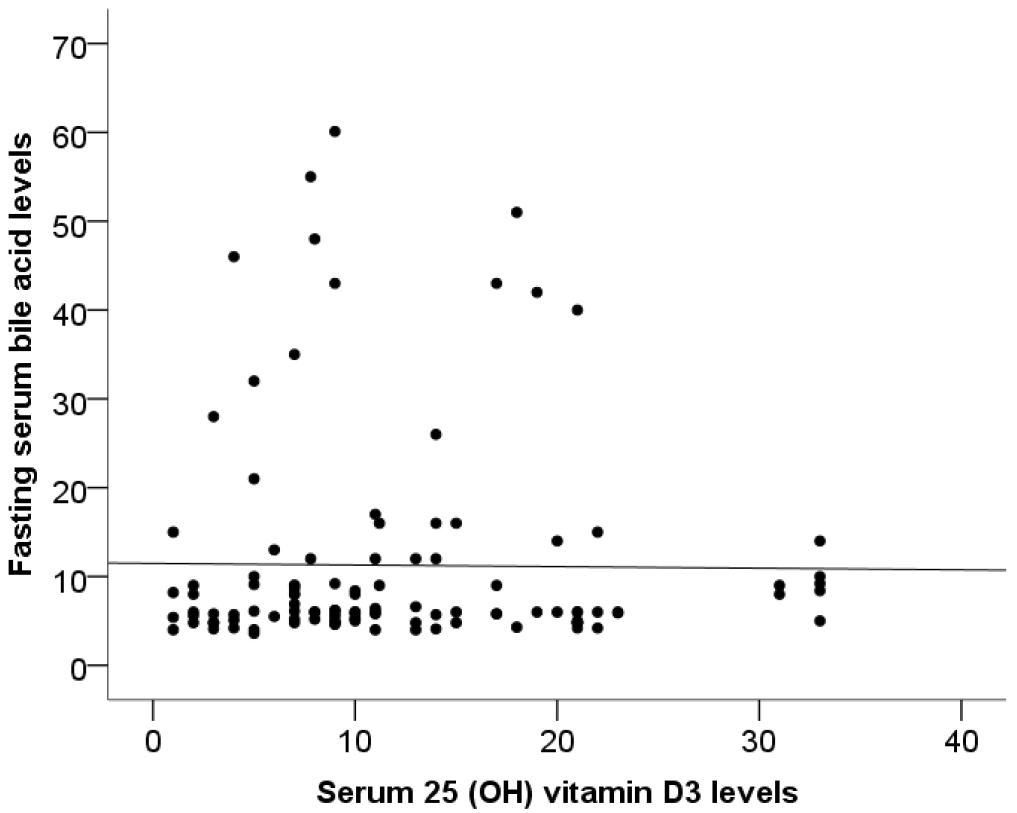 Fig. 1.
Correlation between bile acid and vitamin D3 (rho = 0.058, p = 0.543).
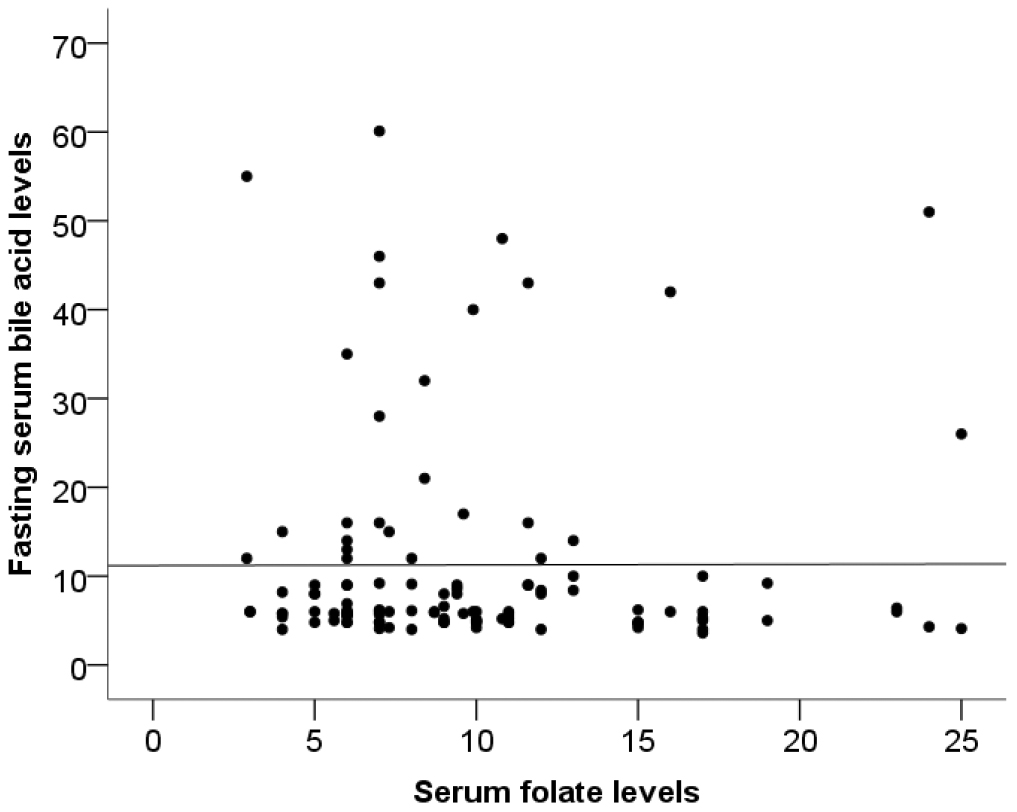 Fig. 2.
Correlation between bile acid and folate (rho = –0.116, p = 0.218).
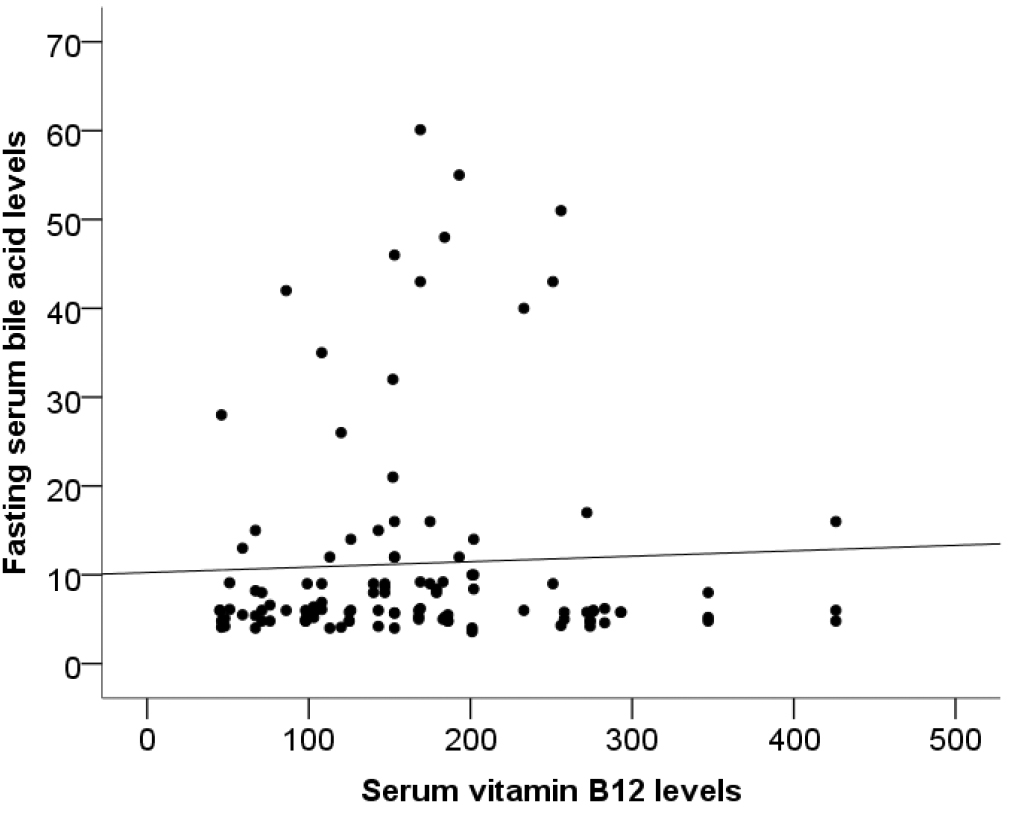 Fig. 3.
Correlation between bile acid and vitamin B12 (rho = 0.039, p = 0.681).
A comparison of the demographic and clinical characteristics of pregnant women with moderate cholestasis (n = 20) and those with severe cholestasis is shown in Table 4. No significant differences were found between these two groups for age (p = 1.000), gravida (p = 0.945), parity (p = 0.908), comorbidity (p = 0.536), history of previous cesarean section (p = 0.412), or BMI (p = 0.799).
| Moderate cholestasis (n = 20) | Severe cholestasis (n = 9) | p-value | ||
| Age (years), median (IQR) | 32.5 (15) | 33 (8) | 1.000 | |
| Gravida (n), median (IQR) | 2 (1) | 2 (2) | 0.945 | |
| Parity (n), median (IQR) | 1 (2) | 1 (2) | 0.908 | |
| Additional diseases, n (%) | 0.536 | |||
| None | 17 (85.0) | 8 (88.9) | ||
| GDM | 1 (5.0) | 1 (11.1) | ||
| HT | 2 (10.0) | 0 (0) | ||
| C/S, n (%) | 11 (55.0) | 7 (77.8) | 0.412 | |
| BMI (kg/m2), median (IQR) | 27.3 (3.7) | 26.4 (4.5) | 0.799 | |
HT, hypertension; BMI, body mass index.
The comparison of these two subgroups of pregnant women with cholestasis in
terms of routine blood tests is shown in Table 5. AST, ALT, and bile acid levels
were significantly higher in those with severe cholestasis than in those with
moderate cholestasis (p = 0.002, p = 0.04 and p
| Moderate cholestasis (n = 20) | Severe cholestasis (n = 9) | p-value | |
| AST (U/L), median (IQR) | 25.5 (34) | 107.0 (71) | 0.002 |
| ALT (U/L), median (IQR) | 20 (41) | 72 (81) | 0.040 |
| GGT (U/L), median (IQR) | 33 (39.8) | 42 (28.5) | 0.295 |
| LDH (U/L), median (IQR) | 136 (94) | 154 (24) | 0.562 |
| Bile acid (µmol/L), median (IQR) | 15 (8) | 46 (10.5) | |
| Total bilirubin (mg/dL), median (IQR) | 0.37 (0.26) | 0.45 (0.54) | 0.070 |
| Direct bilirubin (mg/dL), median (IQR) | 0.12 (0.13) | 0.12 (0.07) | 0.835 |
| Indirect bilirubin (mg/dL), median (IQR) | 0.24 (0.27) | 0.33 (0.34) | 0.070 |
| 25(OH)D3 (ng/mL), median (IQR) | 11.1 (9.5) | 12.5 (10.6) | 0.694 |
| Folate (ng/mL), median (IQR) | 7.6 (5.9) | 9.9 (6.8) | 0.532 |
| VitB12 (pg/mL), median (IQR) | 152.5 (84) | 184 (81) | 0.127 |
Bold p-values indicate statistical significance. Italicized p-values indicate a trend toward statistical significance.
The comparison of cholestasis subgroups with respect to birth and neonatal outcomes is presented in Table 6. No significant differences were found between the two groups in terms of mode of delivery, birth weight, gender, or APGAR scores at 1 and 5 minutes. The proportion of neonates requiring NICU admission was higher in the severe cholestasis than in the moderate group (22.2% vs. 15%), but this difference was not statistically significant (p = 0.633). The proportion of neonates diagnosed with IUGR was also higher in the severe cholestasis group than in the moderate cholestasis group (22.2% vs. 15%), without statistical significance (p = 0.633).
| Moderate cholestasis (n = 20) | Severe cholestasis (n = 9) | p-value | ||
| Type of delivery, n (%) | 1.000 | |||
| SVD | 3 (15.0) | 1 (11.1) | ||
| C/S | 17 (85.0) | 8 (88.9) | ||
| Birth weight (g), median (IQR) | 3200 (909) | 2920 (585) | 0.317 | |
| Sex of newborn, n (%) | 0.245 | |||
| Female | 12 (60.0) | 3 (33.3) | ||
| Male | 8 (40.0) | 6 (66.7) | ||
| APGAR 1 m, median (IQR) | 9 (1) | 9 (1) | 0.594 | |
| APGAR 5 m, median (IQR) | 10 (1) | 10 (1) | 0.594 | |
| NICU, n (%) | 3 (15.0) | 2 (22.2) | 0.633 | |
| IUGR, n (%) | 3 (15.0) | 2 (22.2) | 0.633 | |
Serum 25(OH)D3 levels below 20 ng/mL (50 nmol/L) are defined as vitamin D deficiency, whereas levels between 21–29 ng/mL (52.5–72.5 nmol/L) are defined as vitamin D insufficiency [13]. Although there is no consensus on the optimal serum 25(OH)D3 level, it is generally accepted that levels of at least 20 ng/mL are sufficient for bone health healthy individuals [14]. In a study conducted in healthy pregnant women in Turkey, the mean serum 25(OH)D3 level was 11.5 ng/mL, which falls within the range of vitamin D deficiency [15]. Even after supplementation with either a single dose (200,000 IU) or a daily dose (800 IU) of vitamin D, only a small proportion of women achieved satisfactory levels [16]. Since our study was conducted on a socioeconomically middle-class population, malnutrition was considered a possible factor. In accordance with the guidelines of the Ministry of Health of the Republic of Turkey, each pregnant woman received supplementation starting in the second trimester: 1200 IU/day of vitamin D, 400 microgram/day folate, and 4 microgram/day vitamin B12.
Recent studies highlight significant associations between vitamin D deficiency in pregnant women and serious pregnancy complications, such as preeclampsia and GDM [17]. In our study, we investigated the relationship between vitamin D levels and ICP.
In a study of 33 pregnant women, Wikström Shemer and Marschall [18] observed lower 25(OH)D3 levels in women with ICP compared with healthy pregnant women. Kuoppala et al. [19] reported a decrease in 25(OH)D3 levels during the third trimester in healthy pregnant women, with even lower levels in those with ICP. In another study from Turkey, a total of 80 pregnant women were examined and 25(OH)D3 levels were also lower in pregnant women with ICP [20]. In our study, 25(OH)D3 levels were low in all pregnant women and no significant difference was found between those with ICP and healthy controls. Although adequate vitamin supplementation was provided, factors such as inadequate and imbalanced nutrition, poor adherence to supplementation, and seasonal variation may have affected our results. In addition to recent studies, Wolski et al. [21] in Poland reported that some mutations in vitamin D receptor genes play a role in hepatobiliary homeostasis and may be associated with ICP. The vitamin D receptor FokI polymorphism was significantly more frequent in women with ICP [21]. Folic acid and vitamin B12 are essential factors for fetal growth [22]. In a study of 11,549 women, Yuan et al. [23] suggested that low folic acid levels increased the risk of preeclampsia, ICP, GDM, and SGA. The same study also reported that low vitamin B12 levels were associated with preeclampsia but did not significantly increase ICP or SGA [23]. In our study, no significant differences were observed between serum folic acid and vitamin B12 levels between groups. As such, larger randomized controlled trials are warranted.
As reported in previous studies with a larger sample sizes, vitamin D supplementation in pregnant women may help prevent ICP formation. However, in our study, despite supplementation with vitamin D, folate, and vitamin B12, levels were lower in both groups compared with the general population. These findings highlight the extent of vitamin deficiency in the study population and are relevant from a public health perspective. Cavoretto and Viganò [24] also addressed the same issue, noting the high prevalence of vitamin D deficiency in the community and recommending that vitamin D supplementation be included in routine obstetric care. National guidelines are warranted.
Our study has several limitations, including the small sample size, its retrospective design, uncertainty regarding the exact season in which vitamin levels were measured, and the high prevalence of vitamin deficiencies in the study population. A major limitation of our study is the inability to accurately predict the season at the time of vitamin D measurement. Although standard-dose vitamin supplementation was prescribed for all pregnant women, adherence could not be confirmed. Further prospective studies with larger sample sizes are needed in this area.
Unlike previous studies, no significant differences were observed between ICP and serum 25(OH)D3, folate, and vitamin B12 levels. These values were also low in healthy pregnant women. Factors such as limited access to a healthy and balanced diet, as well as inadequate use of vitamin supplements may have contributed to these findings. The limited number of relevant studies in the literature restricted our assessment. Additional prospective studies on this topic are warranted.
The data that support the findings of this study are available from the corresponding author upon reasonable request.
YA designed and performed the research study. YA and MS analyzed the data. Both authors contributed to editorial changes in the manuscript. Both authors read and approved the final manuscript. Both authors have participated sufficiently in the work and agreed to be accountable for all aspects of the work.
Prior to the study, ethical approval was obtained from the Non-Interventional Clinical Research Ethics Committee of Izmir Katip Celebi University on 21.03.2024, with decision number 0110. The study was carried out in accordance with the guidelines of the Declaration of Helsinki. All participants in the study were required to sign an informed consent form.
Thanks to all the peer reviewers for their opinions and suggestions.
This research received no external funding.
The authors declare no conflicts of interest.
References
Publisher’s Note: IMR Press stays neutral with regard to jurisdictional claims in published maps and institutional affiliations.