

 , Liyun Gong 1, Yanfang Li 1, Wenyang Huang 1, Jing Zhao 1, Zhuo Ren 1, Xin Huang 1, Junli Lu 1,*
1 Department of Obstetrics and Gynecology, Beijing Chao-Yang Hospital, Capital Medical University, 100020 Beijing, China
Abstract
Chorioamnionitis is a significant contributor to adverse maternal and neonatal outcomes in pregnant women with preterm premature rupture of membranes (PPROM). This study explored the predictive value of several blood-derived inflammatory indices for histologic chorioamnionitis (HCA) in PPROM.
Pregnant women with PPROM admitted between July 2017 and July 2025 were retrospectively included. According to postpartum placental pathology, patients were classified into an HCA group (n = 45) and a non-HCA group (n = 152). Clinical characteristics and laboratory indices were compared, including the neutrophil-to-lymphocyte ratio (NLR), platelet-to-lymphocyte ratio (PLR), lymphocyte-to-monocyte ratio (LMR), systemic immune-inflammation index (SII), systemic inflammation response index (SIRI), and neutrophil-to-platelet ratio (NPR). Receiver operating characteristic (ROC) curve analysis was used to evaluate diagnostic performance. Univariate and multivariable logistic regression analyses identified independent predictors of HCA.
Compared with the non-HCA group, the HCA group had an earlier gestational age at rupture (≤34 weeks: 51.11% vs. 19.08%, p < 0.001) and a higher incidence of low birth weight (<2.5 kg: 60.00% vs. 32.24%, p < 0.001). White blood cell count (WBC), neutrophil count, C-reactive protein (CRP), NLR, PLR, SII, and SIRI were significantly higher in the HCA group, whereas LMR was lower. Among all indices, SIRI showed the largest area under the ROC curve (AUC = 0.727) and remained independently associated with HCA after adjustment.
SIRI is a simple, noninvasive marker derived from routine blood counts and showed the best discriminatory performance for HCA among the tested indices. Its clinical utility should be validated in prospective, multicenter studies before being implementation in clinical decision-making.
Keywords
- preterm premature rupture of membranes
- histologic chorioamnionitis
- systemic immune-inflammation index
- systemic inflammation response index
- logistic regression
Preterm premature rupture of membranes (PPROM), defined as rupture of the fetal membranes before 37 weeks of gestation and prior to the onset of labor, is a serious obstetric complication that occurs in approximately 2%–3% of pregnancies [1]. It accounts for nearly one-third of preterm deliveries and contributes substantially to neonatal morbidity and mortality [2]. Intrauterine infection and inflammation, as well as dysbiosis of the perinatal microbiome, are important mechanistic pathways linking PPROM to preterm birth and adverse outcomes [3, 4].
Histological chorioamnionitis (HCA) is considered a key pathological condition associated with PPROM. It is characterized by neutrophil infiltration of the placental tissues and membranes, typically reflecting intrauterine infection [5]. The reported prevalence of HCA among women with PPROM ranges from 40% to 70%, and its presence is strongly associated with maternal and neonatal complications [6]. Nevertheless, the current gold standard for diagnosing HCA is placental histopathology performed after delivery. This approach is retrospective and invasive, making it unsuitable for real-time risk evaluation [7]. In addition, HCA often presents subclinically, without evident fever or leukocytosis, which contributes to diagnostic delays [8]. Noninvasive laboratory markers such as C-reactive protein (CRP) and white blood cell count (WBC) are commonly applied in clinical practice; however, their sensitivity and specificity, particularly in the early stages, remain limited [9]. Hence, identifying novel, noninvasive, and accessible biomarkers to predict HCA risk in PPROM is of great clinical importance.
Recently, inflammatory indices calculated from routine complete blood count (CBC) tests have gain attention due to their availability and low cost. Ratios such as neutrophil-to-lymphocyte ratio (NLR) and platelet-to-lymphocyte ratio (PLR) have been investigated and shown to be associated with HCA as well as other adverse pregnancy outcomes [10, 11, 12, 13, 14]. These indices are thought to reflect the imbalance between innate and adaptive immune responses under systemic stress [15]. However, the immune mechanisms underlying HCA are complex and involve multiple interacting, dysregulated immune cell populations. To better capture this systemic inflammatory milieu, composite indices such as the systemic immune-inflammation index (SII) and the systemic inflammation response index (SIRI) have been proposed. Emerging evidence suggests that these markers are useful for predicting complications such as gestational diabetes and preeclampsia [16, 17, 18], although their predictive role in PPROM complicated by HCA remains insufficiently characterized.
In light of these considerations, the present study was designed to systematically assess and compare several CBC-derived inflammatory indices, including NLR, PLR, SII, and SIRI, for their ability to predict HCA in women with PPROM and to explore potential dose–response relationships with HCA risk.
This retrospective study included all women admitted with a diagnosis of PPROM at our hospital between July 2017 and July 2025.
Inclusion criteria were as follows: (1) maternal age
Exclusion criteria were as follows: (1) hematological disorders or malignant tumors; (2) severe medical or surgical comorbidities, including autoimmune diseases (e.g., systemic lupus erythematosus), active infections (e.g., urinary tract infection, upper respiratory tract infection), and preeclampsia; (3) need for immediate termination of pregnancy due to other obstetric complications, such as placenta previa or placental abruption; and (4) massive missing clinical data.
This study was conducted in accordance with the principles of the Declaration of Helsinki. The protocol was reviewed and approved by the Institutional Ethics Committee of Beijing Chao-Yang Hospital, Capital Medical University (Approval No. 2025-Ke-865). Given the retrospective design of the study, all patient data were anonymized, and the requirement for written informed consent was waived by the ethics committee.
PPROM was diagnosed based on the presence of at least two of the following
criteria [1]: (1) spontaneous fluid leakage reported by the patient; (2)
visualization of fluid pooling in the posterior fornix on sterile speculum
examination; and (3) a positive nitrazine (pH) test indicating alkaline amniotic
fluid (typically pH
Postpartum placental pathology served as the reference standard for diagnosis. Placental, membrane, and umbilical cord specimens were evaluated independently by experienced pathologists blinded to clinical information. HCA was staged and graded according to the Redline criteria [19], which classify inflammation based on both the depth of neutrophil infiltration and the intensity of the inflammatory process: Stage 0, no inflammation; Stage I, confined to the decidua or subchorionic space; Stage II, extending to chorion and/or amnion; and Stage III, necrotizing chorioamnionitis indicating severe intrauterine infection. Grades reflect the intensity of the acute inflammatory response: Grade 1, mild-to-moderate acute inflammation; and Grade 2, severe acute inflammation. Sampling and reporting procedures followed the Amsterdam consensus on placental pathology [20] to ensure comparability. In line with previous studies [21, 22], Stage 0 and I were classified as non-HCA, and Stage II and III were classified as HCA.
Clinical data were extracted from the hospital’s electronic medical records, including:
Maternal characteristics: age, body mass index (BMI), gravidity, parity, and history of miscarriage.
Clinical features: gestational age at PPROM, latency period (time from rupture to delivery), and mode of delivery.
Neonatal outcomes: 1- and 5-minute Apgar scores, neonatal intensive care unit
(NICU) admission, and low birth weight (
Laboratory data: the most recent pre-delivery blood tests, including WBC, neutrophils, lymphocytes, monocytes, platelets, and CRP.
Inflammatory indices derived from CBC parameters were calculated as follows:
NLR = neutrophils / lymphocytes.
PLR = platelets / lymphocytes.
Lymphocyte-to-Monocyte Ratio (LMR) = lymphocytes / monocytes.
SII = (platelets
SIRI = (neutrophils
Neutrophil-to-Platelet Ratio (NPR) = neutrophils / platelets.
Normality of continuous variables was assessed. Normally distributed data are
presented as the mean
This study enrolled 197 patients with PPROM, including 45 (22.8%) classified in
the HCA group and 152 (77.2%) in the non-HCA group. The groups showed no
significant differences in age, BMI, primiparity, first pregnancy rate, or
history of miscarriage (all p
| Variables | Total (n = 197) | Non-HCA group (n = 152) | HCA group (n = 45) | Statistic | p-value | |
| Age, years (mean |
32.72 |
32.91 |
32.07 |
t = 1.31 | 0.193 | |
| BMI, kg/m2 (mean |
22.94 |
22.98 |
22.81 |
t = 0.28 | 0.781 | |
| First pregnancy, n (%) | 0.857 | |||||
| No | 29 (14.72) | 22 (14.47) | 7 (15.56) | |||
| Yes | 168 (85.28) | 130 (85.53) | 38 (84.44) | |||
| Primipara, n (%) | 0.939 | |||||
| No | 71 (36.04) | 55 (36.18) | 16 (35.56) | |||
| Yes | 126 (63.96) | 97 (63.82) | 29 (64.44) | |||
| History of miscarriage, n (%) | 0.760 | |||||
| No | 135 (68.53) | 105 (69.08) | 30 (66.67) | |||
| Yes | 62 (31.47) | 47 (30.92) | 15 (33.33) | |||
| Gestational age at rupture, n (%) | ||||||
| 52 (26.40) | 29 (19.08) | 23 (51.11) | ||||
| 145 (73.60) | 123 (80.92) | 22 (48.89) | ||||
| Rupture to delivery time |
||||||
| No | 143 (72.59) | 121 (79.61) | 22 (48.89) | |||
| Yes | 54 (27.41) | 31 (20.39) | 23 (51.11) | |||
| Mode of delivery, n (%) | 0.849 | |||||
| VD | 129 (65.48) | 99 (65.13) | 30 (66.67) | |||
| CS | 68 (34.52) | 53 (34.87) | 15 (33.33) | |||
| Apgar score (1 min) (mean |
9.69 |
9.74 |
9.51 |
t = 1.52 | 0.129 | |
| Apgar score (5 min) (mean |
9.90 |
9.93 |
9.80 |
t = 1.33 | 0.190 | |
| Transferred to NICU, n (%) | 0.454 | |||||
| No | 43 (21.83) | 35 (23.03) | 8 (17.78) | |||
| Yes | 154 (78.17) | 117 (76.97) | 37 (82.22) | |||
| Neonatal weight |
||||||
| No | 121 (61.42) | 103 (67.76) | 18 (40.00) | |||
| Yes | 76 (38.58) | 49 (32.24) | 27 (60.00) | |||
t: t-test,
As shown in Table 2, systemic inflammatory marker levels were significantly
higher in the HCA group than in the non-HCA group. The WBC count, absolute
neutrophil count, absolute monocyte count, and CRP levels were all elevated in
the HCA group (all p
| Variables | Total (n = 197) | Non-HCA group (n = 152) | HCA group (n = 45) | Statistic | p-value |
| WBC (109/L) | 10.74 |
10.12 |
12.84 |
t = –4.38 | |
| Neutrophils (109/L) | 7.69 (5.75, 10.59) | 7.28 (5.64, 9.41) | 10.37 (7.67, 13.44) | Z = –4.35 | |
| Lymphocytes (109/L) | 1.54 (1.28, 1.91) | 1.55 (1.32, 1.95) | 1.54 (1.09, 1.79) | Z = –1.49 | 0.136 |
| Monocytes (109/L) | 0.55 (0.41, 0.67) | 0.51 (0.39, 0.62) | 0.65 (0.53, 0.79) | Z = –3.69 | |
| Red blood cells (1012/L) | 3.82 |
3.82 |
3.79 |
t = 0.30 | 0.765 |
| HB (g/L) | 118.77 |
119.11 |
117.60 |
t = 0.78 | 0.433 |
| PLT (109/L) | 193.00 (163.00, 225.00) | 191.50 (159.00, 224.00) | 198.00 (172.00, 236.00) | Z = –1.32 | 0.187 |
| CRP (mg/L) | 2.86 (1.00, 6.09) | 2.16 (0.92, 5.62) | 5.80 (2.23, 11.48) | Z = –3.74 | |
| HCT (%) | 35.37 |
35.50 |
34.90 |
t = 1.09 | 0.276 |
| Albumin (g/L) | 35.77 |
35.66 |
36.16 |
t = –1.26 | 0.211 |
| NLR | 4.55 (3.31, 7.28) | 4.30 (3.18, 6.25) | 6.65 (4.11, 11.53) | Z = –4.03 | |
| PLR | 121.80 (93.49, 162.80) | 116.01 (90.51, 151.93) | 143.61 (115.79, 189.90) | Z = –2.89 | 0.004 |
| LMR | 3.00 (2.41, 3.93) | 3.20 (2.68, 4.03) | 2.37 (1.60, 3.23) | Z = –4.37 | |
| SII | 984.21 (625.03, 1434.48) | 849.50 (592.98, 1232.22) | 1559.11 (818.57, 2219.67) | Z = –4.44 | |
| SIRI | 2.35 (1.65, 4.26) | 2.19 (1.57, 3.49) | 4.26 (2.39, 7.48) | Z = –4.63 | |
| NPR | 0.04 (0.03, 0.06) | 0.04 (0.03, 0.05) | 0.05 (0.04, 0.07) | Z = –3.12 | 0.002 |
CBC, complete blood count; WBC, white blood cell count; HB, hemoglobin; PLT, platelet; CRP, C-reactive protein; HCT, hematocrit; NLR, neutrophil-to-lymphocyte Ratio; PLR, platelet-to-lymphocyte ratio; LMR, lymphocyte-to-monocyte Ratio; SII, systemic immune-inflammation index; SIRI, systemic inflammation response index; NPR, neutrophil-to-platelet ratio.
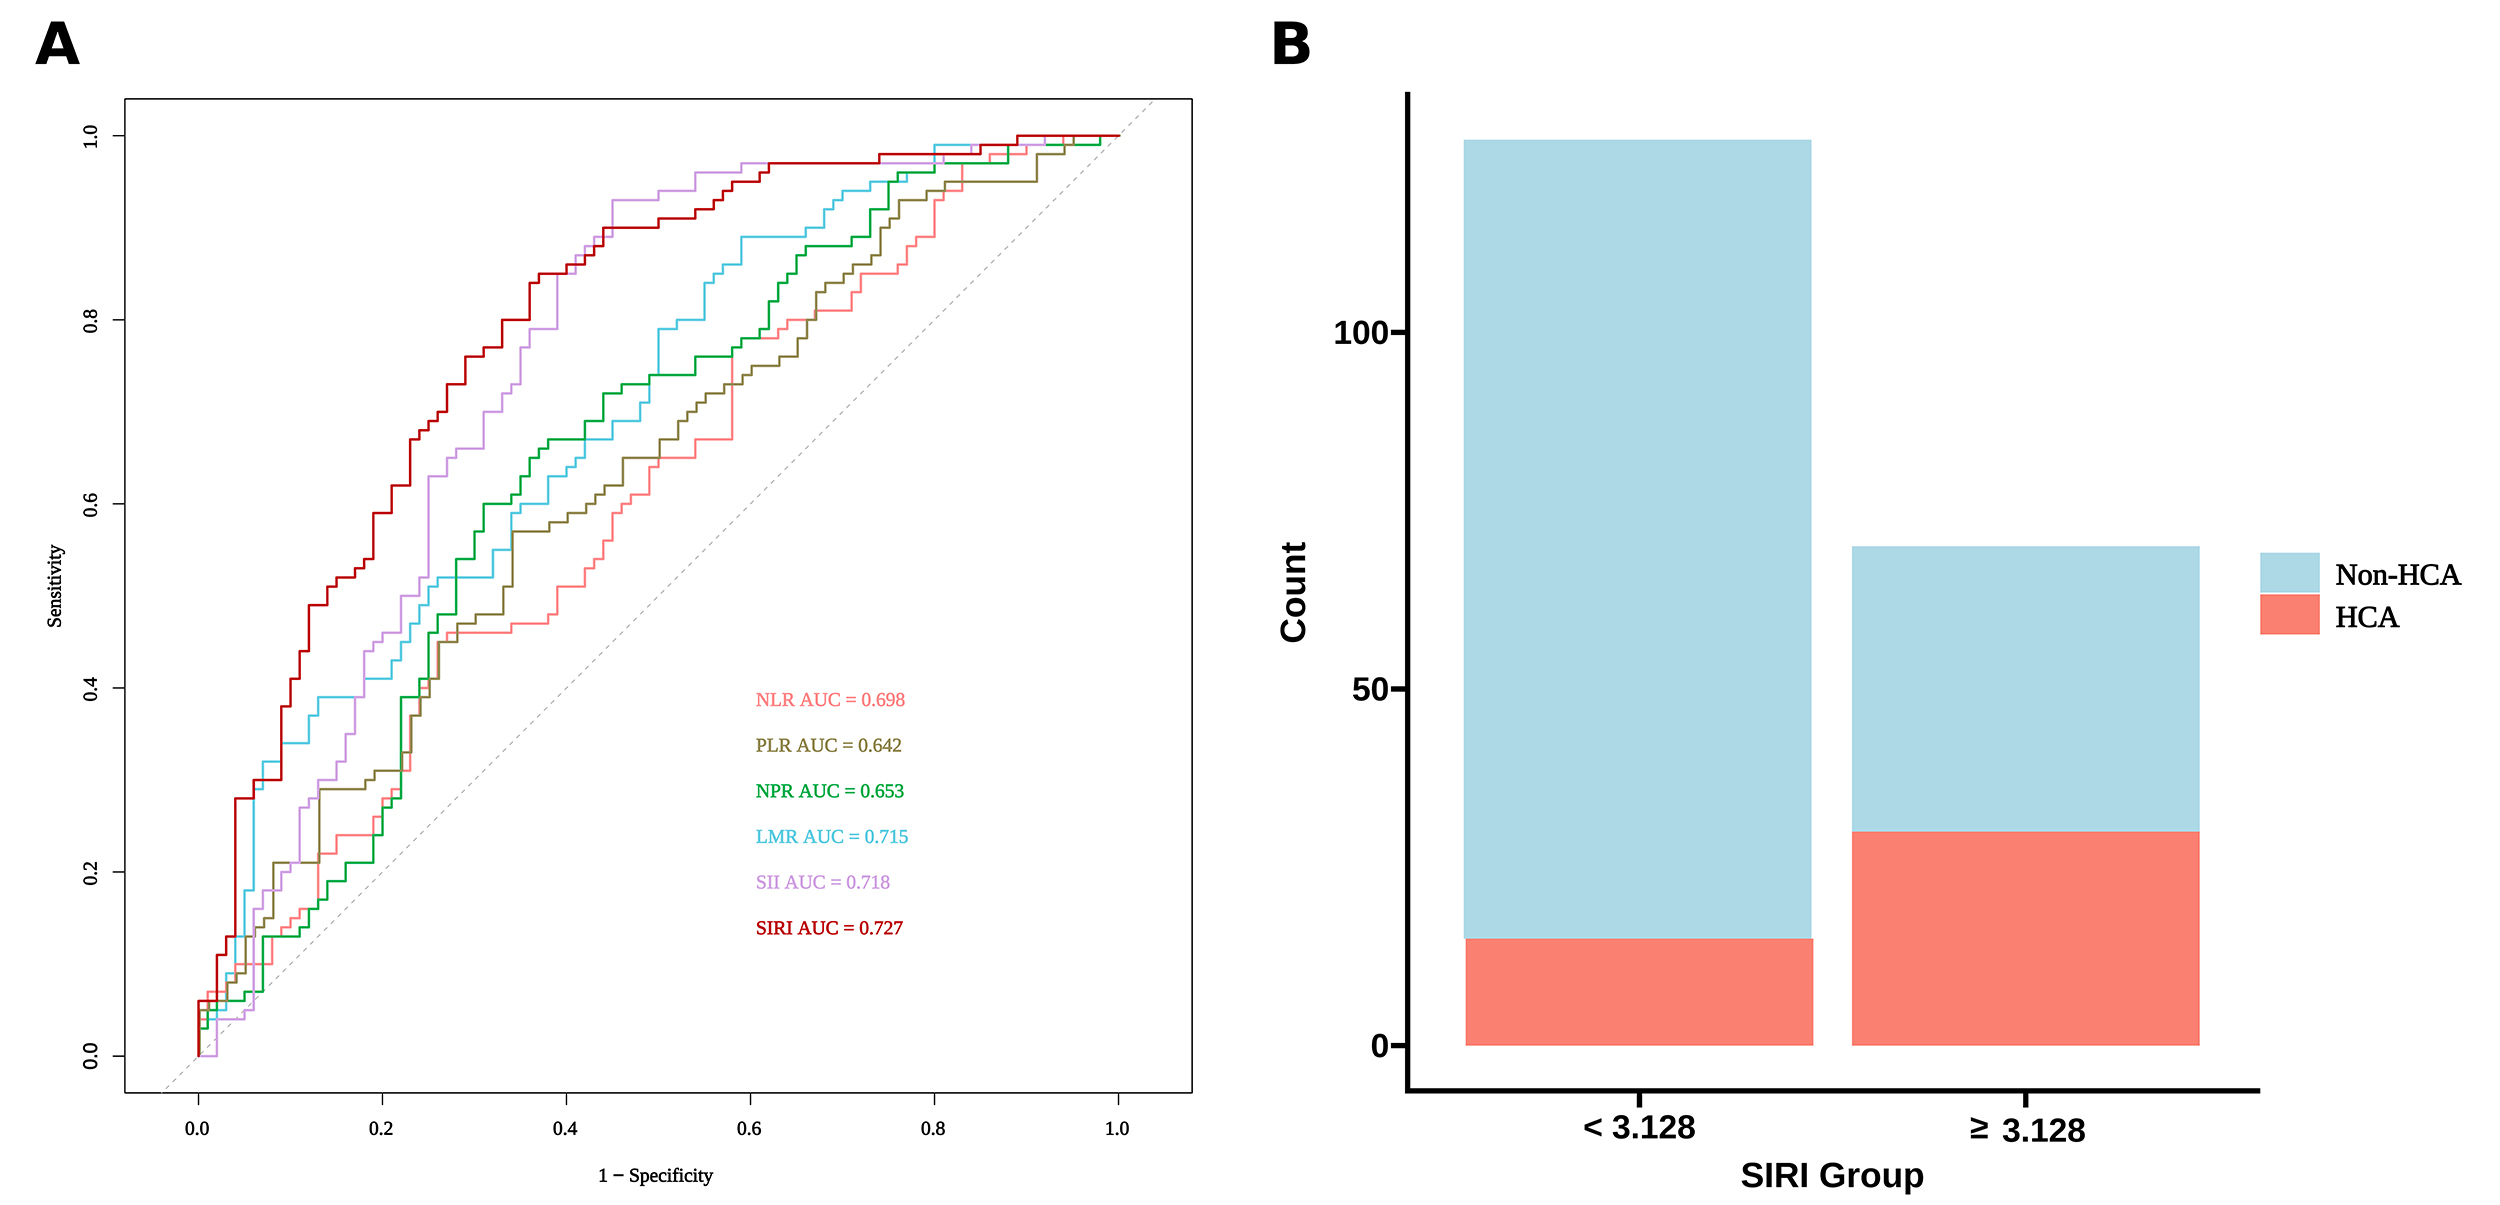
To assess the predictive performance of these indices for HCA, ROC curve
analysis was conducted (Table 3 and Fig. 1A). SIRI demonstrated the strongest
predictive performance, with an AUC of 0.727 (95% CI: 0.633–0.822),
outperforming SII (AUC = 0.718), LMR (AUC = 0.715), NLR (AUC = 0.698), NPR (AUC =
0.653), and PLR (AUC = 0.642). Based on the optimal cutoff for SIRI (3.128),
determined using the Youden index, sensitivity was 73.7% and specificity was
66.7%. The grouped stacked bar chart stratified by the SIRI cutoff (Fig. 1B)
indicates a substantially higher number of HCA cases in the elevated SIRI
subgroup (
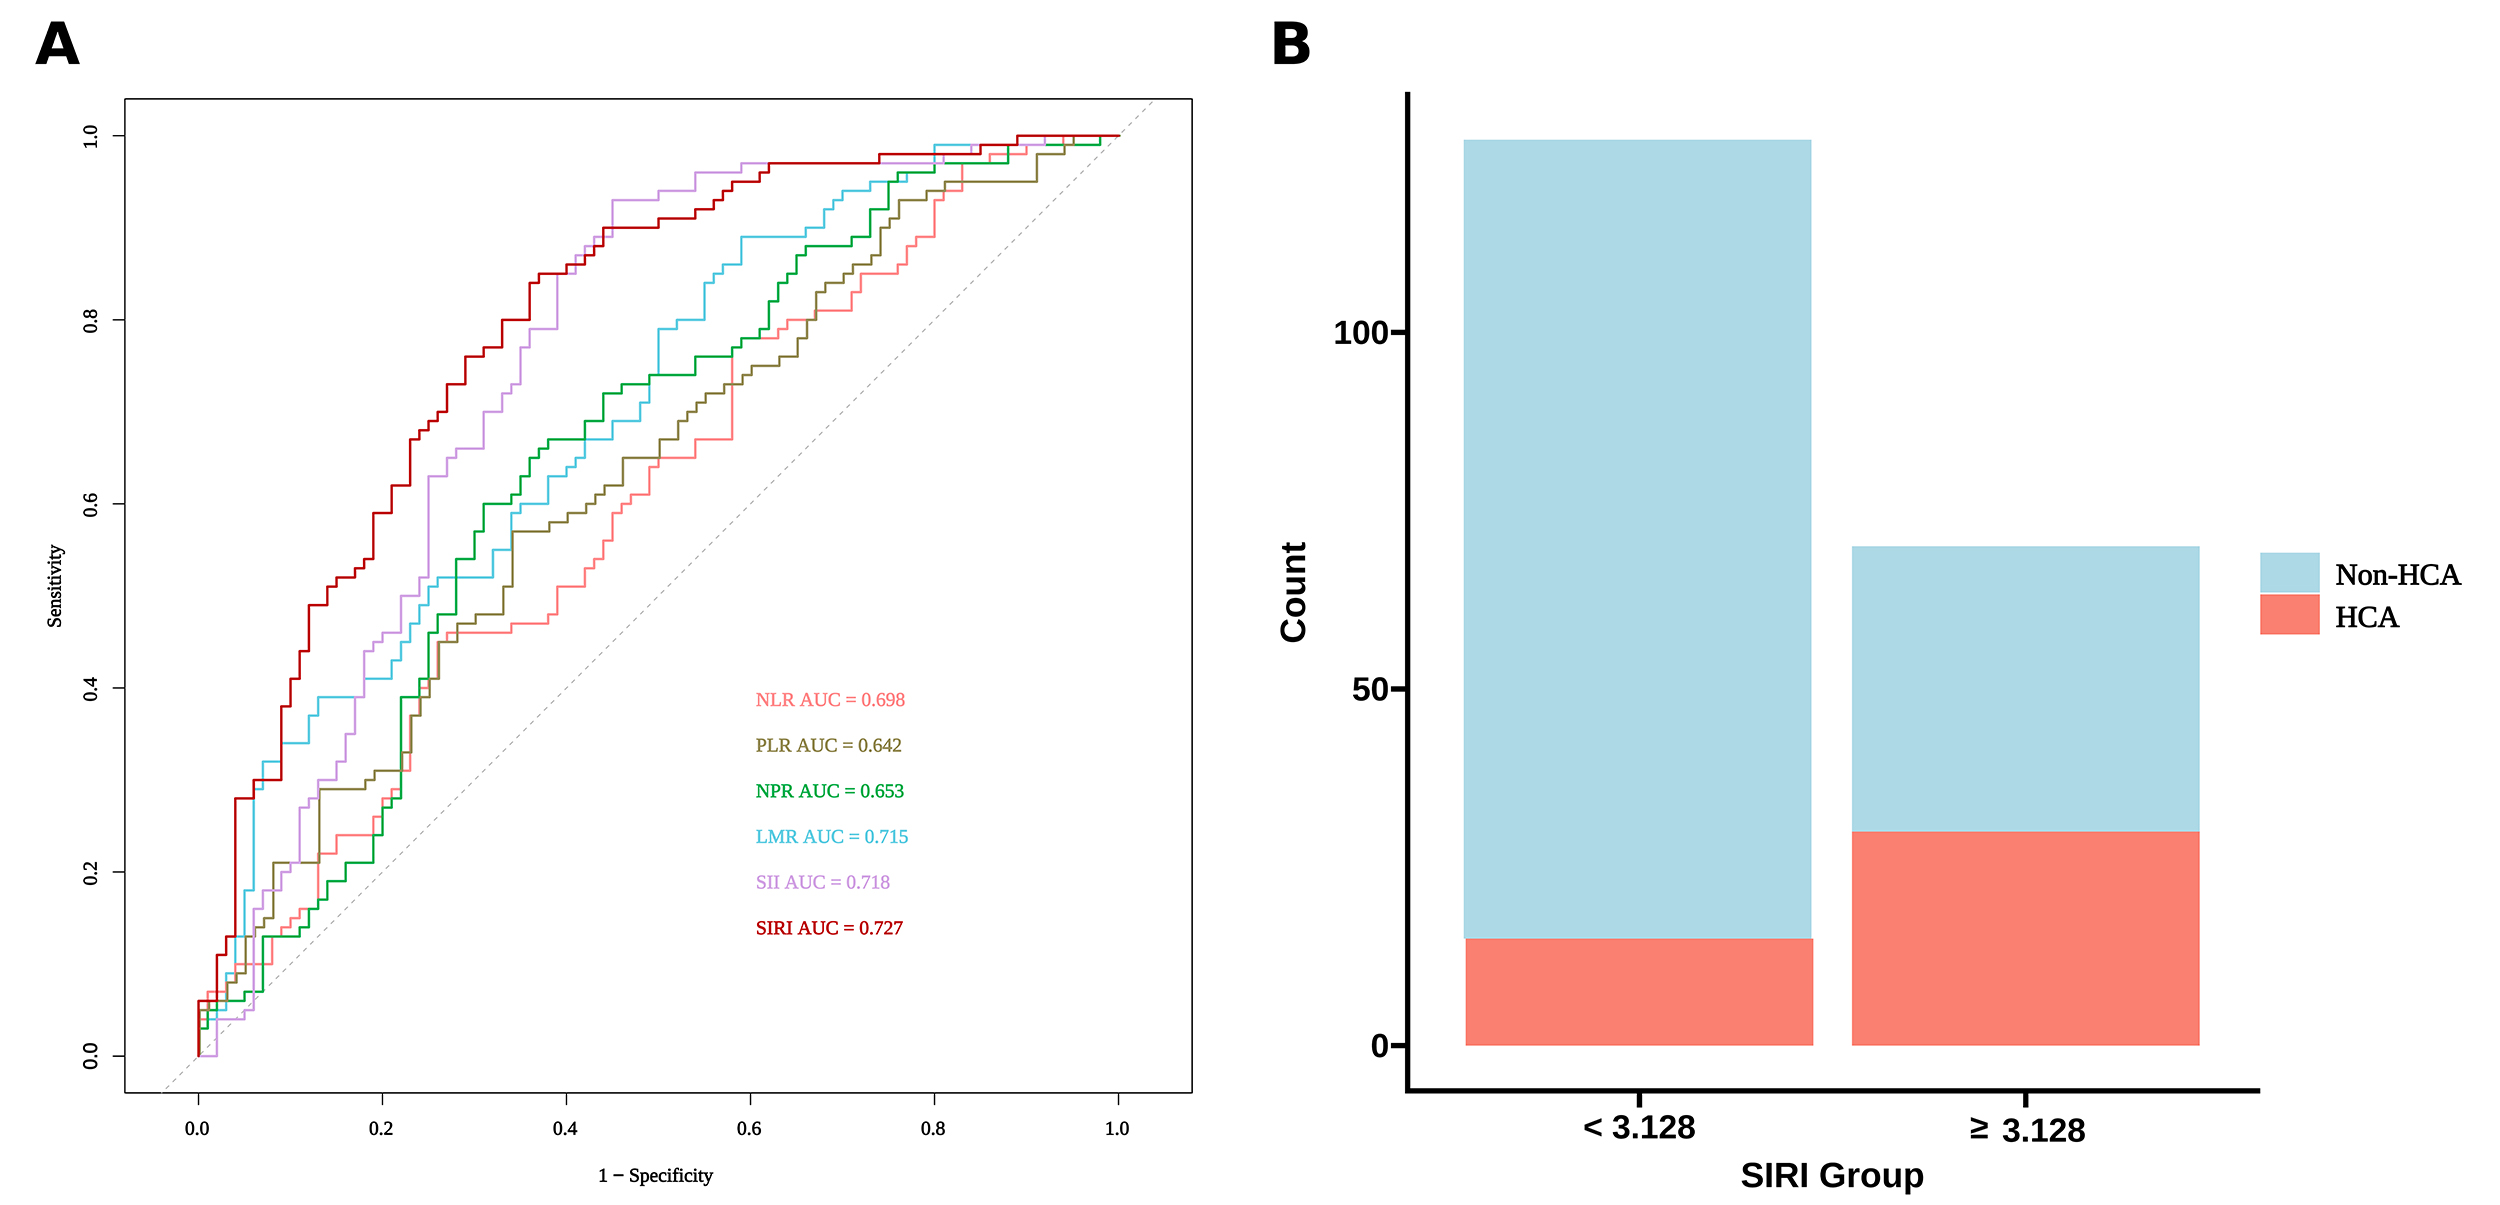 Fig. 1.
Predictive value and stratification performance of inflammatory indices for histologic chorioamnionitis in PPROM. (A) ROC curves of different inflammatory indices, including NLR, PLR, LMR, SII, NPR, and SIRI, for the prediction of HCA in patients with PPROM. (B) Stacked bar plot showing the distribution of HCA and non-HCA cases according to the SIRI cutoff value (3.128).
| Variables | AUC (95% CI) | Accuracy | Sensitivity | Specificity | Cutoff |
| NLR | 0.698 (0.607–0.789) | 0.653 | 0.684 | 0.644 | 5.448 |
| PLR | 0.642 (0.552–0.732) | 0.625 | 0.625 | 0.625 | 133.95 |
| NPR | 0.653 (0.559–0.748) | 0.678 | 0.566 | 0.711 | 0.040 |
| LMR | 0.715 (0.618–0.812) | 0.360 | 0.158 | 0.422 | 2.415 |
| SII | 0.718 (0.627–0.809) | 0.662 | 0.796 | 0.622 | 1328.551 |
| SIRI | 0.727 (0.633–0.822) | 0.683 | 0.737 | 0.667 | 3.128 |
ROC, receiver operating characteristic; AUC, area under the curve.
To determine the independent risk factors for HCA, variables that were
statistically significant in the univariate analysis (gestational age at rupture
| Variables | Univariate | Multivariate | |||||||||
| SE | Wald | p-value | OR (95% CI) | SE | Wald | p-value | OR (95% CI) | ||||
| Gestational age at rupture | |||||||||||
| 1.000 (Reference) | 1.000 (Reference) | ||||||||||
| 1.489 | 0.363 | 16.867 | 4.434 (2.178 –9.027) | 0.818 | 0.508 | 2.592 | 0.108 | 2.267 (0.837–6.140) | |||
| Rupture to delivery time |
|||||||||||
| No | 1.000 (Reference) | 1.000 (Reference) | |||||||||
| Yes | 1.406 | 0.360 | 15.280 | 4.081 (2.016–8.260) | 0.663 | 0.507 | 1.711 | 0.191 | 1.940 (0.718–5.242) | ||
| CRP | 0.080 | 0.023 | 12.617 | 1.084 (1.037–1.133) | 0.051 | 0.025 | 3.964 | 0.046 | 1.052 (1.001–1.106) | ||
| SIRI | 0.260 | 0.062 | 17.472 | 1.297 (1.148–1.465) | 0.172 | 0.067 | 6.538 | 0.011 | 1.188 (1.041–1.356) | ||
OR, odds ratio; SE, standard error.
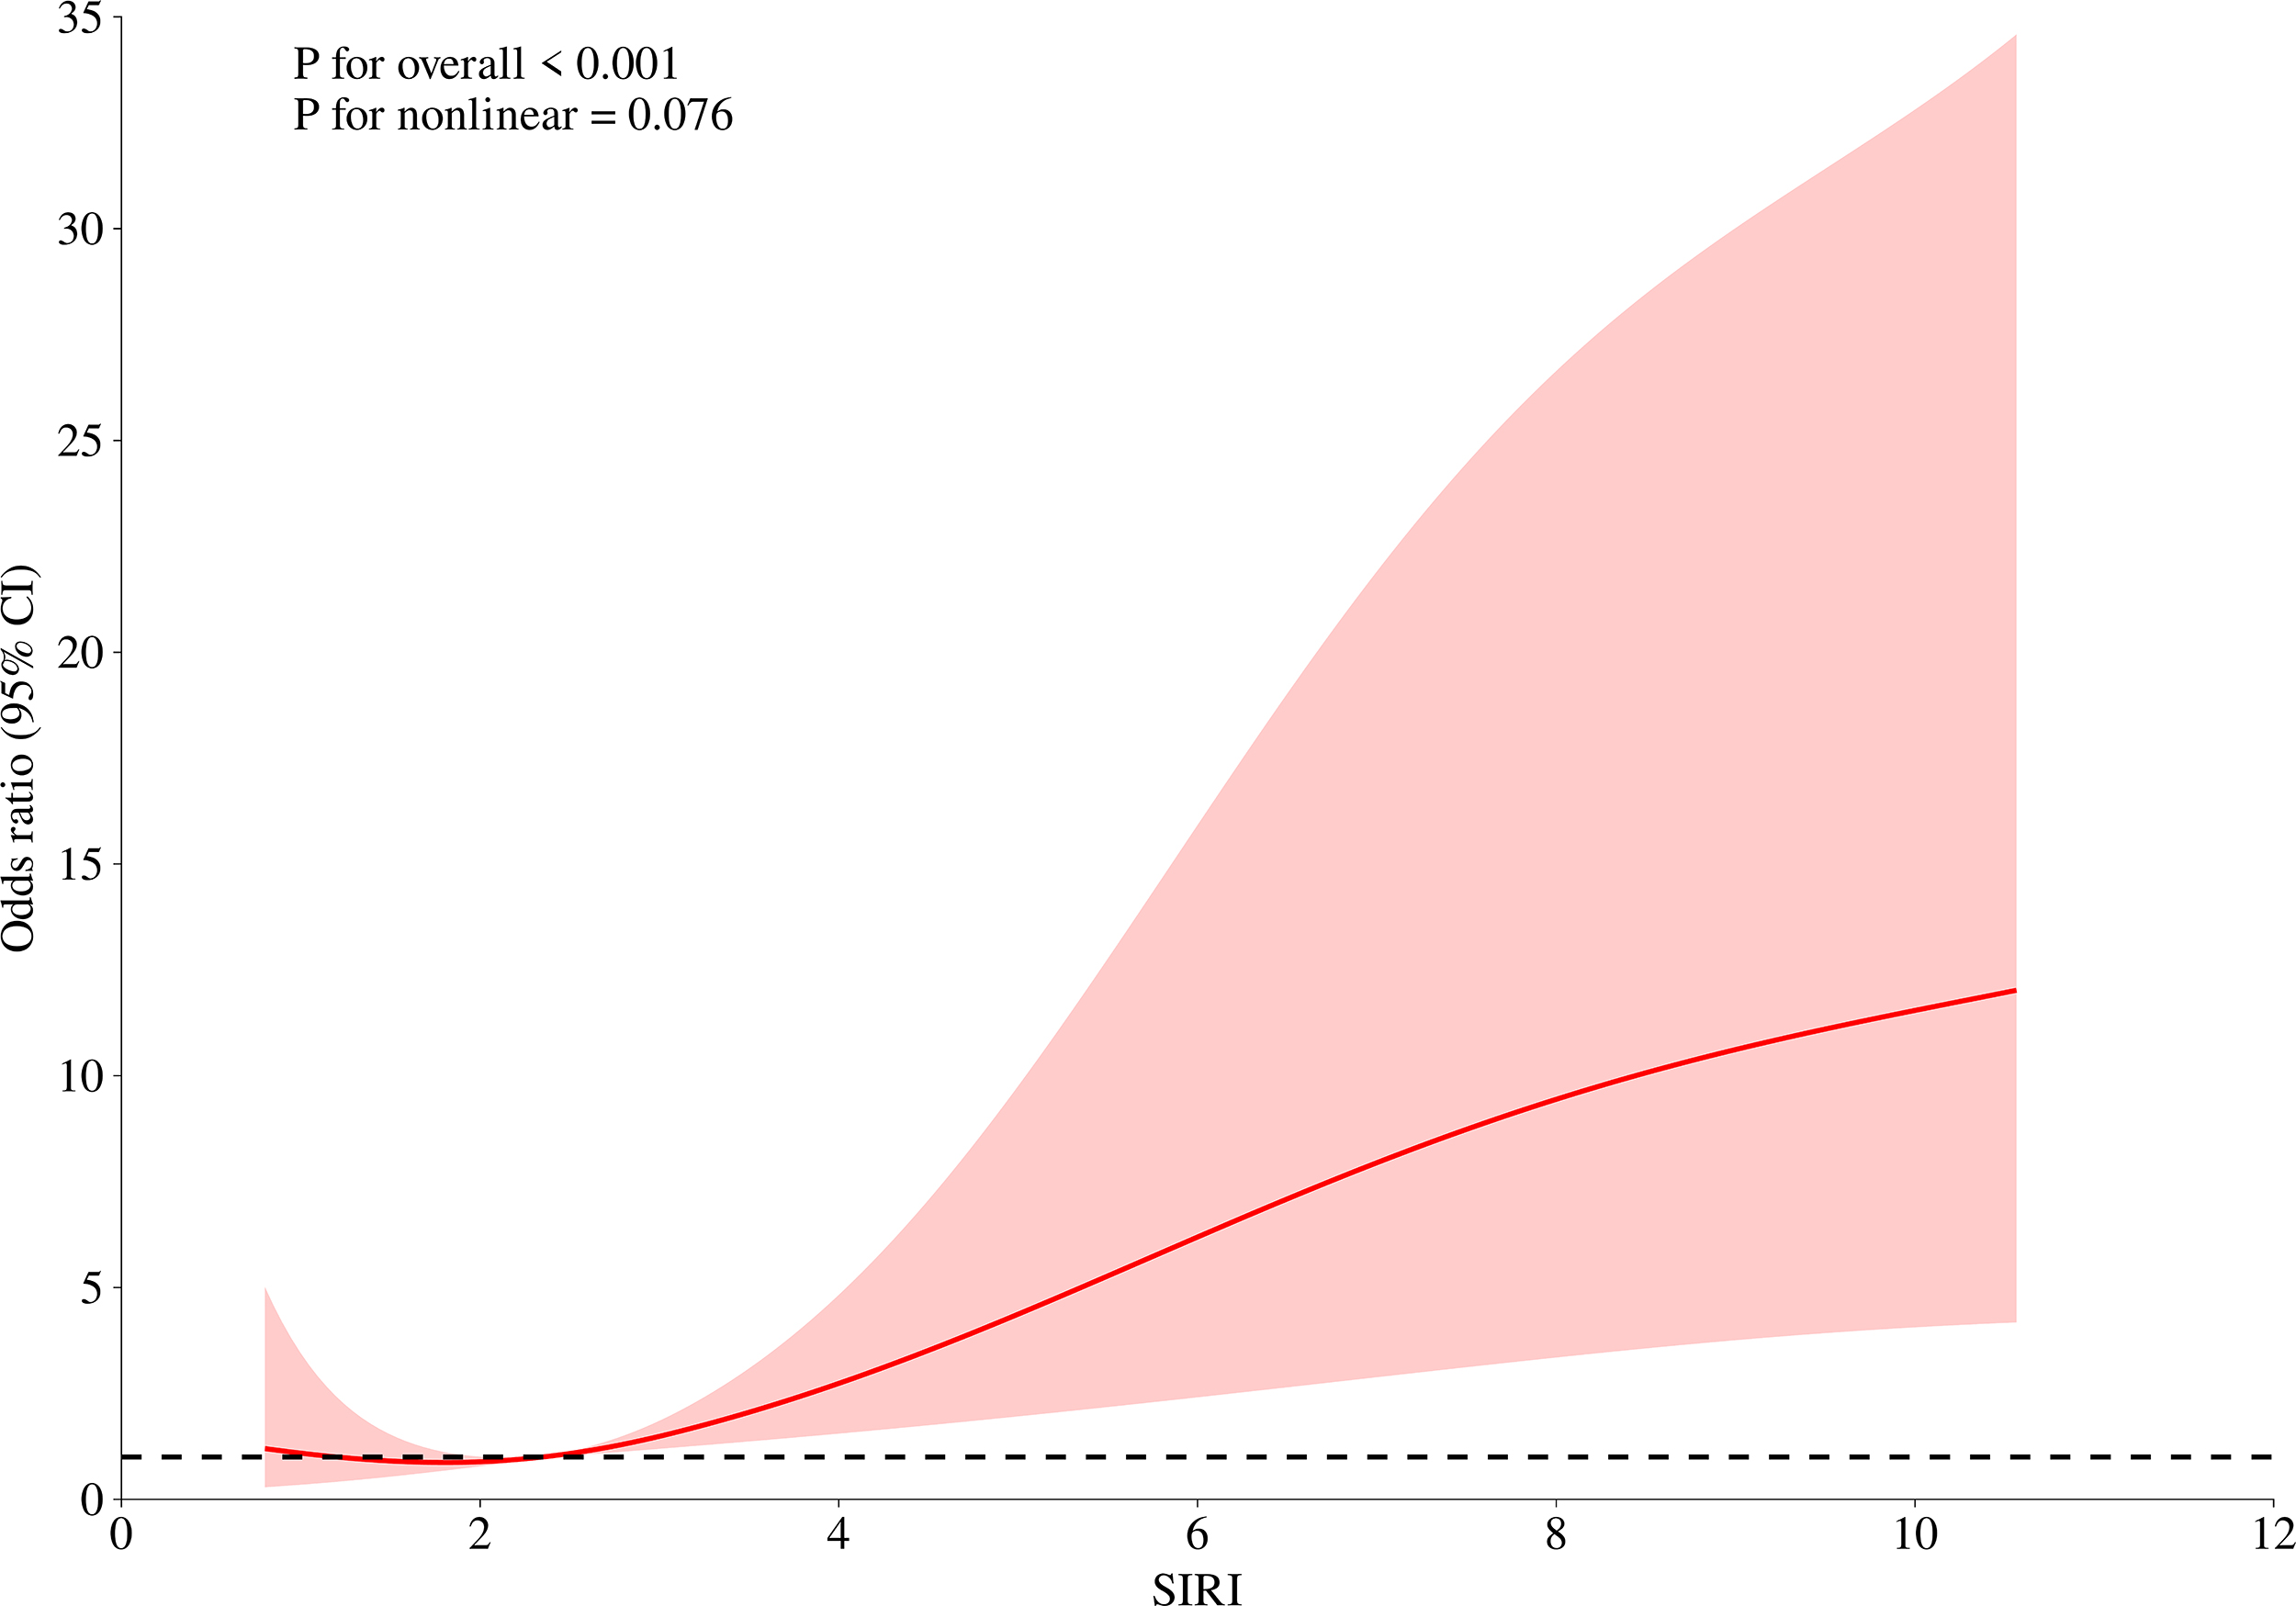
Given that SIRI was the strongest independent predictor of HCA in the
multivariable analysis, we further explored the dose-response relationship
between SIRI and the risk of HCA. RCS modeling suggested an overall increasing
trend in HCA risk with increasing SIRI values. Although the formal nonlinearity
test was not statistically significant (p
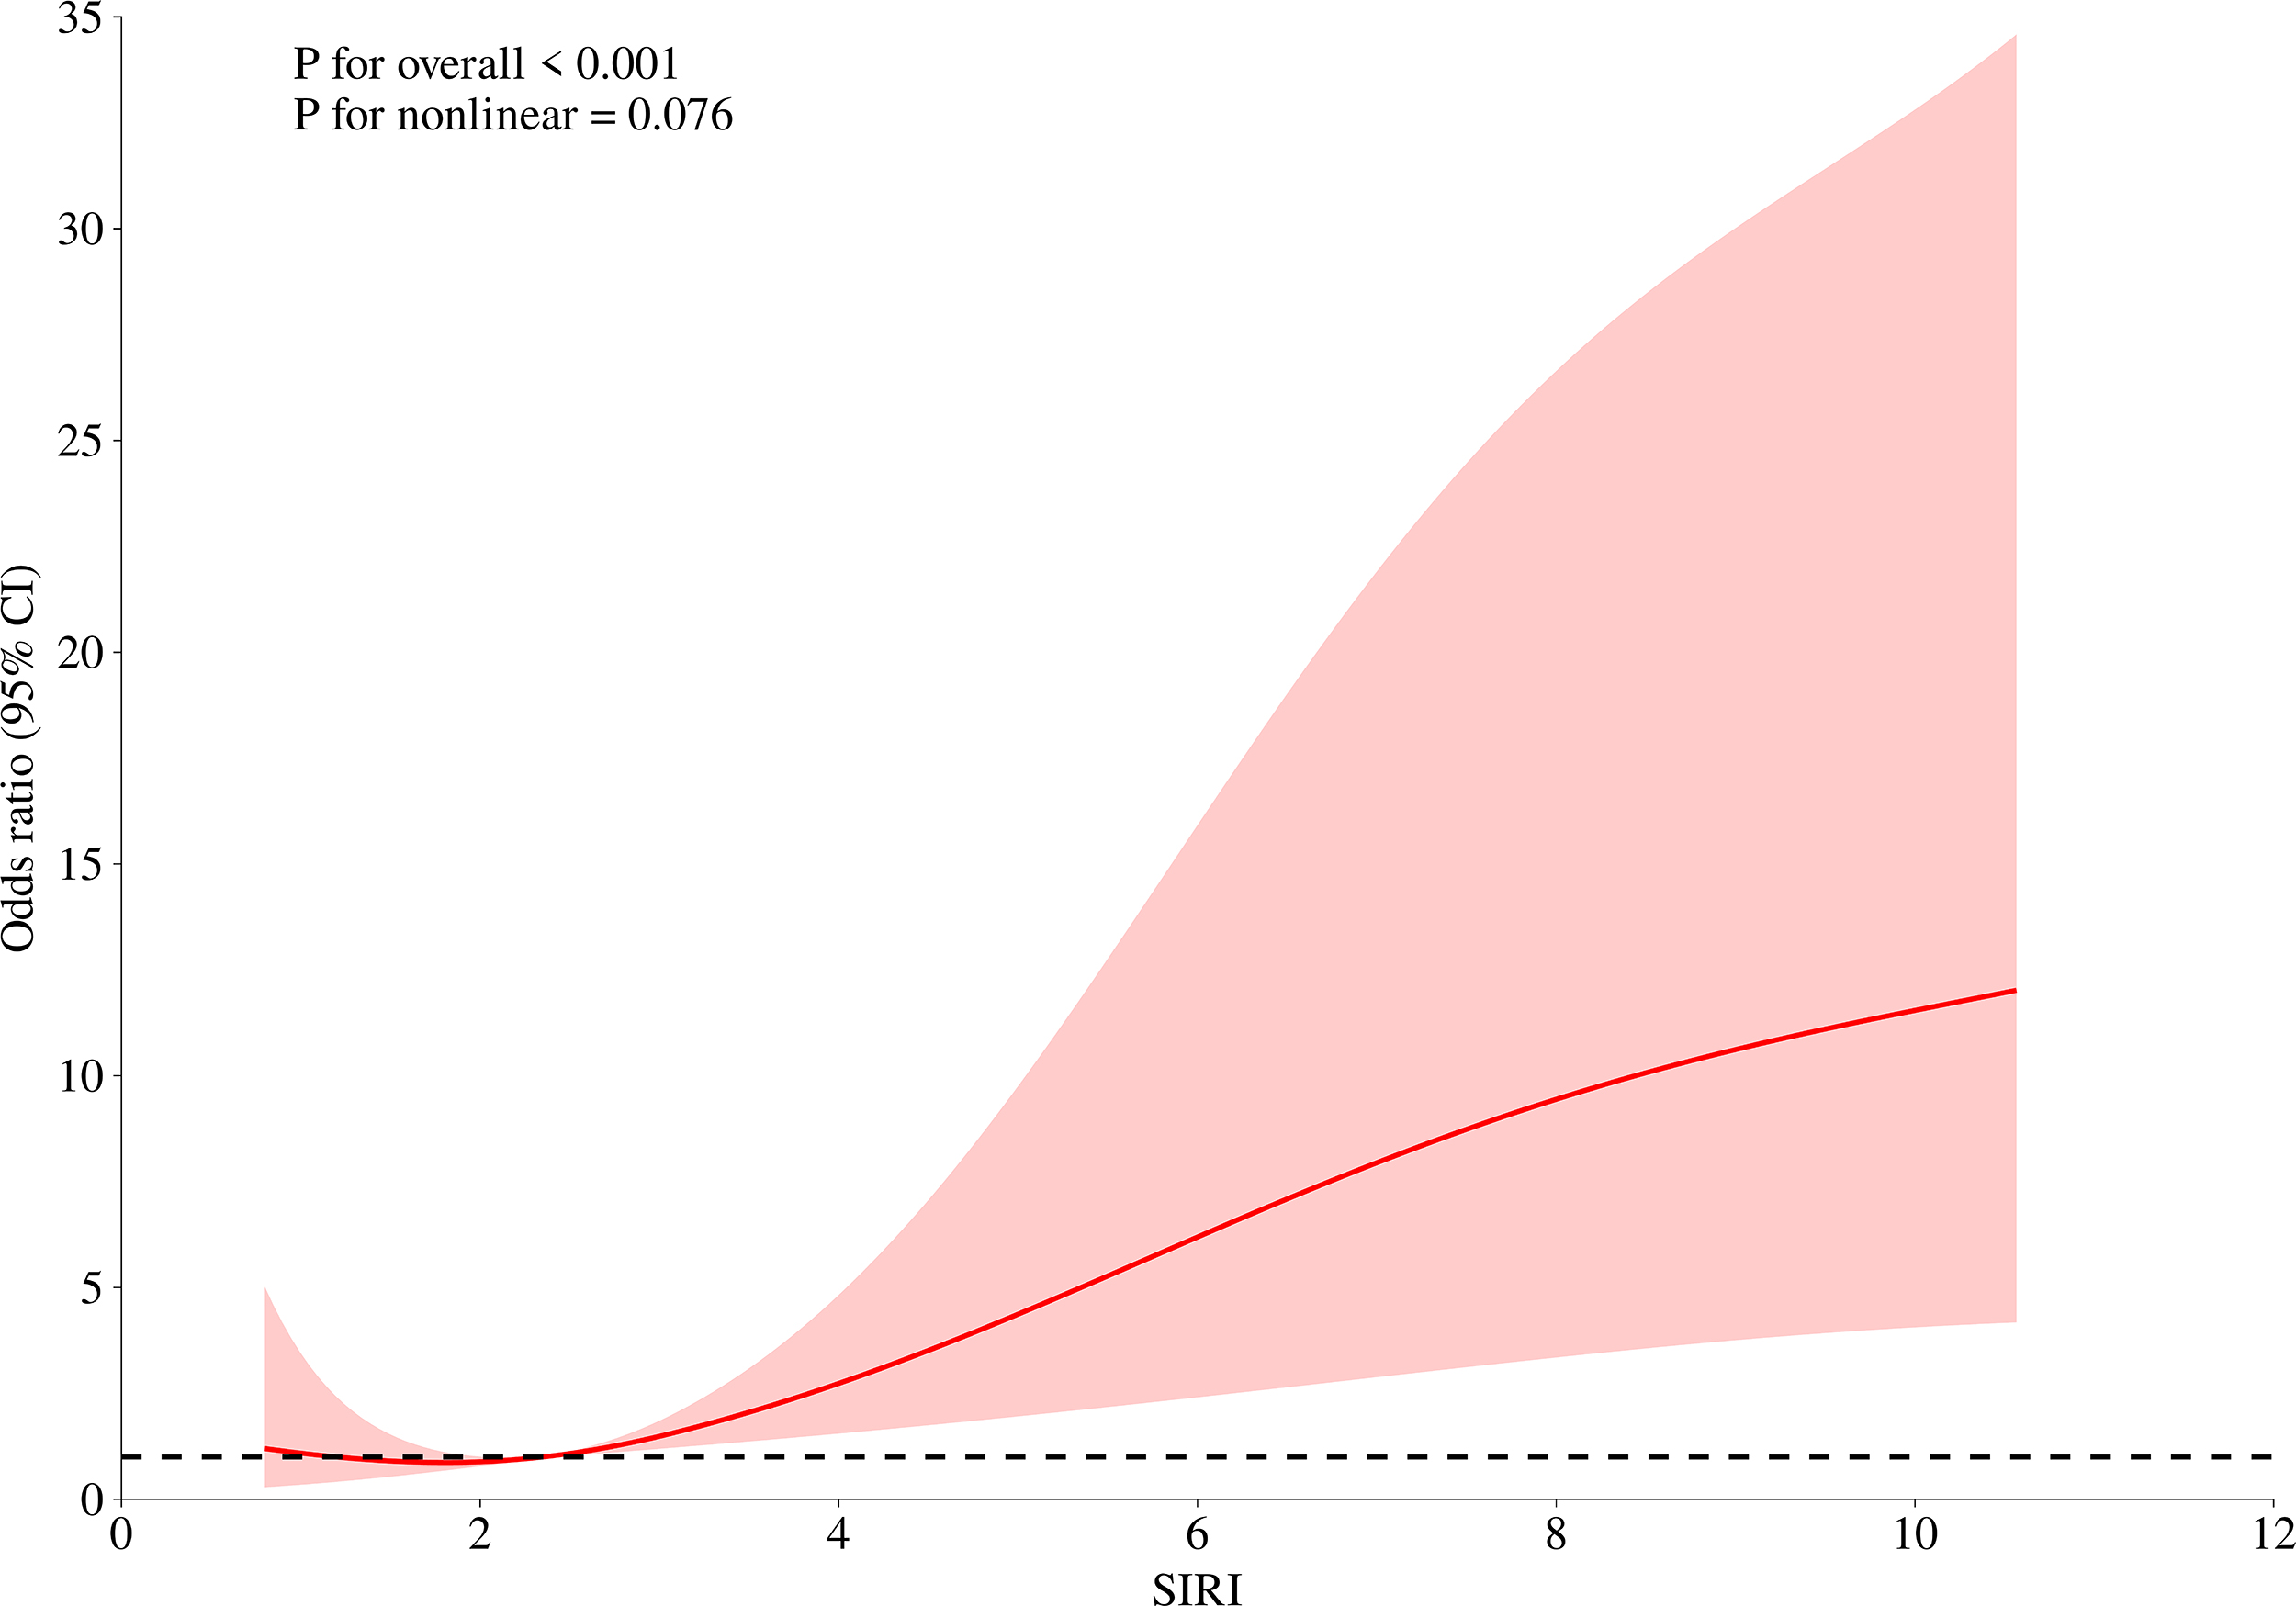 Fig. 2.
RCS analysis of the association between SIRI and the risk of HCA. RCS, restricted cubic spline.
| Outcome | OR (95% CI) | p-value | |
| Model 1: Single-term logistic regression | 1.175 (1.028–1.344) | 0.018 | |
| Model 2: Two-piecewise logistic regression (exploratory) | |||
| Inflection point | 1.311 | ||
| 0.599 (0.001–378.515) | 0.876 | ||
| 1.197 (1.036–1.384) | 0.015 | ||
| p-value for log-likelihood ratio test | |||
This study systematically evaluated multiple CBC-derived inflammatory indices for predicting HCA in women with PPROM. Among the tested indices, SIRI showed the best discriminatory performance and remained independently associated with HCA after adjustment, together with CRP. Consistent with previous studies, women in the HCA group exhibited a more pronounced SIRI than those in the non-HCA group.
In exploratory analyses, we observed evidence suggesting potential nonlinearity in the association between SIRI and the risk of HCA. RCS modeling with four knots, together with piecewise regression, indicated that the relationship may vary across the distribution of SIRI rather than follow a strictly linear pattern. Specifically, at lower SIRI levels, changes in SIRI were not strongly associated with HCA risk, whereas higher values were associated with a steeper increase in risk. These findings should be interpreted cautiously, as the analyses were exploratory and based on a retrospective, single-center cohort. The identified inflection point should not be considered a clinical threshold but rather a hypothesis-generating observation that warrants confirmation in larger, prospective studies.
Consistent with previous studies, women in the HCA group exhibited a more pronounced SIRI than those in the non-HCA group. Traditional markers such as NLR, PLR, and CRP were all significantly elevated, supporting their role as indicators of infection and inflammation [23]. In our study, the AUC of NLR for predicting HCA was 0.698, which is comparable to some reports but differs from others [10, 11]. These discrepancies may reflect heterogeneity in study populations, pathological definitions, and the timing of blood sampling. Importantly, SIRI achieved higher discrimination than NLR and SII in our analysis. Recent studies have increasingly explored composite CBC-derived indices and multivariable models to improve risk stratification for placental inflammation and related outcomes (e.g., latency) in PPROM [24, 25, 26, 27], and our findings provide additional evidence that SIRI may serve as a useful adjunctive marker. Notably, we did not assume strict linearity a priori; instead, we evaluated potential nonlinearity and an exploratory threshold-like pattern, which warrants independent validation.
Biologically, SIRI calculated from peripheral neutrophil, monocyte, and
lymphocyte counts [28] and is often interpreted as a composite marker of innate
immune activation relative to lymphocyte-mediated immune regulation [15]. In HCA
and PPROM, neutrophils and monocyte/macrophage lineage cells are recruited to
gestational tissues and release cytokines and chemokines, as along with effector
mechanisms such as neutrophil extracellular traps (NETs) and proteases; these
processes have been implicated in inflammatory amplification and extracellular
matrix degradation within the fetal membranes [15, 29, 30, 31]. Toll-like receptor
signaling in amniotic epithelial and other gestational cells can activate
NF-
The clinical implications of our findings should be interpreted in context. Because SIRI is noninvasive, inexpensive, and readily available from routine CBC testing, it may serve as a useful adjunct to existing clinical and laboratory assessments when estimating the likelihood of placental inflammation in PPROM. However, these estimates were derived from a retrospective single-center cohort, and the exploratory inflection point identified by piecewise modeling should not be interpreted as a validated clinical threshold. Future multicenter prospective studies should evaluate whether incorporating SIRI into prediction models improves calibration, discrimination, and clinical outcomes compared with current practice.
Several limitations should be acknowledged. First, this was a single-center retrospective study with a limited sample size, and the number of HCA cases was relatively small (n = 45), resulting in group imbalance and reduced precision, particularly for spline and piecewise analyses. Second, HCA was diagnosed postpartum based on placental pathology, which may introduce interobserver variability despite blinded dual review and limits immediate antepartum applicability. Third, residual confounding cannot be excluded, and long-term neonatal outcomes were not available. The observed incidence of HCA in our cohort (22.8%) was lower than that reported in some series, underscoring the need for external validation across diverse populations and pathological practices.
In conclusion, maternal peripheral blood SIRI is an inexpensive and readily available biomarker derived from routine CBC testing and showed the best discriminatory performance for HCA among the evaluated indices in women with PPROM. SIRI and CRP remained independently associated with HCA in the multivariable analysis. Exploratory spline and piecewise modeling suggested a potential change in the risk slope at higher SIRI values; however, this observation requires confirmation in larger prospective multicenter cohorts. Future studies should focus on external validation and on whether combining SIRI with clinical variables improves predictive performance and maternal and neonatal outcomes.
The dataset is available from the corresponding author on reasonable request.
HG: conceptualization, methodology, data curation, formal analysis, visualization, drafting. LG: data curation, analysis, validation, critical revision. YL: clinical methodology, resources, data curation, revision. WH: analysis, visualization, revision. JZ: methodology, validation, resources, revision. ZR: data curation, project administration, revision. XH: data curation, validation, interpretation of data, and manuscript revision. JL: supervision, conceptual guidance, project administration, funding, critical revision; guarantor. All authors contributed to critical revision of the manuscript for important intellectual content. All authors read and approved the final manuscript. All authors have participated sufficiently in the work and agreed to be accountable for all aspects of the work.
This study was approved by the Ethics Committee of Beijing Chao-Yang Hospital, Capital Medical University (Approval No. 2025-Ke-865) and was conducted in accordance with the Declaration of Helsinki. The requirement for informed consent was waived due to the retrospective nature of the study and the use of anonymized data.
We thank the Department of Pathology for assistance with placental specimen processing and interpretation, and the medical record staff for support in data retrieval.
This research received no external funding.
The authors declare no conflicts of interest.
During the preparation of this work, the authors used ChatGPT5.2 solely for English language polishing and grammatical improvement. After using this tool, the authors reviewed and edited the content as needed and take full responsibility for the content of the publication.
References
Publisher’s Note: IMR Press stays neutral with regard to jurisdictional claims in published maps and institutional affiliations.