

 , Zhiying Wang 3,†, Huizi Wang 1,2, Xiaofan Fu 1,2, Shaolian Zhang 1,2, Hua Yang 1,2,*
1 Department of Reproductive Gynecology, Hainan Women and Children’s Medical Center, 570206 Haikou, Hainan, China
2 Department of Obstetrics and Gynecology, Hainan Medical University, 571199 Haikou, Hainan, China
3 Department of Gynecology, Longyan First Affiliated Hospital of Fujian Medical University, 364000 Longyan, Fujian, China
†These authors contributed equally.
Abstract
Multiple studies have demonstrated that exposure to perfluoroalkyl substances (PFAS) adversely affects endocrine function, reproductive health, metabolic processes, immune responses, and cardiovascular health; however, integration of population and animal studies remains limited.
We collected clinical data and serum samples from 247 women of childbearing age who underwent pre-pregnancy fertility assessment at Hainan Women and Children’s Medical Center from January 2022 to June 2024. Serum samples were collected to assess the levels of PFAS. Furthermore, twenty female C57BL/6J mice, aged 8 weeks, were randomly allocated into four groups: a control group receiving an equivalent volume of a 1% Tween and 2% dimethyl sulfoxide aqueous solution, a low-dose perfluoroheptanoic acid (PFHpA) group (0.5 mg/kg/day), a medium-dose PFHpA group (5 mg/kg/day), and a high-dose PFHpA group (50 mg/kg/day). Serum reproductive hormone levels and the expression of cytochrome P450 family 11 subfamily A polypeptide 1 (CYP11A1), cytochrome P450 family 17 subfamily A polypeptide 1 (CYP17A1), 3β-hydroxysteroid dehydrogenase (3β-HSD), and 17β-hydroxysteroid dehydrogenase (17β-HSD) in the mice were quantified using enzyme-linked immunosorbent assay (ELISA) and quantitative polymerase chain reaction (qPCR). The associations between individual PFAS compounds and reproductive hormones, as well as intergroup mean differences, were analyzed utilizing IBM SPSS Statistics version 27.
In the human study, the natural logarithm of PFHpA showed a positive association with total testosterone (TT) levels, with a β of 0.51 (95% confidence interval [CI] for B: 0.18, 0.30). The high-dose PFHpA group exhibited elevated TT levels compared with all three other groups, with all p-values < 0.0001. Furthermore, in the animal study, CYP11A1 levels were increased in the high-dose PFHpA group compared with both the control and low-dose PFHpA groups, with all p-values < 0.01. Additionally, the high-dose PFHpA group demonstrated higher levels of CYP17A1, 3β-HSD, and 17β-HSD than all other groups, with all p-values < 0.05.
This research concluded that PFHpA exposure affects TT levels. The increase in TT may result from upregulated expression of multiple enzymes within ovarian tissues, such as CYP11A1, CYP17A1, 3β-HSD, and 17β-HSD, following PFHpA exposure.
Keywords
- perfluoroheptanoic acid
- total testosterone
- childbearing age
- steroid pathway
Perfluoroalkyl substances (PFAS) are synthetic organic compounds characterized by their robust carbon-fluorine bonds. They typically include at least one perfluorinated methyl group (–CF3) or a perfluorinated methylene group (–CF2–), with certain exceptions [1]. PFAS are generally classified as short-chain, which include seven or fewer carbon atoms, or long-chain, which include eight or more carbon atoms. They are often referred to as legacy compounds, which reflects the duration of chemical evaluation [2]. Due to their significant thermochemical stability and hydrophobic properties, PFAS are frequently present in consumer products and household items, particularly in furniture, carpets, and firefighting foam [3]. There are thousands of alkyl chain chemicals of variable length that contain a perfluoroalkyl segment (CnF2n+1–), and their environmental and toxicological properties have been extensively investigated [3, 4]. Perfluorooctanoic acid (PFOA) and perfluorooctanesulfonic acid (PFOS) have been widely detected in flora, fauna, human biological samples, and various soil and water specimens worldwide [5, 6, 7, 8]. These substances have demonstrated multisystem toxicity, which arises primarily from prolonged exposure through various routes, including dietary intake, inhalation of airborne particles, and dermal contact [5, 6, 7, 8]. Evidence indicates that PFAS exposure adversely impacts endocrine function, reproductive health, metabolic processes, immune system performance, and cardiovascular health [4, 8, 9, 10]. Numerous institutions and regulatory organizations now enforce stricter controls on the production and use of PFAS [4]. Following the discontinuation of PFOA, PFOS, and perfluorohexanesulfonic acid (PFHxS), the global production of PFAS has transitioned toward alternative compounds [4]. This encompasses short-chain PFAS, including perfluorobutyric acid (PFBA), perfluorobutane sulfonic acid (PFBS), perfluorohexanoic acid (PFHxA), perfluoroheptanoic acid (PFHpA), and perfluoroalkyl ether sulfonic acids (PFECAs). Some of these PFAS possess shorter alkyl chains or distinct chemical functional groups compared with traditional PFAS [11]. Although these alternative PFAS remain environmentally persistent, many appear less bioaccumulative and exhibit shorter elimination half-lives compared to legacy PFAS [12]. Among the PFECAs are hexafluoropropylene oxide dimer acid (HFPO-DA) and hexafluoropropylene oxide trimer acid (HFPO-TA), with HFPO-DA commonly referred to as GenX. Additionally, there are chlorinated perfluoroalkyl ether sulfonic acids (Cl-PFESAs), such as 6:2 Cl-PFESA and 8:2 Cl-PFESA.
PFAS persist in both the environment and biological organisms. Although some
alternatives to PFAS have shorter half-lives in humans, they remain highly
persistent in the environment, thereby posing ongoing exposure risks [13].
Between 2016 and 2021, concentrations of PFOS, PFBS, and HFPO-DA in rivers and
lakes across China exhibited an upward trend [14]. Recent national water quality
surveys indicate that levels of short-chain PFAS, particularly PFBA and PFBS, in
water bodies are significantly higher than those of PFOA and PFOS [15]. Endocrine
glands secrete hormones that regulate normal growth, fertility, and reproduction
in humans [16]. Numerous studies have demonstrated that PFAS exposure can impair
endocrine function and reproductive health [9, 17]. Regarding the reproductive
system, PFAS have the potential to interfere with endogenous hormone metabolism
and the synthesis or secretion of steroid hormones, including estradiol
(E2), progesterone (P), total testosterone (TT), luteinizing hormone (LH),
and follicle-stimulating hormone (FSH) [2]. A moderate expression of cytochrome
P450 family 11 subfamily A polypeptide 1 (CYP11A1), cytochrome P450 family 17
subfamily A polypeptide 1 (CYP17A1), 3
This research was a population-based study and was approved by the Medical Ethics Committee of Hainan Women and Children’s Medical Center (Ethics Number: HNWCMC MEC No. 148 of 2025) in China. The study was conducted in strict accordance with the principles of the Declaration of Helsinki. Clinical data and serum samples were collected from 247 women of reproductive age who underwent preconception fertility evaluation at the Hainan Women and Children’s Medical Center from January 2022 to June 2024. The inclusion criteria for all participants were as follows: (1) age between 20 and 35 years; (2) no history of chronic diseases, endocrine disorders, tumors, autoimmune diseases, or active infections; and (3) provision of informed consent to participate in the study. The exclusion criteria were as follows: (1) individuals with incomplete clinical information or missing samples; and (2) those who were pregnant, breastfeeding, or had a history of infertility. Data were collected on the participants’ age, body mass index (BMI), age at menarche, number of pregnancies, menstrual cycle characteristics, income, and education level. Each woman underwent a comprehensive evaluation, which included measurement of FSH, LH, PRL, E2, P, TT, and anti-müllerian hormone (AMH) during the mornings of days 2 to 4 of her menstrual cycle.
Twenty female C57BL/6J mice, each aged 8 weeks and weighing between 18 and 20
grams, purchased from GemPharmatech Co., Ltd., Nanjing, Jiangsu, China (License No. SCXK(SU)2023-0009),
were utilized in this animal study. The sample size was determined based on the
degrees of freedom derived from the variance analysis. All procedures and
protocols involving mice were conducted in accordance with the guidelines of the
Animal Care and Use Committee at Hainan Medical University and were approved by
this committee (Ethics Number: HYLL-2024-222). All animals were housed in a
controlled environment, with temperature, humidity, and light carefully regulated
within a fully staffed, dedicated animal facility operating on a 12-hour
light/dark cycle. Veterinarians were available on call at all times. Food and
water were provided ad libitum. This research used Python 3.9 (Python
Software Foundation, Beaverton, OR, USA) to calculate the required sample size
for a one-way Analysis of Variance (ANOVA) power analysis. The anticipated effect
size (Cohen’s f) was established at 0.75, with a significance level of
Blood samples were collected from women of reproductive age by venipuncture between days 2 and 4 of their menstrual cycle for preconception fertility evaluation. The samples were then centrifuged at 3000 rpm for 10 minutes at 4 °C and subsequently stored at –80 °C for PFAS analysis.
Methods for measuring PFAS were adapted from existing literature [24, 25]. We
utilized ultra-high-performance liquid chromatography-tandem quadrupole mass
spectrometry (UHPLC-MS/MS) to analyze the concentrations of 22 different PFAS
compounds in 0.1 mL of plasma. To ensure rigorous quality control, each batch of
samples included internal quality control samples and procedural blank samples.
Specifically, 2 ng of labeled standard and 1 mL of formic acid were added to the
plasma samples. After vortexing, the samples were loaded onto the column and
sequentially eluted with 1 mL of 0.1 M formic acid, 3 mL of a 50:50 mixture of
0.1 M formic acid and methanol, and 0.5 mL of a 1% ammonium hydroxide solution.
PFAS were eluted using 1.8 mL of 1% ammonium hydroxide in acetonitrile. The
eluate was then concentrated and diluted to 0.1 mL with a mixture of methanol and
10 mM ammonium acetate before transfer to a UPLC-MS/MS system for analysis. For
the current study, only PFAS compounds with a detection rate exceeding 85% in
the population were included in the analysis. This encompassed 1 short-chain PFAS
(PFHpA), an emerging PFAS substitute (6:2 Cl-PFESA), and 8 legacy PFAS compounds
(PFOA, PFOS, perfluorononanoic acid [PFNA], perfluorodecanoic acid [PFDA], PFHxS,
perfluoroheptanesulfonic acid [PFHpS], perfluorododecanoic acid [PFDoA], and
perfluoroundecanoic acid [PFUndA]). We defined the limit of detection (LOD) as
the analyte concentration at which the signal-to-noise ratio (S/N) equals 3.
Values below the LOD were substituted with the LOD divided by the square root of
two (
Two days after completing the oral gavage procedure, mice were anesthetized via intraperitoneal injection of a 0.3% sodium pentobarbital solution at a dose of 0.2 mL per 10 g of body weight. The procedure was initiated after the mice were placed under surgical anesthesia. Blood samples were collected via cardiac puncture and left at room temperature for 2 hours. The samples were then centrifuged at 1000 rpm for 20 minutes at 2 °C to 8 °C. The supernatants were then analyzed by enzyme-linked immunosorbent assay (ELISA) to quantify levels of FSH, LH, PRL, E2, TT, and P. Subsequently, the mice were humanely euthanized via intraperitoneal injection of 3% sodium pentobarbital, administered at a dose of 0.05 mL per 10 grams of body weight.
Total RNA was extracted from mouse ovarian tissues on the same day using the
Ultrapure RNA Kit (CW0581M, CWBIO, Taizhou, Jiangsu, China). RNA quality was verified by spectrophotometry,
formaldehyde agarose gel electrophoresis, and spectrophotometric analysis.
Expression analysis of transcripts related to the steroid pathway was performed
using quantitative polymerase chain reaction (qPCR). In brief, cDNA was
synthesized from 1 µg of total RNA using the HiScript II Q RT SuperMix
(+gDNA wiper) (R223-01, Vazyme, Nanjing, Jiangsu, China) according to the manufacturer’s instructions for
qPCR. A PCR reaction mixture containing 1 µL of cDNA was amplified in a
total volume of 20 µL using a PCR amplifier (TC-EA, Hangzhou BORI
Technology Co., Ltd., Hangzhou, Zhejiang, China), with 0.8 µL of each forward and reverse primer pair
(see Table 1). qPCR was performed using a fluorescent real-time PCR instrument
(CFX Connect™ Real-Time, Bó Lè Life Medical Products
(Shanghai) Co., Ltd., Shanghai, China). Relative fold gene expression changes
(2-ΔΔCT) were calculated in comparison to vehicle controls
and normalized to the expression of the reference gene. The transcripts analyzed
included CYP11A1, CYP17A1, 3
| Primers | Primer sequence (5′-3′) | Length (bp) | Annealing temperature (°C) |
| AGGGAAATCGTGCGTGAC | 192 | 51.6 | |
| CATACCCAAGAAGGAAGGCT | |||
| CYP11A1 F | GAAGCGAGACTTCAGCCAGT | 132 | 58.0 |
| CYP11A1 R | AGGGTCATGGAGGTCGTGT | ||
| 3 |
AGCTCTGGACAAAGTATTCCGA | 234 | 58.0 |
| 3 |
GCCTCCAATAGGTTCTGGGT | ||
| CYP17A1 F | TCTGATACAAGCCAAGATGAATGC | 110 | 58.0 |
| CYP17A1 R | CCCCAAAGATGTCTCCCACC | ||
| 17 |
GTGGTTATGAGCAAGCCCTGAG | 112 | 58.0 |
| 17 |
CGGTTCGTGGAGAAGTAGCG |
qPCR, quantitative polymerase chain reaction; F, forward primer; R, reverse
primer; CYP11A1, cytochrome P450 family 11 subfamily A polypeptide 1;
3
Mean values are expressed as the mean
The demographic characteristics of the participants are summarized in Table 2. The mean age was 29.44 years, with a mean BMI of 21.41 kg/m2 and a mean age at menarche of 13.15 years. Table 3 presents the median concentrations of reproductive hormones measured in the study, including FSH, LH, PRL, E2, TT, P, and AMH. The median concentrations were 6.50 IU/L for FSH, 5.61 IU/L for LH, 19.90 ng/mL for PRL, 42.70 pg/mL for E2, 0.28 ng/mL for TT, 0.22 ng/mL for P, and 3.80 ng/mL for AMH. The median levels of these reproductive hormones were all within the normal range for this age group. As shown in Table 4, the majority of women exhibited detectable levels of all 10 PFAS compounds assessed, with PFOA exhibiting the highest median concentration at 2.295 ng/mL.
| Variable | Mean | |
| Age (years) | 29.44 | |
| BMI (kg/m2) | 21.41 | |
| Age at menarche (years) | 13.15 | |
| Number of pregnancies (%) | ||
| Nulliparous | 120 (48.58%) | |
| 1–2 | 102 (41.30%) | |
| 25 (10.12%) | ||
| Menstrual cycle irregularity (%) | 42 (17.00%) | |
| Education level | ||
| Primary school | 46 (18.62%) | |
| Middle school | 77 (31.17%) | |
| Above middle school | 124 (50.20%) | |
| Income level | ||
| 131 (53.04%) | ||
| 116 (46.96%) | ||
SD, standard deviation; BMI, body mass index; USD, United States dollar.
| Reproductive hormones | LOD | Detection rate % | P25 | P50 | P75 | Min | Max |
| FSH (IU/L) (P25, P75) | 0.10 | 100.00 | 5.64 | 6.50 | 7.35 | 3.78 | 21.52 |
| LH (IU/L) (P25, P75) | 0.10 | 100.00 | 4.15 | 5.61 | 7.32 | 1.61 | 19.77 |
| PRL (ng/mL) (P25, P75) | 1.00 | 100.00 | 14.90 | 19.90 | 27.80 | 5.70 | 76.20 |
| E2 (pg/mL) (P25, P75) | 5.00 | 99.60 | 30.70 | 42.70 | 55.80 | 3.54 | 111.70 |
| TT (ng/mL) (P25, P75) | 0.03 | 100.00 | 0.19 | 0.28 | 0.37 | 0.03 | 0.70 |
| P (ng/mL) (P25, P75) | 0.05 | 96.40 | 0.14 | 0.22 | 0.32 | 0.04 | 2.02 |
| AMH (ng/mL) (P25, P75) | 0.01 | 100.00 | 2.19 | 3.80 | 5.46 | 0.13 | 12.23 |
LOD, limit of detection; FSH, follicle-stimulating hormone; LH, luteinizing hormone; PRL, prolactin; E2, estradiol; TT, total testosterone; P, progesterone; AMH, anti-müllerian hormone.
| PFAS (ng/mL) | LOD (ng/mL) | Detection rate % | P25 (ng/mL) | P50 (ng/mL) | P75 (ng/mL) | Min (ng/mL) | Max (ng/mL) |
| 6:2 Cl-PFESA | 0.001 | 100.000 | 0.197 | 0.303 | 0.451 | 0.002 | 1.872 |
| PFOA | 0.005 | 100.000 | 1.555 | 2.295 | 3.237 | 0.140 | 13.384 |
| PFOS | 0.004 | 99.190 | 1.377 | 2.141 | 3.438 | 9.156 | |
| PFNA | 0.006 | 99.595 | 0.383 | 0.581 | 0.792 | 2.598 | |
| PFDA | 0.006 | 99.190 | 0.195 | 0.298 | 0.436 | 1.566 | |
| PFHxS | 0.004 | 99.595 | 0.182 | 0.318 | 0.466 | 3.191 | |
| PFHpS | 0.001 | 100.000 | 0.033 | 0.061 | 0.107 | 0.001 | 0.398 |
| PFDoA | 0.016 | 99.595 | 0.019 | 0.032 | 0.054 | 0.298 | |
| PFUndA | 0.012 | 99.595 | 0.249 | 0.411 | 0.672 | 1.725 | |
| PFHpA | 0.003 | 90.283 | 0.023 | 0.048 | 0.219 | 1.775 |
PFAS, perfluoroalkyl substances; Cl-PFESA, chlorinated perfluoroalkyl ether sulfonic acid; PFOA, perfluorooctanoic acid; PFOS, perfluorooctanesulfonic acid; PFNA, perfluorononanoic acid; PFDA, perfluorodecanoic acid; PFHxS, perfluorohexanesulfonic acid; PFHpS, perfluoroheptanesulfonic acid; PFDoA, perfluorododecanoic acid; PFUndA, perfluoroundecanoic acid; PFHpA, perfluoroheptanoic acid.
Table 5 presents the results of a linear regression analysis examining the
associations between individual PFAS compounds and reproductive hormone levels.
After adjusting for potential confounders, the natural logarithm of PFHpA was
positively correlated with both E2 and TT levels. Specifically, the
| FSH |
LH |
PRL |
E2 |
TT |
P |
AMH | |
| 6:2 Cl-PFESA | 0.01 (–1.26, 1.40) | –0.02 (–2.30, 1.93) | 0.09 (–5.15, 13.50) | –0.10 (–20.30, 6.31) | –0.07 (–0.13, 0.05) | 0.06 (–0.12, 0.24) | –0.02 (–2.05, 1.59) |
| PFOA | –0.00 (–0.17, 0.17) | –0.02 (–0.30, 0.25) | –0.13 (–2.09, 0.33) | –0.09 (–2.67, 0.78) | –0.11 (–0.02, 0.00) | –0.03 (–0.03, 0.02) | –0.01 (–0.25, 0.22) |
| PFOS | 0.16 (–0.18, 0.50) | 0.01 (–0.53, 0.55) | –0.18 (–3.77, 1.03) | –0.04 (–3.86, 2.97) | –0.23 (–0.04, 0.01) | –0.32 (–0.09, 0.00) | –0.15 (–0.68, 0.25) |
| PFNA | 0.01 (–1.46, 1.53) | 0.12 (–1.51, 3.26) | 0.04 (–9.27, 11.80) | 0.13 (–8.62, 21.30) | 0.20 (–0.03, 0.17) | 0.11 (–0.13, 0.27) | 0.21 (–0.69, 3.40) |
| PFDA | –0.22 (–4.72, 1.06) | 0.17 (–2.33, 6.91) | 0.12 (–13.60, 27.20) | 0.02 (–27.70, 30.30) | 0.32 (0.01, 0.40) | 0.17 (–0.20, 0.58) | 0.004 (–3.92, 4.01) |
| PFHxS | –0.04 (–1.12, 1.08) | –0.09 (–2.52, 0.99) | 0.07 (–5.07, 10.40) | 0.11 (–5.03, 17.00) | 0.05 (–0.05, 0.09) | –0.03 (–0.17, 0.13) | –0.09 (–2.18, 0.84) |
| PFHpS | 0.03 (–6.67, 8.16) | –0.20 (–21.51, 2.16) | 0.00 (–52.20, 52.30) | –0.06 (–92.50, 56.20) | –0.08 (–0.67, 0.32) | 0.05 (–0.81, 1.19) | –0.12 (–14.8, 5.48) |
| PFDoA | 0.03 (–11.17, 14.71) | 0.09 (–12.52, 28.78) | 0.03 (–80.04, 102.28) | –0.01 (–135.65, 123.70) | –0.01 (–0.90, 0.84) | –0.05 (–2.11, 1.39) | 0.17 (–4.54, 30.93) |
| PFUndA | 0.09 (–1.42, 2.47) | –0.11 (–4.17, 2.04) | –0.19 (–21.60, 5.85) | 0.07 (–15.20, 23.80) | –0.12 (–0.18, 0.08) | –0.04 (–0.30, 0.23) | –0.02 (–2.86, 2.48) |
| PFHpA | –0.11 (–1.56, 0.19) | 0.11 (–0.30, 2.50) | 0.01 (–5.62, 6.71) | 0.32 (12.10, 29.60) | 0.51 (0.18, 0.30) | 0.07 (–0.06, 0.18) | 0.12 (–0.21, 2.19) |
*Adjusted for age, BMI, age at menarche, number of pregnancies, menstrual cycle
irregularity, education level, and income level. CI for non-standard
coefficients. Bold characters indicate significance, p
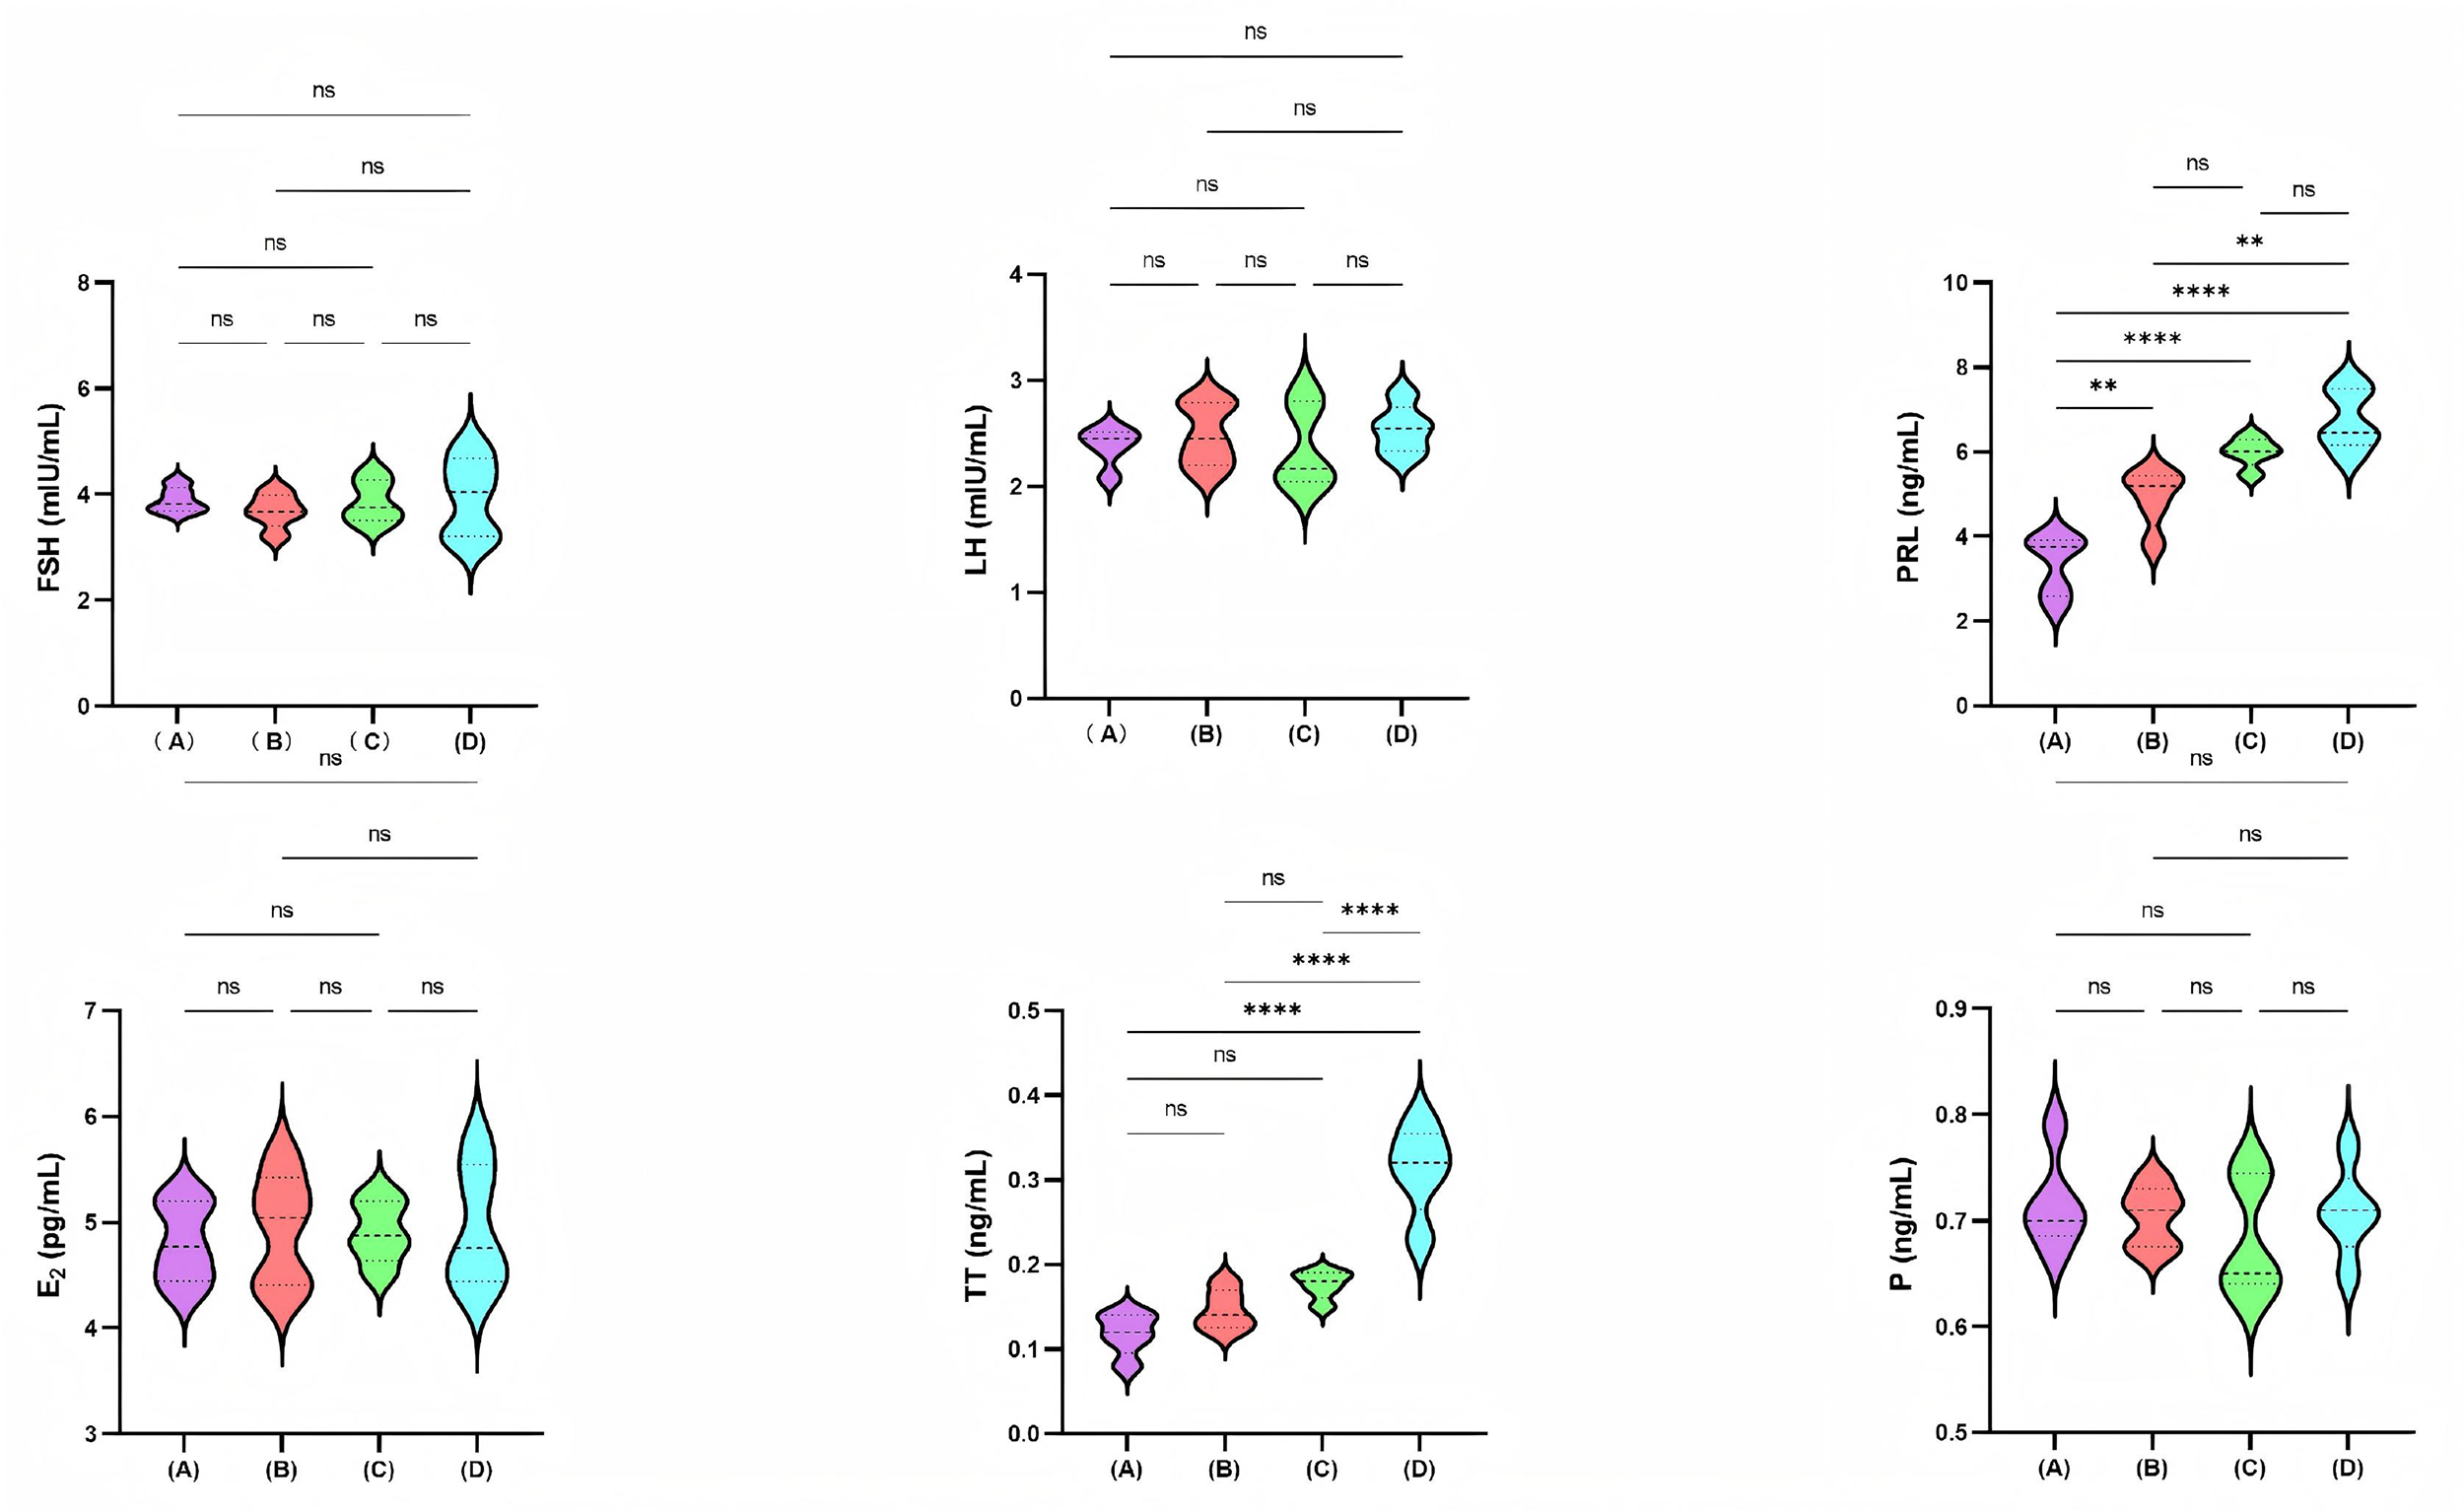
Fig. 1 illustrates the serum reproductive hormone levels across four mice
groups: the control group, the low-dose PFHpA group (0.5 mg/kg/day), the
medium-dose PFHpA group (5 mg/kg/day), and the high-dose PFHpA group (50
mg/kg/day). The high-dose PFHpA group exhibited higher TT levels than all other
three groups, with all comparisons yielding p
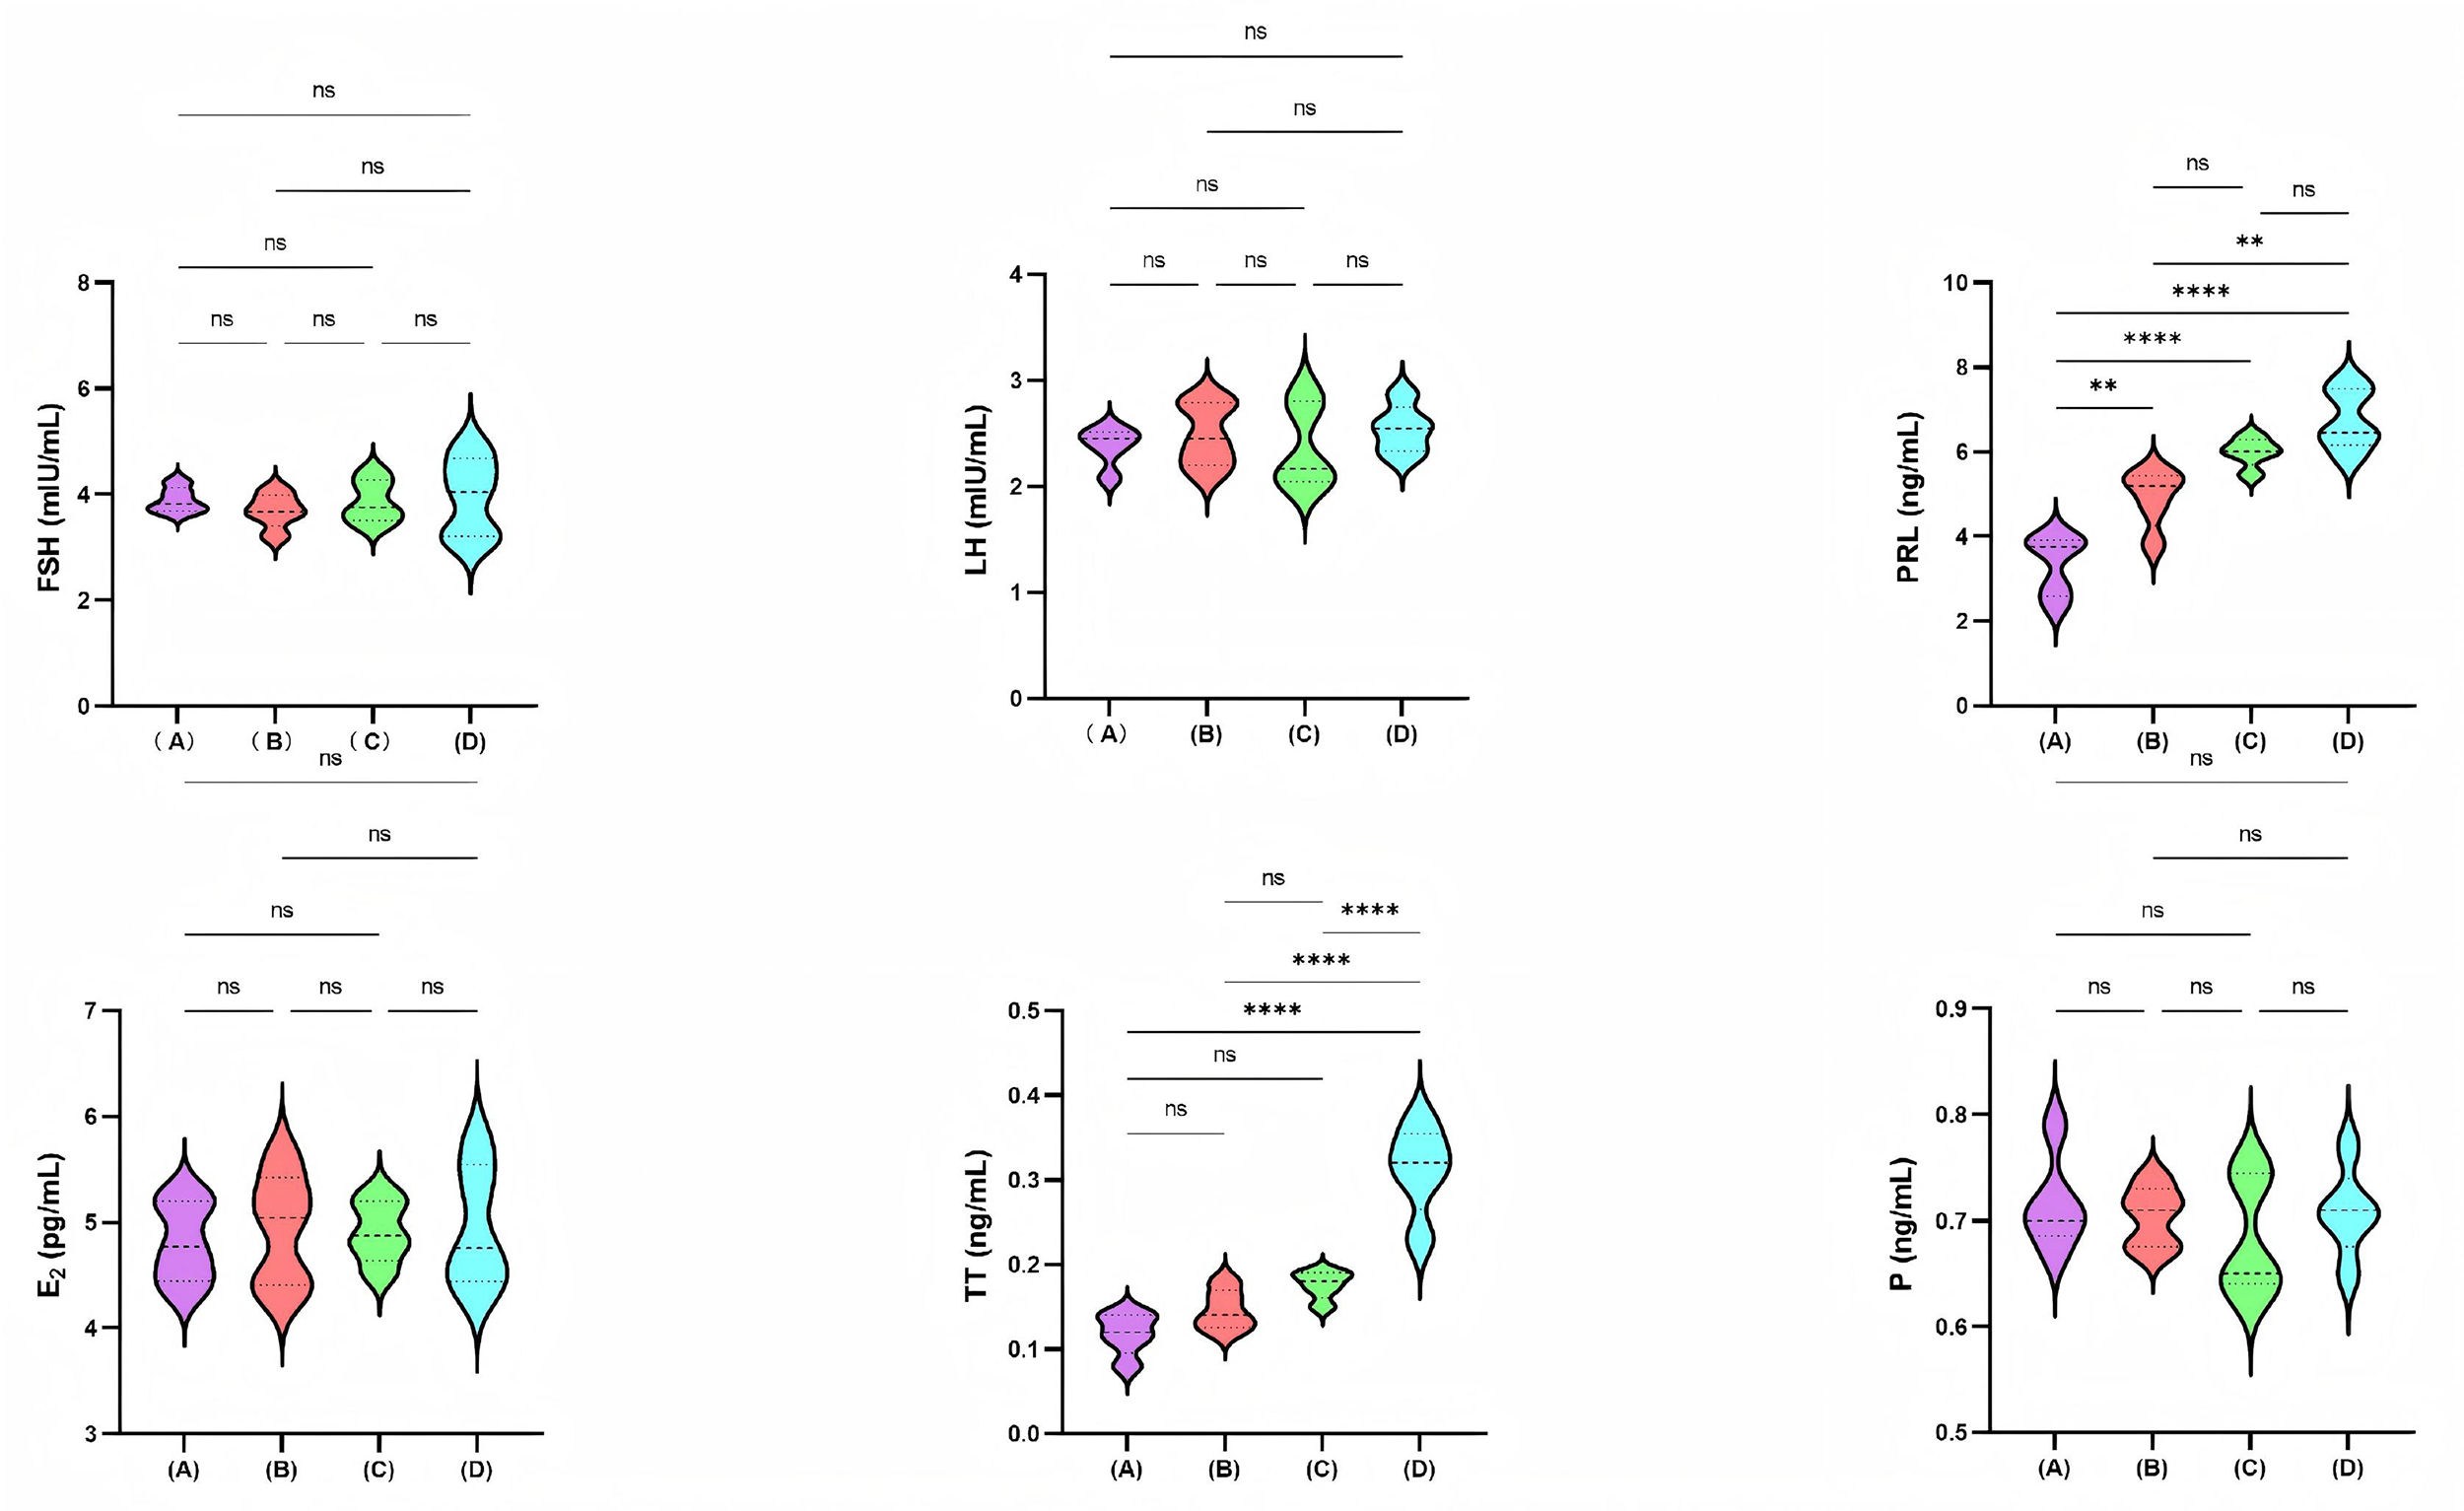 Fig. 1.
Comparison of serum reproductive hormone levels among the four
mice groups. A, Control group; B, Low-dose PFHpA group (0.5 mg/kg/day); C,
Medium-dose PFHpA group (5 mg/kg/day); D, High-dose PFHpA group (50 mg/kg/day). ns: p
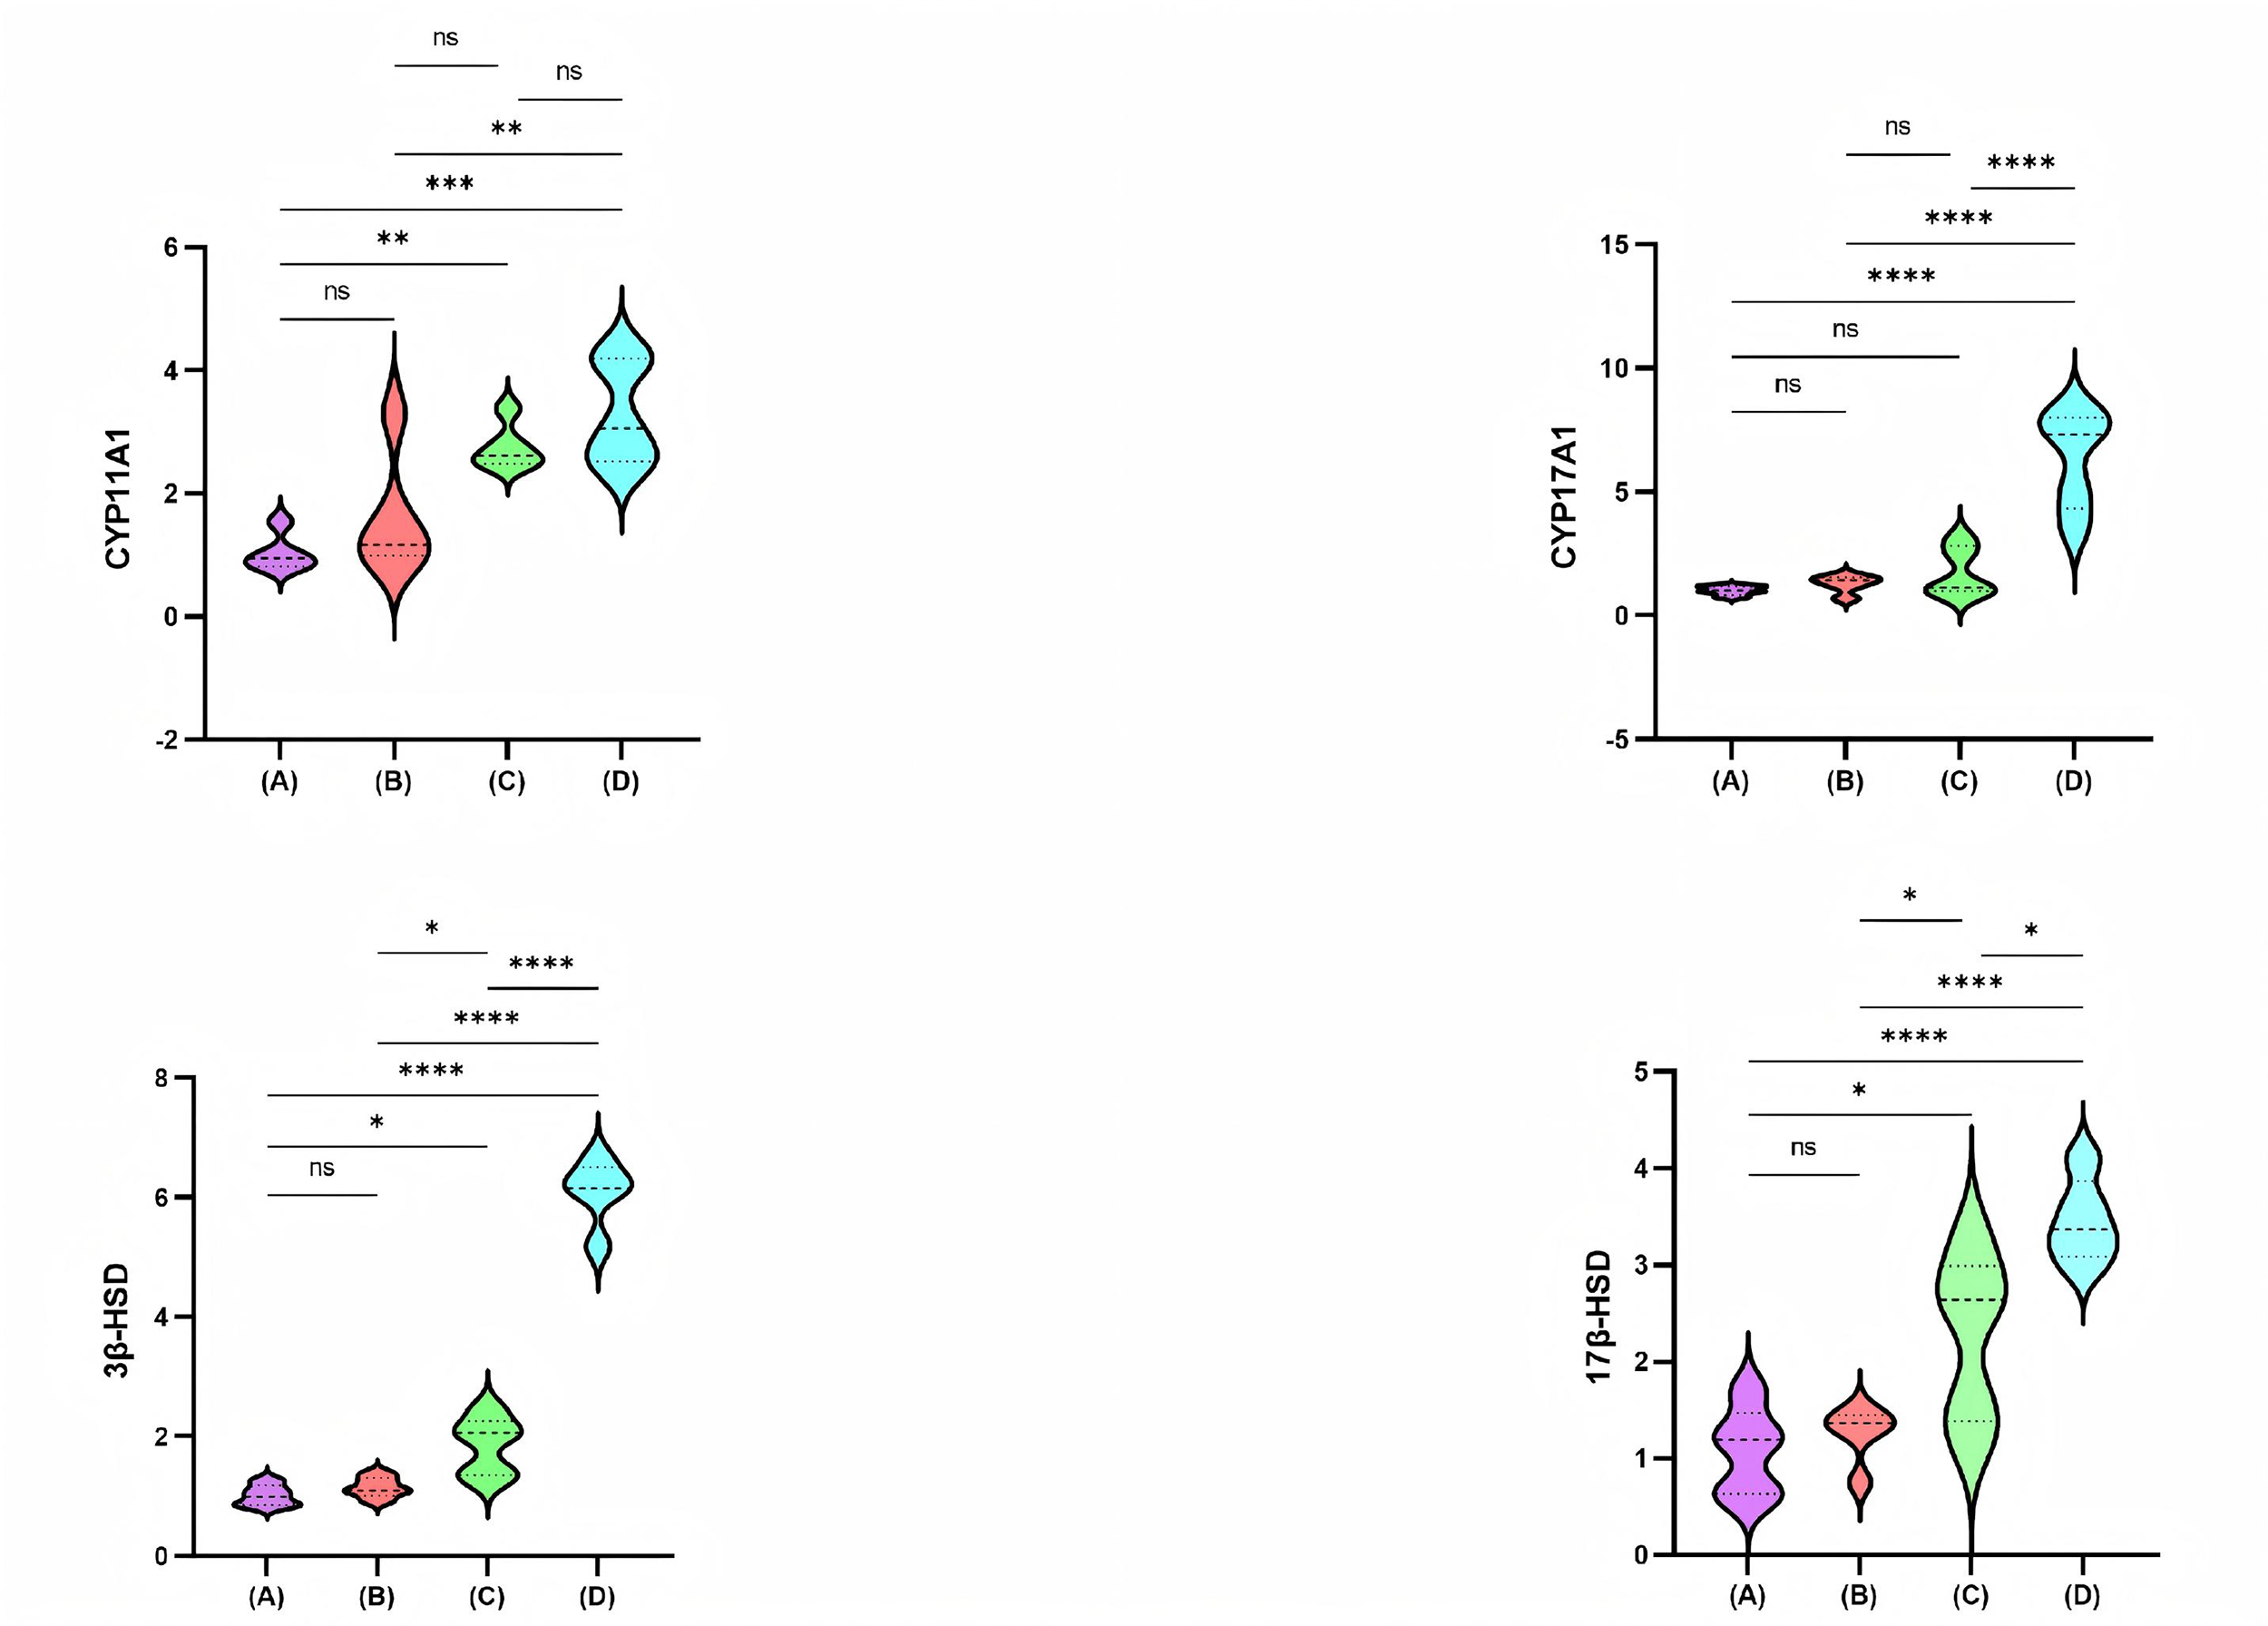
Fig. 2 shows the relative mRNA expression levels of CYP11A1, CYP17A1, 3
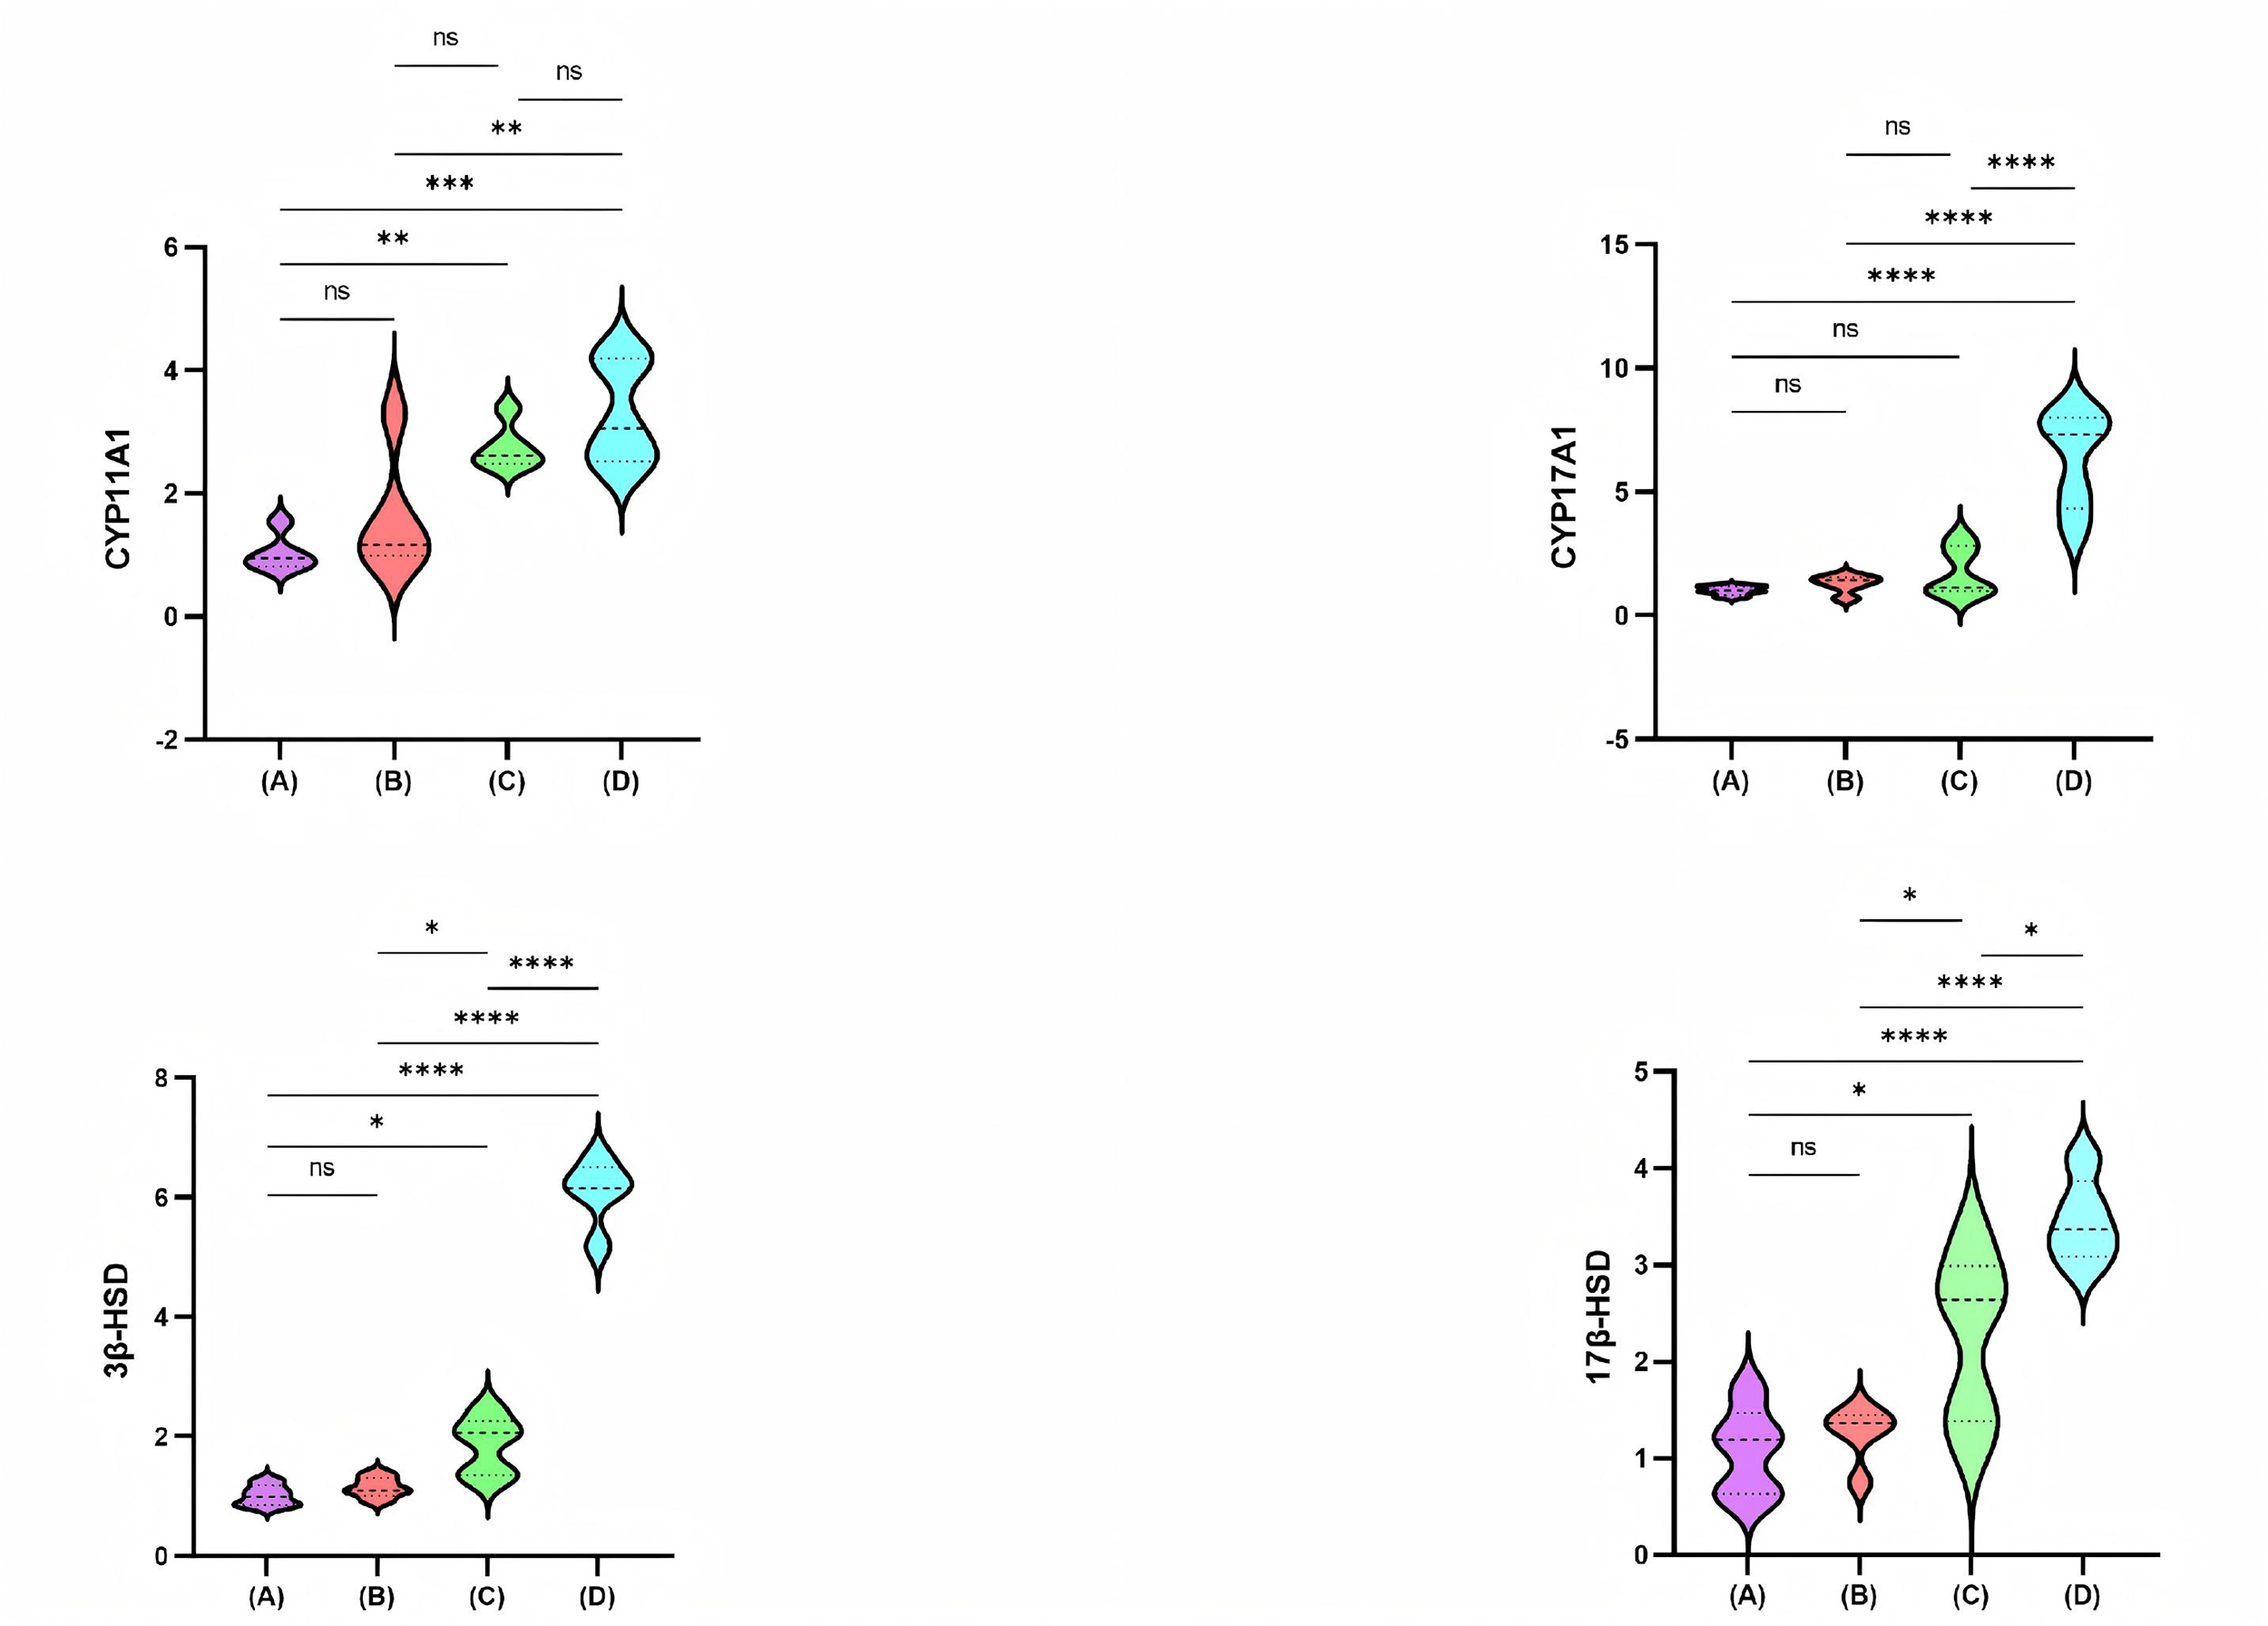 Fig. 2.
Comparison of CYP11A1, CYP17A1, 3
Our findings examined the correlations between PFAS and reproductive hormones in
women of reproductive age. The median concentrations of most PFAS detected in the
serum of these women were lower than those reported in women of the same age
group in other countries and regions of China [26, 27]. We observed a positive
association between exposure to PFHpA and TT levels, with a
PFHpA has emerged in recent years; however, research on its developmental and
reproductive toxicity remains limited. A study involving rats demonstrated that
exposure to PFHpA during puberty reduced the weights of the testes and
epididymis. Furthermore, it induced hyperplasia of Leydig cells, potentially
associated with decreased Bcl-2-associated X protein (BAX) levels, in conjunction
with increased B-cell lymphoma 2 (BCL2) expression and phosphorylation of
Extracellular signal-regulated kinase 1/2 (ERK1/2), c-Jun N-terminal kinase
(JNK), and AKT [22]. Key genes involved in steroidogenesis include CYP17A1,
HSD17B5, and HSD17B6 [37]. A single-nucleotide polymorphism in the
CYP11A gene leads to elevated androgen levels through the LH signaling
pathway [38]. Post-translational modification of the CYP17 gene also
contributes to PCOS [39]. Reducing the expression of the CYP11A1,
CYP17A1, and DENND1A genes decreases androgen production [39].
An in vitro study has shown that various PFAS notably increase the
enzymatic activity of CYP enzymes [40]. In our study, CYP11A1 levels were
significantly higher in the high-dose PFHpA group compared with the control and
low-dose PFHpA groups, with all p-values
Our study has several limitations that warrant acknowledgment. First, reproductive hormone levels are known to fluctuate significantly over time, and these variations can markedly reduce the statistical power required to identify significant differences. Furthermore, the doses of PFHpA administered to the mice in this study were significantly higher than those typically encountered by the general population. This discrepancy may bias the evaluation of the causal relationship between PFHpA exposure and sex hormone levels, underscoring the need for further research.
This study revealed that PFHpA exposure affects TT levels in women of
reproductive age. In female murine models, greater PFHpA exposure was associated
with elevated TT levels. This increase in TT may result from upregulated
expression of several ovarian enzymes, including CYP11A1, CYP17A1,
3
The datasets used and analyzed in this study are available from the corresponding author upon reasonable request.
CYL was responsible for designing the study, conducting sample testing, analyzing data, drafting the original manuscript, and securing funding. ZYW contributed to sample testing, animal experimentation, and drafting the manuscript. HZW and XFF managed patient recruitment and specimen collection. SLZ assisted with data collection and analysis. HY played a key role in study design, data management, revising the manuscript, and obtaining funding. All authors contributed to editorial changes in the manuscript. All authors read and approved the final manuscript. All authors have participated sufficiently in the work and agreed to be accountable for all aspects of the work.
The population study received approval from the Medical Ethics Committee of Hainan Women and Children’s Medical Center (Ethics Number: HNWCMC MEC No. 148 of 2025) in China and was conducted in accordance with the Declaration of Helsinki. Written informed consent for publication was obtained from all participants. All procedures and protocols for the animal experiment were conducted following the requirements of the Animal Care and Use Committee at Hainan Medical University, which approved this study (Ethics Number: HYLL-2024-222). The study was conducted and reported in accordance with the ARRIVE 2.0 guidelines.
Not applicable.
This study received support from the Nanhai Junior Talent Program of the Hainan Provincial Health Commission (NHXX-WJW-2023019), the Excellent Talent Team of Hainan Province (QRCBT202121), and the Hainan Province Clinical Medical Center (QWYH202175).
The authors declare no conflicts of interest.
Supplementary material associated with this article can be found, in the online version, at https://doi.org/10.31083/CEOG48278.
References
Publisher’s Note: IMR Press stays neutral with regard to jurisdictional claims in published maps and institutional affiliations.