

 , Ümmügülsüm Can 2, Mehmet Korkmaz 3, Nur Gözde Kulhan 4, Oğuzhan Günenc 4, Oğuzhan Aksu 5
1 Department of Internal Medicine, Division of Endocrinology and Metabolism, Konya City Hospital, 42200 Konya, Turkey
2 Department of Biochemistry, Konya City Hospital, 42200 Konya, Turkey
3 Department of Internal Medicine, Konya Numune Hospital, 42200 Konya, Turkey
4 Department of Obstetrics and Gynecology, University of Health Sciences, Konya City Hospital, 42200 Konya, Turkey
5 Department of Internal Medicine, Division of Endocrinology and Metabolism, University of Health Sciences, Konya City Hospital, 42200 Konya, Turkey
Abstract
Gestational diabetes mellitus (GDM) is a common pregnancy complication characterized by metabolic stress and mitochondrial dysfunction, for which reliable circulating biomarkers are still lacking. This study aimed to investigate serum mesencephalic astrocyte-derived neurotrophic factor (MANF) and mitochondrial open reading frame of the 12S rRNA-c (MOTS-c) levels in women with GDM and to compare them with levels in healthy pregnant and non-pregnant women. We also sought to identify potential associations with metabolic and demographic parameters.
This prospective cohort study was conducted from January 2025 to May 2025 and enrolled three groups: women with GDM, healthy pregnant women, and healthy non-pregnant women. Age, anthropometric data, and routine biochemical parameters, including fasting glucose, insulin, hemoglobin A1c (HbA1c), alanine aminotransferase (ALT), creatinine, low-density lipoprotein cholesterol (LDL-C), high-density lipoprotein cholesterol (HDL-C) and triglycerides, were assessed. Serum MANF and MOTS-c levels were also measured.
The GDM group was significantly older (33.2 ± 5.6 years) than the healthy pregnant (29.3 ± 4.5 years) and non-pregnant control groups (28.6 ± 5.2 years) (p = 0.011). MANF levels were significantly lower in pregnant women compared with controls (p < 0.001), whereas MOTS-c levels were significantly higher (p < 0.001). Receiver operating characteristic (ROC) analysis demonstrated limited discriminatory ability of MANF (area under the curve [AUC] = 0.567, p = 0.301) and MOTS-c (AUC = 0.604, p = 0.111) in distinguishing women with GDM from healthy pregnant women. Furthermore, within the GDM group, MANF and MOTS-c levels were not associated with age, height, weight, body mass index (BMI), waist circumference, glucose, insulin, Homeostasis Model Assessment of Insulin Resistance (HOMA-IR), lipid profile, or liver enzyme levels.
This study shows that MOTS-c levels increase and MANF levels decrease during pregnancy, but neither is associated with GDM, indicating pregnancy-related metabolic changes rather than GDM-specific alterations. Although they are not useful for GDM diagnosis, these peptides may provide insight into novel metabolic pathways and hold therapeutic potential in high-risk pregnancies.
The study has been registered on https://zenodo.org/ (registration link: https://doi.org/10.5281/zenodo.18776009).
Keywords
- pregnancy
- gestational diabetes
- mitochondrial proteins
- biomarkers
- metabolism
As a pregnancy-induced metabolic condition, gestational diabetes mellitus (GDM) represents one of the most prevalent complications of gestation, with incidence rates varying from 1% to 20% across global populations [1, 2]. This wide variation is attributed to differences in diagnostic criteria and population characteristics [1, 2]. GDM is associated with increased odds of maternal and fetal complications, including macrosomia, neonatal hypoglycemia, preeclampsia, and cesarean delivery [3]. Women diagnosed with GDM face a significantly higher likelihood of developing type 2 diabetes mellitus (T2DM) following delivery [4]. In a meta-analysis of observational studies, the cumulative incidence of type 2 diabetes over 10 years was 16% in women with gestational diabetes and 2% in women without gestational diabetes [5]. The pathogenesis of GDM is multifactorial. Recent studies suggest that molecular mechanisms such as endoplasmic reticulum stress and mitochondrial dysfunction may further contribute to GDM development [6, 7].
Mesencephalic astrocyte-derived neurotrophic factor (MANF), initially identified
as a protein supporting neuronal survival, has since been shown to be involved in
pancreatic
Mitochondrial open reading frame of the 12S rRNA-c (MOTS-c), a mitochondrial-encoded peptide derived from the 12S rRNA region, plays a significant role in modulating metabolic processes [12]. MOTS-c enhances insulin sensitivity and may be protective against obesity and T2DM. In animal models, MOTS-c was suggested to ameliorate fat diet-induced insulin resistance and obesity by stimulating the AMP-activated protein kinase (AMPK) pathway [12]. In humans, MOTS-c levels have been found to be lower among obese individuals and can increase with exercise [13]. Although several studies have observed lower circulating MOTS-c levels in GDM patients relative to normoglycemic pregnant controls [14, 15], data on this association remains limited, and comprehensive analyses are lacking.
Limited data exist on the potential roles of MANF and MOTS-c in pregnancy and GDM. We aimed to compare serum MANF and MOTS-c levels among pregnant women with and without GDM and in healthy non-pregnant women of reproductive age.
This prospective cohort study was carried out at Konya City Hospital, Konya,
Turkey, between January 2025 and May 2025. The study population comprised three
groups: (1) pregnant women aged 18–35 years diagnosed with GDM at our Obstetrics
and Gynecology Polyclinic; (2) reproductive-aged (18–35 years) non-GDM pregnant
women; and (3) healthy, non-pregnant women of reproductive age (18–35 years)
without active metabolic, inflammatory, or endocrine disorders, recruited from
the Endocrinology and Diet Polyclinics—excluding those with body mass index
(BMI)
Exclusion criteria for pregnant women encompassed pre-pregnancy diabetes, twin or multiple pregnancies, complicated pregnancies [e.g., preeclampsia, eclampsia, hemolysis, elevated liver enzymes, and low platelet count (HELLP) syndrome], thyroid dysfunction requiring medication, inflammatory diseases (e.g., systemic lupus erythematosus, Crohn’s disease), cancer, active infections, or unavailability of laboratory data.
All pregnant women and the healthy control group were consecutively identified
among individuals applied to Konya City Hospital. Gestational diabetes mellitus
was diagnosed through standardized screening methodology utilizing the 75-gram
oral glucose tolerance test, with diagnostic confirmation based on established
plasma glucose values: fasting levels
Demographics, weight, height, and waist circumference were obtained. Weight and height were measured using calibrated clinical scales during hospital visits. Waist circumference was determined with a non-elastic tape at the midpoint between the lower rib and iliac crest. The BMI for each subject was determined using the equation BMI = weight (kg) / [height (m)]2.
Fasting blood samples (8–12 hours) were collected in serum separator tubes during routine clinical evaluations. After centrifugation (3000 rpm, 10 minutes), serum aliquots were stored at –80 °C. Residual samples from routine tests were used to measure MANF and MOTS-c levels to avoid additional blood draws.
Biochemical analyses included fasting glucose (mg/dL), hemoglobin A1c (HbA1c,
%), insulin (µIU/mL), creatinine (mg/dL), alanine aminotransferase (ALT,
U/L), triglycerides (mg/dL), high-density lipoprotein cholesterol (HDL-C, mg/dL),
low-density lipoprotein cholesterol (LDL-C, mg/dL). All quantifications were
performed using automated clinical chemistry analyzers (e.g., Roche
Cobas®, Mannheim, Germany or Abbott Architect®,
Abbott Park, IL, USA) in our biochemistry laboratory, which is an accredited
laboratory. The Homeostasis Model Assessment of Insulin Resistance (HOMA-IR) was
employed to quantify insulin resistance using the following formula: HOMA-IR =
[fasting glucose (mg/dL)
Stored serum samples were thawed and analyzed for MANF and MOTS-c levels using commercial enzyme-linked immunosorbent assay (ELISA) kits (catalog no: ELK10529 and ELK7627, ELK Biotechnology, Wuhan, Hubei, China), following manufacturer protocols. Sample absorbance was quantified using a calibrated microplate reader, with analyte concentrations determined from standard curve regression analysis.
All analyses were conducted using IBM SPSS version 27.0 (IBM Corp., Armonk, NY,
USA), with a significance threshold of 5% alpha error (two-tailed; p
In addition, analysis of covariance (ANCOVA) was applied, when appropriate, to compare biomarker levels between groups while controlling for age as a covariate.
Women in the GDM group (n = 40) were significantly older (33.2
| Healthy controls (n = 29) | Healthy pregnant women (n = 40) | Gestational diabetes mellitus (n = 40) | p | |
| Age, years | 27 (24–32) | 26 (23–31) | 31 (27–35)# | 0.011§ |
| Weight, kg | 61.0 (55.0–72.0) | 73.0 (61.5–84.5)* | 76.0 (66.5–88.0)* | |
| Height, m | 1.66 |
1.61 |
1.59 |
|
| Body mass index, kg/m2 | 22.04 (20.70–24.68) | 27.76 (23.83–33.69)* | 30.37 (27.03–35.00)* | |
| Waist circumference, cm | 72 (68–82) | 99 (93–111)* | 105 (97–112)* | |
| MANF, pg/mL | 341.62 (241.79–423.44) | 13.96 (7.89–34.65)* | 10.04 (7.73–21.60)* | |
| MOTS-c, ng/mL | 52.67 (35.22–74.54) | 137.80 (121.00–152.40)* | 131.85 (116.60–142.95)* | |
| HbA1c, % | 5.15 |
4.99 |
5.48 |
|
| Glucose, mg/dL | 84 (78–92) | 77 (70–83)* | 89.5 (81–100)# | |
| Insulin, μIU/mL | 7.28 (5.32–11.00) | 9.85 (5.44–32.10) | 10.30 (7.10–15.80) | 0.095§ |
| HOMA-IR | 1.51 (1.16–2.23) | 1.88 (1.02–6.51) | 2.34 (1.24–3.89) | 0.127§ |
| TyG | 7.87 (7.67–8.10) | 8.9 (8.55–9.19)* | 9.08 (8.85–9.35)* | |
| SPISE | 8.52 (7.03–9.62) | 5.27 (3.92–6.99)* | 4.47 (3.86–5.53)* | |
| LDL-C, mg/dL | 93.0 (82.0–105.0) | 123.5 (104.5–142.5)* | 123.5 (103.5–160.5)* | |
| HDL-C, mg/dL | 54.59 |
65.13 |
57.83 |
0.006† |
| Triglyceride, mg/dL | 69 (52–83) | 193 (139–241.5)* | 225.5 (151–292)* | |
| ALT, U/L | 13.0 (10.0–15.0) | 14.5 (12.0–17.5) | 13.0 (9.0–17.0) | 0.095§ |
| Creatinine, mg/dL | 0.67 (0.64–0.72) | 0.48 (0.43–0.53)* | 0.46 (0.42–0.54)* |
Descriptive statistics are presented using mean
†One-way analysis of variance (ANOVA), *Significantly
different from “Healthy controls”; #Significantly different from
“Healthy pregnants”; §Kruskal-Wallis test. Statistically significant p values
Abbreviations: ALT, alanine aminotransferase; HbA1c, hemoglobin A1c; HDL-C, high-density lipoprotein cholesterol; HOMA-IR, Homeostasis Model Assessment of Insulin Resistance; SPISE, Single Point Insulin Sensitivity Estimator; TyG, triglyceride–glucose index; LDL-C, low-density lipoprotein cholesterol; MANF, mesencephalic astrocyte-derived neurotrophic factor; GDM, gestational diabetes mellitus; BMI, body mass index; MOTS-c, mitochondrial open reading frame of the 12S rRNA-c.
The TyG was lowest in healthy controls 7.87 and significantly higher in both
healthy pregnant women 8.90 and women with GDM 9.08 (overall p
Similarly, the SPISE index differed significantly among groups (overall
p
In contrast, HOMA-IR showed a stepwise numerical increase from healthy controls 1.51 to healthy pregnant women 1.88 and women with GDM 2.34, but this trend did not reach statistical significance (p = 0.127) (Table 1).
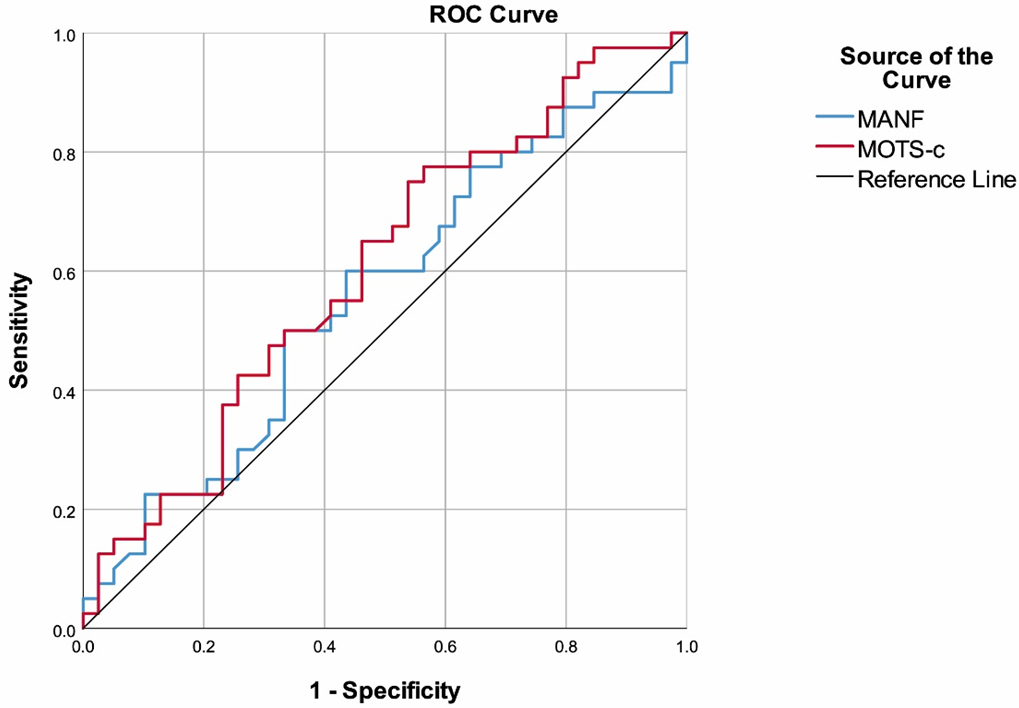
The ability of MANF to differentiate between GDM and healthy pregnant women showed an area under the curve (AUC) of 0.567 (95% CI: 0.441–0.694), which was not statistically significant (p = 0.301). Similarly, MOTS-c demonstrated an AUC of 0.604 (95% CI: 0.479–0.729) without significance (p = 0.111) (Fig. 1, Table 2). These low AUC values suggest that MANF and MOTS-c have limited discriminatory performance and are not reliable diagnostic biomarkers for GDM.
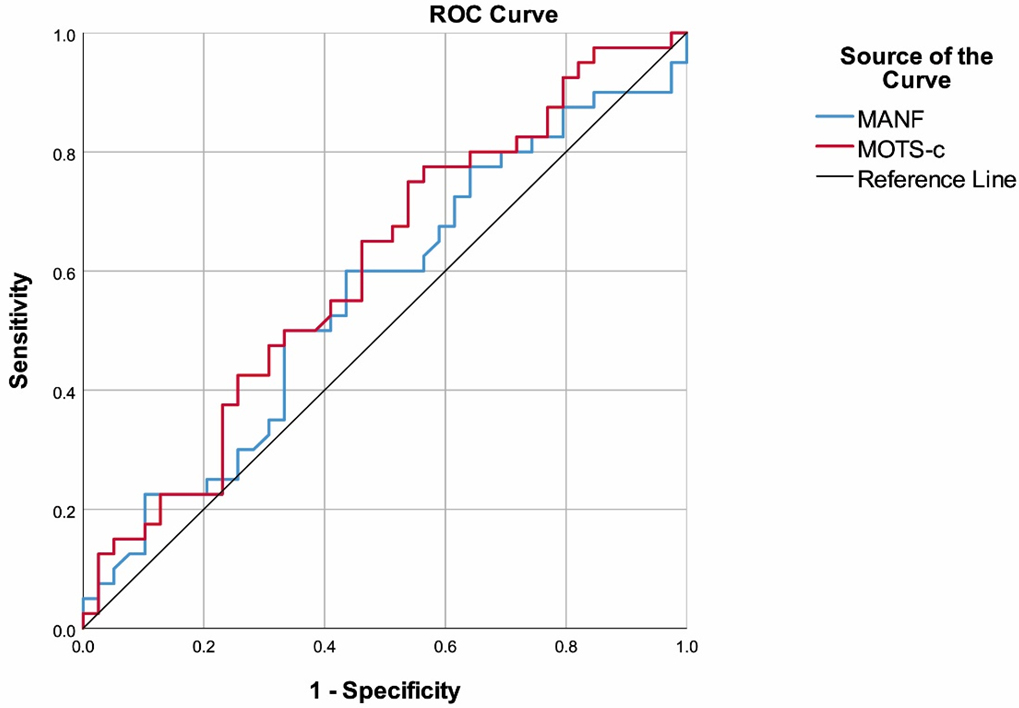 Fig. 1.
Receiver operating characteristic (ROC) curves of MANF and MOTS-c for discriminating gestational diabetes mellitus from healthy pregnant women. ROC analyses were performed using GDM as the positive state variable. The diagonal line represents the line of no discrimination (AUC = 0.5). Corresponding AUC values with 95% confidence intervals are presented in Table 2.
| AUC (95% CI) | p | |
| MANF | 0.567 (0.441–0.694) | 0.301 |
| MOTS-c | 0.604 (0.479–0.729) | 0.111 |
Abbreviations: AUC, area under the curve.
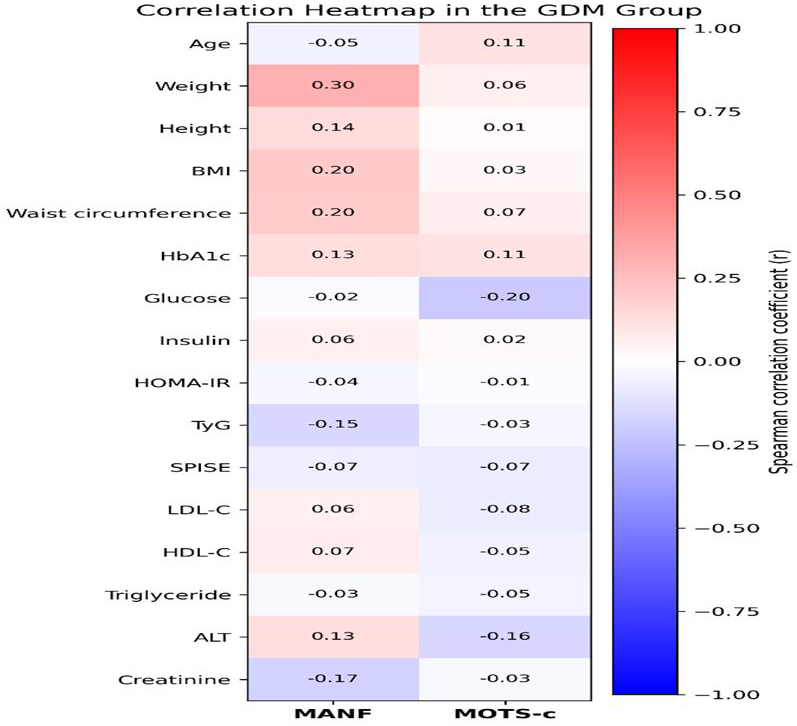
We performed correlation analyses within the GDM group to evaluate associations between MANF and MOTS-c levels and other clinical characteristics, and the resulting correlation patterns are presented numerically in Table 3 and graphically in a heatmap (Fig. 2). None of the analyses showed any relationships, including weight, height, BMI, waist circumference, HbA1c, glucose, insulin, HOMA-IR, TyG, SPISE, LDL-C, HDL-C, triglycerides, ALT and creatinine.
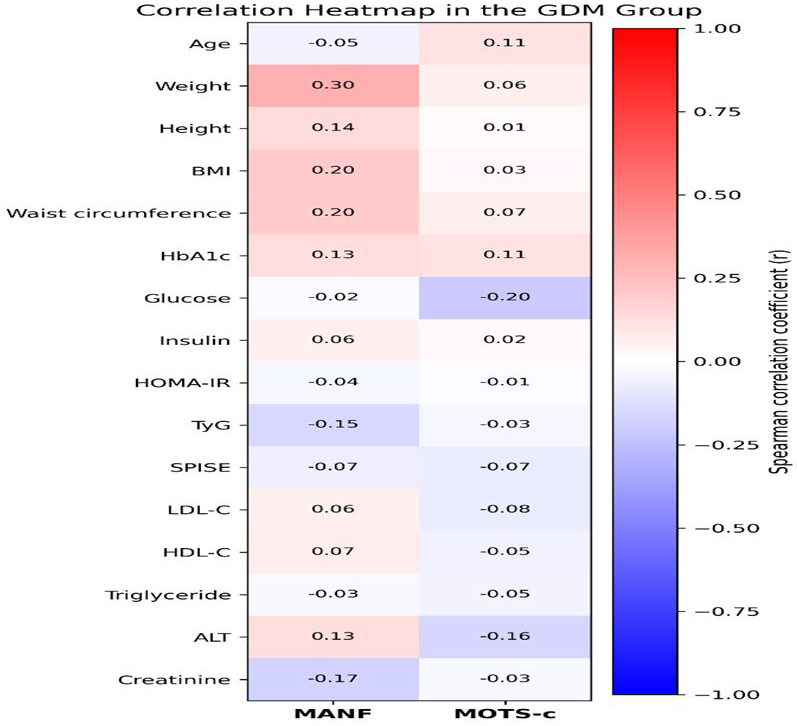 Fig. 2.
Heatmap representation of Spearman correlation coefficients between circulating MANF and MOTS-c levels and clinical/metabolic parameters in the GDM group. Each cell displays the correlation coefficient (r), rounded to two decimal places for visualization purposes; exact numerical values are provided in Table 3. The color scale ranges from blue (negative correlation) to red (positive correlation), with white indicating weak or no correlation. Overall, correlations between biomarkers and metabolic variables were weak.
| Gestational diabetes mellitus (n = 40) | |||
| MANF | MOTS-c | ||
| MANF | r | - | –0.184 |
| p | - | 0.254 | |
| Age | r | –0.052 | 0.114 |
| p | 0.750 | 0.482 | |
| Weight | r | 0.305 | 0.055 |
| p | 0.056 | 0.736 | |
| Height | r | 0.140 | 0.014 |
| p | 0.390 | 0.930 | |
| Body mass index | r | 0.205 | 0.025 |
| p | 0.204 | 0.877 | |
| Waist circumference | r | 0.200 | 0.066 |
| p | 0.228 | 0.694 | |
| HbA1c | r | 0.127 | 0.114 |
| p | 0.436 | 0.485 | |
| Glucose | r | –0.017 | –0.205 |
| p | 0.919 | 0.216 | |
| Insulin | r | 0.062 | 0.016 |
| p | 0.709 | 0.921 | |
| HOMA-IR | r | –0.035 | –0.009 |
| p | 0.836 | 0.956 | |
| TyG | r | –0.152 | –0.034 |
| p | 0.363 | 0.837 | |
| SPISE | r | –0.065 | –0.073 |
| p | 0.688 | 0.656 | |
| LDL-C | r | 0.062 | –0.077 |
| p | 0.705 | 0.635 | |
| HDL-C | r | 0.072 | –0.049 |
| p | 0.659 | 0.766 | |
| Triglyceride | r | –0.030 | –0.046 |
| p | 0.855 | 0.777 | |
| ALT | r | 0.131 | –0.159 |
| p | 0.421 | 0.328 | |
| Creatinine | r | –0.174 | –0.025 |
| p | 0.283 | 0.877 | |
Abbreviations: r, Spearman correlation coefficient.
Binary logistic regression analyses were performed to evaluate whether MOTS-c
was independently associated with pregnancy and GDM after adjustment for age. In
the first model (pregnant vs. non-pregnant women), MOTS-c remained an independent
predictor of pregnancy (OR = 1.091, 95% CI: 1.045–1.139, p
Our findings demonstrating significant differences in TyG and SPISE across study groups are consistent with previous reports showing that these indices correlate with HOMA-IR as surrogate markers of insulin sensitivity. In line with our results, Sağnıç et al. [18] reported that although the TyG index differed between pregnant and non-pregnant women, its diagnostic performance in distinguishing GDM from normoglycemic pregnancies was limited, suggesting that TyG mainly reflects physiological pregnancy-related insulin resistance rather than GDM-specific metabolic dysfunction. Similarly, in our cohort, both indices showed low sensitivity for GDM, indicating limited utility as stand-alone screening tools but potential value for excluding adverse metabolic profiles. Although SPISE has been shown to predict cardiovascular outcomes in type 2 diabetes and proposed for population screening [19, 20], we observed significantly lower SPISE values in pregnant women regardless of GDM status, implying that it captures gestational metabolic adaptation rather than GDM itself. In contrast, HOMA-IR did not differ between groups, supporting previous evidence that insulin-based indices are constrained in pregnancy due to physiological hyperinsulinemia and hormonal effects [21].
Our findings revealed that, irrespective of GDM status, pregnant women exhibited significantly lower MANF and higher MOTS-c levels compared with non-pregnant controls, while neither biomarker discriminated between GDM and normoglycemic pregnancies. No significant correlations were observed between MANF/MOTS-c and demographic, anthropometric, or metabolic parameters in women with GDM.
MOTS-c is known to enhance insulin sensitivity and protect against obesity and insulin resistance in experimental models [12, 22], and reduced circulating levels have been reported in obesity, insulin resistance, and both type 1 and type 2 diabetes [23, 24, 25]. Exercise-induced MOTS-c expression further supports its role in metabolic regulation [26]. An experimental study has also demonstrated protective effects of MOTS-c in autoimmune diabetes through modulation of T-cell function and mTORC1 signaling [13].
Despite this established metabolic role, the involvement of MOTS-c in GDM remains unclear. In our study, MOTS-c levels were significantly higher in both GDM and non-GDM pregnancies compared with non-pregnant controls; however, ROC analysis demonstrated limited discriminatory ability for GDM (AUC = 0.604, 95% CI crossing 0.50), indicating that MOTS-c cannot serve as a reliable standalone diagnostic biomarker. Furthermore, MOTS-c levels were not associated with any metabolic indices in women with GDM.
In contrast to our findings, previous Turkish and Chinese studies reported significantly lower MOTS-c levels in GDM, with inverse correlations to glucose and obesity-related parameters [14, 15]. This discrepancy may reflect differences in gestational timing, population characteristics, or threshold-dependent regulatory mechanisms. However, our findings indicate that MOTS-c levels are closely linked to the physiological state of pregnancy rather than GDM-specific pathology, suggesting a potential role in gestational metabolic adaptation, possibly as a compensatory response to pregnancy-induced metabolic stress [27, 28]. In this respect, our study contributes to the existing literature by characterizing baseline MOTS-c patterns in normal pregnancy and provides a contextual framework for interpreting MOTS-c alterations observed in GDM. Although MOTS-c has demonstrated therapeutic potential in experimental models [14], its limited diagnostic utility in our cohort parallels the constraints reported for other proposed biomarkers [29].
MANF, a protein critical in endoplasmic reticulum stress response and metabolic
regulation, has demonstrated protective effects against
Although our study fills an important gap in knowledge, the single-center design and small sample size may restrict the generalizability of the findings, particularly given the heterogeneous nature of metabolic adaptations in pregnancy. The inclusion of non-pregnant controls and comparison of pregnant women with and without GDM adds considerable value, but the smaller size of this group may reduce statistical power (considering that subtle changes may be critical in GDM pathophysiology). Moreover, our sampling strategy may have introduced selection bias. For instance, the age demonstrated a significant difference between groups, with the GDM group being significantly older than the other two. The longitudinal tracking of MOTS-c and MANF levels from pre-pregnancy through postpartum periods would provide much-needed data to this topic. The lack of mechanistic data (e.g., tissue-specific expression, endoplasmic reticulum stress markers) further limits our ability to interpret the functional significance of changes in MOTS-c/MANF. Future multicenter studies with serial measurements are needed to validate these preliminary observations and explore underlying pathways.
This study has several limitations. First, detailed dietary intake and physical activity levels were not systematically assessed. Given that both nutritional status and exercise have been shown to influence metabolic pathways and stress-responsive peptides, including MANF and MOTS-c, unmeasured variability in these factors may have affected circulating biomarker levels. Second, the markedly lower MANF concentrations observed in pregnant women may, at least in part, reflect physiological plasma volume expansion during pregnancy, which can lead to dilution of circulating proteins. As hematocrit or plasma volume markers were not available for adjustment, a dilutional effect cannot be excluded. Finally, the relatively modest sample size within each group may have limited the statistical power to detect subtle between-group differences, particularly between women with GDM and healthy pregnant controls. Accordingly, our findings should be interpreted with caution and warrant confirmation in larger, prospectively designed cohorts incorporating comprehensive lifestyle assessments. Additionally, the relatively low AUC values observed in the ROC analyses indicate limited diagnostic discrimination of these biomarkers for GDM, which should be considered when interpreting their clinical applicability.
This study demonstrates pregnancy-associated changes in circulating MOTS-c and MANF levels and indicates that GDM itself does not exert an additional effect on these parameters. In addition, TyG and SPISE indices differed significantly between pregnant and non-pregnant women but showed limited sensitivity for GDM, supporting the notion that these indices primarily reflect physiological gestational insulin resistance rather than GDM-specific metabolic dysfunction. Despite statistically significant group differences and independent associations observed in regression models, neither MANF nor MOTS-c exhibited sufficient discriminatory power for GDM, with AUC values close to chance. This apparent discrepancy highlights the distinction between statistical association and diagnostic performance, whereby a biomarker may be related to disease risk yet lack adequate classification accuracy. Accordingly, MANF and MOTS-c are unlikely to serve as standalone diagnostic biomarkers for GDM, although they may provide insight into pregnancy-related metabolic adaptation. Future confirmation of these findings will require larger, well-characterized human cohorts, including appropriately matched control groups and longitudinal assessment of MOTS-c and MANF across gestation.
The anonymized dataset generated during this study is publicly available in the Zenodo repository at https://doi.org/10.5281/zenodo.18776009 in accordance with the journal’s data sharing policy.
HÇB: writing – review & editing, methodology, formal analysis, data curation, conceptualization. ÜC: formal analysis, data curation. MK: data curation. NGK: formal analysis, data curation. OG: formal analysis, data curation. OA: writing – review & editing, methodology, formal analysis, conceptualization. All authors contributed to critical revision of the manuscript for important intellectual content. All authors read and approved the final manuscript. All authors have participated sufficiently in the work and agreed to be accountable for all aspects of the work.
The study adhered to the ethical principles of the Helsinki Declaration and received approval from the Non-Interventional Clinical Research Ethics Committee of Konya City Hospital (Approval number: 2025/34). Written informed consent was obtained from all participants prior to sample collection. Residual blood samples were anonymized to protect participant confidentiality, and analyses were conducted using de-identified data.
Not applicable.
This research received no external funding.
The authors declare no conflicts of interest.
Supplementary material associated with this article can be found, in the online version, at https://doi.org/10.31083/CEOG47924.
References
Publisher’s Note: IMR Press stays neutral with regard to jurisdictional claims in published maps and institutional affiliations.