



1 Hangzhou Normal University, 31112 Hangzhou, Zhejiang, China
2 Department of Obstetrics, Yongkang Hospital of Traditional Chinese Medicine, 321300 Yongkang, Zhejiang, China
Abstract
Surgery for deep infiltrating endometriosis (DIE) is complex, and current clinical imaging has limited ability to identify and stratify atypical lesions. The kynurenine/tryptophan ratio (KTR) reflects immunometabolic activation, and matrix metalloproteinase-9 (MMP-9) is associated with tissue invasion.
This was a single-center prospective study, with pathology as the gold standard. Three analysis populations were defined. KTR was measured by liquid chromatography-tandem mass spectrometry (LC-MS/MS), and MMP-9 by immunohistochemistry (IHC) derived histochemical score (H-score). Multivariable regression, DeLong comparison, calibration and decision curves, and nested F test were used.
Compared with controls, KTR differed in the DIE and non-DIE groups, with β_diff = 0.28/0.15 (both p_adj < 0.05). Each 1 SD increase in natural log transformed KTR (lnKTR) was associated with higher ENZIAN stage (OR_perSD = 1.62, p < 0.001). After KTR was added to the baseline model, the area under the receiver operating characteristic curve (AUC) increased from 0.79 to 0.83 (ΔAUC = 0.04, 95% CI: 0.02–0.07, p = 0.003). Net benefit increased across the 10%–30% threshold range, and calibration improved from α = –0.127, β = 0.861 to α = –0.039 and β = 0.946. Among imaging suspected but atypical subjects, net correct reclassification was +14 for events and +17 for non-events. KTR was independently and positively associated with MMP-9 (β_std = 0.29, 95% CI: 0.15–0.43, p < 0.001), with ΔR2 = 0.04 (F = 11.882, p < 0.001).
KTR provides an independent and translatable diagnostic increment on current pathways and is associated with eutopic endometrial MMP-9, supporting coupling between systemic immunometabolism and local remodeling. These findings support its use for preoperative stratification and optimization of surgical planning.
Keywords
- deep infiltrating endometriosis
- kynurenine/tryptophan ratio
- diagnostic gain
- MMP-9
Endometriosis is a common chronic disease in women of reproductive age, and the deep infiltrating subtype represents a high burden phenotype with marked invasiveness, increased complications, and greater surgical complexity [1, 2]. Current diagnosis and treatment rely on symptoms, clinical examination, transvaginal ultrasound (TVUS), and magnetic resonance imaging (MRI). However, detection of lesions in complex locations or with atypical features remains unstable, and serum carbohydrate antigen 125 (CA-125) shows limited discriminative ability for phenotype and depth of infiltration [3]. Histologically, matrix metalloproteinase-9 (MMP-9) mediates extracellular matrix degradation and fibrotic remodeling and is considered with a marker of tissue infiltration [4]. In terms of immunometabolism, interferon-related pathways can activate the kynurenine pathway by directing tryptophan through indoleamine 2,3-dioxygenase and tryptophan 2,3-dioxygenase. Kynurenine, together with aryl hydrocarbon receptor (AhR) signaling, is hypothesized to contribute to tissue invasion [5]. The plasma kynurenine/tryptophan ratio (KTR) provides a systemic measure of this pathway has potential as an easily accessible biomarker [6]. Serologic studies targeting the deep infiltrating subtype mostly adopt cross-sectional designs and report receiver operating characteristic (ROC) curves for single biomarkers. They rarely evaluate the independent incremental value beyond real-world clinical and imaging pathways and generally lack evidence of clinical net benefit demonstrated by reclassification or decision curve analysis. A pervious study has inadequately controlled key confounders, such as menstrual cycle, exogenous hormones, inflammation, and renal function, and often provide incomplete pre-analytical and laboratory quality-control (QC) information, limiting their generalizability [7]. Key gaps remain regarding whether, under standardized procedures, kynurenine pathway markers show gradient associations with phenotype and infiltration load, whether they provide calibratable incremental value with net benefit beyond a baseline model composed of symptoms, signs, CA-125, and imaging [8], and whether systemic markers are independently associated with MMP9 in the eutopic endometrium at the individual level. These key gaps limit effective preoperative stratification and surgical planning [9]. In this single-center prospective study, we aimed to clarify the gradient association of the plasma KTR with the phenotype and infiltration load of deep infiltrating endometriosis (DIE) based on existing clinical and imaging pathways, to evaluate its independent incremental contribution to diagnostic performance, and to explore its relationship with MMP-9 expression in the eutopic endometrium. Using rigorous pre-analytical procedures and laboratory validation, plasma KTR was quantified by liquid chromatography-tandem mass spectrometry (LC-MS/MS). A baseline prediction model including symptoms, signs, CA-125, and imaging indicators was constructed, and discrimination, calibration, reclassification, and decision curve analyses were used to evaluate the diagnostic gain provided by KTR. MMP-9 expression in the eutopic endometrium was quantified by immunohistochemistry (IHC), and multivariable regression together with robustness checks was used to examine the association between the systemic immunometabolic marker to local matrix remodeling. The results showed that KTR provided quantifiable diagnostic information with clinical net benefit on top of the existing pathway and was independently and positively associated with MMP-9 expression in the eutopic endometrium, providing an actionable biological basis for preoperative risk stratification and kynurenine pathway-targeted precision interventions.
This study was a single-center, prospective, diagnostic gain evaluation with paired histological correlation. The primary objective was to assess the independent incremental value of the plasma KTR for the diagnosis and preoperative stratification of DIE beyond a baseline pathway comprising symptoms, clinical signs, CA-125, and imaging. The paired analysis of eutopic endometrial MMP-9 expression aimed to provide evidence of biological plausibility for KTR as an auxiliary biomarker, rather than a systematic investigation of pathogenesis.
Participants were consecutively enrolled along the clinical pathway. All testing
was completed before surgery and pathological determination, and the study team
maintained mutual blinding across all components. Ethical approval was obtained
prior to study initiation (Approval No. KT2022062), and all participants provided
written informed consent. Participants were enrolled from January 1, 2023 to
December 31, 2024, and the data were finalized on March 31, 2025. Sample size was
pre-calculated based on two primary objectives. Objective 1 considered the
difference in the area under the receiver operating characteristic curve (AUC)
for KTR added to the “baseline model” (DeLong method, two-sided
The study population consisted of women of reproductive age scheduled to undergo
laparoscopy or laparotomy. Inclusion criteria: age 18–50 years; planned
determination of the presence or absence of endometriosis in the current surgery;
completion of symptom quantification, pelvic imaging, and blood sampling before
surgery; and consent to obtain eutopic endometrial samples at surgery. Exclusion
criteria: fever or active infection within the past four weeks; use of systemic
glucocorticoids or immunosuppressants within two weeks before surgery; chronic
renal insufficiency [estimated glomerular filtration rate (eGFR)
This study used surgical exploration combined with histopathological examination
as the gold standard. Participants were classified by lesion type into three
mutually exclusive study groups: ① DIE group: suspicious lesions were
found during surgery in deep structures such as the uterosacral ligaments,
rectovaginal septum, vaginal fornix, bladder, and bowel wall; histopathology
confirmed the presence of endometrial-like glands and/or stroma, and the lesions
involved subperitoneal tissue with an infiltration depth
All pathological slides were independently reviewed by two senior pathologists blinded to the KTR results, and any discrepancies were resolved by discussion to reach consensus. The primary outcome was the presence or absence of DIE (binary), which was used for diagnostic modeling and gain analyses. At the same time, based on surgical records and imaging data, trained investigators completed the ENZIAN classification, recording the involvement levels of zones A, B, C, and F (grades 0–3), as well as the total number of involved sites, and calculating the overall score [10], to quantify infiltration burden and disease severity.
Within 14 days before surgery, 5 mL of EDTA-anticoagulated blood was collected
from the antecubital vein in the early morning under fasting conditions. Within 1
hour after collection, plasma was separated by centrifugation at 4 °C,
1500 g for 10 minutes, aliquoted into pre-cooled polypropylene tubes, stored at
–80 °C, with a maximum of one freeze-thaw cycle. The date of last
menstrual period, menstrual cycle phase (early follicular phase prioritized for
sampling), exogenous hormone use, interval from blood draw to surgery, hemolysis
index, and assay batch were recorded. A methodologically validated assay was used
to quantify kynurenine and tryptophan, using stable isotope internal standards to
correct for matrix effects and recovery. Calibration curves covered 0.5–20
µmol
Eutopic endometrial sampling was performed at the start of surgery to avoid
interference from intraoperative energy devices. Tissues were immediately fixed
in 10% neutral buffered formalin for 24 hours, routinely dehydrated and
embedded, and sectioned at 4 µm. A laboratory-validated rabbit
monoclonal anti-MMP-9 antibody was used with heat-induced antigen retrieval in a
pH 9.0 buffer, a polymer detection system with 3,3′-diaminobenzidine (DAB)
chromogen, and hematoxylin counterstaining. Each batch included both a negative
control and a known positive control. Two pathologists, blinded to KTR and
outcomes, independently evaluated staining intensity and the percentage of
positive cells in glandular epithelium and stromal areas. They calculated the
H-score (range 0–300) for each sample. Slides with a difference of
On the same day as blood sampling, symptom assessment was completed, including 10-point visual analog scale scores for dysmenorrhea, chronic pelvic pain, and dyspareunia [12]. Cyclical bowel or urinary symptoms were recorded as binary variables using a structured questionnaire. A senior physician performed a bimanual pelvic examination and recorded posterior fornix tenderness and palpable nodules. Serum CA-125 was measured using a chemiluminescent immunoassay platform, traceable to national reference materials and subjected to daily QC. The imaging protocol followed a TVUS-first strategy performed by trained sonographers, with pelvic MRI supplemented within 90 days before surgery when necessary. Whether DIE was suggested and the total number of involved sites were recorded in a unified manner. The imaging readers and the surgical team were mutually blinded.
The primary exposure variable was lnKTR. The primary outcome was pathology-confirmed DIE analyzed as a binary variable. Secondary outcomes included the ENZIAN grade and the count of involved sites. Pre-specified confounders included age, body mass index (BMI), smoking status, menstrual cycle phase or exogenous hormone use, high-sensitivity C-reactive protein, creatinine, and estimated glomerular filtration rate. Time-window alignment requirements were as follows: symptom scales and physical examination were completed on the same day as blood sampling; the interval between imaging and surgery did not exceed 90 days; the interval between blood sampling and surgery did not exceed 14 days; and the eutopic endometrial sampling was performed concurrently with surgery. Records exceeding the time windows were not included in the primary analyses.
The analysis first compared differences in KTR among the three groups. Depending
on the data distribution, analysis of variance or generalized linear models were
used with inclusion of pre-specified confounders, and adjusted mean differences
and 95% confidence intervals (CIs) were reported. An ordinal logistic regression
model based on ENZIAN grade was constructed to test the gradient trend of KTR.
Stratified analyses were performed to assess the consistency of association
direction by menstrual cycle phase and exogenous hormone use. Two sensitivity
analyses tested the robustness of the results: excluding those with
high-sensitivity C-reactive protein
A pre-specified baseline prediction model was constructed, including symptom quantification, clinical signs, CA-125, and imaging binary indicator and site count. KTR was then incorporated into this model, the AUCs were compared using the DeLong method with optimism correction by bootstrap, and the optimism-corrected AUC difference was reported. Category-based net reclassification improvement and integrated discrimination improvement were calculated according to clinically relevant risk thresholds (10%, 20%, 30%) [14]. Decision curve analysis was used to evaluate changes in net benefit within the above threshold range. Calibration plots and Brier scores were provided, and calibration improvements after adding KTR were reported. For the imaging-suspicious but atypical subgroup, likelihood ratios and changes in pre- versus post-test probabilities were calculated to display the impact of KTR on clinical classification.
With MMP-9 H-score as the dependent variable and KTR as the main independent variable, a multiple linear regression model was built with inclusion of pre-specified confounders. Collinearity and residual distributions were examined, and H-score was log transformed or robust regression was used when necessary. Standardized regression coefficients and 95% CIs were reported. Interaction terms were specified for different menstrual cycle phases and exogenous hormone use to evaluate effect modifications. Measurement consistency was verified by the ICC coefficient between the two raters, and measurement error sensitivity analyses of the model were incorporated.
All discrimination models underwent internal validation with 1000 bootstrap resamples to obtain optimism-corrected AUC, calibration slope, and intercept. Three types of sensitivity analyses were conducted for the primary results: including only those sampled in the early follicular phase; excluding those with elevated high-sensitivity C-reactive protein and with renal insufficiency; and stratification by imaging modality. Consistency of results was judged by the direction of effects and the magnitude of change in effect sizes.
An electronic case report form was established, with dual independent data entry
along with range and logic checks. After source data verification, outliers were
corrected. Samples were tracked throughout with barcodes and three-level QC
samples. Duplicate samples were randomly interleaved within assay batches to
monitor batch effects. Bidirectional blinding was implemented among the clinical
team, laboratory, and pathology, and unblinding was performed only after data
lock. When the proportion of missing data was
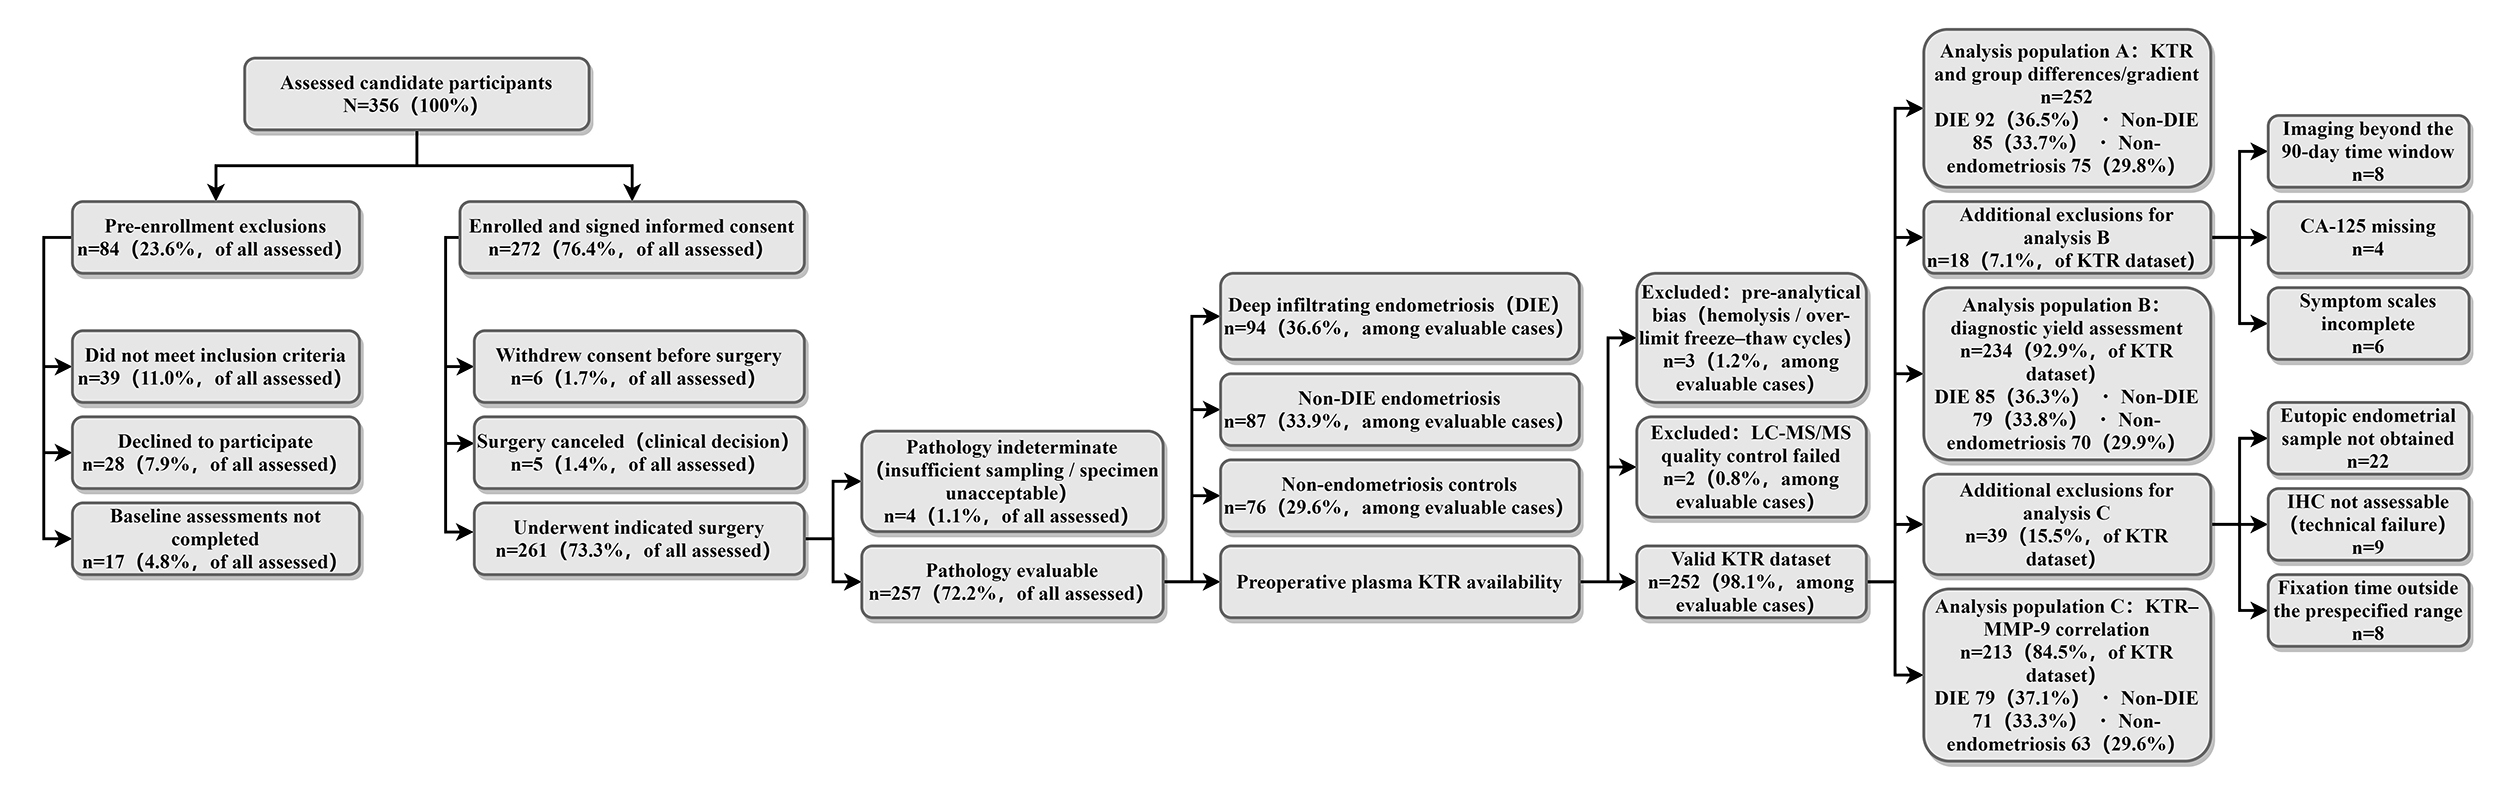
A total of 356 candidate participants were assessed, of whom 272 enrolled. Of
these, 257 provided samples suitable for pathological evaluation, including 94
DIE, 87 non-DIE endometriosis, and 76 non-endometriosis controls. The study
identified three distinct analytical cohorts (Fig. 1). Analysis population A
comprised 252 participants with valid KTR (92/85/75). Analysis population B
included 234 cases were used to determine diagnostic gain (85/79/70). Analysis
population C included 213 cases for the KTR–MMP-9 correlation (79/71/63) (Fig. 1). Kruskal–Wallis and Pearson
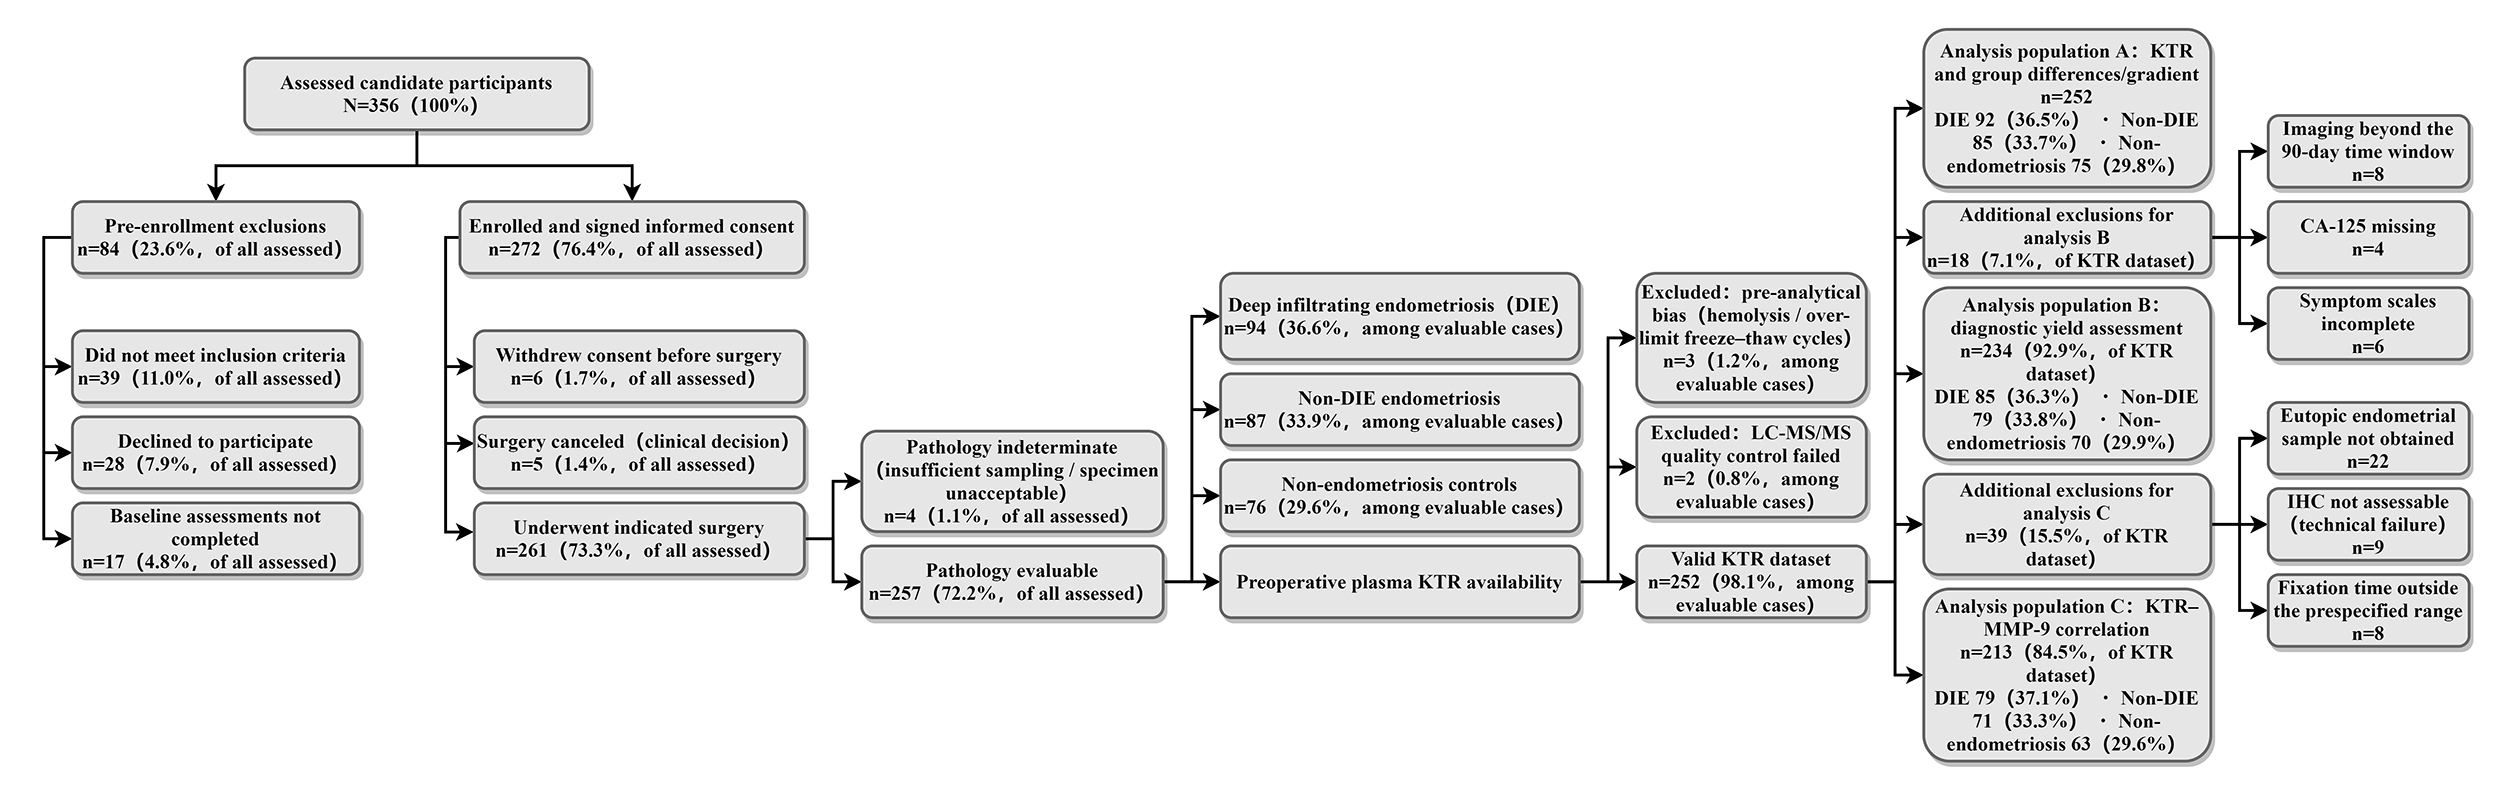 Fig. 1.
Flowchart of participant screening, inclusion, and exclusion. DIE, deep infiltrating endometriosis; KTR, kynurenine/tryptophan ratio; IHC, immunohistochemistry; LC-MS/MS, liquid chromatography-tandem mass spectrometry; CA-125, carbohydrate antigen 125.
| Variable | DIE group (n = 94) | Non-DIE endometriosis group (n = 87) | Non-endometriosis control group (n = 76) | Statistic | p-value | |
| Demographic and behavioral | ||||||
| Age (years) | 33.7 [28.9–38.6] | 32.1 [27.6–37.7] | 31.4 [26.5–36.2] | H = 2.713 | 0.258 | |
| BMI (kg |
22.8 [21.1–25.0] | 22.6 [21.0–24.3] | 22.7 [21.1–24.6] | H = 0.534 | 0.766 | |
| Smoking status (yes) | 13 (13.83%) | 10 (11.49%) | 9 (11.84%) | 0.743 | ||
| Smoking status (no) | 81 (86.17%) | 77 (88.51%) | 67 (88.16%) | — | — | |
| Cycle and hormones | ||||||
| Menstrual cycle phase: follicular phase | 52 (55.32%) | 46 (52.87%) | 40 (52.63%) | 0.932 | ||
| Menstrual cycle phase: early secretory | 24 (25.53%) | 22 (25.29%) | 18 (23.68%) | — | — | |
| Menstrual cycle phase: late secretory | 18 (19.15%) | 19 (21.84%) | 18 (23.68%) | — | — | |
| Exogenous hormone use (yes) | 22 (23.40%) | 18 (20.69%) | 13 (17.11%) | 0.286 | ||
| Exogenous hormone use (no) | 72 (76.60%) | 69 (79.31%) | 63 (82.89%) | — | — | |
| Inflammation and renal function | ||||||
| hsCRP (mg |
1.68 [0.92–3.21] | 1.22 [0.74–2.15] | 0.98 [0.61–1.62] | H = 16.427 | ||
| Creatinine (µmol |
67 [60–73] | 65 [59–72] | 65 [58–71] | H = 1.057 | 0.589 | |
| eGFR (mL |
105 [97–114] | 106 [98–114] | 107 [99–115] | H = 1.833 | 0.400 | |
| Diagnostic pathway variables | ||||||
| CA-125 (U |
29.5 [17.6–46.9] | 18.7 [12.5–27.9] | 13.0 [8.5–18.1] | H = 35.761 | ||
| Imaging modality: TVUS only | 51 (54.26%) | 46 (52.87%) | 49 (64.47%) | 0.162 | ||
| Imaging modality: MRI only | 12 (12.77%) | 11 (12.64%) | 7 (9.21%) | — | — | |
| Imaging modality: both | 31 (32.98%) | 30 (34.48%) | 20 (26.32%) | — | — | |
| Imaging suggesting DIE (yes) | 72 (76.60%) | 27 (31.03%) | 4 (5.26%) | |||
| Imaging suggesting DIE (no) | 22 (23.40%) | 60 (68.97%) | 72 (94.74%) | — | — | |
| Count of suspected involved sites on imaging | 2 [1–3] | 1 [0–1] | 0 [0–0] | H = 91.538 | ||
M, median; IQR, interquartile range; BMI, body mass index; hsCRP, high-sensitivity C-reactive protein; eGFR, estimated glomerular filtration rate; TVUS, transvaginal ultrasound; MRI, magnetic resonance imaging.
| Parameter | Kynurenine | Tryptophan |
| Calibration range (µmol/L) | 0.50–20.00 | 20.00–200.00 |
| LLOQ (µmol |
0.5 | 20 |
| LOD (µmol |
0.14 | 6.37 |
| Accuracy (%Bias) | –1.83 | –2.27 |
| Within-run CV (%) | 3.29 | 4.06 |
| Between-run CV (%) | 4.91 | 6.18 |
| QC pass rate (%) | 98.06 | 97.22 |
| Hemolysis index range | 0–31 | 0–31 |
| Freeze-thaw cycles (times) | 0–1 | 0–1 |
LLOQ, lower limit of quantification; LOD, limit of detection; CV, coefficient of variation.
| Region | Rater 1 mean H-score | Rater 2 mean H-score | ICC (95% CI) |
| Glandular epithelium | 148.32 |
151.07 |
0.887 (0.851–0.916) |
| Stromal area | 134.26 |
136.11 |
0.874 (0.835–0.906) |
| Overall H-score | 141.59 |
144.05 |
0.892 (0.858–0.920) |
MMP-9, matrix metalloproteinase-9; ICC, intraclass correlation.
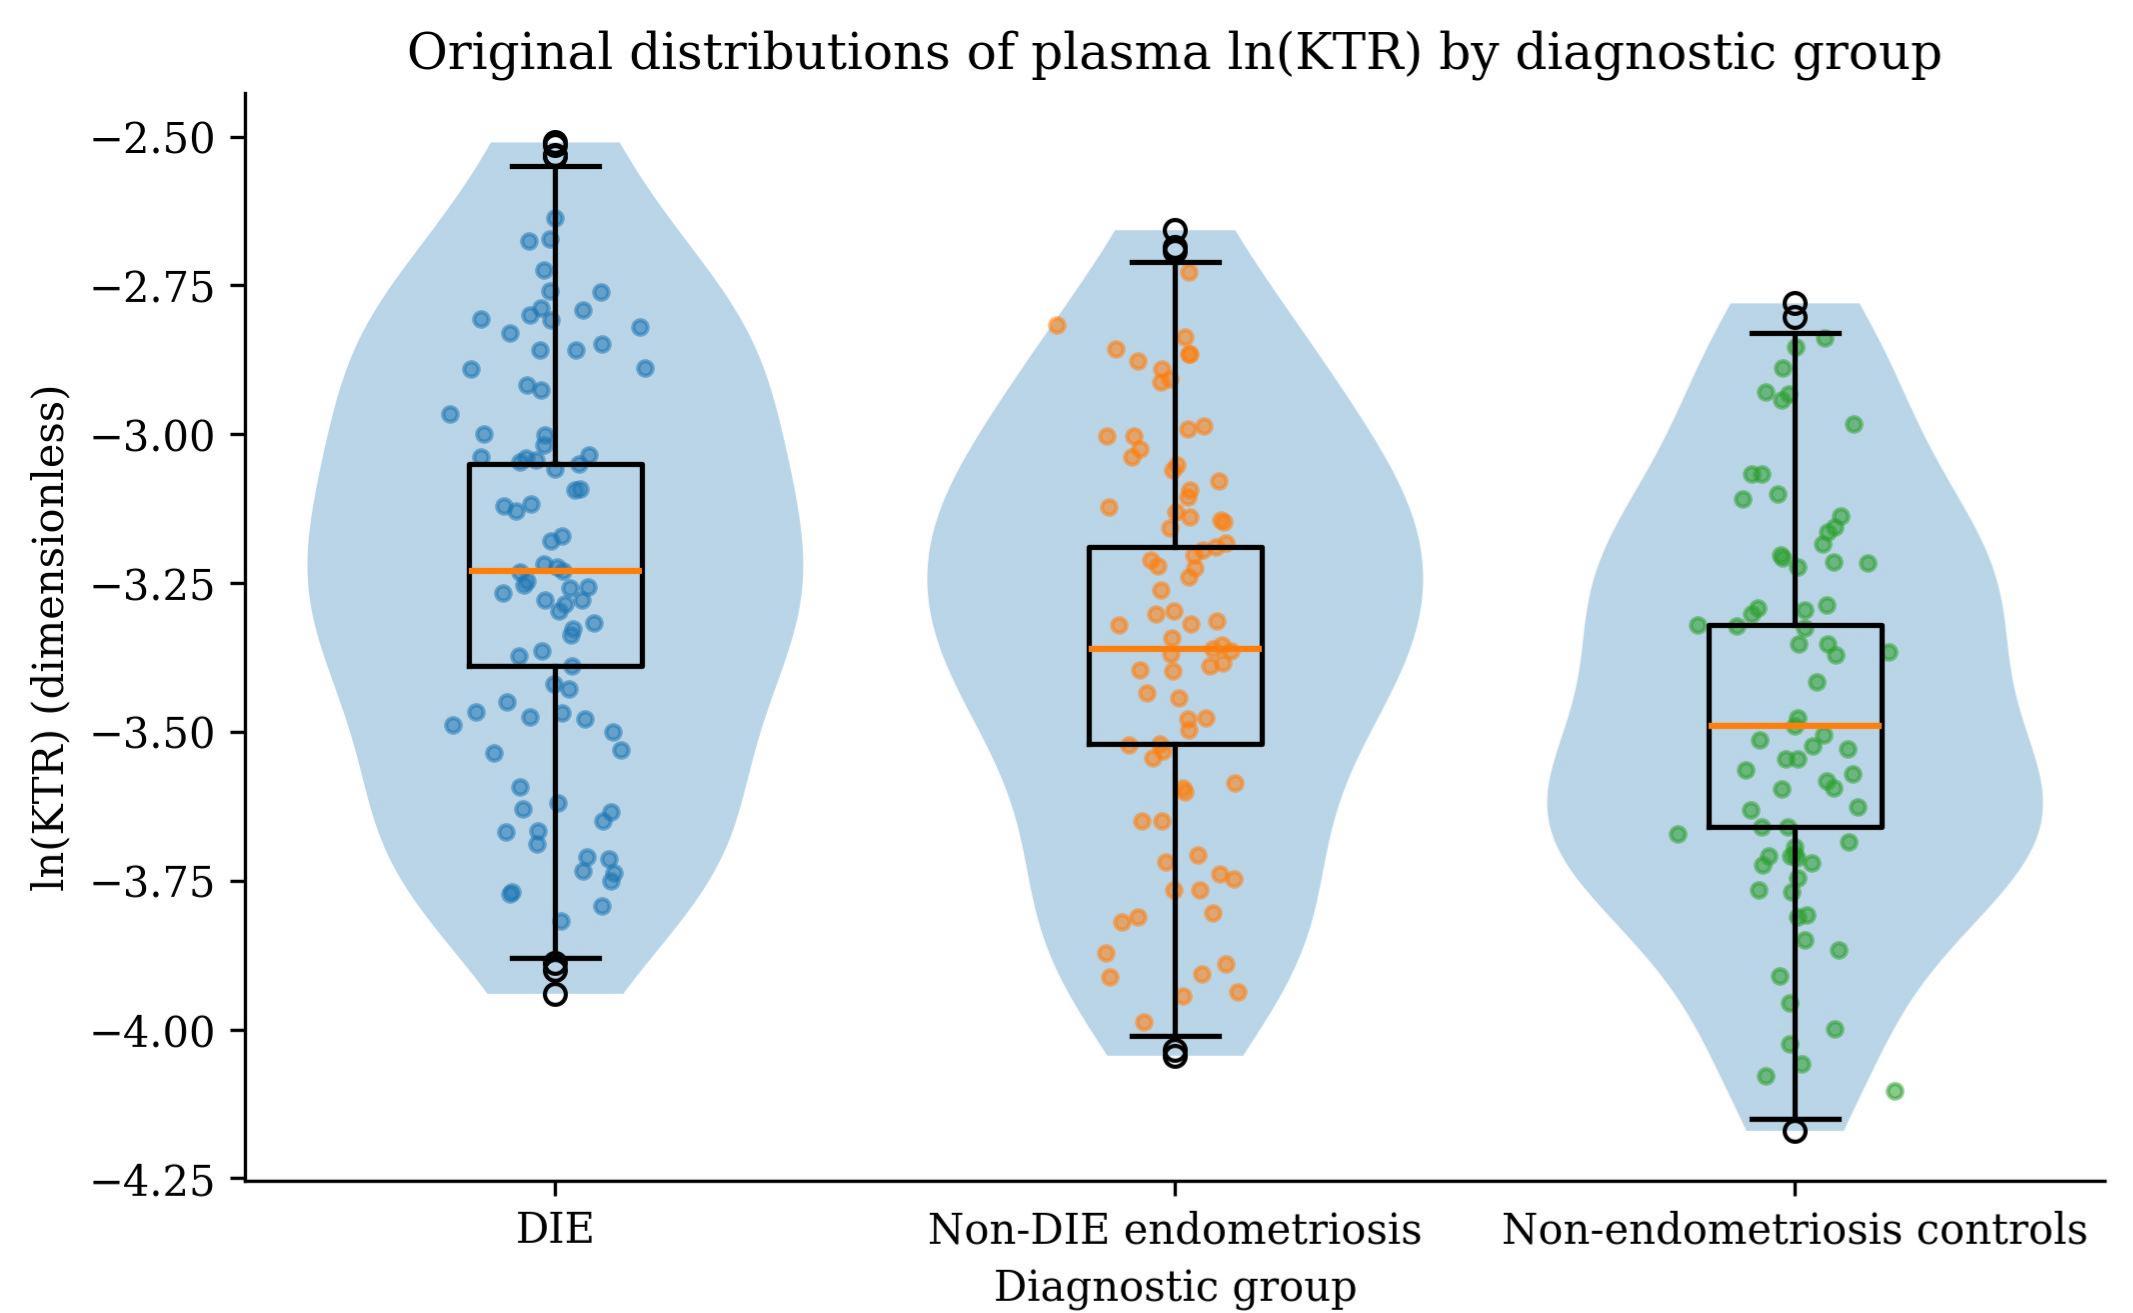
In Analysis population A, the raw distributions of lnKTR overlapped
significantly across the three diagnostic groups, with the median and upper
quartile tending to be higher in the DIE group (Fig. 2). Using multivariable
linear regression (ANCOVA) and ordinal logistic regression, after adjustment for
age, BMI, smoking status, menstrual cycle phase/exogenous hormones, hsCRP and
eGFR, the adjusted geometric means of KTR in the DIE and non-DIE endometriosis
groups were significantly higher than in the non-endometriosis control group
(
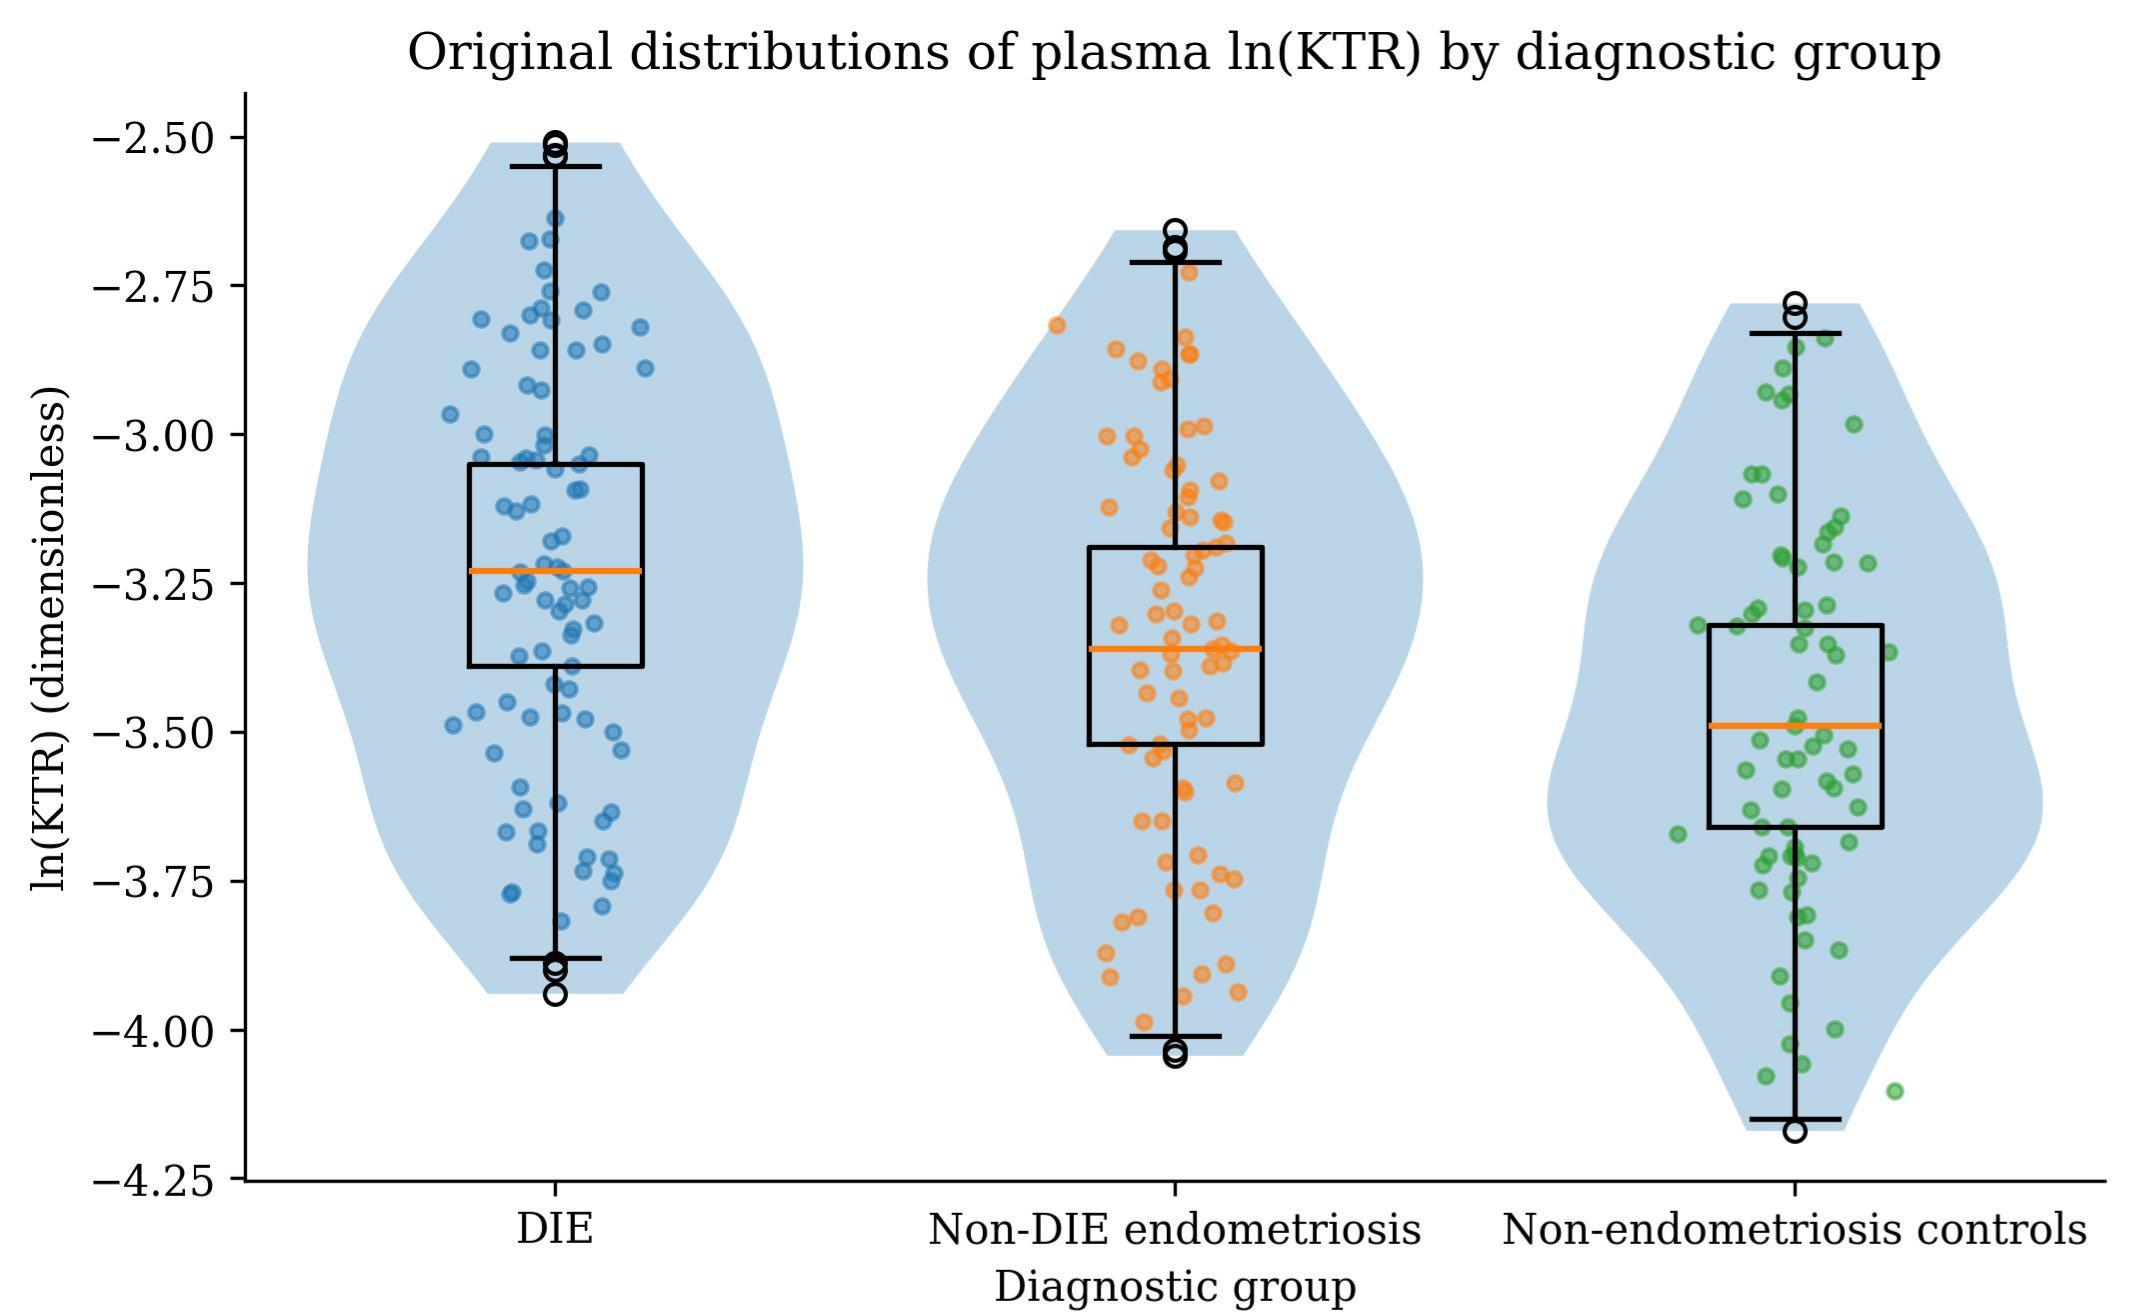 Fig. 2.
Raw distribution of plasma KTR across the three diagnostic groups. lnKTR, log transformed KTR.
| Group | KTR ( |
Wald z | p_adj | |
| DIE | 40.21 (37.88–42.69) | 0.28 (0.16–0.41) | 4.39 | |
| Non-DIE endometriosis | 35.22 (33.01–37.59) | 0.15 (0.05–0.26) | 2.8 | 0.01 |
| Non-endometriosis controls (reference) | 30.31 (28.19–32.52) | — | — | — |
Note: Geometric means are back-transformations of model marginal means of lnKTR
and are presented as (
| Predictor | OR_perSD (95% CI) | Wald z | p-value | Brant test |
Brant test p-value |
| lnKTR (z) | 1.62 (1.35–1.94) | 4.883 | 4.183 | 0.523 |
Note: OR_perSD denotes the odds ratio for a 1 SD increase in lnKTR corresponding to a higher ENZIAN grade.
Logistic regression modeling was employed for Analysis population B. AUC values
were compared using the DeLong method, while the net reclassification improvement (NRI), integrated discrimination improvement (IDI), and their 95% CIs
were obtained by 1000 bootstrap resamples. Calibration was assessed with the
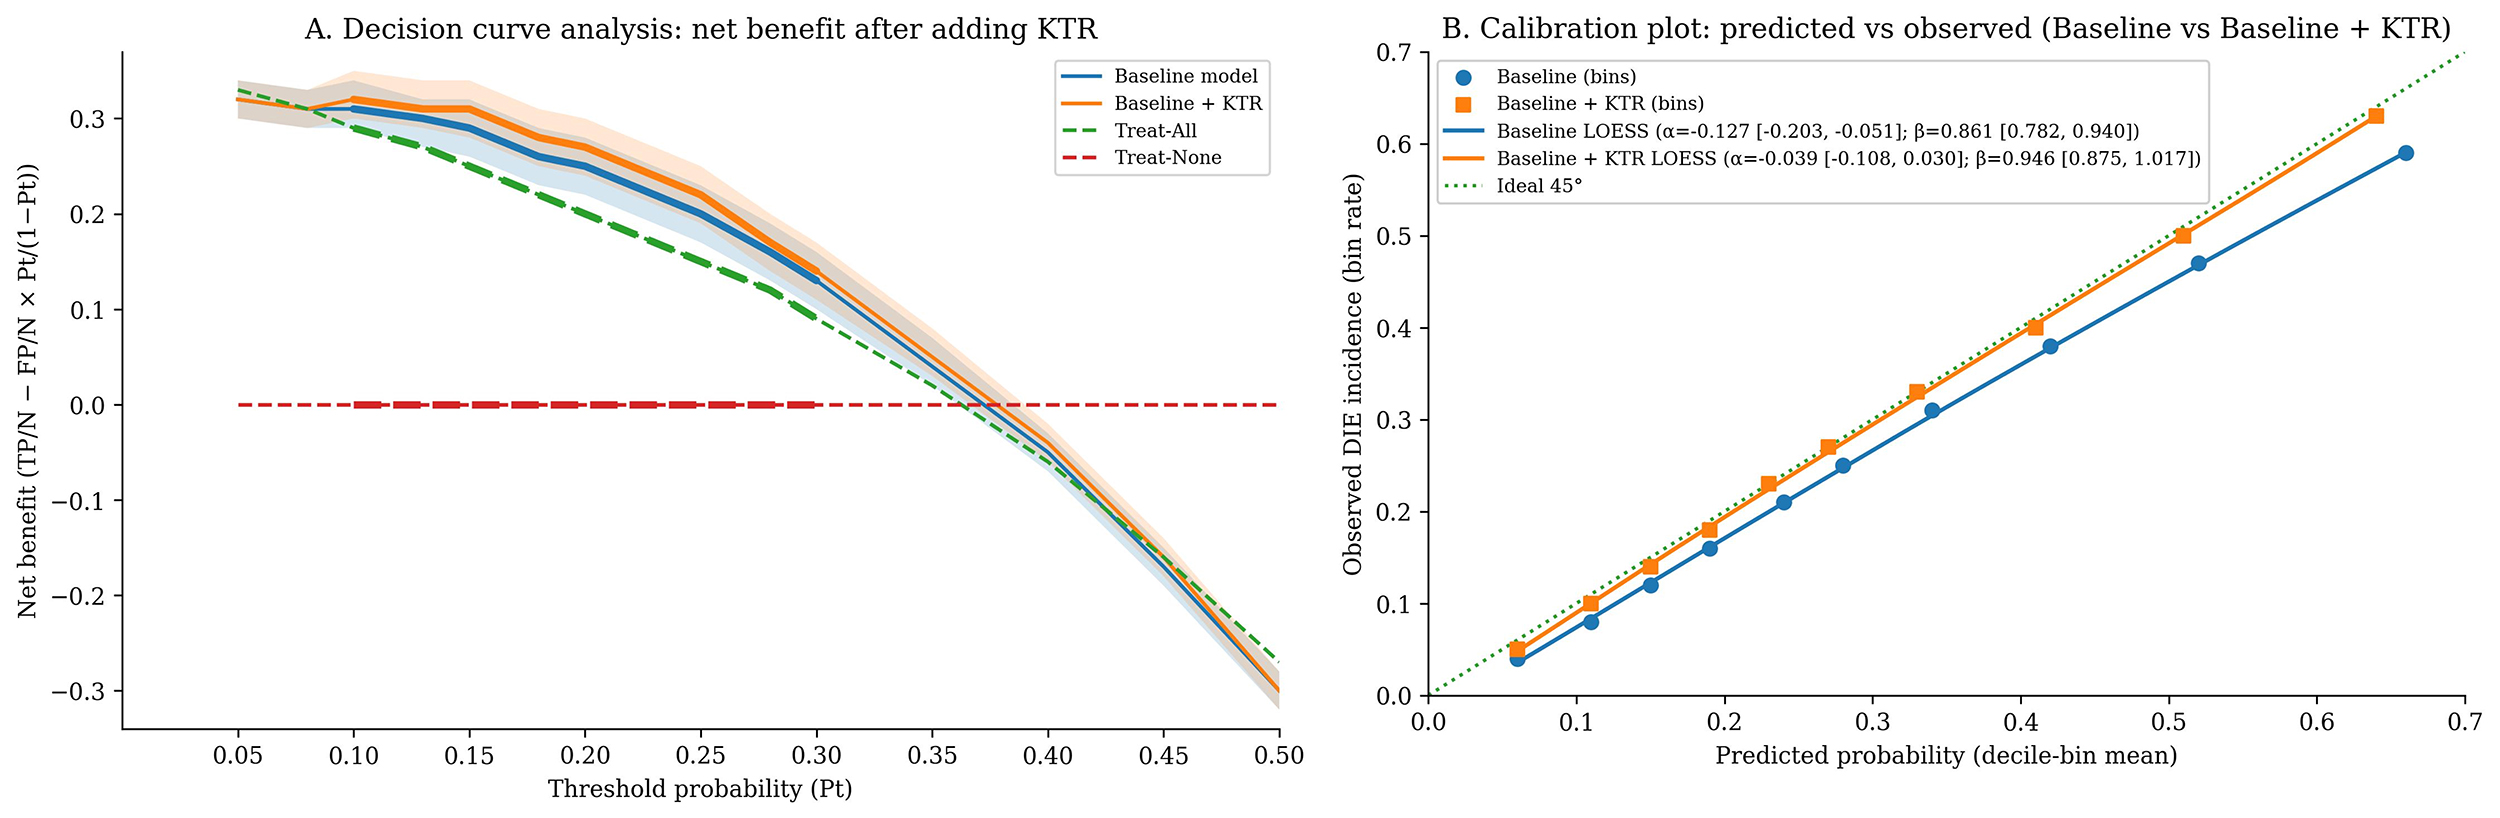
Brier score accompanied by calibration plots. After adding KTR, AUC increased
from 0.79 to 0.83 (
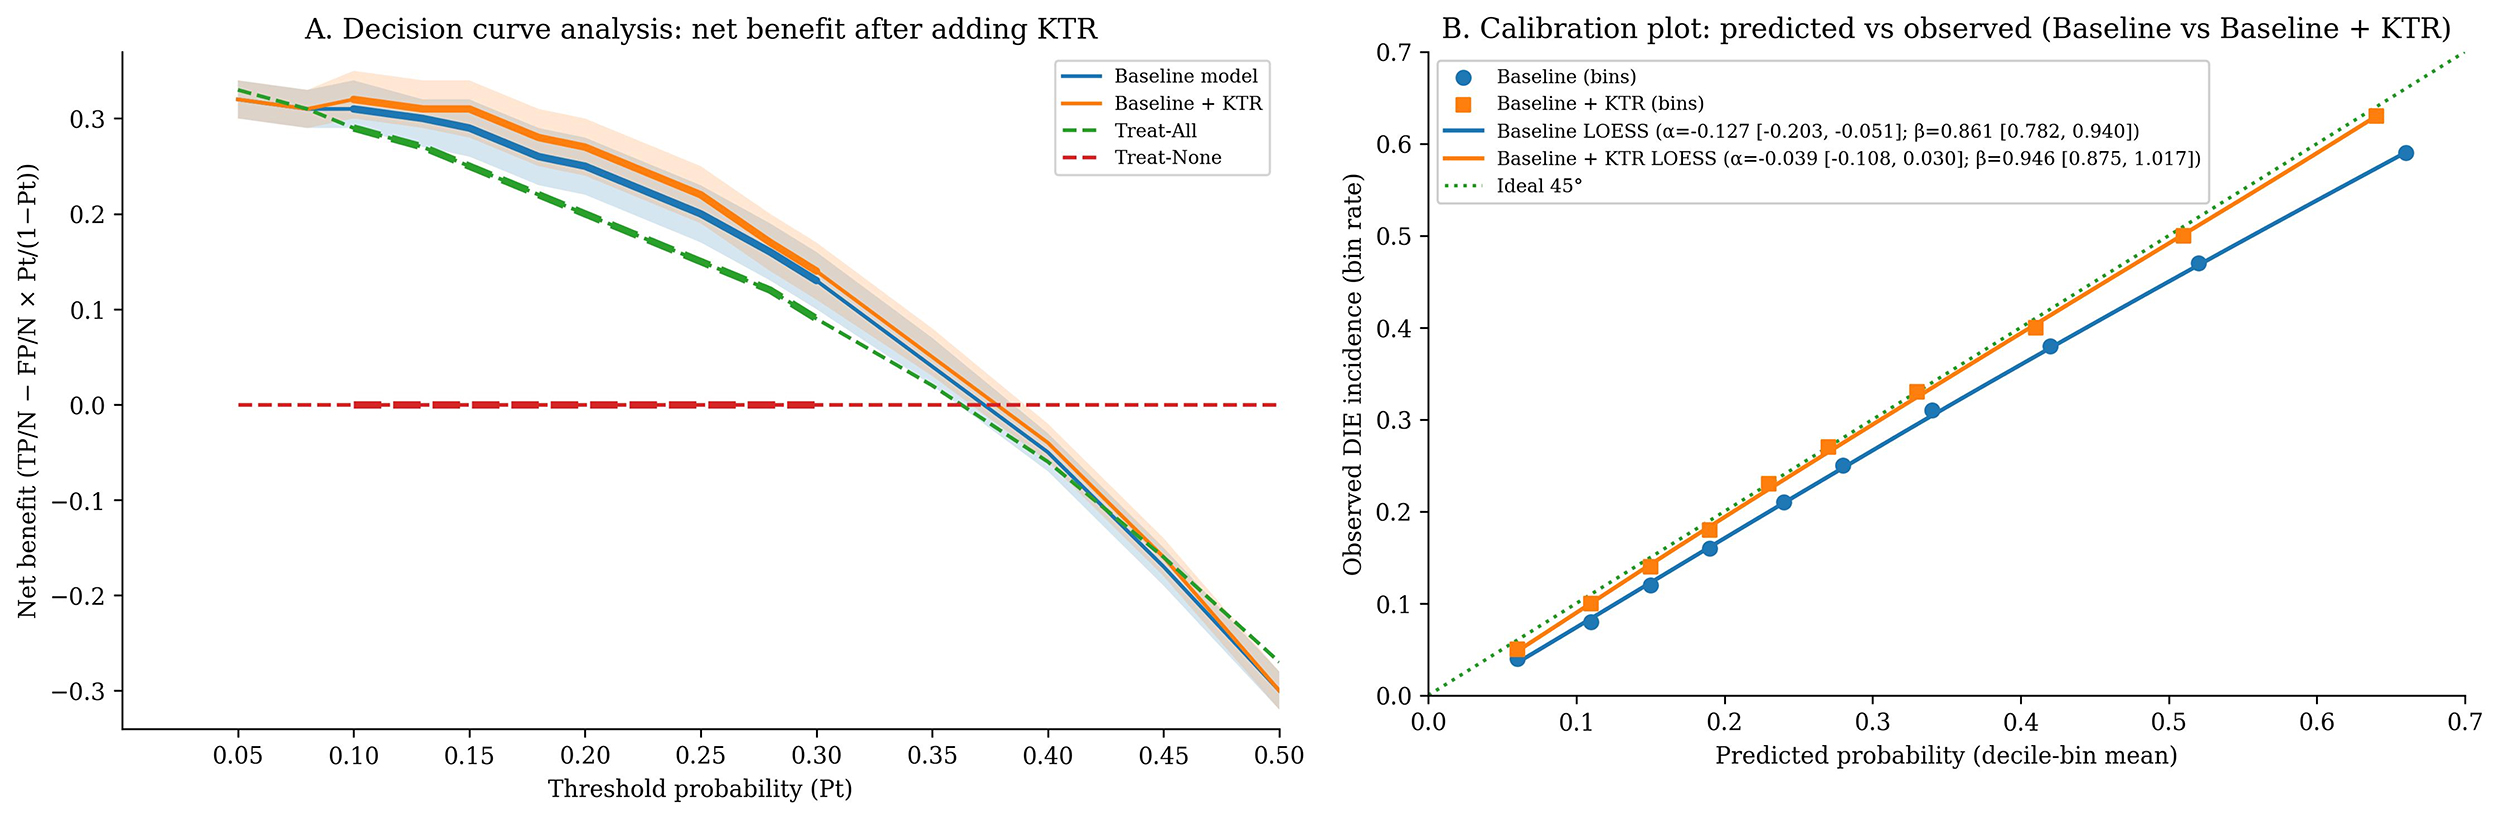 Fig. 3.
Clinical benefit and calibration assessment of the models. (A) Decision curve analysis: net benefit after adding KTR. (B) Calibration plot: predicted vs. observed (Baseline vs. Baseline + KTR).
| Metric | Baseline (symptoms + signs + CA-125 + imaging) | Baseline + KTR |
| AUC (95% CI) | 0.79 (0.74–0.84) | 0.83 (0.79–0.87) |
| — | 0.04 (0.02–0.07) | |
| p_DeLong | — | 0.003 |
| Brier score | 0.185 | 0.173 |
| ΔBrier | — | –0.012 |
| NRI_category (10%/20%/30%, estimate [95% CI]) | — | 0.18 (0.07–0.29)/0.16 (0.05–0.28)/0.14 (0.03–0.26) |
| p_NRI (10%/20%/30%) | — | 0.001/0.004/0.009 |
| IDI (95% CI) | — | 0.04 (0.02–0.07) |
| p_IDI | — | 0.001 |
| AUC (optimism-corrected) | 0.78 | 0.82 |
Note: Thresholds were defined as 10%, 20%, and 30%; all comparisons were based on the same Analysis population B and covariate set. AUC, area under the receiver operating characteristic curve; NRI, net reclassification improvement; IDI, integrated discrimination improvement.
| Risk category before adding KTR/Risk category after adding KTR | 10– |
20– |
Subtotal (events/non-events) | ||
| 1/15 | 3/5 | 1/2 | 0/0 | 5/22 | |
| 10– |
0/12 | 3/10 | 7/6 | 2/0 | 12/28 |
| 20– |
0/2 | 2/8 | 6/7 | 5/2 | 13/19 |
| 0/2 | 0/7 | 2/1 | 8/2 | 10/12 | |
| Subtotal (events/non-events) | 1/31 | 8/30 | 16/16 | 15/4 | 40/81 |
Net correct reclassification numbers: events +14 (up-classified 18, down-classified 4); non-events +17 (down-classified 32, up-classified 15). Note: Rows indicate risk categories before adding KTR, columns indicate risk categories after adding KTR, and each cell is presented as events/non-events.
| Group | Z-value | p-value | |
| Events (n = 40) | +0.07 [+0.03, +0.13] | 4.086 | |
| Non-events (n = 81) | –0.05 [–0.10, –0.02] | –4.732 |
| Metric | Point estimate | 95% CI (Wilson) |
| LR+ | 3.14 | 2.07–4.76 |
| LR– | 0.30 | 0.17–0.54 |
Note: Risk-band thresholds were the same as in Table 4 (
Analysis population C (n = 213) underwent multiple linear regression. MMP-9
H-score was defined as dependent variable, standardized the lnKTR as z-score, log
transformed the hsCRP levels, and applied a nested F test to evaluate incremental
explained variance. lnKTR was positively associated with MMP-9 in eutopic
endometrium (
 Fig. 4.
Scatter plot of KTR (log) versus MMP-9 H-score and partial regression line.
| Independent variable | SE | t value | p-value | |
| lnKTR (z) | 0.29 (0.15–0.43) | 0.07 | 4.143 | |
| Age | 0.06 (–0.04–0.16) | 0.05 | 1.200 | 0.232 |
| BMI | –0.04 (–0.14–0.06) | 0.05 | –0.800 | 0.424 |
| Smoking (yes = 1) | 0.05 (–0.07–0.17) | 0.06 | 0.833 | 0.406 |
| Phase: early secretory (vs. follicular) | 0.08 (–0.02–0.18) | 0.05 | 1.600 | 0.111 |
| Phase: late secretory (vs. follicular) | 0.11 (0.01–0.21) | 0.05 | 2.200 | 0.029 |
| Exogenous hormones (yes = 1) | –0.07 (–0.17–0.03) | 0.05 | –1.400 | 0.162 |
| hsCRP (ln) | 0.13 (0.03–0.23) | 0.05 | 2.600 | 0.010 |
| eGFR | –0.03 (–0.13–0.07) | 0.05 | –0.600 | 0.547 |
| ENZIAN total score | 0.18 (0.06–0.30) | 0.06 | 3.000 | 0.003 |
Note: Model R2 (with KTR): 0.32;
ANCOVA, the DeLong method with NRI_category (20% primary threshold), and
multiple linear regression consistent with the main analyses were used. In
stratifications of “early follicular only”, excluding hsCRP
| Analysis scenario | Chain A: adjusted |
Chain B: ΔAUC (95% CI), p_DeLong | Chain B: NRI_category (95% CI), p | Chain C: |
| Early follicular only | 0.30 (0.16–0.45), p = 0.001 | 0.05 (0.02–0.08), p = 0.002 | 0.19 (0.07–0.31), p = 0.002 | 0.27 (0.12–0.42), p = 0.001 |
| Excluding hsCRP |
0.27 (0.14–0.41), p = 0.001 | 0.04 (0.01–0.07), p = 0.010 | 0.17 (0.05–0.28), p = 0.006 | 0.28 (0.14–0.41), p |
| By imaging modality: TVUS only | 0.26 (0.11–0.40), p = 0.001 | 0.03 (0.003–0.06), p = 0.047 | 0.14 (0.02–0.26), p = 0.022 | 0.27 (0.11–0.41), p = 0.001 |
| By imaging modality: MRI only | 0.31 (0.16–0.47), p = 0.001 | 0.05 (0.02–0.09), p = 0.004 | 0.21 (0.06–0.35), p = 0.006 | 0.30 (0.13–0.46), p = 0.001 |
Little’s MCAR test and MICE multiple imputation (m = 10) was assessed. Within
Analysis population B, the missing data rates for each covariate remained
| Variable | Missing count (n) | Missing rate (%) | Imputation method (MICE) |
| Age (years) | 2 | 0.85 | PMM |
| BMI (kg·m-2) | 3 | 1.28 | PMM |
| Smoking status (yes/no) | 5 | 2.14 | Binary logistic |
| Menstrual cycle phase (follicular/early secretory/late secretory) | 8 | 3.42 | Multinomial logistic |
| Exogenous hormone use (yes/no) | 4 | 1.71 | Binary logistic |
| Dysmenorrhea VAS (0–10) | 7 | 2.99 | PMM |
| Dyspareunia VAS (0–10) | 9 | 3.85 | PMM |
| Posterior fornix tenderness (yes/no) | 6 | 2.56 | Binary logistic |
| hsCRP (mg |
12 | 5.13 | PMM (on ln values) |
| eGFR (mL |
6 | 2.56 | PMM |
| CA-125 (U |
10 | 4.27 | PMM |
| Imaging suggesting DIE (binary) | 1 | 0.43 | Binary logistic |
| Count of suspected involved sites on imaging | 3 | 1.28 | PMM |
Note: Little’s MCAR test:
| Metric | Complete cases (CC, n = 206) | Multiple imputation (MI pooled, n = 234; m = 10) |
| lnKTR (per |
1.57 (1.23–2.04), p = 0.001 | 1.62 (1.29–2.05), p = 0.001 |
| AUC (Baseline model) | 0.79 (0.73–0.84) | 0.79 (0.74–0.84) |
| AUC (Baseline + KTR) | 0.83 (0.78–0.87) | 0.83 (0.79–0.87) |
| ΔAUC (DeLong 95% CI), p_DeLong | 0.04 (0.01–0.07), p = 0.009 | 0.04 (0.02–0.07), p = 0.003 |
| Brier score (Baseline |
0.186 |
0.185 |
| Calibration intercept |
–0.121 |
–0.127 |
| Calibration slope |
0.865 |
0.861 |
CC, complete-case analysis; MI, multiple imputation.
Although the distributions of lnKTR overlapped among the three groups, participants with the deep infiltrating phenotype showed higher median and upper quartile levels when surgical pathology, quantified by ENZIAN, served as the gold standard. After simultaneous adjustment for age, BMI, smoking, menstrual cycle phase, exogenous hormones, hsCRP, and eGFR, this difference remained. The non-DIE endometriosis group also showed higher lnKTR levels than the non-endometriosis controls, and each standard deviation increase in lnKTR corresponded to a higher ENZIAN grade, suggesting a clear dose–response relationship. Stratified and sensitivity analyses showed no reversal of effect direction, and the linearity, precision, and QC pass rate of LC-MS/MS assay, as well as the consistency of IHC scoring, provided technical credibility for the inference. From an immunometabolic perspective, interferon signaling in the inflammatory microenvironment accelerates tryptophan metabolism through indoleamine 2,3-dioxygenase and tryptophan 2,3-dioxygenase pathways, leading to tryptophan depletion and kynurenine accumulation, with KTR rising as a systemic readout of pathway activation [15, 16]. As a ligand of AhR, kynurenine can synergize with proinflammatory transcriptional networks, upregulate MMP expression, and enhance matrix degradation and fibrotic remodeling, conferring stronger adhesion and invasive capacity to lesions [17]. Accordingly, systemic elevation of KTR is consistent with the gradient of deeper tissue infiltration and broader involvement. Previous reports have mostly observed abnormalities of the tryptophan pathway in mixed endometriosis populations [18], but evidence for discrimination of the deep infiltrating subtype and for quantification of anatomical burden has been insufficient, and control of menstrual cycle and hormonal exposure has often been inadequate. In contrast, the present prospective data, obtained under rigorous preanalytical procedures and multivariable adjustment, demonstrate both phenotypic differences and grading trends, indicating that KTR relates not only to the presence of disease but also to the intensity of the pathological phenotype, providing a testable framework for perioperative stratification and for subsequent mechanistic studies targeting immunometabolism.
After adding KTR to the baseline model composed of symptoms, signs, CA-125, and
imaging, discrimination improved, prediction error decreased, probability
calibration approached the ideal, and sustained net benefit appeared within the
clinically relevant risk range of 0.10–0.30;
With surgical pathology as the reference and after adjustment for age, BMI, smoking, menstrual cycle phase, exogenous hormones, high-sensitivity C-reactive protein, estimated glomerular filtration rate, and lesion burden, lnKTR showed an independent positive association with MMP-9 H-score in eutopic endometrium. Partial regression plots showed a stable slope, with point clouds across cycle strata that largely overlapped and stratified, as well as sensitivity analyses pointing in the same direction, suggesting that this association was not driven by cycle differences or covariates such as inflammation or renal function. At the level of immunometabolism, inflammatory signals induce activation of indoleamine 2,3-dioxygenase and tryptophan 2,3-dioxygenase, increasing the flux of tryptophan toward kynurenine [22]. Kynurenine, as a ligand of AhR, can activate downstream transcriptional networks, enhance MMP-9 transcription and secretion, and promote changes in cell adhesion, extracellular matrix degradation, and stromal remodeling, conferring stronger invasive and fibrotic capacity to lesions [23]. The concordant changes in systemic KTR elevation and local MMP-9 enhancement can be interpreted as a coupling marker between immunometabolic signaling and tissue microenvironmental activity [24], supporting the discriminative value of the plasma biomarker for the infiltrative phenotype and providing a measurable bridging index for perioperative risk stratification and potential targeted research. Previous multi-source disease models have suggested that kynurenine and AhR upregulate MMP-9, but population-level evidence in human eutopic endometrium remains scarce [25]. Paired blood–tissue data, combined with consistent robustness checks, fill this key gap by enabling the systemic marker and histologic processes to be compared and verified within the same subjects.
To avoid overstating the conclusions, several limitations should be acknowledged. The single-center prospective cohort may be affected by referral and spectrum bias, lacks external and temporal validation, and the stability of risk thresholds has not yet been prospectively tested. NRI, IDI, and decision curves are sensitive to sample size and threshold selection, and their CIs carry inherent uncertainty. KTR is influenced by concomitant inflammation, diet, and metabolic status. Although adjustments were made for hsCRP and renal function, residual confounding may remain. MMP-9 was semi-quantified by IHC, and despite good ICC, batch effects and reader drift may occur. The maximum 90-day interval from imaging to surgery may lead to disease progression. Future work should conduct multicenter, pre-registered external and temporal validation; establish cross-platform standardization of LC-MS/MS and IHC with reference materials; prospectively confirm thresholds according to clinical use scenarios; evaluate decision impact and cost-effectiveness in imaging-atypical and preoperative stratification pathways; combine plasma markers, symptoms, and structural imaging to develop deployable multimodal models; refine preanalytical standard operating procedures (SOPs) and inter-laboratory consistency; and, within the cohort, track longitudinal changes and modifiability of the kynurenine–AhR–MMP-9 pathway to clarify causal associations with clinical outcomes.
This study demonstrates that plasma KTR provides independent and quantifiable diagnostic value beyond symptoms, signs, CA-125, and routine imaging. It improves discrimination, calibration, and clinical net benefit, and is particularly useful for preoperative stratification in imaging-suspicious but atypical cases. KTR shows an independent positive association with MMP-9 expression in eutopic endometrium, suggesting an association between systemic immunometabolic activation and local matrix remodeling with clear biological plausibility. Overall, KTR can serve as a practical auxiliary biomarker for DIE to optimize referral and surgical planning and provides a foundation for kynurenine pathway–related precision interventions and multimodal diagnostic models.
The datasets used and analyzed during the current study are available from the corresponding author on reasonable request, subject to institutional data sharing policies and ethical approval.
HX: Conceived and designed the study, participated in patient enrollment and data collection, performed preliminary data analysis, and drafted the first version of the manuscript. HJ: Assisted in study design, performed statistical analysis and data verification, prepared figures and tables, and contributed to revising and polishing the manuscript. CM: Conceived and supervised the overall study, coordinated patient recruitment and clinical data interpretation, provided critical revision of the manuscript for important intellectual content, and serves as the corresponding author. All authors read and approved the final manuscript. All authors have participated sufficiently in the work and agreed to be accountable for all aspects of the work.
This study was conducted in accordance with the Declaration of Helsinki. The protocol was reviewed and approved by the Ethics Committee of Zhejiang Provincial People’s Hospital, Hangzhou, Zhejiang, China (approval No. KT2022062). Written informed consent was obtained from all participants before enrolment in the study.
The authors sincerely thank the clinicians, sonographers, and nursing staff of the Department of Obstetrics, Yongkang Hospital of Traditional Chinese Medicine, for their support in participant recruitment, perioperative management, and imaging examinations. We are also grateful to the pathology and laboratory teams for their assistance with specimen processing, LC-MS/MS assays, and immunohistochemical evaluations, as well as to all women who generously participated in this study.
This research received no external funding.
The authors declare no conflicts of interest.
During the preparation of this manuscript, the authors used ChatGPT to assist with language editing (including grammar, wording, and style). The authors carefully reviewed and revised all AI-assisted suggestions and take full responsibility. No AI tools were used for data analysis, data generation, or scientific interpretation.
Supplementary material associated with this article can be found, in the online version, at https://doi.org/10.31083/CEOG47790.
References
Publisher’s Note: IMR Press stays neutral with regard to jurisdictional claims in published maps and institutional affiliations.