


 , Emre Sertel 2, Çağcıl Yetim 3, Sevda Zamanova 4, Dursun Emre Aydın 2
1 Department of Obstetrics and Gynecology, Bahçeşehir University Faculty of Medicine, 34734 Istanbul, Turkey
2 Department of Obstetrics and Gynecology, University of Health Sciences, Kocaeli City Hospital, 41060 Kocaeli, Turkey
3 Department of Obstetrics and Gynecology, Medicana Ataköy Hospital, 34158 Istanbul, Turkey
4 Department of Obstetrics and Gynecology, VM Medical Park Maltepe Hospital, 34846 Istanbul, Turkey
Abstract
Early detection of fetal developmental abnormalities can allow for necessary precautions to be taken to reduce risks that may arise during and after birth. This study aimed to investigate the association between first-trimester aneuploidy screening markers—pregnancy-associated plasma protein A (PAPP-A), free beta-human chorionic gonadotropin (fβ-hCG), and nuchal translucency (NT)—and neonatal anthropometric measurements (weight, length, and head circumference). It also evaluated their predictive value for subsequent fetal growth abnormalities, including small for gestational age (SGA) and large for gestational age (LGA) births.
This retrospective study included 422 singleton pregnant women and their newborns. First-trimester NT, fβ-hCG, and PAPP-A multiple of the median (MoM) values were compared among mothers who delivered SGA, appropriate for gestational age (AGA), and LGA infants. Correlations between these markers and neonatal percentiles for weight, length, and head circumference were also examined.
Mothers of SGA neonates had significantly lower PAPP-A and fβ-hCG MoM values than mothers of AGA or LGA neonates (p < 0.05). Receiver operating characteristic (ROC) analysis demonstrated moderate discriminatory performance for the identification of pregnancies at increased risk of SGA, with an area under the curve (AUC) of 0.687 for fβ-hCG MoM (p < 0.001) and 0.674 for PAPP-A MoM (p = 0.001). Spearman correlation analysis showed that PAPP-A MoM was positively correlated with neonatal birth weight (r = 0.133, p = 0.006) and length percentiles (r = 0.151, p = 0.002). fβ-hCG MoM was also positively correlated with neonatal weight (r = 0.151, p = 0.002), length (r = 0.114, p = 0.019), and head circumference percentiles (r = 0.104, p = 0.032). Correlation analysis revealed no significant association between NT MoM and neonatal anthropometric measurements. In multivariable logistic regression analysis, lower first-trimester PAPP-A MoM (adjusted odds ratio [aOR]: 2.51) and fβ-hCG MoM (aOR: 2.95) remained independently associated with SGA, whereas NT MoM did not.
First-trimester PAPP-A and fβ-hCG values were significantly lower in mothers who delivered SGA infants and showed moderate discriminatory ability for the identification of pregnancies at increased risk of SGA. In addition, first-trimester PAPP-A and fβ-hCG levels were correlated with neonatal birth weight and length, and first-trimester fβ-hCG levels were also correlated with neonatal head circumference. In contrast, first-trimester NT was not associated with neonatal anthropometric outcomes.
Keywords
- PAPP-A
- fβ-hCG
- nuchal translucency
- small for gestational age
- neonatal anthropometry
- birth weight
Nuchal translucency (NT), measured by ultrasonography, along with maternal serum
levels of free beta-human chorionic gonadotropin (f
In the literature, the terms small for gestational age (SGA) and large for gestational age (LGA) describe abnormal fetal growth. SGA is generally defined as a fetal or birth weight below the 10th percentile for a specific reference at a specific gestational age, whereas LGA refers to a weight above the 90th percentile [2]. SGA is associated with both immediate perinatal complications and an increased risk of long-term cardiometabolic and neurodevelopmental outcomes [3, 4, 5]. Conversely, LGA neonates have an increased risk of intrapartum complications, including fetal hypoxia, shoulder dystocia, and brachial plexus injury. Maternal risks include perineal trauma, postpartum hemorrhage, and operative delivery, particularly cesarean section [6]. In addition, individuals born LGA have an elevated risk of obesity, hypertension, and type 2 diabetes later in life [7].
Although often used interchangeably, SGA and fetal growth restriction (FGR) represent related but distinct clinical entities. According to the International Society of Ultrasound in Obstetrics and Gynecology (ISUOG), SGA refers to a fetus or neonate with an estimated or actual weight below the 10th percentile for gestational age and may reflect a constitutionally small fetus. In contrast, FGR is a pathological condition characterized by failure to achieve genetic growth potential and is associated with increased perinatal morbidity as well as adverse long-term outcomes [8]. Body weight, length and head circumference at birth are the primary anthropometric measurements used to assess perinatal and postnatal growth and health [9]. Early detection of fetal growth abnormalities can enable timely interventions to mitigate risks that may arise during and after birth.
This study aimed to investigate the relationship between first-trimester
aneuploidy screening markers (PAPP-A, f
The study was conducted as a retrospective chart review. Singleton pregnancies that resulted in delivery after 32 weeks of gestation at the Gynecology and Obstetrics Clinics of VM Medical Park Maltepe Hospital and Kocaeli City Hospital between April 2023 and April 2024 were included. Eligible cases underwent first-trimester aneuploidy screening between 11–14 weeks of gestation and did not develop any pregnancy complications.
Pregnant women with multiple pregnancy, fetal chromosomal abnormalities or major structural anomalies, gestational hypertension, preeclampsia, gestational diabetes, intrauterine fetal growth restriction, glucose intolerance, maternal obesity, known systemic disease, or insufficient data were excluded from the study. Fetuses diagnosed with FGR during pregnancy were excluded to allow assessment of the relationship between first-trimester aneuploidy screening markers and neonatal anthropometric outcomes in pregnancies without major complications. This approach aimed to minimize confounding effects from placental insufficiency, hypertensive disorders, and abnormal Doppler findings that typically characterize FGR and may independently affect both biochemical markers and fetal growth.
Information on eligible women and their newborns was obtained from electronic and written records. A total of 422 pregnancies were included in the study.
The study was conducted in accordance with the principles of the Declaration of Helsinki, and approval was obtained from the Kocaeli City Hospital Scientific Research Ethics Committee on September 12, 2024 (protocol number: 2024-109).
The evaluated maternal variables included maternal age, body mass index (BMI), parity, gestational age at first-trimester screening, and gestational age at delivery. Neonatal variables included birth weight, length, head circumference, and the corresponding gestational age and sex-adjusted percentiles.
In first-trimester aneuploidy screening, NT was measured by ultrasonography, and
f
Neonates with a birth weight below the 10th percentile for gestational age were
classified as SGA, whereas those exceeding the 90th percentile were categorized
as LGA. Infants with birth weights fell between the 10th and 90th percentiles
were considered appropriate for gestational age (AGA). NT, f
Anthropometric measurements of all newborns, including weight, length, and head
circumference, were included in the study, measured immediately after birth, were
recorded. These measurements were converted to gestational age and sex-adjusted
percentiles based on reference data specific to the Turkish newborn population
[9]. The correlation between these measurements and first-trimester NT MoM,
f
The primary outcome of this study was SGA, defined as birth weight below the
10th percentile for gestational age. The primary exposures were first-trimester
PAPP-A MoM, f
All statistical analyses were performed using IBM SPSS Statistics version 20.0
(IBM Corp., Armonk, NY, USA). Continuous variables are summarized as mean
A total of 422 singleton pregnancies were included in the study. Of these, 36 (8.5%) resulted in SGA infants, 322 (76.3%) in AGA infants, and 64 (15.2%) in LGA infants.
Table 1 presents a comparison of groups that delivered SGA, AGA, and LGA infants
with respect to demographic characteristics, first-trimester aneuploidy screening
markers (f
| SGA (n = 36) | AGA (n = 322) | LGA (n = 64) | p-value | Post-hoc analysis p-values | |||
| SGA-AGA | SGA-LGA | LGA-AGA | |||||
| Mother’s age (years) | 29.34 |
30.43 |
30.18 |
0.420a | 0.397 | 0.680 | 0.918 |
| 29 (7.75) | 30 (5.13) | 30 (5.80) | |||||
| Parity (n) | 0.45 |
0.66 |
0.71 |
0.630b | |||
| 0 (1) | 0 (1) | 0 (1) | |||||
| Gestational age at NT ultrasonography (days) | 84.35 |
85.93 |
86.01 |
0.152a | |||
| 85.5 (5.5) | 86 (7) | 87 (7) | |||||
| Maternal BMI (kg/m2) | 25.37 |
24.88 |
26.21 |
0.122a | |||
| 24.46 (6.3) | 24.09 (6.1) | 25.22 (6.40) | |||||
| PAPP-A (ng/mL) | 2.14 |
3.39 |
3.46 |
0.002b | 0.001 | 0.014 | 1.00 |
| 1.75 (1.40) | 2.79 (2.38) | 2.71 (2.10) | |||||
| PAPP-A MoM | 0.89 |
1.28 |
1.34 |
0.002b | 0.002 | 0.007 | 1.00 |
| 0.83 (0.49) | 1.11 (0.84) | 1.15 (0.82) | |||||
| f |
30.11 |
47.25 |
49.86 |
0.007a | 0.008 | 0.010 | 0.827 |
| 27.5 (20.63) | 36.55 (35.78) | 40.10 (43.70) | |||||
| f |
0.79 |
1.23 |
1.32 |
0.001 | 0.505 | ||
| 0.66 (0.63) | 0.96 (0.96) | 1.12 (1.19) | |||||
| NT size (mm) | 1.27 |
1.39 |
1.38 |
0.386a | 0.352 | 0.555 | 0.977 |
| 1.20 (0.48) | 1.32 (0.50) | 1.30 (0.60) | |||||
| NT MoM | 0.90 |
0.89 |
0.89 |
0.934a | 0.942 | 0.931 | 0.991 |
| 0.83 (0.31) | 0.88 (0.23) | 0.88 (0.28) | |||||
| Gestational age at birth (days) | 270.58 |
269.72 |
269.01 |
0.687b | |||
| 273 (14) | 271.50 (9) | 273 (12.75) | |||||
| Neonatal weight (g) | 2588.58 |
3213.85 |
3827.95 |
||||
| 2650 (390.8) | 3250 (410) | 3900 (352.5) | |||||
| Neonatal weight (percentile) | 6.01 |
53.37 |
94.5 |
||||
| 6.50 (5.98) | 55 (35.7) | 94.2 (6.75) | |||||
| Neonatal length (cm) | 47.16 |
49.75 |
51.28 |
||||
| 48 (2.8) | 50 (2) | 52 (3) | |||||
| Neonatal length (percentile) | 21.74 |
54.70 |
80.19 |
||||
| 17.40 (26.37) | 57.70 (41.60) | 86 (23.60) | |||||
| Neonatal head circumference (cm) | 32.59 |
34.50 |
35.76 |
||||
| 33 (2) | 35 (1.5) | 36 (2) | |||||
| Neonatal head circumference (percentile) | 21.63 |
53.34 |
80.45 |
||||
| 11.6 (28.38) | 59.37 (45.50) | 90 (22) | |||||
Variables are given as mean
a ANOVA test.
b Kruskal-Wallis Test.
* Bold/italic value signifies statistical significance.
Abbreviations: ANOVA, analysis of variance; SGA, small for gestational age; LGA, large for gestational age;
AGA, appropriate for gestational age; BMI, body mass index; PAPP-A, pregnancy
associated plasma protein A; f
The discriminatory performance of first-trimester PAPP-A MoM and f
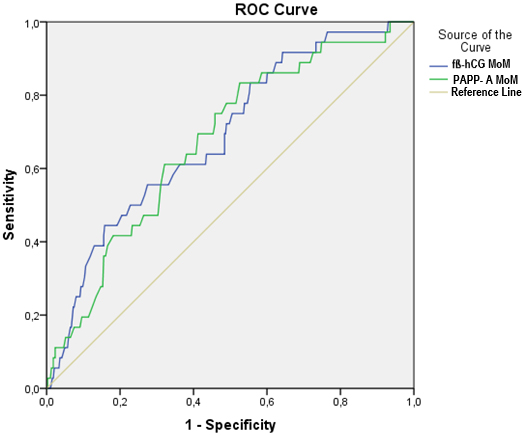 Fig. 1.
ROC curves of first-trimester PAPP-A MoM and f
| AUC (95% CI) | Cut-off value | Specificity, % | Sensitivity, % | p-value | |
| f |
0.687 (0.601–0.774) | 84.2 | 44.4 | ||
| PAPP-A MoM | 0.674 (0.587–0.761) | 47.4 | 83.3 | 0.001 |
Abbreviations: AUC, area under the curve; CI, confidence interval; ROC, receiver operating characteristic.
The correlations between first-trimester aneuploidy screening markers
(f
| Neonatal weight (percentile) | Neonatal length (percentile) | Neonatal head circumference (percentile) | |
| PAPP-A MoM | r = 0.133, p = 0.006 | r = 0.151, p = 0.002 | r = 0.057, p = 0.240 |
| f |
r = 0.151, p = 0.002 | r = 0.114, p = 0.019 | r = 0.104, p = 0.032 |
| NT MoM | r = 0.015, p = 0.759 | r = 0.024, p = 0.630 | r = 0.076, p = 0.117 |
* Bold/italic value signifies statistical significance.
In a parsimonious multivariable logistic regression model adjusted for maternal
age, BMI, and first-trimester NT MoM, both lower first-trimester PAPP-A MoM
(adjusted odds ratio [aOR]: 2.51, 95% confidence interval [CI]: 1.16–5.44;
p = 0.019) and lower f
| Variable | aOR | 95% CI | p-value |
| PAPP-A MoM | 2.51 | 1.16–5.44 | 0.019 |
| f |
2.95 | 1.35–6.45 | 0.007 |
| NT MoM | 0.69 | 0.15–3.13 | 0.629 |
| Maternal age | 1.03 | 0.96–1.11 | 0.425 |
| Maternal BMI | 1.03 | 0.96–1.11 | 0.437 |
Abbreviations: aOR, adjusted odds ratio.
* Bold/italic value signifies statistical significance.
In this study, we investigated the relationship between first-trimester
aneuploidy screening markers (PAPP-A, f
PAPP-A is a metalloproteinase that mediates the proteolytic cleavage of insulin-like growth factor binding proteins (IGFBPs), particularly IGFBP-4, which increases the availability of free insulin-like growth factors (IGFs). IGFs are key regulators of fetal growth and also modulate glucose and amino acid transport in trophoblastic cells. In addition, IGFs play a crucial role in the autocrine and paracrine regulation of trophoblast invasion into the decidua. Reduced maternal serum PAPP-A levels may therefore be associated with diminished IGF activity, suboptimal trophoblast invasion, impaired placental angiogenesis, and disrupted nutrient transfer, ultimately contributing to FGR [10, 11, 12]. Previous studies have consistently reported an association between low PAPP-A concentrations and the development of SGA neonates, findings that are also supported by the results of the present study [12, 13, 14, 15, 16, 17].
Some studies have shown that high PAPP-A levels lead to an increased risk of LGA and fetal macrosomia [7, 17, 18, 19]. This may be due to the ability of PAPP-A to cleave IGFBPs, increasing IGF bioavailability, which is thought to mediate placental growth and nutrient transfer to the fetus [19]. In our study, although PAPP-A levels were higher in LGA pregnancies than in AGA pregnancies, this difference was not statistically significant. On the other hand maternal PAPP-A levels showed a positive correlation with neonatal birth weight. This suggests that higher PAPP-A levels may lead to an increased risk of LGA. However, Goetzinger et al. [20] failed to show a statistically significant association between high first-trimester PAPP-A levels and LGA birth, despite a reported reduced risk.
f
In the literature, the association between first-trimester maternal
f
The relationship between f
Importantly, the independent associations of PAPP-A and f
ROC curve analysis in our study showed that PAPP-A MoM and f
In this study, no differences in NT were observed among the SGA, AGA, and LGA groups, and no association was found between NT and neonatal anthropometric measurements (weight, length, head circumference). These results suggest that NT measurement is primarily intended for the detection of chromosomal abnormalities and may not directly reflect placental or fetal growth dynamics. In a study published in 2004, Krantz et al. [29] reported no association between NT and IUGR, consistent with our study. Subsequent studies have suggested a relationship between NT and SGA or LGA. A study published in 2011 reported a positive association between NT thickness and birth weight, indicating that greater NT measurements were correlated with higher neonatal weight, whereas lower NT values were linked to an increased likelihood of delivering a small infant [16]. Some studies have found an association between increased NT and LGA [19, 30, 31]. Kelekci et al. [31] reported that markedly elevated NT measurements were linked to a higher frequency of impaired glucose tolerance and macrosomia. In their cohort, pregnancies with NT values exceeding the 95th percentile were compared with those within the normal range. The authors stated that the increased rate of macrosomia in the group with increased NT may be due to the higher prevalence of impaired glucose tolerance. They proposed that microcirculatory disorders and increased capillary permeability in patients with hyperglycemia may cause an increase in NT. The absence of a relationship between NT and neonatal growth parameters in our study may be explained by the exclusion of patients with diabetic conditions, including those with diagnosed glucose intolerance.
Several limitations should be considered when interpreting these findings. First, the retrospective design and the relatively small number of SGA cases may result in limited statistical power and generalizability. The exclusion of fetuses with FGR, although allowing evaluation of an uncomplicated population, may have led to an underestimation of the strength of the associations between first-trimester biochemical markers and impaired fetal growth. Therefore, the results may not be directly generalizable to pregnancies complicated by FGR. Although a multivariable logistic regression analysis was performed adjusting for available maternal factors, including maternal age and BMI, information on smoking status and race or ethnicity was not consistently available and could not be included, representing an additional limitation. The lack of longitudinal fetal growth assessment during pregnancy also precluded evaluation of dynamic growth trajectories.
In conclusion, first-trimester PAPP-A and f
Raw data supporting the findings of this study are available from the corresponding author upon reasonable request.
MD: Conceptualization, methodology, data collection, data analysis, literature review, original draft writing, review and editing, project management. ES: Methodology, data collection, formal analysis, original draft writing, review and editing. ÇY: Methodology, formal analysis, literature review, original draft writing, review and editing. SZ: Concept and design, data collection, review and editing. DEA: Concept and design, data collection, review and editing. All authors contributed to editorial changes in the manuscript. All authors have read and approved the final manuscript. All authors have been sufficiently involved in the work and agree to be responsible for all aspects of the work.
The design of this study was carried out in accordance with the guidelines of the Helsinki Declaration and was approved by the Kocaeli City Hospital Scientific Research Ethics Committee on September 12, 2024 (protocol number: 2024-109). All patients or their families/guardians gave their informed consent before participating in the study.
We thank all participants who took part in our study.
This research received no external funding.
The authors declare no conflict of interest.
Supplementary material associated with this article can be found, in the online version, at https://doi.org/10.31083/CEOG49735.
References
Publisher’s Note: IMR Press stays neutral with regard to jurisdictional claims in published maps and institutional affiliations.