


 , Fengsheng Zhou 1, Ming Li 1, Yan Ding 1,*
1 Department of Ultrasound Medicine, Wuxi People’s Hospital Affiliated to Nanjing Medical University, 214023 Wuxi, Jiangsu, China
Abstract
Non-mass breast lesions (NMBLs) pose significant diagnostic challenges in breast imaging. This study aimed to evaluate the diagnostic performance of integrating an artificial intelligence-powered ultrasound (AI-US) system with digital mammography (DM) for distinguishing benign from malignant NMBLs. Additionally, the study assessed the model’s short-term risk stratification capability and its temporal stability over clinically relevant decision intervals.
In this retrospective, single-center study, 118 patients with 120 NMBLs were enrolled. Imaging assessments were performed using a triple-blinded design. A Cox proportional hazards model was employed to identify predictors of malignancy. To assess the robustness of risk stratification across clinically relevant follow-up intervals, time-dependent receiver operating characteristic (ROC) analysis was performed at 6, 12, and 24 months.
Cox model analysis identified lesion size (hazard ratio [HR] = 1.92 per cm increase), suspicious malignant calcifications on DM (HR = 12.7), and the AI-US malignant risk score (HR = 1.32 per 0.1-unit increase) as independent predictors of malignancy (all p < 0.001). The combined diagnostic model demonstrated strong performance in time-dependent ROC analysis. The area under the curve (AUC) was 0.93 (95% confidence interval [CI]: 0.88–0.97) at 6 months and 0.88 (95% CI: 0.81–0.93) at 24 months, significantly outperforming either modality alone. The combined model achieved a negative predictive value of 93.8%, potentially reducing unnecessary biopsies by 46%.
The integration of AI-US with DM improves diagnostic accuracy for NMBLs and provides a robust risk stratification that remains stable over follow-up intervals of 6 to 24 months. This multimodal approach enables precise risk stratification, potentially reducing unnecessary biopsies and supporting personalized follow-up strategies.
Keywords
- non-mass breast lesions
- breast cancer
- artificial intelligence
- ultrasound
- digital mammography
- cox proportional hazards model
- time-dependent receiver operating characteristic (ROC)
Breast cancer remains a leading cause of cancer-related mortality among women globally [1], with early and accurate diagnosis being paramount for improving survival outcomes [2]. In clinical practice, lesions lacking typical mass-like features are encountered across multiple imaging modalities. While the specific term “non-mass enhancement lesions (NMELs)” is defined within the context of breast magnetic resonance imaging (MRI) [3], the broader clinical problem extends to conventional modalities. This study focuses on these “non-mass breast lesions” (NMBLs) as detected on mammography and ultrasound (US). While MRI offers high sensitivity, its widespread application faces several constraints. These include high cost, limited availability, the need for contrast agents, and variable specificity. Digital mammography (DM) serves as the cornerstone of breast cancer screening, but its sensitivity and specificity for characterizing NMBLs are limited [4]. This is especially true when lesions lack typical mass features or suspicious calcifications. US provides complementary soft-tissue characterization, yet its utility is often compromised by operator dependency and interpretive variability [5]. Consequently, the indeterminate nature of many NMBLs frequently leads to unnecessary biopsies, patient anxiety, and delayed diagnosis of malignancies [6].
Recent advances in artificial intelligence (AI) have propelled the development of multimodal diagnostic frameworks for breast cancer. Prior study has explored integrating AI with mammography and US, demonstrating promising results for general breast lesion classification [5]. However, the application of a combined AI-powered ultrasound (AI-US) and DM approach specifically for the challenging and distinct entity of NMBLs remains less established, warranting further investigation. Moreover, most current diagnostic models rely on logistic regression. These models offer only a static snapshot of malignancy risk from the time of imaging [7]. This static perspective fails to account for the dynamic risk profile of NMBLs across the critical interval between initial imaging and pathological diagnosis, a period during which lesions with indolent or precursor states may evolve [8]. To formally incorporate this temporal dimension into risk prediction, this study leverages the Cox proportional hazards model [9, 10], not for survival analysis, but as a novel tool for diagnostic hazard estimation. This approach directly quantifies how imaging features influence the hazard of malignancy over time, addressing the significant knowledge gap in stratifying the intermediate-term risk of NMBLs within a multimodal AI-US/DM framework.
To address these limitations, our study had three key goals. First, we assessed the diagnostic performance of combining AI-US with DM for NMEL classification, comparing the combined model against each method individually. Second, to incorporate the temporal dimension and identify key predictors, we employed a Cox proportional hazards model coupled with time-dependent receiver operating characteristic (ROC) analysis to evaluate the model’s accuracy over 6, 12, and 24 months. Third, we conducted sensitivity analyses to test the model’s robustness and estimate its potential to reduce unnecessary biopsies and guide personalized follow-up.
This retrospective study enrolled 118 female patients with NMBLs who presented at Wuxi People’s Hospital between October 2021 and
December 2024. Patient age ranged from 32 to 77 years, with a mean of 54.86
Lesions were stratified into two groups based on pathological diagnosis: (1) Malignant group (n = 70 lesions): Invasive ductal carcinoma (n = 41), Ductal carcinoma in situ (n = 25), Invasive lobular carcinoma (n = 3), Invasive apocrine carcinoma (n = 1). (2) Benign group (n = 50 lesions): Hyperplastic lesions (n = 32), Adenosis (n = 7), Intraductal papilloma (n = 6), Fibroadenoma (n = 3), Chronic inflammation (n = 2).
Note on Cohort Finalization: Initially, 54 benign lesions were identified based on pathology records. However, following radiological-pathological correlation analysis: (1) 2 hyperplastic lesions (with atypical calcifications) were excluded. (2) 2 fibroadenomas (failed AI analysis) were excluded [11]. Thus, 50 benign lesions were included in the final analysis. The malignant group remained unchanged (n = 70 lesions). This resulted in a total of 120 lesions analyzed, as all exclusions were from the initial benign cohort. The two patients had bilateral lesions, each confirmed independently. One was multifocal hyperplasia in the ipsilateral breast, and the other was a contralateral fibroadenoma with calcification; both were included in the benign group.
Inclusion Criteria: (1) Availability of complete clinical and imaging data. (2)
Concurrent performance of both conventional breast US and DM within the study period, with independent confirmation of NMBL
diagnosis by two senior ultrasonographers (each with
Exclusion Criteria: (1) Pregnant or lactating women. (2) Patients with a history of prior localized breast radiotherapy or chemotherapy.
Triple-Blinded Design: (1) The ultrasonographers interpreting conventional US images were blinded to the DM results and AI-US outputs. (2) The radiologists interpreting DM images were blinded to the US results and AI-US outputs. (3) The pathologists providing the definitive histopathological diagnoses were blinded to all imaging findings.
The study protocol was approved by the Ethics Committee of Wuxi People’s Hospital (Approval No.: 3218902). Written informed consent was obtained from all participants.
Multiple high-end color Doppler US systems were utilized in this study, including: MyLab X9 (Esaote S.p.A., Genoa, Italy) and MyLab Omega (Esaote S.p.A., Genoa, Italy) equipped with high-frequency linear array transducers (center frequency range: 7–18 MHz), operating in breast-specific imaging modes including tissue harmonic imaging (THI). A standardized scanning protocol was implemented prior to examinations based on international guidelines [13]. Systematic multi-planar scanning of the entire breast was performed for all participants.
Image acquisition protocol: (1) Maximal diameter view: sonograms depicting the
lesion’s maximum diameter. (2) Suspicious malignancy features: representative
views highlighting features suggestive of malignancy (e.g., microcalcifications,
architectural distortion) in B-mode. (3) Orthogonal planes: at least two
perpendicular planes (i.e., transverse and longitudinal views). Concurrently, the
maximum lesion diameter and axillary lymph node status were recorded [14].
Lymphadenopathy was defined as a short-axis diameter
Formalin-fixed, paraffin-embedded breast tissue sections (4 µm thickness)
were subjected to standardized H&E staining. Following deparaffinization in
xylene (2
The AI-SONIC Deep01 system (version 2.5.0; Deep01 Inc., Taipei, Taiwan) was employed. This deep learning-based tool was initially trained on a retrospective cohort of 12,000 breast lesions from three tertiary hospitals. It had undergone internal validation, showing an AUC of 0.92 for malignancy detection in a pilot study. Upon inputting acquired sonographic images, the system’s deep learning algorithm performed automatic lesion recognition and segmentation, including edge features such as acoustic halo and spiculated margins. Manual correction of segmentation results was permitted by the operator when necessary [15].
The system generated two core outputs: (1) Malignancy Risk Score (MRS): A
continuous variable ranging from 0 to 1, where higher values indicate greater
probability of malignancy [16]. (2) BI-RADS-Based Classification: Lesions were
categorized into three groups according to the ACR BI-RADS guidelines: Likely
benign: BI-RADS category
Diagnostic Integration Principle: If inconsistent results were obtained for the same lesion across different imaging planes, the highest MRS value and its corresponding BI-RADS classification were adopted as the final diagnosis (i.e., highest-suspicion-priority principle). A representative analysis interface is illustrated in Fig. 1.
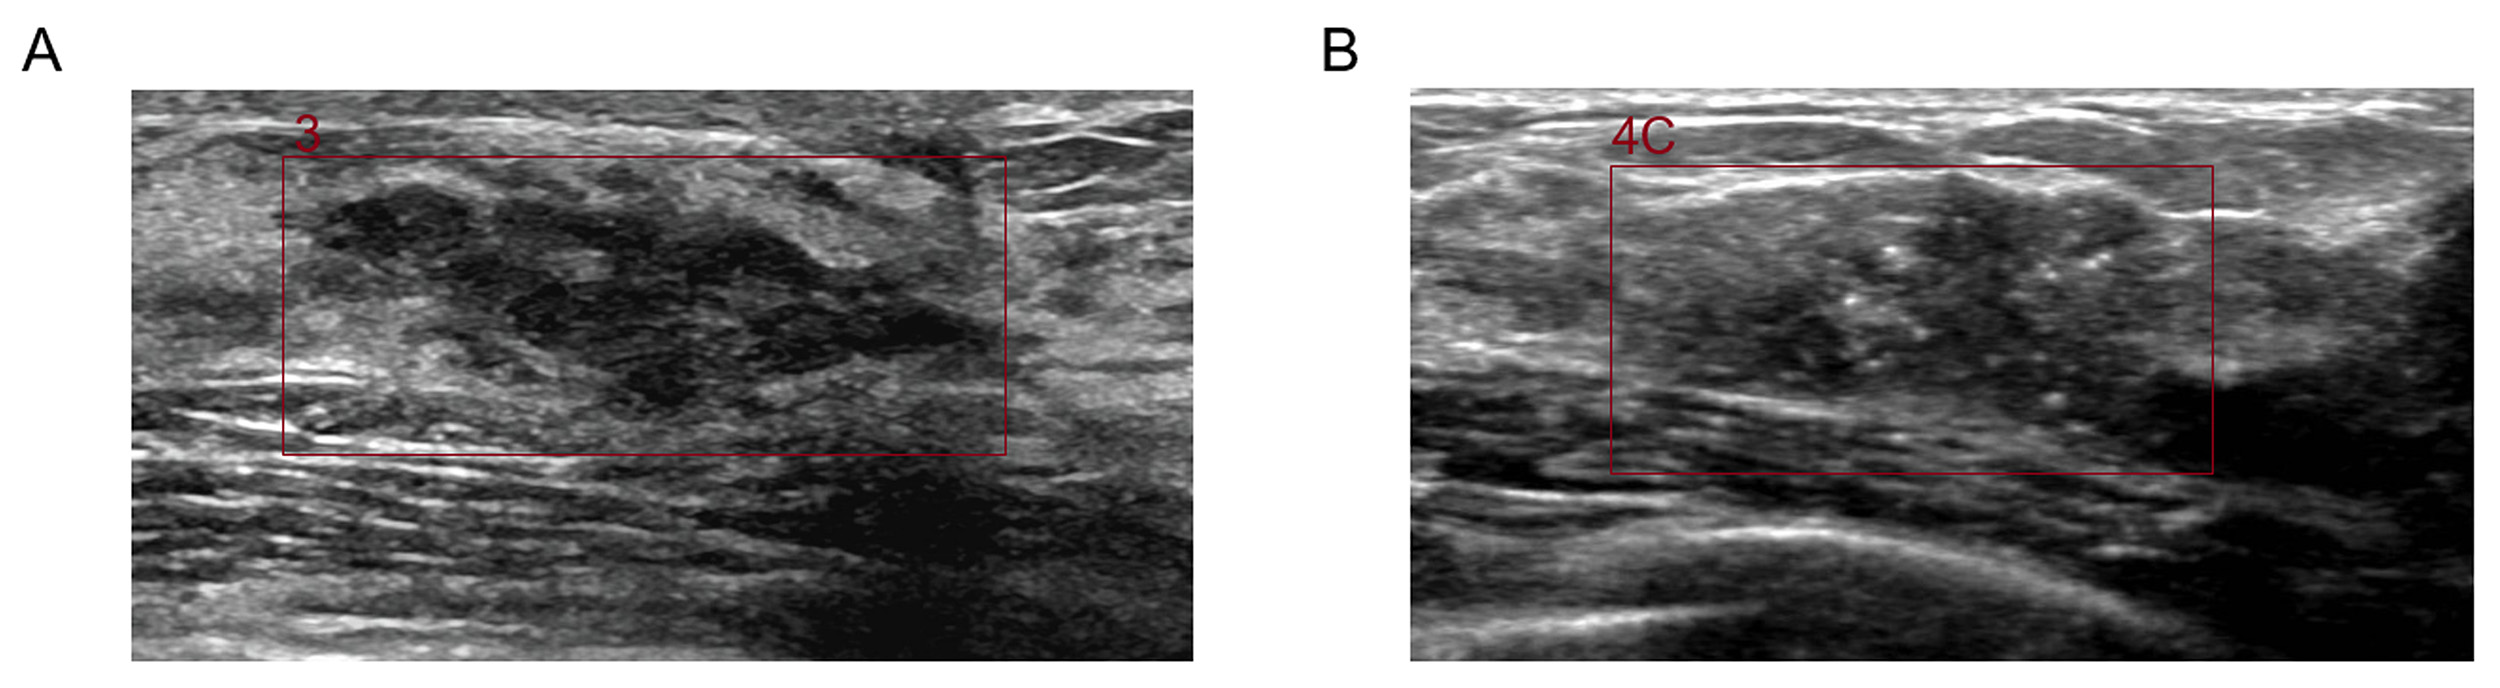 Fig. 1.
Ultrasound-based artificial intelligence-assisted system for BI-RADS classification of breast lesions. (A) 39-year-old woman with left breast hyperplasia. Maximum diameter: approximately 25 mm. MRS: 0.52, BI-RADS category 3. (B) 49-year-old woman with histologically confirmed right invasive breast carcinoma. Maximum diameter: approximately 28 mm. MRS: 0.87, BI-RADS category 4C. MRS, Malignancy risk score; BI-RADS, breast imaging reporting and data system.
Mammography was performed using the Hologic Selenia full-field DM system equipped with tomosynthesis capability [18]. Standard imaging projections included bilateral craniocaudal (CC) and mediolateral oblique (MLO) views.
Image Interpretation: Two board-certified radiologists with over 13 years of
breast imaging experience independently reviewed all mammograms. Assessments
followed the ACR BI-RADS Mammography guidelines (2013 edition). Particular
attention was paid to suspicious malignant features. These included
microcalcification distribution (focal or regional) and morphology (e.g.,
clustered, fine linear branching, or fine segmental calcifications
Inter-observer agreement between the two mammography readers and between the two
ultrasonographers was quantified using weighted kappa (
Statistical analyses were performed using R software (version 4.3.0; R
Foundation for Statistical Computing, Vienna, Austria) with the ‘survival’ and
‘timeROC’ packages, and MedCalc (version 22.0; MedCalc Software Ltd., Ostend,
Belgium). The follow-up duration was defined as the time interval from the
initial imaging diagnosis to the pathological confirmation. The median follow-up
time was 45 days (IQR: 28–79 days), providing a clinically relevant time frame
for applying the Cox model to assess the temporal stability of diagnostic risk.
Methodological Rationale: As all lesions had a pathological diagnosis, the Cox
model was used not for survival prediction but to robustly identify prognostic
imaging features and to facilitate time-dependent ROC analysis, which evaluates
the model’s performance stability across clinically relevant time points (6–24
months). Key Analytical Methods: 1. Cumulative Incidence Calculation: Incidence
rate = Number of malignant cases/Total person-years of follow-up (Follow-up
duration: Time interval from initial imaging diagnosis to pathological
confirmation). 2. Cox proportional hazards modeling: Analyzed associations
between clinical/imaging variables and malignant pathology; Time scale: Interval
from initial diagnosis to pathological confirmation; Variable specification:
Continuous variables (standardized per unit increase): (1) Lesion size (per 1-cm
increment). (2) AI MRS (per 0.1-unit increment). Categorical
variables (reference groups): (a) No axillary lymphadenopathy; (b) Absence of
suspicious calcifications. The proportional hazards assumption for the final Cox
model was assessed using the Schoenfeld residual test. 3. Time-dependent ROC
analysis: Calculated AUC at 6, 12, and 24 months; Evaluated temporal stability of
diagnostic performance. 4. Sensitivity analyses: (1) Exclusion of pathology
upgrade cases (e.g., benign on core needle biopsy but malignant at surgical
excision). (2) Stratification by calcification distribution pattern (clustered
vs. diffuse). Statistical significance threshold was set at
The Cox proportional hazards model was applied to rank lesion risk based on short-term follow-up data (median 45 days to pathological confirmation). This approach was used not to estimate long-term survival, but to assess risk within a clinically relevant timeframe. The time points specified in the time-dependent ROC analysis (6, 12, and 24 months) correspond to clinically relevant monitoring windows. This analysis therefore evaluates the consistency of the model’s risk ranking when projected onto these future clinical decision points.
The final analysis included 118 female patients with 120 NMBLs, including two patients with bilateral lesions. Patient age ranged from
32 to 77 years (mean: 54.86
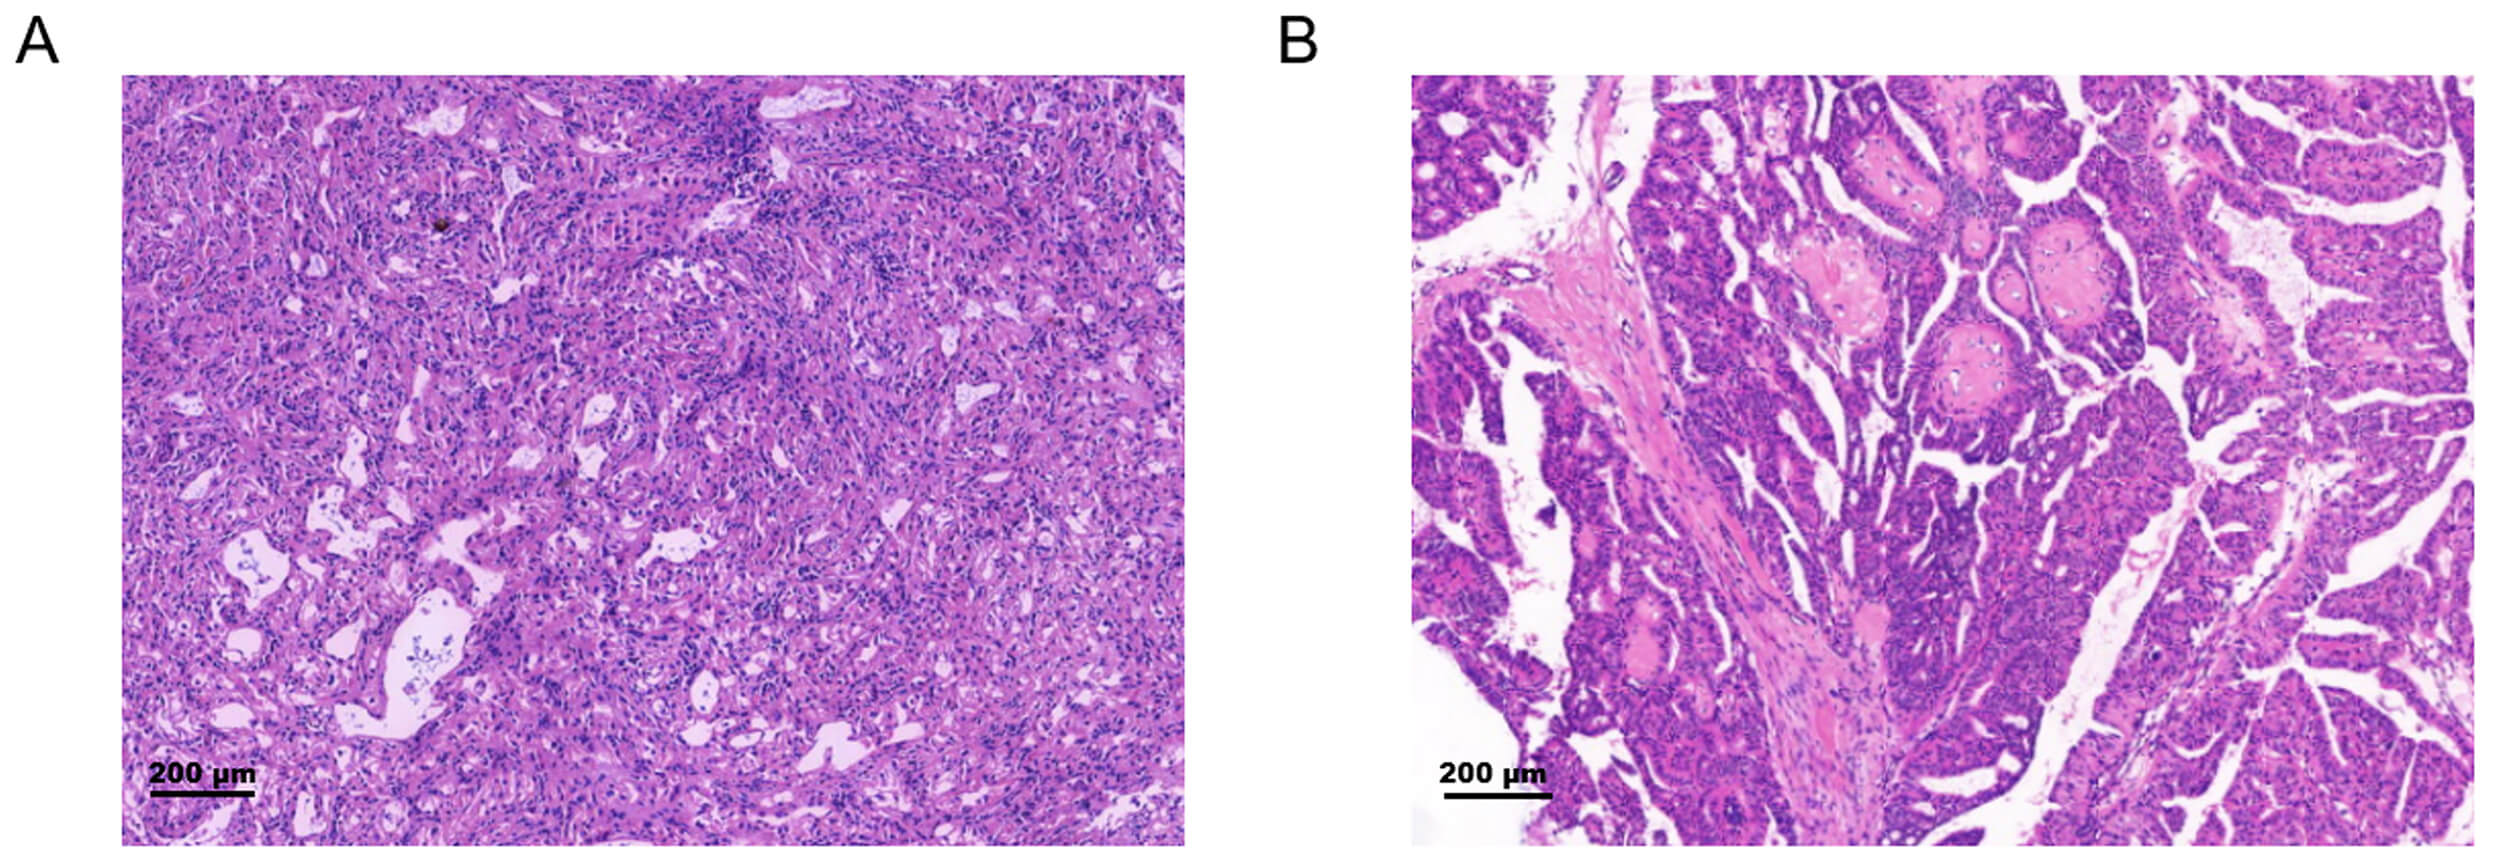 Fig. 2.
Representative histopathology of non-mass breast
lesions. (A) Invasive ductal carcinoma (H&E, 40
Table 1 presents the statistical comparison of clinical and imaging
characteristics between benign and malignant groups. Patients in the malignant
group were older than those in the benign group (mean age: 55.82
| Characteristic | Malignant | Benign | p-value |
| (n = 70) | (n = 50) | ||
| Age (years) | 55.82 |
52.11 |
0.064* |
| Lesion size (cm) | 2.72 (1.92, 3.51) | 1.71 (1.34, 2.42) | |
| Axillary lymphadenopathy | 26 (37.1%) | 6 (12.0%) | 0.003† |
| Suspicious calcifications on DM | 58 (82.9%) | 9 (18.0%) | |
| AI malignancy risk | 0.83 (0.75, 0.89) | 0.38 (0.18, 0.68) |
*Continuous variables: Mean
†Categorical variables: n (%) (Chi-square test or Fisher’s exact test).
DM: digital mammography.
Imaging features analysis revealed: (1) Mammographically detected suspicious
malignant calcifications were significantly more frequent in malignant lesions
(82.9% [58/70] vs. 18.0% [9/50]; p
Cox proportional hazards regression assessed the predictive value of clinical
and imaging features for malignant progression of NMBLs. Time was measured from
initial radiological diagnosis to pathological confirmation. On multivariable
analysis (Table 2), three independent predictors emerged: maximum lesion diameter
(HR = 1.92, 95% CI [1.40–2.64], p
| Variable | Unit/Comparison | Univariable Analysis | Multivariable Analysis | ||
| HR (95% CI) | p-value | Adjusted HR (95% CI) | p-value | ||
| Age (years) | Per 1-year increase | 1.05 (1.01–1.09) | 0.012 | ||
| Lesion size (cm) | Per 1-cm increase | 2.10 (1.65–2.68) | 1.92 (1.40–2.64) | ||
| Suspicious calcifications | Present vs Absent | 18.20 (7.6–43.5) | 12.70 (5.10–31.60) | ||
| AI malignancy risk | Per 0.1-unit increase | 1.54 (1.33–1.78) | 1.32 (1.14–1.53) | ||
| Axillary lymphadenopathy | Present vs. Absent | 3.82 (1.52–9.60) | 0.004 | 1.48 (0.99–2.21) | 0.052 |
Final model retained variables with p
Overall model significance: p
Reference group: “Absent” for categorical variables.
Time scale: Interval from initial imaging diagnosis to pathological confirmation of malignancy.
Axillary lymphadenopathy (p = 0.052) was excluded from the final model
due to lack of statistical significance (
HR, hazard ratio; CI, confidence interval.
The integrated predictor combined maximum lesion diameter, suspicious
calcifications on mammography, and AI malignant risk. It demonstrated stable
performance during temporal validation (Table 3): (1) The integrated model
achieved significantly higher time-dependent AUCs than single methods at 6 months
(AUC = 0.93; 95% CI: 0.88–0.97), 12 months (AUC = 0.90; 95% CI: 0.84–0.95),
and 24 months (AUC = 0.88; 95% CI: 0.81–0.93) (p
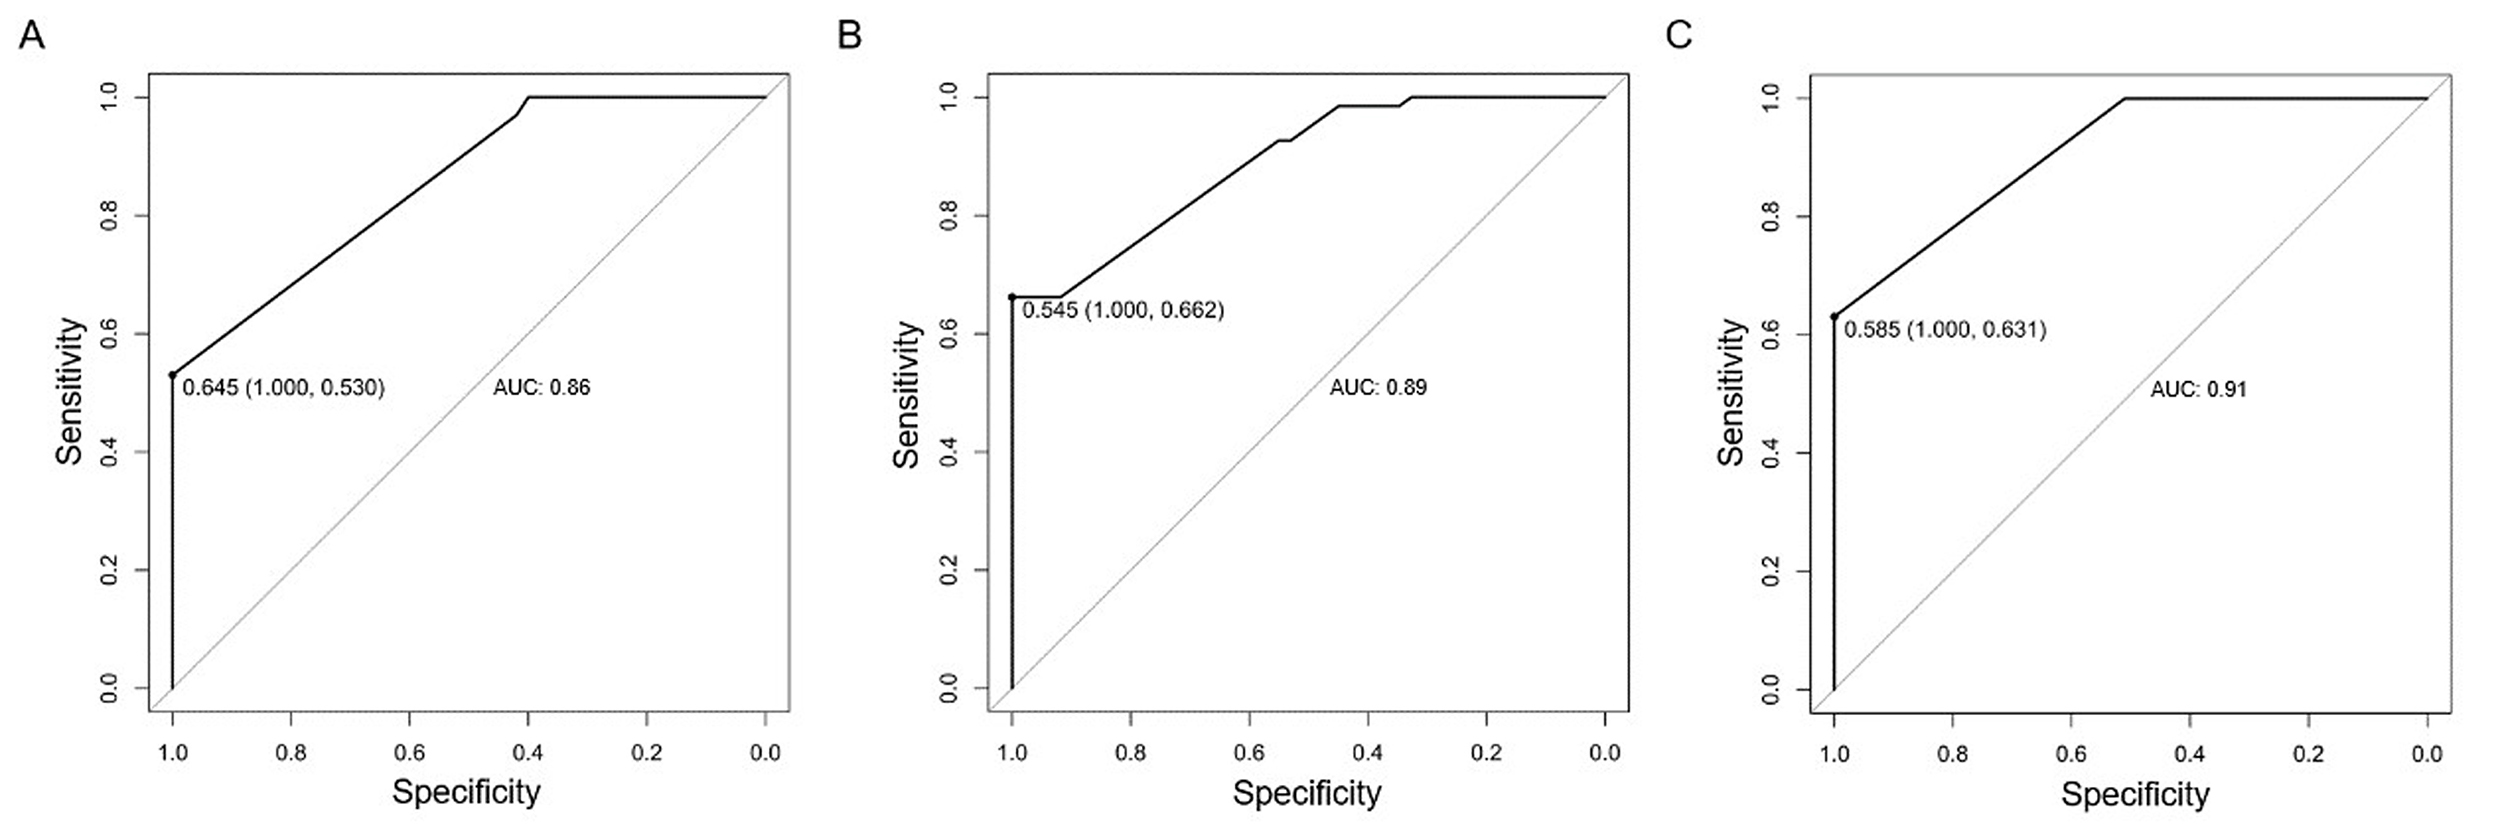 Fig. 3.
Diagnostic performance of DM, AI-US, and combined model for non-mass breast lesions: ROC curve analysis. (A) ROC curve of DM alone for discriminating malignant vs. benign non-mass breast lesions, with an area under the curve (AUC) of 0.86 (95% CI: 0.78–0.91). (B) ROC curve of the AI-US system alone for malignancy discrimination, achieving an AUC of 0.89 (95% CI: 0.82–0.93). (C) ROC curve of the combined AI-US/DM model for malignancy prediction, demonstrating the highest diagnostic performance with an AUC of 0.91 (95% CI: 0.85–0.95). Note: These ROC curves represent static, single-time-point diagnostic performance, distinct from the time-dependent AUCs presented in Table 3, which evaluate performance over specific follow-up intervals (6, 12, and 24 months).
| Diagnostic method | AUC at 6 months (95% CI) | AUC at 12 months (95% CI) | AUC at 24 months (95% CI) |
| AI system malignancy risk | 0.85 (0.78–0.91) | 0.83 (0.75–0.89) | 0.81 (0.72–0.88) |
| DM suspicious calcification | 0.87 (0.80–0.92) | 0.85 (0.77–0.90) | 0.82 (0.74–0.89) |
| Combined model | 0.93 (0.88–0.97) | 0.90 (0.84–0.95) | 0.88 (0.81–0.93) |
Table 4 presents findings confirming the robustness of the integrated model: 1.
Cases without pathology upgrade (n = 112): The model yielded a hazard ratio (HR)
of 4.65 (95% CI: 2.98–7.25, p
| Analysis type | HR (95% CI) | p-value |
| Entire cohort (n = 120) | 4.82 (3.15–7.38) | |
| Cases without pathology upgrade (n = 112) | 4.65 (2.98–7.25) | |
| Clustered calcification subgroup (n = 67) | 5.21 (3.14–7.37) | |
| Diffuse calcifications subgroup (n = 53) | 3.94 (2.01–7.72) | 0.002 |
This study demonstrated that integrating AI-US with DM significantly enhances the diagnostic accuracy for NMBLs. By employing a Cox proportional hazards model, we moved beyond a static risk snapshot to provide a time-to-event based risk estimation. This approach identified three key independent predictors: lesion size (HR = 1.92 per cm), suspicious calcifications on DM (HR = 12.7), and the AI-US MRS (HR = 1.32 per 0.1-unit increase).
Our findings corroborate the synergistic value of combining AI-US and DM [22]. The AI-US system provided an objective quantification of sonographic features (MRS and BI-RADS classification). In contrast, DM uniquely excelled in detecting microcalcifications, which were a dominant predictor in our model. Although each modality alone showed good diagnostic capability (6-month AUC: AI-US = 0.85, DM = 0.87), their integration achieved significantly superior performance (AUC = 0.93 at 6 months). This synergy likely mitigates the inherent limitations of each modality alone. For instance, it may compensate for AI-US’s potential difficulty with atypical calcifications and for DM’s reduced sensitivity in lesions lacking calcifications [23].
Building upon prior research that explored AI integration with mammography [Radiology, 2023; Medicina, 2025], this study extended the multimodal framework by specifically targeting the diagnostic challenge of NMBLs. Furthermore, we introduced a temporal dimension to risk prediction by applying a Cox proportional hazards model. The 24-month horizon for time-dependent ROC analysis corresponds to the critical clinical window for managing NMBLs, wherein the essential decision to biopsy or to follow a lesion is most pressing. Our model’s stable, high risk stratification ability throughout this period, with AUC declining only from 0.93 to 0.88, confirms its utility for medium-term risk stratification. A low-risk assessment safely justifies extending follow-up intervals to 12 months, while a high-risk score warrants immediate intervention, thereby directly addressing the core management challenge for these lesions. Age was not significantly associated with malignancy in baseline comparison (p = 0.064) but showed a significant association in univariable time-to-event analysis (p = 0.012). This discrepancy reflects the different analytical perspectives: the baseline comparison tests for a difference in mean age at a single time point, while the univariable Cox model assesses the continuous relationship between increasing age and the hazard of malignancy over time. The Cox model’s sensitivity to monotonic risk trends may explain its detection of a significant association. However, age was not retained in the final multivariable Cox model (p = 0.152), indicating that its predictive contribution was subsumed by the stronger independent predictors (lesion size, suspicious calcifications, and AI risk score).
The substantial inter-observer agreement in imaging interpretations reinforces the reliability of our input data. Furthermore, the use of calibrated equipment ensures that the AI-US system’s performance is not attributable to device-specific artifacts. Although the predictive efficacy of the integrated model was consistent regardless of calcification morphology (p for interaction = 0.18), the higher model-estimated hazard ratio in the clustered calcification subgroup (HR = 5.21 vs. 3.94 for diffuse) strongly suggests that NMBLs with this feature harbor a greater intrinsic risk of malignancy [24]. This finding aligns with established histopathological knowledge linking clustered calcifications to ductal carcinoma in situ (DCIS) or microcalcifications associated with invasive carcinoma.
Our model demonstrated exceptional temporal stability, with minimal decline in
time-dependent AUC over 24 months, and robust performance in internal validation,
underscoring its reliability. The robustness of this temporal risk prediction is
further supported by the fact that the Cox model met the proportional hazards
assumption (Schoenfeld test p
The clinical value of this approach is threefold: (1) The integrated model achieves a high negative predictive value of 93.8%, enabling reliable identification of low-risk, benign NMBLs. According to our cohort data, this could potentially reduce unnecessary biopsies by approximately 46%. Thereby, it optimizes healthcare resource utilization and alleviates patient physical and psychological burdens, a key goal in breast imaging research [25, 26]. By minimizing unnecessary biopsies, our strategy spares patients procedural risks and anxiety. It also directs timely intervention to high-risk cases, improving both clinical efficiency and the patient experience. (2) Risk-tailored management: High-risk lesions (e.g., with clustered calcifications, a high AI-US score, or larger size) prompt shorter follow-up intervals (3–6 months) or immediate biopsy. Low-risk lesions (e.g., those with only diffuse calcifications, low-to-intermediate AI-US MRS, and smaller size) may be managed with a de-escalated surveillance regimen. For example, follow-up intervals could be extended to 12 months, provided continuous monitoring is maintained [27]. (3) Assurance of robustness: Sensitivity analysis excluding pathology upgrade cases (n = 8) confirmed the model’s robustness (HR = 4.65 vs. full cohort 4.82), effectively mitigating concerns over biopsy sampling error and supporting real-world reliability.
This study has several limitations. First, its single-center, retrospective design with a modest sample size may limit the generalizability of our findings. Second, the absence of a direct comparison with breast MRI precludes a definitive assessment of our model’s relative performance. Breast MRI is the reference standard for evaluating non-mass enhancement (NME), which is the MRI correlate of the broader spectrum of NMBLs. Third, the 24-month follow-up, while clinically relevant for medium-term decision-making, is insufficient for evaluating long-term risk. Finally, the model does not incorporate established prognostic factors such as molecular subtypes.
Future multi-center prospective studies with extended follow-up and direct MRI comparison are warranted to validate our model in diverse populations and clinical settings. Furthermore, demonstrating the model’s robustness across different US devices and its seamless integration into clinical workflows will be crucial steps toward regulatory approval and broader clinical adoption. Subsequent research should also integrate radiomics, clinicopathological, and molecular data for more comprehensive risk prediction.
The integration of AI-US with DM significantly enhances diagnostic accuracy for breast NMBLs. This study demonstrates that this multimodal approach, augmented with time-to-event analysis via Cox proportional hazards modeling, provides robust and temporally stable risk prediction (AUC = 0.88 at 24 months). Key independent predictors include lesion size (HR = 1.92/cm), suspicious DM calcifications (HR = 12.7), and AI-US risk score (HR = 1.32/0.1-unit).
Crucially, clustered calcifications on DM warrant heightened vigilance due to their strong association with malignancy. The integrated model enables precise risk stratification. It potentially reduces unnecessary biopsies by 46% through its high negative predictive value (93.8%). It also guides personalized follow-up intervals; for example, extending to 12 months for low-risk lesions with diffuse calcifications. This temporally validated strategy refines clinical management pathways for NMBLs.
All data associated with this study and the custom code developed for the AI model are available upon reasonable request from the corresponding author.
SH and YD designed the research study. SH, FZ and ML performed the research and collected the data. SH and FZ analyzed the data. All authors contributed to editorial changes in the manuscript. All authors read and approved the final manuscript. All authors have participated sufficiently in the work and agreed to be accountable for all aspects of the work.
This study was approved by the Medical Ethics Committee of Wuxi People’s Hospital Affiliated to Nanjing Medical University (Approval No. 3218902). Written informed consent was obtained from all participants prior to their enrollment. All procedures, including blood collection and data handling, were conducted in accordance with the ethical principles of the Declaration of Helsinki.
We thank the clinical and nursing staff of Wuxi People’s Hospital’s Department of Ultrasound Medicine for their role in patient recruitment and data collection. We are also grateful to our IT and technical support teams for maintaining the computational infrastructure. Our sincere appreciation goes to the peer reviewers for their valuable feedback, which has substantially improved this manuscript.
This study was supported by the Wuxi Municipal Double Hundred Young and Middle-Aged Reserve Top Talents Program in Medical and Health Fields (Grant No. HB2023001) and the Jiangsu Provincial Health Commission Scientific Research Fund Project (Grant No. X202336).
The authors declare no conflict of interest.
The authors employed ChatGPT-3.5 for spelling and grammar checking during manuscript preparation. All content was subsequently reviewed and edited by the authors, who assume complete responsibility for the published work.
References
Publisher’s Note: IMR Press stays neutral with regard to jurisdictional claims in published maps and institutional affiliations.