


 , Bai Ci 1,†, Quzhen Gongsang 1, La Yang 1, Zhuoga Danzeng 1, Puchi Zhaxi 1, Lamu Ciren 1, Zhuoga Ci 1, Zong Yang 1, Jialei Feng 2,*
1 Delivery Room, Lhasa People’s Hospital, 850000 Lhasa, Tibet, China
2 Department of Obstetrics, Peking University First Hospital, 102600 Beijing, China
†These authors contributed equally.
Abstract
Umbilical artery blood gas (UABG) parameters serve as critical indicators of metabolic and oxygenation status in newborns at birth, including base excess (BE), pH, and lactate (LAC). In high-altitude hypoxic environments, the factors that influence these parameters in indigenous populations may be unique. This study aimed to identify the factors affecting UABG parameters among a low-risk, physiological Tibetan population at high altitude.
This retrospective study analyzed data from 524 Tibetan women and their newborn babies who gave birth vaginally at a high-altitude hospital between January 1, 2024, and December 31, 2024. BE was the primary outcome, while pH and LAC were exploratory outcomes. Maternal and neonatal characteristics were categorized according to median pH, BE, and LAC values. Statistical methods, including t-tests, Mann-Whitney U tests, chi-squared tests, and linear regression models, were employed to identify factors influencing UABG.
The median (interquartile range [IQR]) values for UABG were pH: 7.28 (7.22, 7.33), BE: –8.00 (–10.00, –7.00) mmol/L, and LAC: 4.37 (3.47, 5.40) mmol/L. In univariate analyses, a lower pH (≤7.28) was associated with primiparity, shorter maternal height, longer second and third stage of labor, and neonatal length. A lower BE (≤–8.00 mmol/L) was associated with primiparity and longer first and second stages of labor. A lower LAC (≤4.37 mmol/L) was associated with multiparity, less frequent premature rupture of membranes, shorter second and third stages of labor, lower immediate blood loss, and total blood loss within 2 hours postpartum. Multivariable linear regression revealed maternal height as a positive predictor for pH (β = 0.002, p = 0.016), while the second stage duration was a negative predictor for pH (β = –0.001, p = 0.001) and BE (β = –0.017, p < 0.001), and a positive predictor for LAC (β = 0.003, p = 0.003). Neonatal length was a negative predictor for pH (β = –0.037, p = 0.005). Parity was a positive predictor for BE (β = 0.500, p = 0.045). Robust regression validated these associations. Significant differences were observed in pH, BE, and LAC between primiparous and multiparous women (p < 0.05). Significant differences were observed in BE between epidural anesthesia and non-anesthesia groups (p < 0.05).
In this low-risk Tibetan population, pH was influenced by maternal height, the duration of the second stage of labor, and neonatal length. BE was influenced by parity and the duration of the second stage of labor. The duration of the second stage of labor is a factor influencing LAC. These results should not be generalized to high-risk pregnancies or complex delivery scenarios, as the study cohort was restricted to women with physiologically normal pregnancies who delivered vaginally.
Keywords
- high-altitude pregnancy
- Tibetan
- umbilical artery blood gas
The distinctive hypoxic environment of high-altitude regions has long been a key focus in perinatal medicine due to its impact on pregnancy and childbirth [1]. Prolonged exposure to low-pressure, low-oxygen environments at altitudes above 2500 meters can affect the mother, fetus, and newborn [2]. In the mother, this can lead to compensatory physiological changes, such as erythrocytosis and placental vascular remodeling. In the fetus, intrauterine growth patterns adapt, and the hypoxic environment may affect its development and health after birth [3]. As indigenous inhabitants of high-altitude regions, Tibetans have developed remarkable hypoxic adaptation capabilities through long-term natural selection and physiological adjustments [4]. However, it is not fully elucidated whether this adaptive mechanism affects the characteristics of their labor process during delivery (e.g., number of deliveries, duration of labor) and influences neonatal outcomes (e.g., birth weight, asphyxia).
Umbilical artery blood gas analysis (UABGA) is used to assess the oxygenation and acid-base status of neonates, as well as their respiratory response capacity. It has predictive value for adverse outcomes, including early identification of complications such as hypoxic injury and respiratory distress syndrome [5]. Key indicators of acid-base balance and oxygenation status in neonates include pH, base excess (BE), and lactate (LAC). A significant decrease in pH, a large negative BE deviation, and a significant increase in LAC levels suggest that the neonate may be experiencing acidosis [6]. Studies have shown that severe acidosis is strongly associated with increased neonatal mortality and neurological complications, while mild metabolic imbalance can also raise the risk of adverse outcomes in term neonates [7, 8]. Low [9] demonstrated that severe intrapartum hypoxic-ischemic events, reflected by marked metabolic acidosis at birth, strongly predict fetal brain injury. In high-altitude regions, the hypoxic environment can have a greater impact on these indicators and, consequently, on neonatal health [10]. Previous studies have primarily focused on complications of high-altitude pregnancy, such as preeclampsia and fetal growth restriction (FGR), with little attention given to the relationship between physiological labor processes, labor characteristics, and neonatal UABGA, particularly in indigenous Tibetan populations that have developed a hypoxic adaptation phenotype.
This study aims to systematically investigate the association between the delivery characteristics of Tibetan women in plateau regions, including parity, epidural analgesia, and the duration of the second stage of labor, and the blood gas parameters (pH, BE, and LAC) of their term newborns, through a retrospective analysis. This research will provide scientific evidence to inform obstetric clinical practice in plateau regions.
This retrospective study analyzed perinatal data from all eligible Tibetan mothers from high-altitude regions who delivered at our hospital (at an elevation of 3658 meters) between January 1, 2024, and December 31, 2024. A double-checking system was implemented to ensure data accuracy and completeness, in which two independent researchers cross-verified all extracted data against the original medical records.
Inclusion criteria were as follows: (1) local residents with permanent residency and at least one year of continuous local residence; (2) vaginal delivery with singleton pregnancy; (3) neonates with a 1-minute Apgar score of 7 or above; (4) term neonates with a gestational age of 37–42 weeks and birth weight of 2500–4000 grams; and (5) complete clinical data for both mother and infant.
Exclusion criteria included: (1) cesarean section or breech delivery; (2)
maternal diabetes; (3) maternal drug use, sedative use, smoking, or alcohol
consumption during pregnancy; (4) pregnancy-induced hypertension or preeclampsia;
(5) previous cesarean section; (6) FGR; (7) oligohydramnios or meconium-stained
amniotic fluid; (8) neonatal organ dysfunction, congenital anomalies, or severe
malformations; (9) outliers: interquartile range (IQR) method: this
non-parametric method identifies outliers as data points falling below
Q1 – 1.5
Immediately after fetal delivery, a rapid assessment was conducted. If the newborn was breathing or crying, it was placed prone with its head turned to one side, and skin-to-skin contact with the mother was initiated. To ensure the sample was arterial blood, the umbilical artery was identified by its thicker, more muscular wall and typically single appearance compared with the two thinner-walled veins. UABGA blood samples were collected either during delayed cord clamping (60 seconds after birth) or before cord pulsations ceased (1~3 minutes postpartum) using a heparinized syringe to puncture the umbilical artery. For newborns requiring immediate resuscitation, samples were collected by a midwife not involved in resuscitation, within minutes of placental delivery. If immediate sampling was not possible, the umbilical cord segment was clamped, refrigerated, and analyzed within 60 minutes. The UABGA indicators (pH, residual base BE, and LAC) were measured using the Abbott i-STAT1 handheld blood gas analyzer (model 300; manufacturer: Abbott Point of Care Inc.; country of origin: Singapore) with CG4+ cartridges (manufacturer: Abbott Point of Care Inc.).
The baseline maternal data collected included age, height, gestational age,
gravidity, pre-pregnancy weight, intrapartum weight, epidural anesthesia use,
premature rupture of membranes, duration of each stage of labor, blood loss,
total blood loss within two hours postpartum, and placental weight. The neonatal
characteristics assessed were neonatal sex, weight, length, and head
circumference. This information was sourced from medical records and electronic
delivery registers. The UABGA indicators measured were pH, BE, and LAC, obtained
from the blood gas analyzer results. High-risk threshold values for UABGA were
defined as pH
Statistical analysis was conducted on the collected data. The normality of all
continuous variables was evaluated using both the Kolmogorov-Smirnov test and
visual inspection of Quantile-Quantile (Q-Q) plots. Given the large sample size (n = 524), primary
reliance was placed on the Kolmogorov-Smirnov test results. For variables
subjected to group comparisons, homogeneity of variances was assessed using
Levene’s test. Variables with approximately normal distribution and homogeneous
variances were analyzed using the independent samples t-test. Variables
with approximately normal distribution but heterogeneous variances were analyzed
using Welch’s t-test, which does not assume equal variances. Variables
significantly deviating from a normal distribution were analyzed using the
non-parametric Mann-Whitney U test, which does not require variance homogeneity.
For qualitative variables, the chi-square test was used for analysis. Linear
regression analysis was employed to identify factors independently associated
with UABG parameters (pH, BE, LAC). Variables with a p-value
The initial cohort consisted of 2508 mothers who gave birth at the hospital in
2024. After applying exclusion criteria, including incomplete (n = 1172)
or abnormal (n = 147) data, non-Tibetan ethnicity (n = 21), and
the presence of various comorbidities (n = 644), a total of 524 mothers
were included in the analysis (Fig. 1). Of these, 225 were primiparous, and 299
were multiparous. Regarding anesthesia, 49 individuals received it, while 475 did
not. The pH level was 7.28 (7.22, 7.33), the BE level was –8.00 (–10.00,
–7.00) mmol/L, and the LAC level was 4.37 (3.47, 5.40) mmol/L. The UABG
parameters of these 524 mothers were then categorized into groups based on
cut-off values for pH (
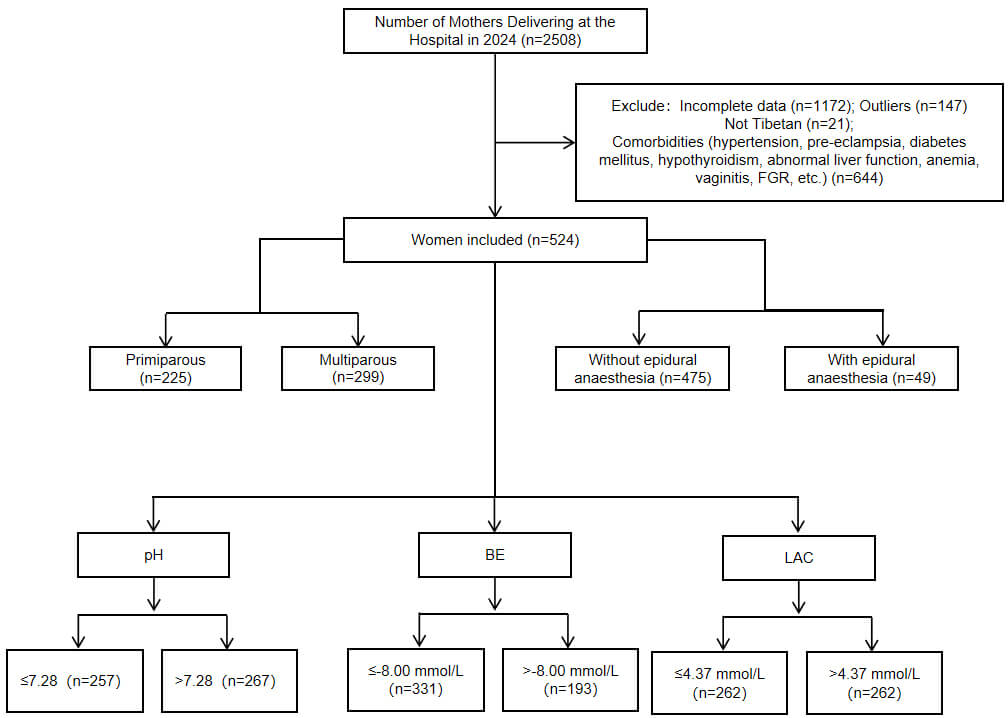 Fig. 1.
Participant flowchart. BE, base excess; LAC, lactate; FGR, fetal growth restriction.
Comparison of maternal and neonatal characteristics by UABGs groups is shown in
Table 1. Compared with pH
| Variable | pH | t/ |
p | BE | t/ |
p | LAC | t/ |
p | ||||
| Parity | 6.686 | 0.010 | 29.874 | 0.001 | 20.259 | 0.001 | |||||||
| Primiparous women | 125 (48.64) | 100 (37.35) | 172 (51.96) | 53 (27.46) | 87 (33.21) | 138 (52.67) | |||||||
| Multiparous women | 132 (51.36) | 167 (62.55) | 159 (48.04) | 140 (72.54) | 175 (66.79) | 124 (47.33) | |||||||
| Age (years) | 28.93 |
29.22 |
–0.726 | 0.468 | 28.95 |
29.30 |
–0.832 | 0.406 | 29.16 |
29.01 |
0.371 | 0.711 | |
| Maternal Height (cm) | 160.69 |
161.56 |
–1.990 | 0.047 | 160.99 |
161.38 |
–0.872 | 0.383 | 161.28 |
160.99 |
0.674 | 0.501 | |
| Gestational week (week) | 39.65 |
39.47 |
1.884 | 0.060 | 39.60 |
39.49 |
1.158 | 0.247 | 39.58 |
39.53 |
0.577 | 0.564 | |
| Pre-pregnancy weight (kg) | 55.65 |
55.42 |
0.351 | 0.726 | 55.49 |
55.61 |
–0.177 | 0.859 | 55.39 |
55.66 |
–0.413 | 0.680 | |
| Weight at delivery (kg) | 67.35 |
66.72 |
0.823 | 0.411 | 67.24 |
66.67 |
0.718 | 0.473 | 66.60 |
67.46 |
–1.129 | 0.259 | |
| Premature rupture of membranes | 0.257 | 0.612 | 1.935 | 0.164 | 5.893 | 0.015 | |||||||
| No | 203 (78.99) | 206 (77.15) | 252 (76.13) | 157 (81.35) | 216 (82.44) | 193 (73.66) | |||||||
| Yes | 54 (21.01) | 61 (22.85) | 79 (23.87) | 36 (15.63) | 46 (17.56) | 69 (26.34) | |||||||
| Epidural anesthesia | 0.349 | 0.555 | 3.539 | 0.060 | 1.103 | 0.294 | |||||||
| No | 231 (89.88) | 244 (91.39) | 294 (88.82) | 181 (93.78) | 241 (91.98) | 234 (89.31) | |||||||
| Yes | 26 (10.12) | 23 (8.61) | 37 (11.17) | 12 (6.21) | 21 (8.01) | 28 (10.69) | |||||||
| Duration of the first stage of labor (min) | 300.00 (189.00, 460.00) | 280.00 (180.00, 428.00) | 31,990.500 | 0.181 | 320.00 (202.50, 487.50) | 240.00 (178.75, 390.00) | 25,875.500 | 290.00 (190.00, 426.00) | 300.00 (180.00, 463.75) | 33,450.000 | 0.615 | ||
| Duration of the second stage of labor (min) | 29.00 (17.00, 56.00) | 22.00 (13.00, 41.00) | 28,998.000 | 0.002 | 32.00 (18.00, 59.00) | 19.00 (11.00, 30.00) | 21,053.000 | 20.00 (12.00, 37.00) | 32.50 (19.00, 59.00) | 24,088.000 | |||
| Duration of the third stage of labor (min) | 6.00 (5.00, 9.00) | 6.00 (5.00, 8.00) | 30,497.500 | 0.026 | 6.00 (5.00, 9.00) | 6.00 (5.00, 8.00) | 29,801.000 | 0.196 | 6.00 (5.00, 8.00) | 6.00 (5.00, 9.00) | 29,712.500 | 0.009 | |
| Immediate blood loss (mL) | 150.00 (118.75, 220.00) | 150.00 (110.00, 200.00) | 31,463.000 | 0.100 | 150.00 (110.00, 210.00) | 150.00 (113.75, 210.00) | 31,373.000 | 0.733 | 150.00 (100.00, 200.00) | 150.00 (120.00, 220.00) | 30,336.500 | 0.027 | |
| Total blood loss within 2 hours postpartum (mL) | 230.00 (180.00, 295.00) | 220.00 (180.00, 280.00) | 31,276.500 | 0.080 | 220.00 (180.00, 280.50) | 220.00 (180.00, 280.00) | 31,554.000 | 0.817 | 220.00 (170.00, 280.00) | 230.00 (180.00, 300.00) | 30,107.500 | 0.019 | |
| Placental weight (g) | 645.49 |
633.75 |
1.342 | 0.180 | 640.79 |
637.30 |
0.385 | 0.701 | 635.73 |
643.28 |
–0.862 | 0.389 | |
| Neonatal sex | 1.950 | 0.163 | 0.042 | 0.838 | 1.718 | 0.190 | |||||||
| male | 136 (52.92) | 125 (46.82) | 166 (50.15) | 95 (49.22) | 123 (46.95) | 138 (52.67) | |||||||
| female | 121 (47.80) | 142 (53.18) | 165 (49.84) | 98 (50.78) | 139 (53.05) | 124 (47.33) | |||||||
| Neonatal weight (g) | 3229.83 |
3185.15 |
1.498 | 0.135 | 3217.65 |
3188.91 |
0.928 | 0.354 | 3203.49 |
3210.64 |
–0.239 | 0.811 | |
| Neonatal length (cm) | 50.17 |
49.90 |
2.071 | 0.039 | 50.06 |
49.99 |
0.540 | 0.590 | 49.98 |
50.08 |
–0.694 | 0.488 | |
| Neonatal head circumference (cm) | 33.96 |
33.85 |
1.225 | 0.221 | 33.92 |
33.89 |
0.280 | 0.779 | 33.86 |
33.94 |
–0.932 | 0.352 | |
Data are presented as n (%), mean
Compared with BE
Compared with LAC
A variance inflation factor (VIF) value
| Dependent variable | Independent variable | Tolerance | VIF |
| pH | Parity | 0.602 | 1.660 |
| Height | 0.968 | 1.033 | |
| Duration of the second stage of labor | 0.611 | 1.636 | |
| Duration of the third stage of labor | 0.991 | 1.009 | |
| Neonatal length | 0.948 | 1.055 | |
| BE | Parity | 0.615 | 1.625 |
| Duration of the first stage of labor | 0.826 | 1.211 | |
| Duration of the second stage of labor | 0.573 | 1.745 | |
| LAC | Parity | 0.611 | 1.637 |
| Premature rupture of membranes | 0.981 | 1.020 | |
| Duration of the second stage of labor | 0.611 | 1.636 | |
| Duration of the third stage of labor | 0.980 | 1.020 | |
| Immediate blood loss | 0.196 | 5.113 | |
| Total blood loss within 2 hours postpartum | 0.196 | 5.110 |
VIF, variance inflation factor.
The linear regression model identified factors influencing UABG parameters
(Table 3). For pH, the regression model explained 7.0% of the variance (adjusted
R2 = 0.061, F = 7.815, p
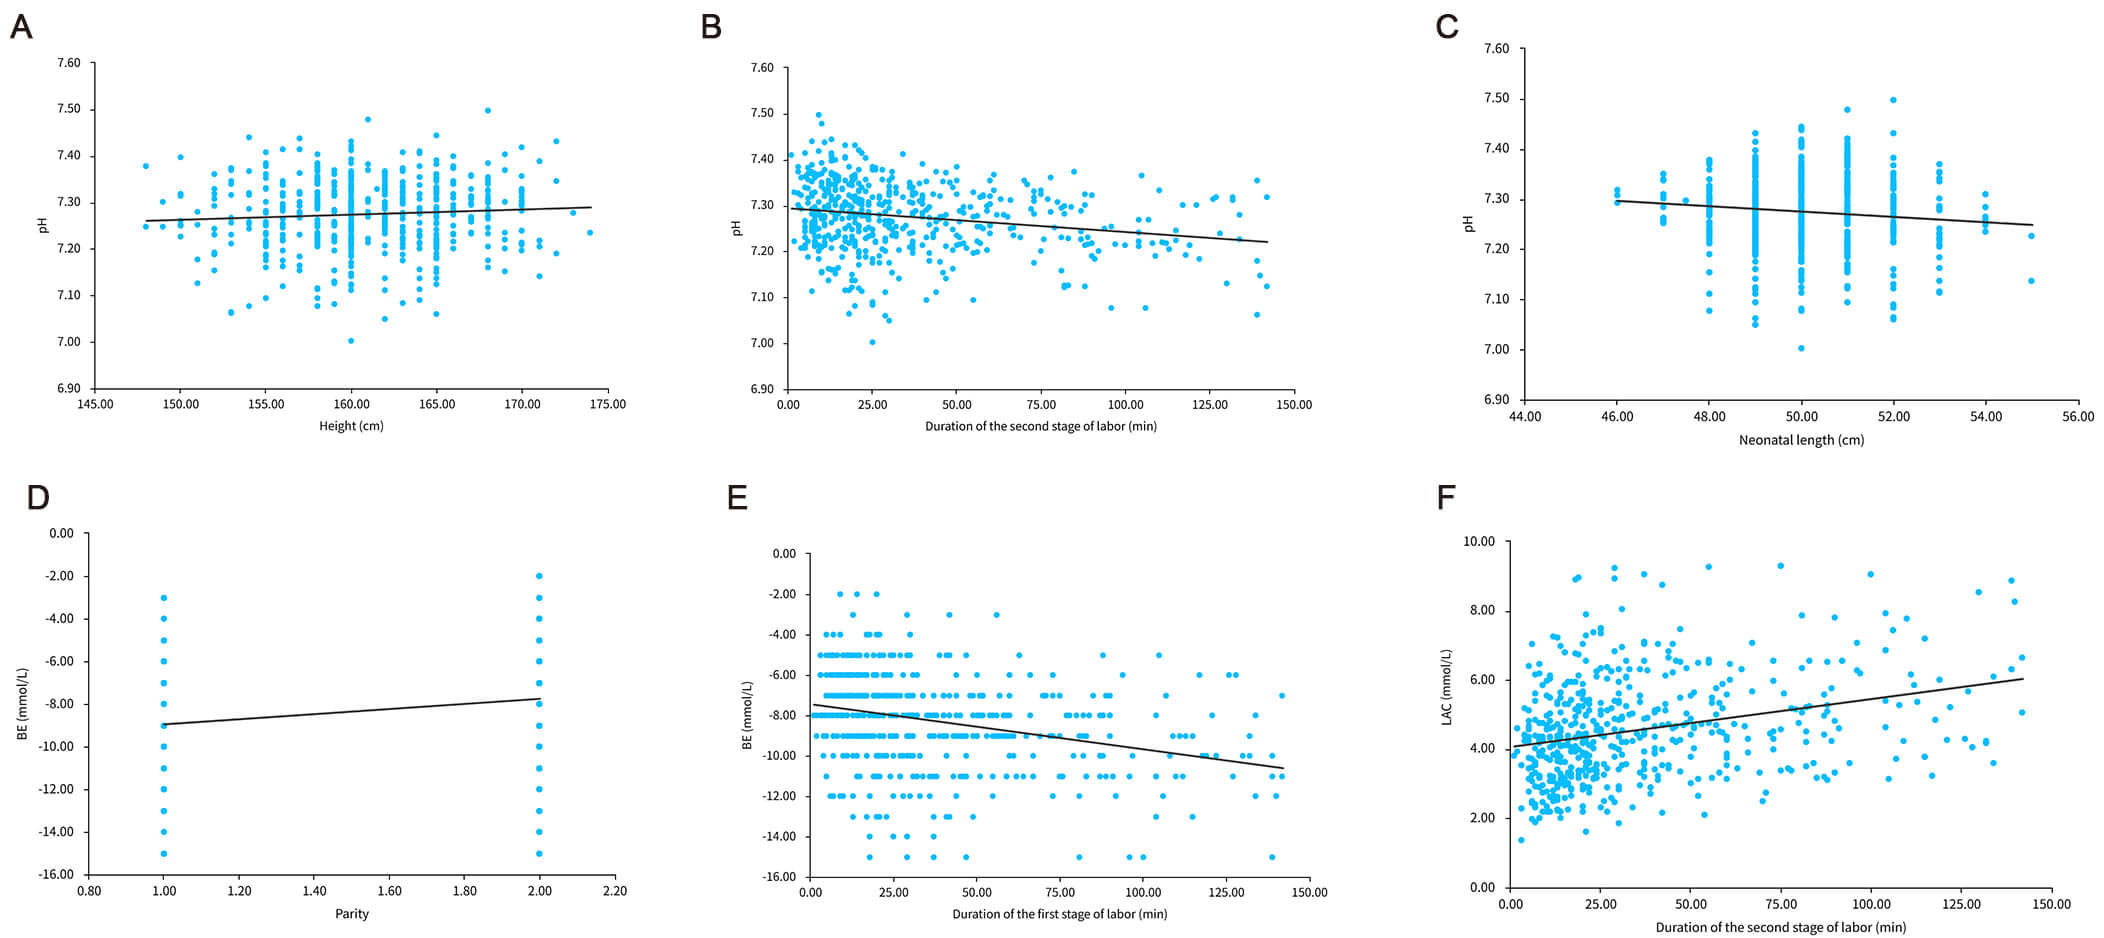 Fig. 2.
Linear regression plot for pH, BE, and LAC. (A) Scatter plot of
pH and maternal height and the linear regression formula for the scatter plot
data is: pH = 6.958 + 0.002
| Dependent variable | Independent variable | 95% CI | p | Regression model | ||||
| R2 | Adjusted R2 | F | p | |||||
| pH | 0.070 | 0.061 | 7.815 | |||||
| Parity | 0.011 | –0.006 |
0.202 | |||||
| Height | 0.002 | 0.000 |
0.016 | |||||
| Duration of the second stage of labor | –0.001 | –0.001 |
0.001 | |||||
| Duration of the third stage of labor | –0.012 | –0.003 |
0.643 | |||||
| Neonatal length | –0.037 | –0.011 |
0.005 | |||||
| BE | 0.102 | 0.096 | 19.594 | |||||
| Parity | 0.500 | 0.012 |
0.045 | |||||
| Duration of the first stage of labor | 0.000 | –0.001 |
0.558 | |||||
| Duration of the second stage of labor | –0.017 | –0.025 |
||||||
| LAC | 0.076 | 0.067 | 8.501 | |||||
| Parity | –0.080 | –0.187 |
0.143 | |||||
| Premature rupture of membranes | 0.094 | –0.007 |
0.070 | |||||
| Duration of the second stage of labor | 0.003 | 0.001 |
0.003 | |||||
| Duration of the third stage of labor | 0.013 | –0.001 |
0.061 | |||||
| Immediate blood loss | 0.001 | 0.000 |
0.060 | |||||
CI, confidence interval.
Robust regression analysis (M-estimation method) was conducted with parity,
duration of the first stage of labor, and duration of the second stage of labor
as independent variables, and BE as the dependent variable. Results indicated
that parity significantly positively influenced BE (
| Dependent variable | Independent variable | 95% CI | p | Robust Regression | ||||
| R2 | Adjusted R2 | F | p | |||||
| BE | 0.100 | 0.095 | 19.319 | |||||
| Parity | 0.572 | 0.111 |
0.015 | |||||
| Duration of the first stage of labor | 0.000 | –0.001 |
0.711 | |||||
| Duration of the second stage of labor | –0.017 | –0.024 |
||||||
| LAC | 0.099 | 0.090 | 11.328 | |||||
| Parity | –0.222 | –0.533 |
0.161 | |||||
| Premature rupture of membranes | 0.216 | –0.078 |
0.149 | |||||
| Duration of the second stage of labor | 0.011 | 0.006 |
||||||
| Duration of the third stage of labor | 0.025 | –0.017 |
0.241 | |||||
| Immediate blood loss | 0.001 | –0.000 |
0.151 | |||||
Robust regression analysis (M-estimation method) was conducted using parity,
premature rupture of membranes, duration of second stage of labor, duration of
third stage of labor, and immediate blood loss as independent variables, with LAC
as the dependent variable. Results indicated that only the duration of the second
stage of labor was significantly positively correlated with LAC (
Significant differences were observed in pH, BE and LAC between primiparous and
multiparous women (p
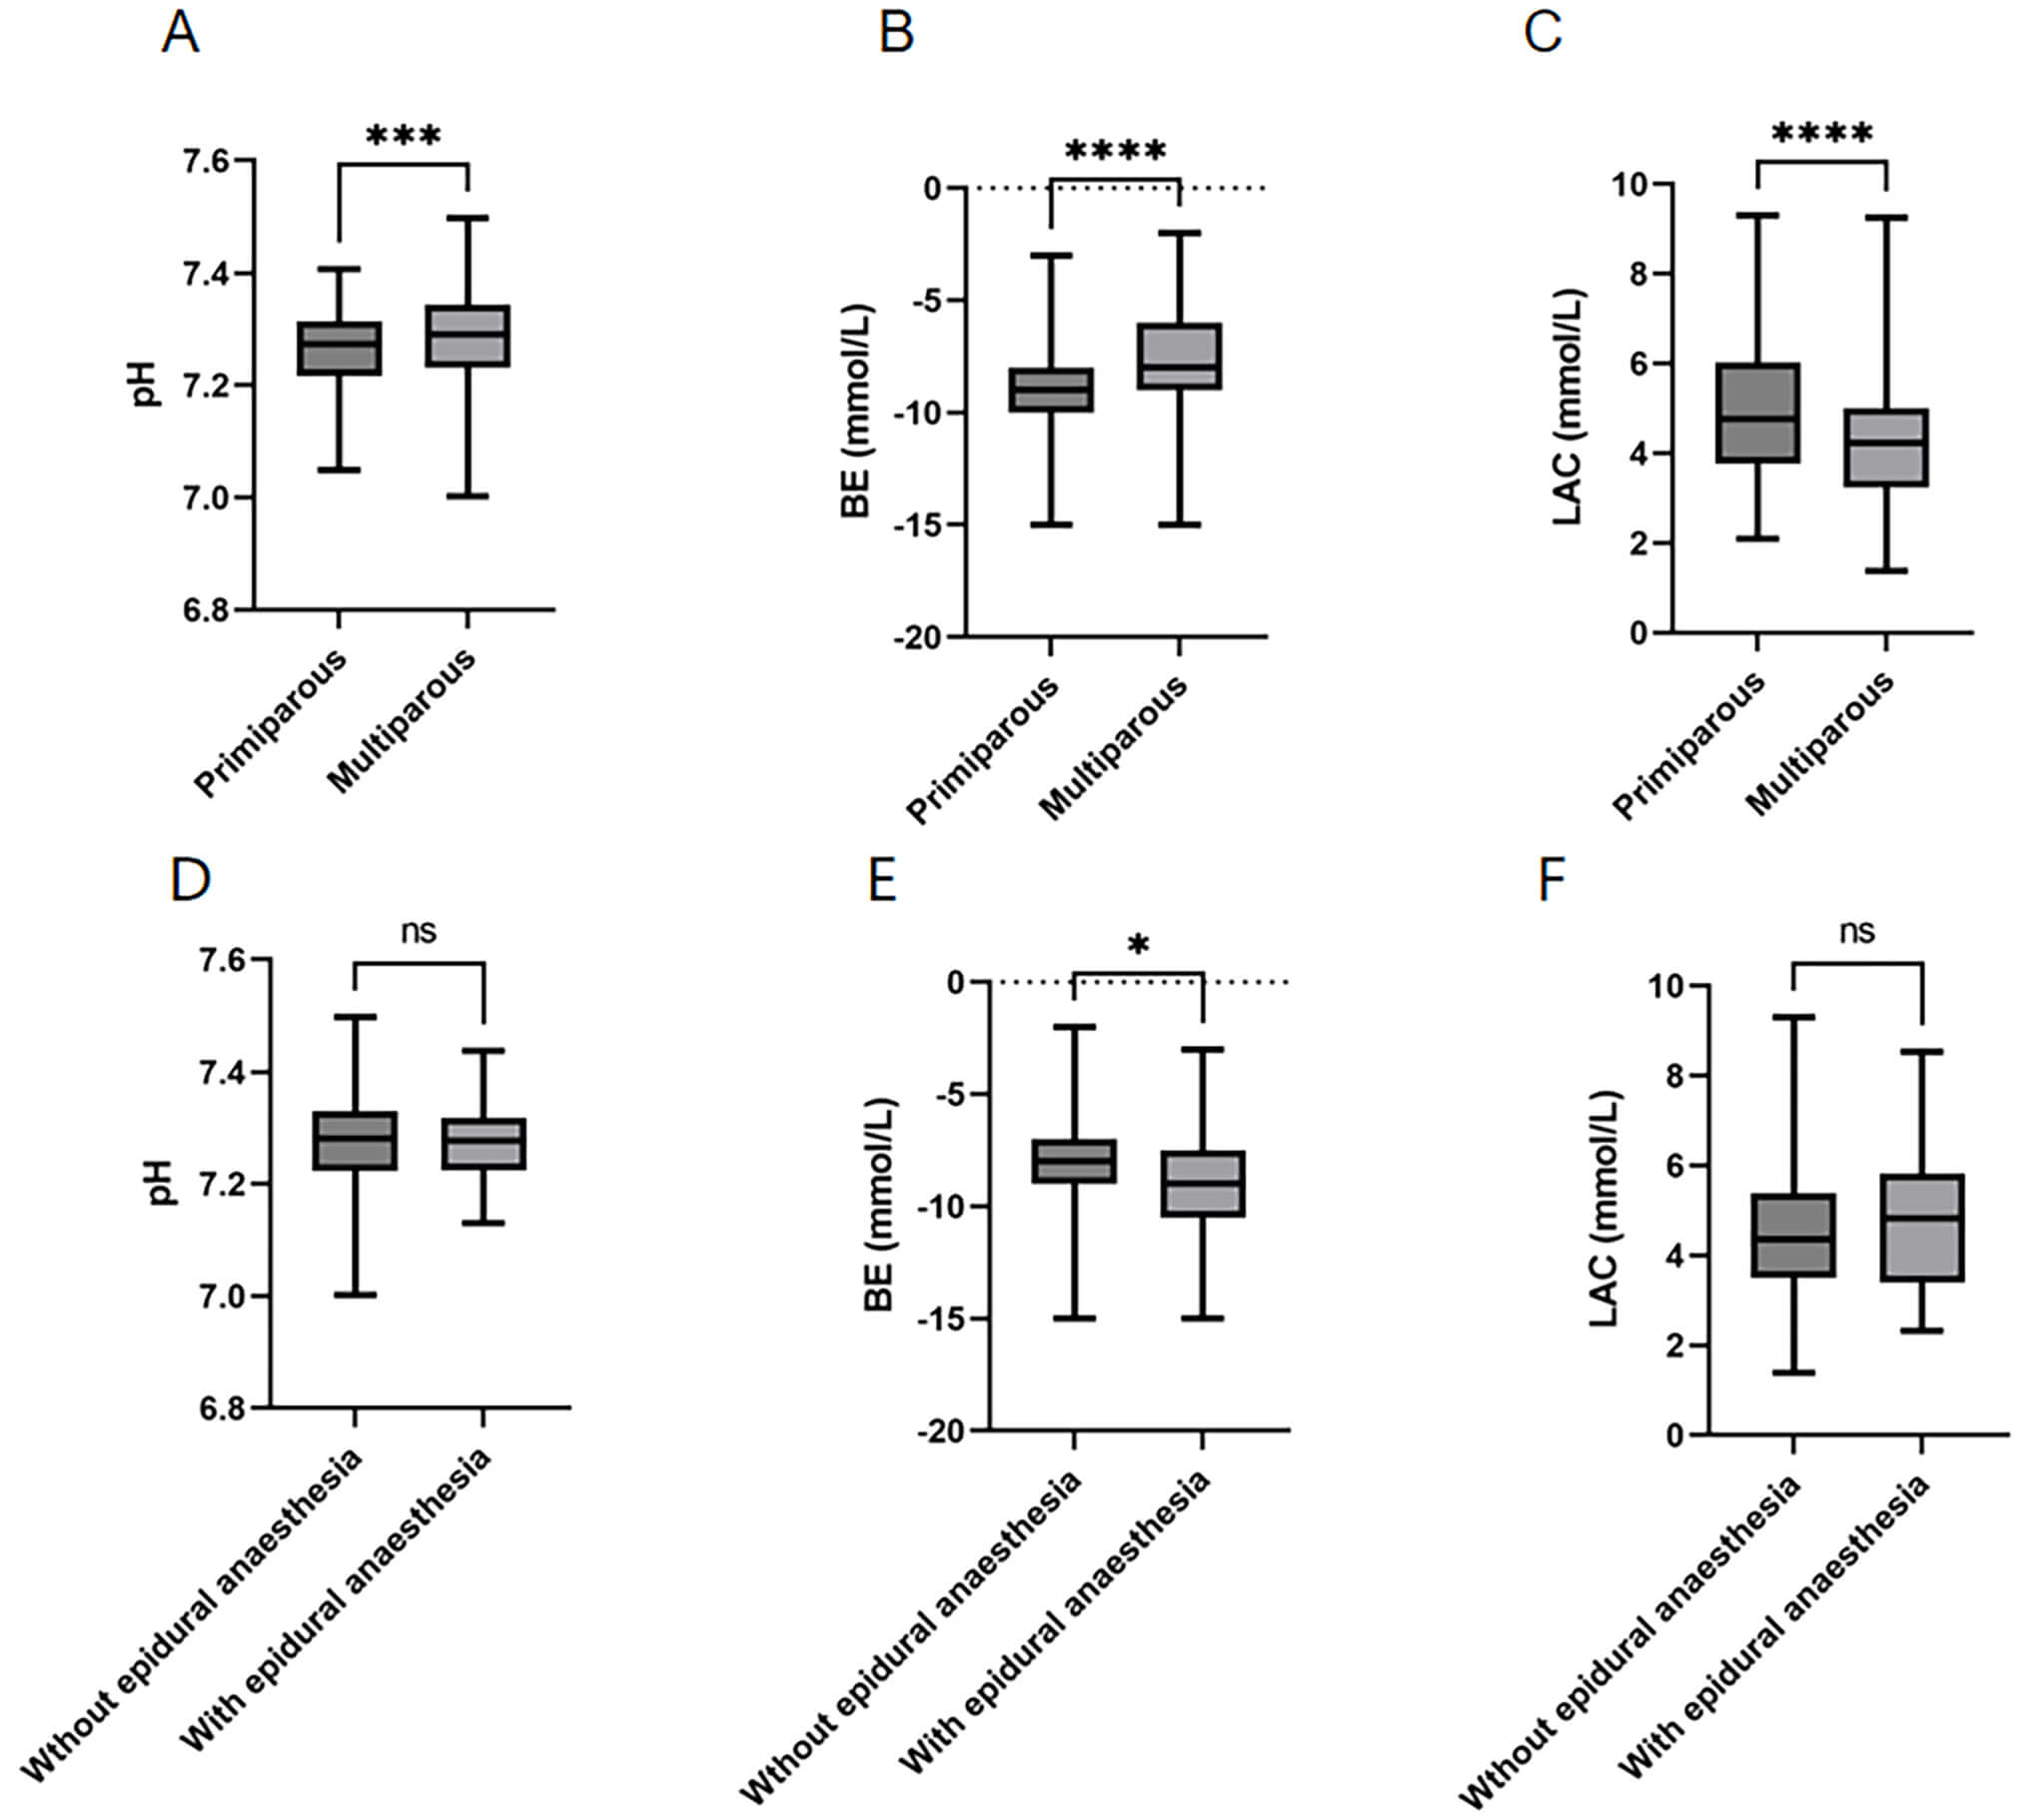 Fig. 3.
Comparison of pH, BE, and LAC between primiparas and multiparas,
and between anesthesia and no anesthesia. (A) Comparison of pH between
primiparas and multiparas. (B) Comparison of BE between primiparas and
multiparas. (C) Comparison of LAC between primiparas and multiparas. (D)
Comparison of pH with and without anesthesia. (E) Comparison of BE with and
without anesthesia. (F) Comparison of LAC with and without anesthesia. **** p
This study identified significant associations between labor characteristics and neonatal UABG parameters in low-risk Tibetan populations at high altitude. Our core finding is that the duration of the second stage of labor serves as a key modifiable factor, with prolonged duration independently predicting lower BE and higher LAC levels. Additionally, primiparity emerged as a major factor influencing umbilical cord blood gas values. Maternal height also showed a positive correlation with neonatal pH levels, although its predictive capability remains limited.
In this study, the median pH value of 7.28 (IQR: 7.22, 7.33) aligns closely with
previous studies. For instance, it is comparable to the pH value of 7.25
Linear regression analysis indicates that the duration of the second stage of labor is an independent determinant of neonatal UABG parameters. Specifically, prolonged second stage of labor was significantly associated with lower BE and higher LAC levels, while exhibiting a negative correlation with pH. To assess the robustness of these associations, we further conducted robust regression analysis using the M-estimation method. The results confirmed that the duration of the second stage of labor remained significantly associated with BE and LAC, supporting the primary findings of the linear regression. At elevations above 2500 meters, the partial pressure of atmospheric oxygen decreases significantly, which affects umbilical artery blood gas levels [19]. Although the Tibetan population has developed adaptive features such as enhanced erythropoiesis and placental vascular remodeling, their fetuses remain in a state of relative hypoxia compared with those at sea level [20]. This hypoxic stress is exacerbated by the prolonged second stage of labor [21]. The increased frequency and intensity of uterine contractions reduce placental blood flow and thereby decrease oxygen delivery to the fetus. In order to sustain energy metabolism, fetal tissues shift towards anaerobic glycolysis, resulting in increased LAC production (manifested as an elevated LAC levels) and subsequent metabolic acidosis, reflected by more negative BE values [22]. Previous studies have found that healthy term newborns born at high altitude, up to 3600 meters above sea level, often exhibit pH and LAC levels in the UABGA that fall within the high-risk critical range [23, 24]. This phenomenon may relate to the hypoxic intrauterine environment (oxygen partial pressure of 16–27 mmHg). Under these conditions, the fetus relies mainly on glucose oxidation to maintain physiological functions [25]. In addition, most of the LAC in fetal UABGA is produced during the second stage of labor [26]. Meanwhile, mothers undergo a series of compensatory physiological adaptations to the chronic low-pressure hypoxic environment of high-altitude region. These changes may lead to an increase in placental blood flow [27], thus partially mitigating the effects of chronic hypoxia. Therefore, closer labor monitoring and neonatal assessment are needed for primiparous women in highland areas to identify and manage potential hypoxic and metabolic complications promptly, even during a physiologically normal labor period.
Additionally, this study found a weak positive association between maternal
height and umbilical artery pH (
Primiparity and premature rupture of membranes are additional factors associated
with UABG parameters. Primiparous women were more likely to exhibit decreased BE
values (172/331 cases in the low BE group, vs. 53/193 in the high BE group,
p = 0.001) and elevated LAC values (87/262 primiparas in the low LAC
group vs. 138/262 in the high LAC group, p = 0.001). In both linear and
robust regression analyses, parity showed a significant association with BE
levels. Linear regression revealed parity as a positive predictor. Primiparas
exhibit poorer uterine contraction coordination and slower cervical dilation
[29], leading to prolonged first and second stages of labor. The median duration
of the first stage was 320.00 minutes in the low BE group, significantly longer
than 240.00 minutes in the high BE group (p
This study identified significant differences in umbilical artery blood pH, BE, and LAC levels between newborns of primiparous and multiparous mothers in high-altitude regions. These findings are consistent with multiple studies conducted in lowland areas, indicating that parity is an important determinant of UABG parameters. A large-scale, multicenter study conducted across six Chinese hospitals, comprising 20,191 newborns, demonstrated that parity significantly impacts UABG values [15]. Notably, in this study, epidural anesthesia affected only BE values, without significantly altering pH or LAC levels. This suggests that the acid-base balance changes induced by epidural anesthesia are primarily metabolic in nature and relatively mild, not reaching the threshold required to cause significant alterations in pH and LAC levels. This study exhibits both similarities and differences compared with the Tehran, Iran study regarding the effects of epidural anesthesia on neonatal acid-base balance [32]. Both studies observed a shift toward more negative BE values in the epidural group. However, a key discrepancy lies in the impact on pH: the Iranian study reported a significant pH decrease in the epidural group, whereas no such change was observed in the high-altitude setting of the present study. This discrepancy may result from variations in anesthetic management strategies between locations (e.g., blood pressure maintenance, oxygen therapy application). Additionally, differences in study population characteristics or statistical power may also be contributing factors. Overall, these findings suggest that although epidural anesthesia exerts a relatively consistent effect on fetal metabolic status, its impact on overall acid-base balance may be modulated by regional environmental factors, clinical practices, and population characteristics.
This study presents some limitations. Our findings are based on a rigorously selected, low-risk, physiologically normal Tibetan population. We intentionally excluded pregnant women with comorbidities or complications, resulting in a highly homogeneous sample with limited variability in key blood gas parameters (pH, BE, and LAC). Therefore, while this study design facilitates the identification of relevant factors within normal physiological ranges, it inherently limits the generalizability of our findings to broader, more heterogeneous obstetric populations encompassing high-risk pregnancies. Future studies incorporating a wider spectrum of risk profiles are needed to validate and extend these findings. The present study employed a single-center, retrospective design may, which may have introduced selection bias and did not include stratified analyses based on altitudes (e.g., above 250 m vs. 4000 m) or pre-pregnancy comorbidities (e.g., gestational hypertension). Future studies could adopt a prospective cohort design to expand the sample size and further validate these findings. In addition, future studies could explore how varying altitudes in highland regions affect labor, delivery, and neonatal outcomes.
In conclusion, the present study revealed the relationship between labor and delivery characteristics and neonatal UABGs in secular Tibetan mothers living in the plateau region. In this low-risk population, factors influencing pH include maternal height, the duration of the second stage of labor, and neonatal length. Factors influencing BE include parity and the duration of the second stage of labor. The duration of the second stage of labor is a factor influencing LAC.
All data reported in this paper will be shared by the corresponding author upon request.
ZDo: conceptualization, investigation, formal analysis, data curation, writing—original draft preparation. BC: conceptualization, methodology, investigation, writing—original draft preparation. QG: investigation, data curation, writing—review and editing. LY, ZDa, LC, and ZC: investigation, writing—review and editing. PZ: formal analysis, writing—review and editing. ZY: data curation, writing—review and editing. JF: conceptualization, methodology, investigation, supervision, writing—original draft preparation, writing—review and editing. All authors contributed to editorial changes in the manuscript. All authors read and approved the final manuscript. All authors have participated sufficiently in the work and agreed to be accountable for all aspects of the work.
The research adheres to the Declaration of Helsinki. Ethical approval was obtained from the medical ethics committee of Lhasa People’s Hospital (No. SYLL22250108). This is a retrospective study utilising anonymised routine clinical data; no interventions were performed on patients, nor was there any contact with individual patients. Given the retrospective design of this study and the analysis of anonymised data, the Ethics Committee has waived the requirement for informed consent.
Thanks to all the peer reviewers for their opinions and suggestions.
This research received no external funding.
The authors declare no conflict of interest.
References
Publisher’s Note: IMR Press stays neutral with regard to jurisdictional claims in published maps and institutional affiliations.