


 , Biche Osong 2,†, Haejun Lee 3, Kwang Beom Lee 4, Young Saing Kim 5
1 Department of Radiation Oncology, Gil Medical Center, Gachon University College of Medicine, 21565 Incheon, Republic of Korea
2 Center for Pediatric Trauma Research and Center for Injury Research and Policy, The Abigail Wexner Research Institute at Nationwide Children’s Hospital, Columbus, OH 43205, USA
3 Department of Nuclear Medicine, Gil Medical Center, Gachon University College of Medicine, 21565 Incheon, Republic of Korea
4 Department of Obstetrics and Gynecology, Gil Medical Center, Gachon University College of Medicine, 21565 Incheon, Republic of Korea
5 Division of Medical Oncology, Gil Medical Center, Gachon University College of Medicine, 21565 Incheon, Republic of Korea
†These authors contributed equally.
Abstract
Despite many reported pretreatment prognostic factors in cervical cancer patients, no integrated model has been established. This study aimed to evaluate the prognostic significance of established pretreatment factors in cervical cancer patients undergoing concurrent chemoradiotherapy (CCRT) and to develop a simple and practical model for pretreatment risk stratification.
Fifty-one patients with cervical cancer treated with CCRT between September 2009 and July 2022 were retrospectively analyzed. The median follow-up period was 74.6 months, and the median patient age was 58 years. Clinicopathological and hematological factors, including age, body mass index (BMI), pathology, hemoglobin (Hgb), neutrophil-to-lymphocyte ratio (NLR), platelet-to-lymphocyte ratio (PLR), squamous cell carcinoma antigen (SCC-Ag), and International Federation of Gynecology and Obstetrics (FIGO) stage, were collected. Radiological and metabolic factors were assessed using magnetic resonance imaging (MRI), computed tomography (CT), and fluorine-18-fluorodeoxyglucose positron emission tomography/computed tomography (F-18 FDG PET/CT), from which the primary tumor volume (pTV) and the maximum standardized uptake value (SUVmax) were measured. The prognostic significance of factors for progression-free survival (PFS) and overall survival (OS) was evaluated using the Cox proportional hazards models.
The 5-year OS and PFS rates were 75.5% and 72.6%, respectively. In univariate analyses, BMI (p = 0.020) and FIGO stage (p < 0.001) were associated with PFS, while age, pathology, Hgb, NLR, PLR, SCC-Ag, pTV, and SUVmax were not. Multivariate analysis identified FIGO stage as the only independent prognostic factor for PFS (hazard ratio [HR]: 4.385; 95% CI: 1.865–10.310; p < 0.001). For OS, Hgb (p = 0.044), BMI (p = 0.024, and FIGO stage (p < 0.001) were significant in univariate analyses, whereas BMI (HR: 3.207; 95% CI: 1.157–8.893; p = 0.025), and FIGO stage (HR: 3.604; 95% CI: 1.559–8.334; p = 0.003) remained significant in the multivariate analysis. The optimal BMI cut-off, determined by the receiver operating characteristic (ROC) analysis, was 21.2 kg/m2.
FIGO stage and BMI were the most influential pretreatment factors associated with survival in cervical cancer patients undergoing CCRT. These findings support a straightforward pretreatment risk-stratification approach based on readily obtainable information, intended to assist baseline risk communication rather than guide treatment decisions. External validation in larger, multicenter cohorts is needed to confirm its clinical reliability, but these findings suggest a practical approach to identifying patients with distinct prognostic risks before treatment.
Keywords
- cervical cancer
- chemoradiotherapy
- prognostic factor
Cervical cancer remains one of the most common malignancies in the world and is still associated with a high risk of death. According to data from the International Cancer Research Institute and the World Health Organization, 604,000 new cervical cancer cases were diagnosed in 2020, resulting in 342,000 deaths [1, 2]. The cause of cervical cancer is strongly related to persistent human papillomavirus (HPV) infection, particularly HPV-16 and HPV-18, which together account for the most cases of invasive disease [3]. Early detection of cervical cancer commonly starts with Pap smear screening, followed by biopsy for confirmation and imaging studies for staging [4]. However, despite improvements in screening and HPV vaccination, many patients are still diagnosed at locally advanced stages, indicating that reliable pretreatment markers that can guide clinical decisions are still needed [5] and that cervical cancer remains a major cause of death. When surgery is not an option—often because the disease is too advanced or the patient is not a suitable surgical candidate—the main treatment strategy shifts to concurrent chemoradiotherapy (CCRT). The definitive radiotherapy (RT) approach typically starts with external beam radiation therapy (EBRT) delivered to the pelvis and is then followed by intracavitary brachytherapy (ICR) to boost the dose directly to the tumor while minimizing exposure to the surrounding healthy tissues [6, 7]. When assessing the prognosis of patients with cervical cancer treated with RT, several pretreatment factors are already known to be important. These can be grouped into a few broad categories that clinicians commonly evaluate before starting treatment. The clinicopathological factors included age, body mass index (BMI), clinical stage, and pathology. The hematological and radiological factors, including hemoglobin (Hgb), hematocrit (Hct), neutrophil-to-lymphocyte ratio (NLR), platelet-to-lymphocyte ratio (PLR), squamous cell carcinoma antigen (SCC-Ag), primary tumor volume (pTV) or size, are also routinely evaluated. In addition, metabolic factors, including the maximum standardized uptake value (SUVmax) in fluorine-18-fluorodeoxyglucose positron emission tomography/computed tomography (F-18 FDG PET/CT) and, when available, metabolic tumor volume (MTV) and total lesion glycolysis (TLG), provide further insight into the overall disease burden [8, 9, 10, 11, 12, 13, 14, 15, 16, 17, 18, 19]. Despite such well-known pretreatment clinicopathological, hematological, radiological, and metabolic factors, their relative prognostic value has not been systematically compared, and no simple model integrating these factors has been established. Therefore, this study aimed to evaluate the prognostic significance of major and readily obtainable pretreatment factors and to develop a practical, clinically applicable risk-prediction score for cervical cancer patients undergoing CCRT.
A total of 51 patients with histologically verified uterine cervical cancer
underwent RT at our institution between September 2009 and July 2022. The
patients in this study were staged according to the 2018 International Federation
of Gynecology and Obstetrics (FIGO) staging system [20]. The study inclusion
criteria were: (a) age
Clinical factors collected included BMI, pathology, Hgb, NLR, PLR, SCC-Ag, and FIGO stage. Radiological and metabolic factors were evaluated using magnetic resonance imaging (MRI), CT, and PET/CT. The pTV was recorded as the radiological factor, and the SUVmax of the primary lesion was used as the metabolic factor.
The BMI and pTV were calculated using the following formulas:
where L, W, and H represent the maximal tumor length, width, and height, respectively.
All patients first underwent pelvic EBRT delivered with 10- or 15-megavoltage (MV) photon beams using a four-field box technique. Total EBRT doses ranged from 50.4 to 84.9 Gy (median, 59.4 Gy), administered in daily fractions of 1.8–2 Gy, five days per week. Concurrent chemotherapy was given during EBRT for all patients; one patient received weekly carboplatin (290 mg/m2), whereas the remaining 50 patients received weekly cisplatin (40–60 mg/m2). In accordance with international guidelines [21, 22], cisplatin-based CCRT was used as the standard definitive treatment for all patients with FIGO stages IB2–IVA. Since no patient underwent primary surgery, stage-based variations in surgical management did not apply to this cohort.
After completing a median EBRT dose of 45 Gy, high-dose-rate (HDR) ICR was initiated using a Microselectron HDR system (Ir-192 source; Nucletron, Veenendaal, The Netherlands). Before each ICR session, an MRI or CT was performed to evaluate the most recent tumor response. If marked tumor reduction was observed or if the cumulative EBRT dose indicated that organ at risk (OAR) limits for the rectum, bladder, or bowel could be reached, the ICR fraction dose was adjusted accordingly to remain within safe tolerance levels. These dose modifications were made on an individual basis as part of routine clinical practice. A total HDR-ICR dose of 20–32 Gy (median, 24 Gy) was delivered twice weekly in fractions of 3–5 Gy. No patient received consolidation chemotherapy after completion of CCRT. The primary endpoint included both treatment response and treatment failure, which were assessed by gynecological examination, Pap smear test, cross-sectional imaging (CT or MRI from chest to pelvis), and PET/CT when available.
All statistical analyses were conducted using R software (version 4.2.1; R
Foundation for Statistical Computing, Vienna, Austria). Categorical variables
were reported as counts and percentages. For continuous variables, we checked
normality with the Shapiro-Wilk test and presented them as median and
interquartile range. Progression-free survival (PFS) and overall survival (OS)
were estimated using the Kaplan–Meier method, with group comparisons performed
via the log-rank test. Continuous variables, including BMI, Hgb, NLR, PLR,
SCC-Ag, pTV, and SUVmax, were dichotomized according to optimal cut-off
values identified through receiver operating characteristic (ROC) curve analysis.
The ROC procedure identified thresholds that maximized sensitivity and
specificity, and these cut-off points were subsequently applied for
classification in the survival analyses. For the PFS analysis, disease
recurrence—either locoregional or distant—was defined as the endpoint,
whereas death was considered the endpoint for the OS analysis. In this study,
univariate analyses were performed using the log-rank test. For the multivariate
analysis, prognostic variables were evaluated using Cox proportional hazards
regression. Variables with p
The baseline characteristics of the 51 patients are presented in Table 1. The Shapiro–Wilk test results for all continuous variables are provided in Supplementary Table 1. The median age was 58 years (range, 37–81 years), and 84.3% of patients were younger than 75 years. Most patients (72.5%) had FIGO stage III or IV disease, and all underwent CCRT.
| Characteristics | Number (%) | |
| Pathology | ||
| SCC | 48 (94.1) | |
| ADC | 3 (5.9) | |
| FIGO stage | ||
| I | 3 (5.9) | |
| II | 11 (21.6) | |
| III | 31 (60.8) | |
| IV | 6 (11.7) | |
| Age (years)* median [IQR] | 58.0 [51.2–69.5] | |
| 43 (84.3) | ||
| 8 (15.7) | ||
| BMI (kg/m2)* median [IQR] | 22.8 [20.9–25.0] | |
| 17 (33.3) | ||
| 34 (66.7) | ||
| Hb (g/dL)* median [IQR] | 11.7 [9.7–12.8] | |
| 17 (33.3) | ||
| 34 (66.7) | ||
| NLR* median [IQR] | 2.6 [2.0–3.8] | |
| 33 (64.7) | ||
| 18 (35.3) | ||
| PLR* median [IQR] | 161.3 [111.1–212.8] | |
| 27 (52.9) | ||
| 24 (47.1) | ||
| SCC-Ag* median [IQR] | 9.7 [2.3–34.5] | |
| 34 (66.7) | ||
| 17 (33.3) | ||
| pTV (cm3)* median [IQR] | 74.2 [37.9–121.6] | |
| 10 (19.6) | ||
| 41 (80.4) | ||
| SUVmax* median [IQR] | 10.6 [8.2–14.6] | |
| 23 (45.1) | ||
| 28 (54.9) | ||
IQR, interquartile range; BMI, body mass index; SCC, squamous cell carcinoma; ADC, adenocarcinoma; FIGO, International Federation of Gynecology and Obstetrics; Hgb, hemoglobin; NLR, neutrophil-to-lymphocyte ratio; PLR, platelet-to-lymphocyte ratio; SCC-Ag, squamous cell carcinoma antigen; pTV, primary tumor volume; SUVmax, maximum standardized uptake value; *The optimal cut-off for continuous variables was determined using receiver operating characteristic (ROC) curve analysis.
The median follow-up duration was 74.6 months (range, 9.9–156.4 months). The median age of the cohort was 58 years (range: 37–81 years). The 5-year OS and PFS outcomes were 75.5% and 72.6%, respectively (Fig. 1).
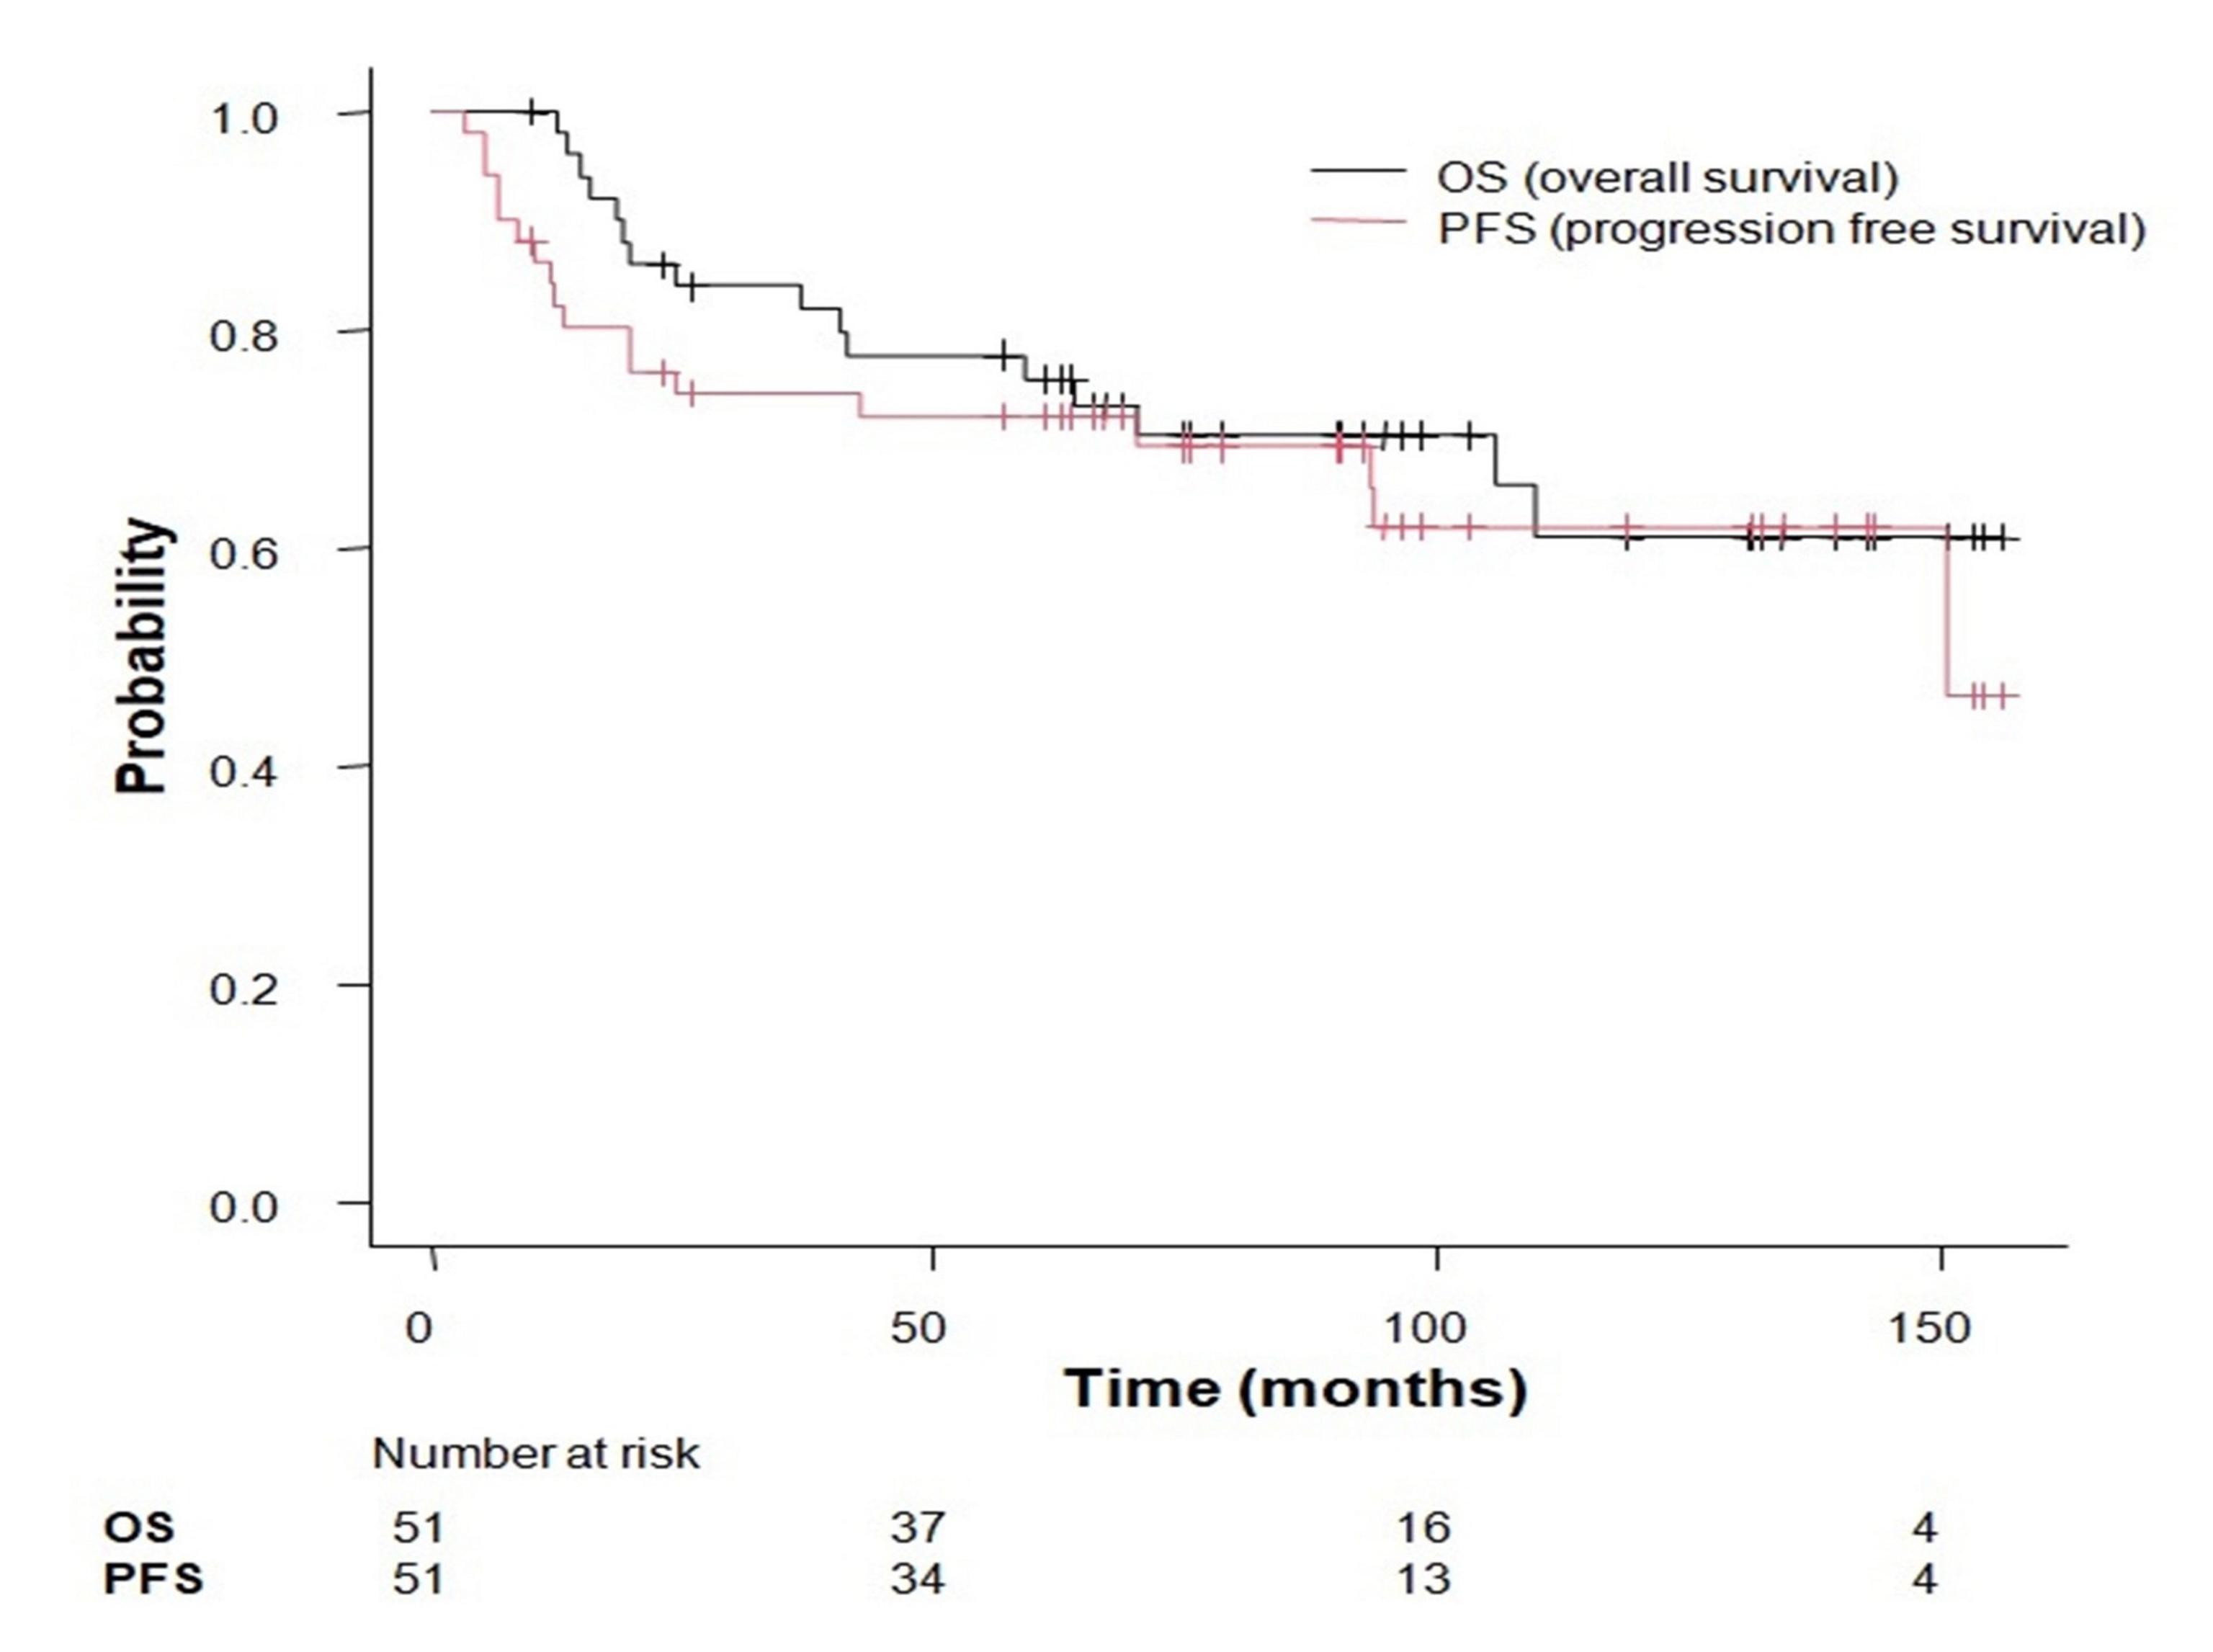 Fig. 1.
Kaplan–Meier plots of progression-free survival (PFS) and overall survival (OS).
In the univariate analysis, age (p = 0.202), pathology (p =
0.843), Hgb (p = 0.166), NLR (p = 0.210), PLR (p =
0.552), SCC-Ag (p = 0.444), pTV (p = 0.435), and SUVmax
(p = 0.342) were not associated with PFS. In contrast, BMI (p =
0.020) and FIGO stage (p
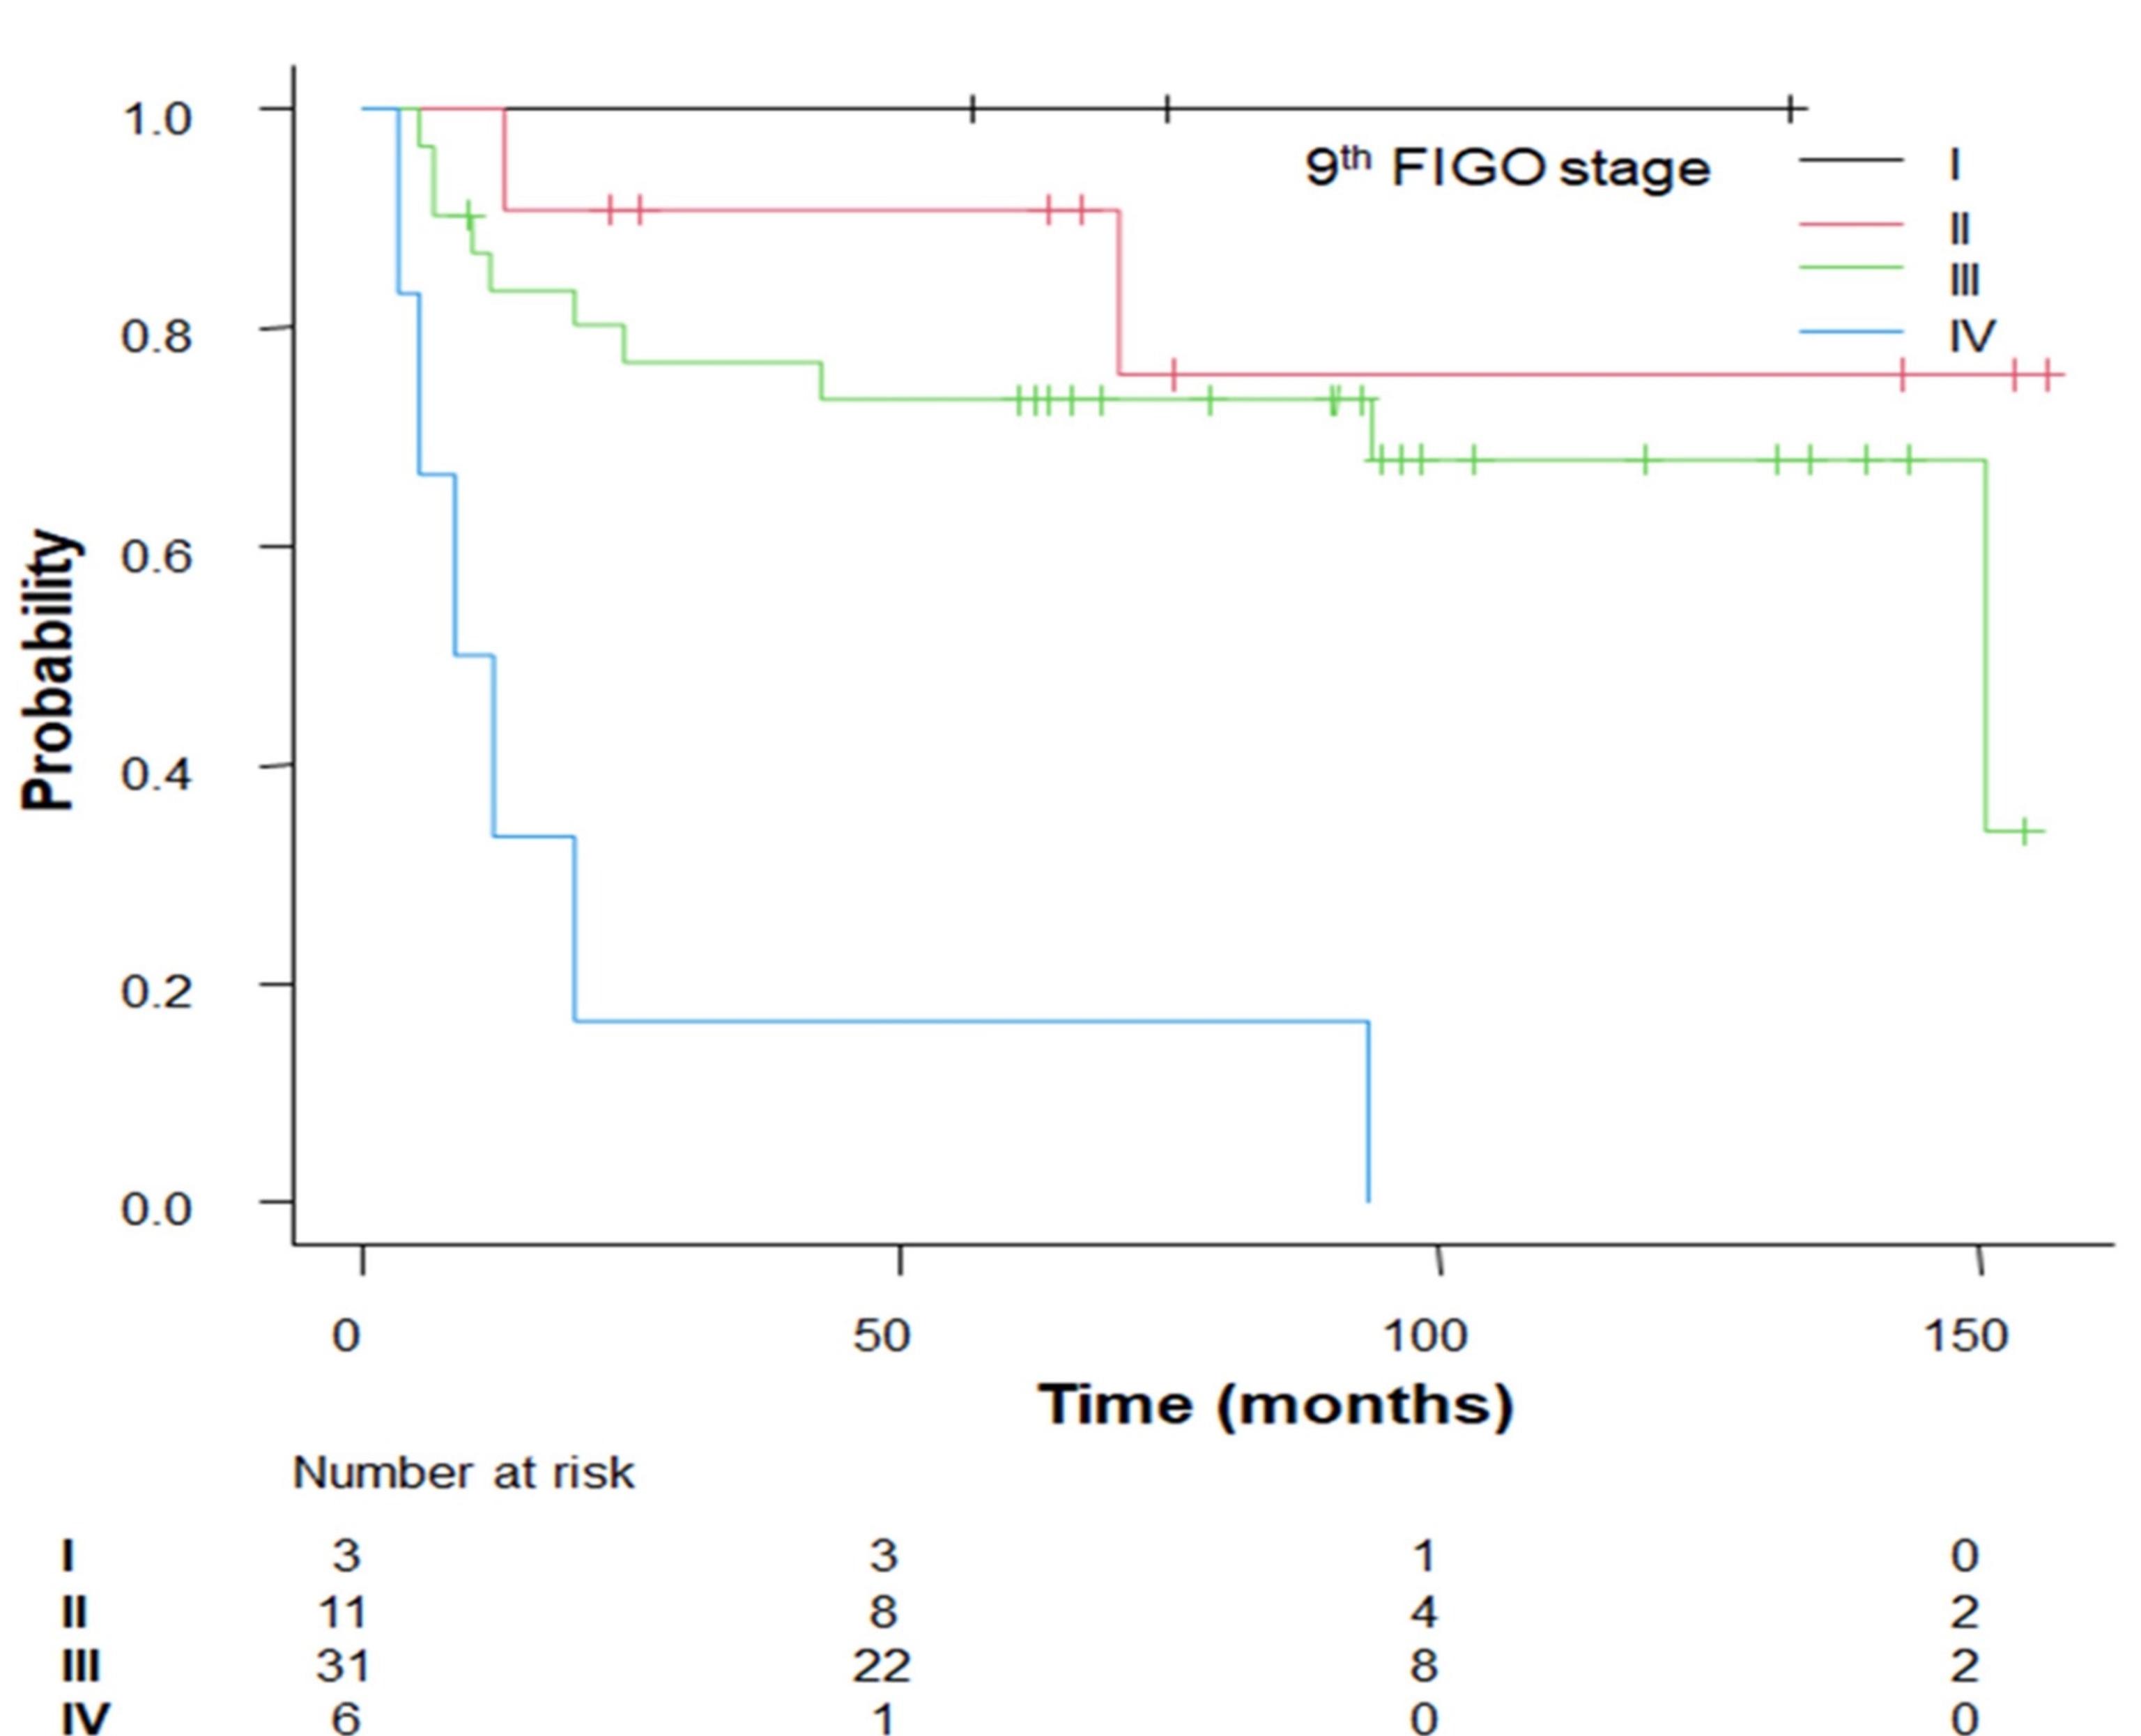 Fig. 2.
Kaplan–Meier survival curves for progression-free survival stratified by factor (FIGO stage), demonstrating statistically significant differences.
| Variable | Univariate analysis | ||||
| PFS | OS | ||||
| 5-year PFS (95% CI) | p-value* | 5-year OS (95% CI) | p-value* | ||
| Age (years) | |||||
| 69.0% (52.6%–80.7%) | 0.202 | 73.2% (56.8%–84.2%) | 0.284 | ||
| 87.5% (38.7%–98.1%) | 87.5% (38.7%–98.1%) | ||||
| Pathology | |||||
| SCC | 72.4% (57.2%–83.0%) | 0.843 | 76.8% (62.0%–86.4%) | 0.689 | |
| ADC | 66.6% (54.1%–94.5%) | 66.7% (54.1%–94.5%) | |||
| FIGO stage | |||||
| I | 100% | 100% | |||
| II | 90.9% (50.8%–98.7%) | 90.9% (53.9%–98.8%) | |||
| III | 73.6% (54.0%–85.8%) | 80.0% (60.8%–90.5%) | |||
| IV | 16.7% (7.7%–51.7%) | 16.7% (7.7%–51.7%) | |||
| BMI (kg/m2) | |||||
| 64.7% (37.7%–82.3%) | 0.020 | 51.3% (25.7%–72.1%) | 0.024 | ||
| 85.0% (67.6%–93.5%) | 87.7% (70.4%–95.2%) | ||||
| NLR | |||||
| 83.0% (55.9%–94.2%) | 0.210 | 83.0% (55.9%–94.2%) | 0.399 | ||
| 66.0% (47.0%–79.5%) | 71.5% (52.3%–84.0%) | ||||
| PLR | |||||
| 73.9% (52.9%–86.6%) | 0.552 | 73.6% (52.4%–86.4%) | 0.470 | ||
| 69.8% (46.9%–84.3%) | 78.0% (55.0%–90.2%) | ||||
| Hgb (g/dL) | |||||
| 58.8% (32.5%–77.8%) | 0.166 | 58.8% (32.5%–77.8%) | 0.044 | ||
| 78.8% (60.6%–89.3%) | 84.5% (66.6%–93.2%) | ||||
| SUVmax | |||||
| 72.8% (49.0%–86.8%) | 0.342 | 76.6% (52.5%–89.5%) | 0.269 | ||
| 71.2% (50.6%–84.5%) | 74.7% (54.1%–87.1%) | ||||
| SCC-Ag | |||||
| 79.2% (61.2%–89.5%) | 0.444 | 81.8% (63.9%–91.4%) | 0.231 | ||
| 57.0% (30.3%–76.8%) | 62.5% (34.9%–81.1%) | ||||
| pTV (cm3) | |||||
| 80.0% (40.9%–94.6%) | 0.435 | 90.0% (47.3%–98.5%) | 0.188 | ||
| 70.1% (53.3%–81.8%) | 72.0% (55.2%–83.4%) | ||||
* Log-rank test.
| Variables | Risk factors | HR (95% CI) | Risk score | p* | |
| PFS | |||||
| FIGO stage | I, II, III vs. IV (ref = I, II, III) | 4.385 (1.865–10.310) | 1.478 | 14 | |
| BMI (kg/m2) | 2.575 (0.9745–6.805) | 0.946 | 0 | 0.056 | |
| OS | |||||
| BMI (kg/m2) | 3.207 (1.157–8.893) | 1.165 | 11 | 0.025 | |
| FIGO stage | I, II, III vs. IV (ref = I, II, III) | 3.604 (1.559–8.334) | 1.282 | 12 | 0.003 |
| Hgb (g/dL) | 2.366 (0.858–6.526) | 0.861 | 0 | 0.096 | |
HR, hazard ratio; *Cox proportional hazards regression.
Age (p = 0.284), pathology (p = 0.689), NLR (p =
0.399), PLR (p = 0.470), SCC-Ag (p = 0.231), pTV (p =
0.188), and SUVmax (p = 0.269) were not correlated, while Hgb
(p = 0.044), BMI (p = 0.024), and FIGO stage (p
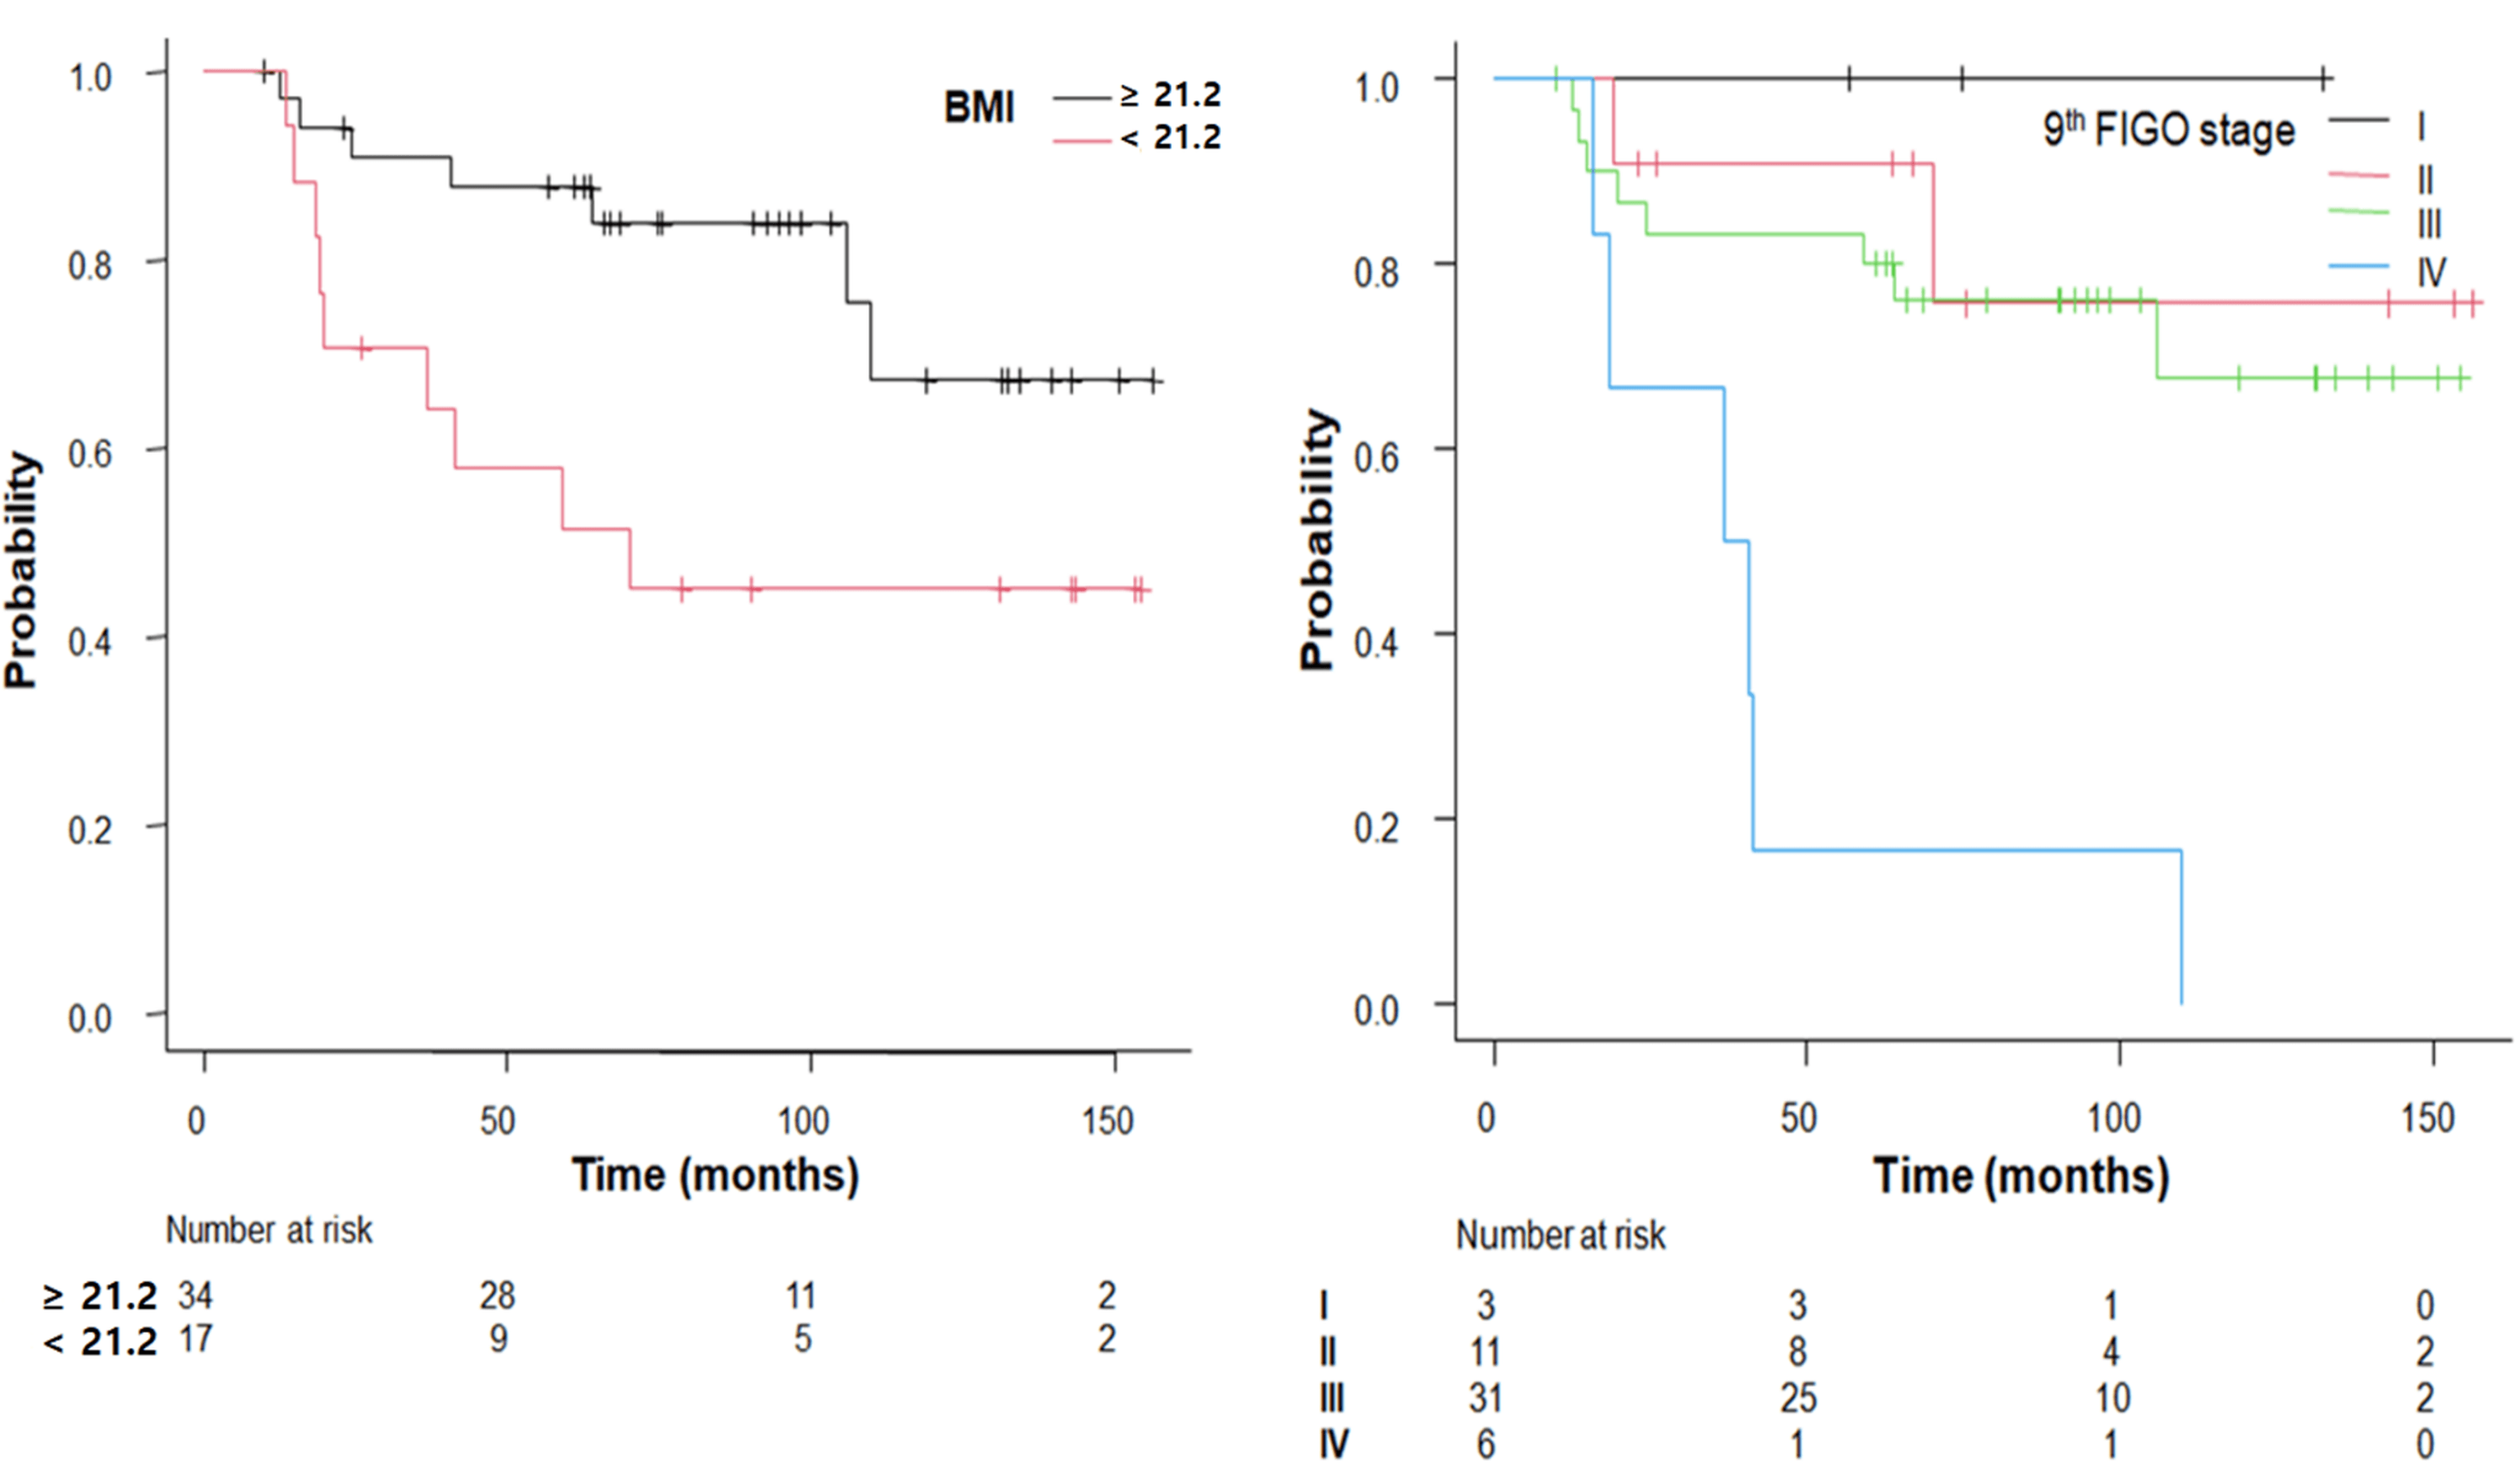 Fig. 3.
Kaplan–Meier survival curves for OS stratified by factors (BMI and FIGO stage) demonstrating statistically significant differences.
The results of the univariate analyses for PFS and OS of all factors are summarized in Table 2. A summary of significant and non-significant prognostic factors for both PFS and OS is provided in Supplementary Table 2.
A prognostic risk score for PFS was developed based on the
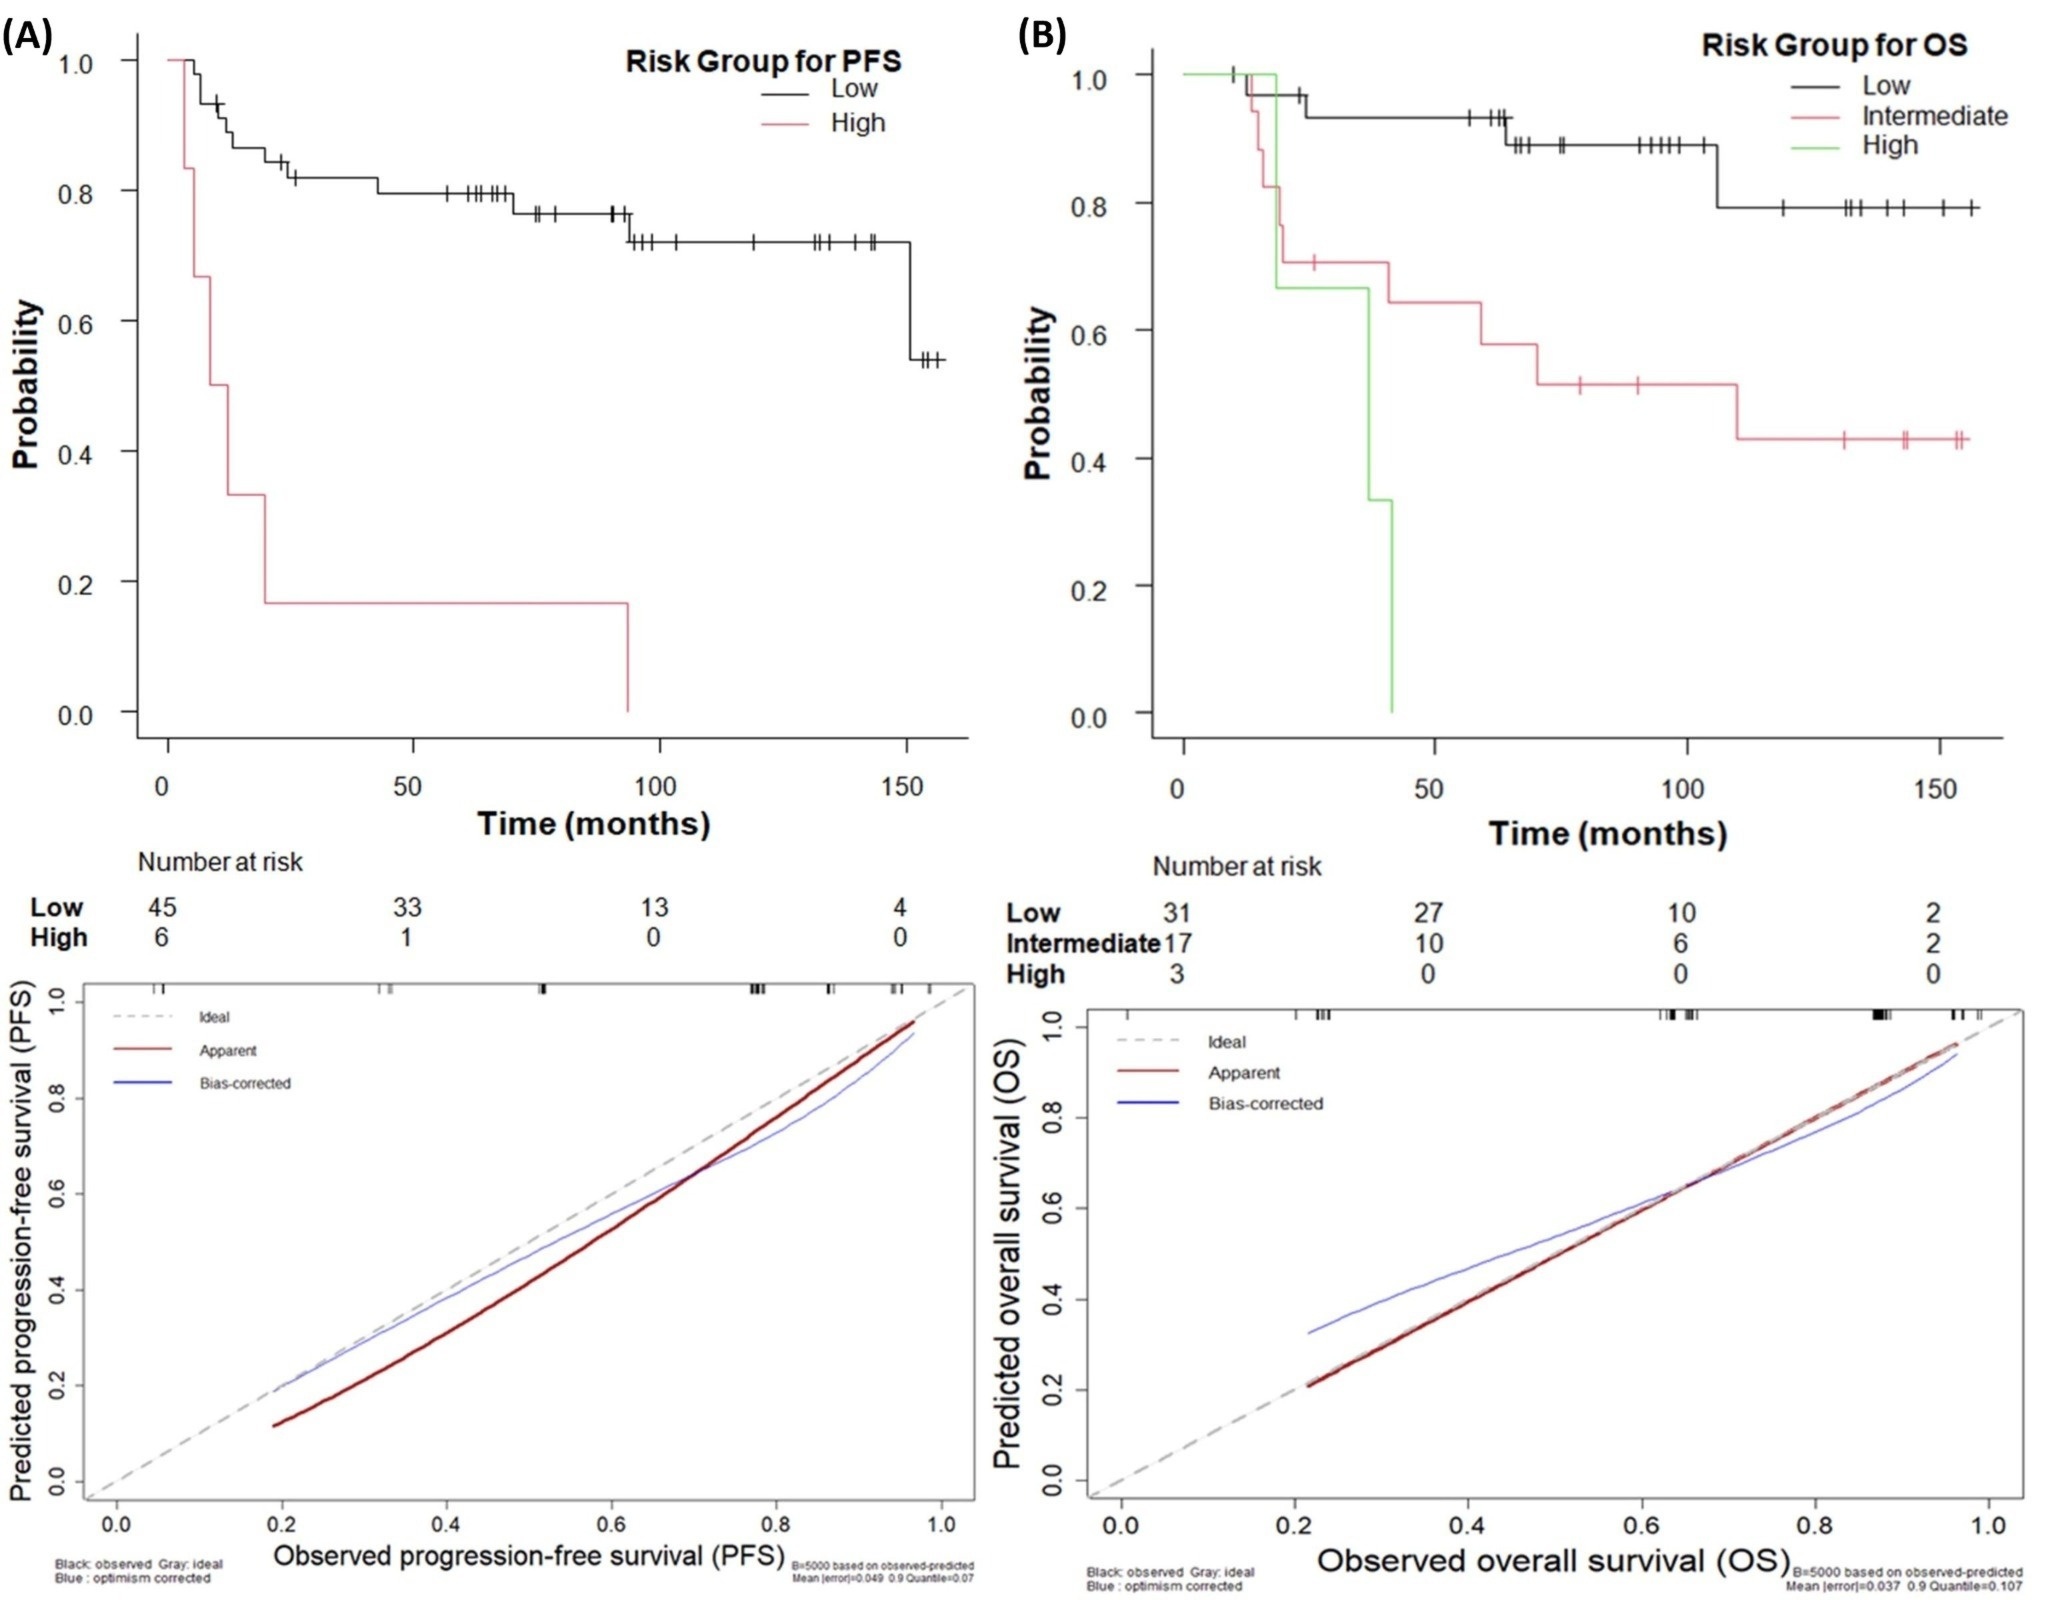 Fig. 4.
Kaplan–Meier plots and calibration curves of (A) PFS and (B) OS
according to risk stratification. (A) Kaplan–Meier plot and calibration curve for PFS. (B) Kaplan–Meier plot and calibration curve for OS. The p-values of the Kaplan–Meier
survival curves for PFS and OS for risk stratification were p
OS risk stratification resulted in three groups: low-risk group (point = 0, n =
31, 60.8%), intermediate-risk group (point = 11, n = 17, 33.3%), and high-risk
group (point = 23, n = 3, 5.9%). A statistically significant differences in the
5-year OS rates was found across the three groups: 93.2% [95% CI: 75.7% to
98.3%] for low-risk group, 57.8% [95% CI: 31.1% to 77.3%] for
intermediate-risk group, and 0% [95% CI: NA] for high-risk group p
Table 3 summarizes the multivariate analysis results for all factors related to PFS and OS, along with the resulting risk stratification scoring model.
In our study, BMI and FIGO stage were significant factors for survival outcomes among patients receiving CCRT for cervical cancer. In our study, the prognostic impact of FIGO stage and BMI was clearly demonstrated by the observed survival differences. Patients with stage I–III had a 5-year PFS of 79.5% and a 5-year OS of 93.2%, whereas those with stage IV showed markedly poorer outcomes, with both 5-year PFS and OS at 16.7%. BMI also showed a significant association with OS, with patients in the higher BMI group achieving a 5-year OS of 87.7% compared with 51.3% in the lower BMI group. Regarding radiotherapy, there was a wide EBRT dose range; however, the higher doses of 84.9 Gy and 70.4 Gy were given only to two patients with bulky pelvic nodal disease, for whom escalation was clinically appropriate while respecting OAR constraints. All other patients received EBRT within the standard range of 50.4–66.6 Gy, and no toxicities were observed in those treated with higher doses. Because all patients subsequently underwent HDR brachytherapy, the overall biological dose to the cervix remained relatively consistent, making it unlikely that these dose variations influenced the results of the study.
Previous study has investigated the relationship between BMI and survival outcomes in gynecological cancers. While obesity has traditionally been considered a negative prognostic factor, recent systematic reviews and meta-analyses have shown that a high BMI does not necessarily confer a survival benefit, and in some cases may even be associated with worse overall survival [14]. Additionally, a recent study have also shown favorable outcomes in higher BMI groups; for example, overweight patients demonstrated significantly better survival than both underweight and obese patients [23]. Furthermore, a qualitative study found that some overweight patients reported better tolerance to therapy, especially RT [24]. In another study, cachexia risk stratification using BMI showed shorter survival (median 4.83 months) in the low BMI groups [25]. Consistent with the studies mentioned above, in our study, BMI was significant for PFS and also for OS. The reasons why BMI might be linked to survival prognosis could be explained as follows: nutritional reserves could buffer against treatment-related cachexia [26], altered pharmacokinetics can lead to improved drug tolerance [27, 28], earlier detection due to more frequent screening could be performed in some regions [29], hormonal milieu possibly affects tumor growth dynamics differently [30], and sarcopenia, rather than BMI alone, serves as a more decisive prognostic factor for OS. Patients with higher BMI and preserved muscle mass tend to exhibit more favorable clinical outcomes [28, 31].
In this study, prognostic factor analysis was performed on patients classified according to the 2018 FIGO staging system. Due to the limited number of patients, the FIGO stages were divided into four groups (I, II, III, and IV) for analytical purposes. When FIGO stage was dichotomized (I–III vs. IV), the prognostic significance remained unchanged, further supporting the robustness of our findings. The results confirmed that the FIGO stage was a statistically significant prognostic factor for both OS and PFS. The 2018 revision of the FIGO staging system, which incorporates imaging and nodal status, is widely recognized as a major advance in predicting cancer outcomes [20, 32]. Studies have demonstrated that these changes allow for earlier intervention, more accurate risk stratification, and tailored treatment, all of which improve outcomes [33, 34, 35]. Overall, these results highlight the complementary value of BMI and FIGO stage as pretreatment prognostic markers. Because our study period included years before the introduction of the 2018 FIGO system, earlier cases were reclassified according to the updated criteria to maintain consistent staging. Since no patient underwent surgery, and the change in staging did not influence the CCRT approach, this reclassification is unlikely to have affected clinical management or the validity of the prognostic analyses. FIGO stage remained the most influential factor, reflecting the overall extent of disease. BMI provided additional insight into treatment tolerance and general health, with lower BMI linked to poorer survival. Because both measures are simple to obtain and represent different aspects of the patient’s status, they offer practical utility in estimating prognosis and can support a straightforward, clinically useful risk-stratification model.
In the present study, hematological factors were not identified as a significant prognostic factor for survival. The prognosis of cervical cancer is significantly affected by anemia, which is commonly indicated by low Hgb and Hct levels. Numerous studies have confirmed that pretreatment anemia correlates with poor tumor oxygenation, leading to reduced radiotherapy efficacy, increased tumor hypoxia, and shorter overall and disease-free survival [11, 12, 36]. These results underscore the clinical importance of monitoring and managing anemia both prior to and during treatment to optimize patient outcomes. In the present study, Hgb demonstrated a significant association with OS in the univariate analysis. In the multivariate analysis, it showed a marginally significant association (HR: 2.366; 95% CI: 0.8578–6.5260; p = 0.096). The multivariate Cox analysis yielded a hazard ratio of 2.366, indicating more than a twofold increased risk of mortality associated with this factor. With a larger cohort, the confidence interval would be expected to narrow, and the observed trend might reach conventional levels of statistical significance. Furthermore, although NLR, PLR, and SCC-Ag have been previously reported as significant prognostic indicators for survival, they were not identified as independent prognostic factors in the multivariate analysis of the present study. Consistent with the findings of the present study, in some studies, NLR, PLR, and SCC-Ag have shown statistical significance in the univariate analyses; however, they were not identified as independent prognostic factors for survival in multivariate analyses [37, 38]. These findings were consistent with the results of the present study and suggested that the interactions among multiple variables should be considered in prognostic evaluations.
While the literature on cervical cancer and age as a prognostic factor is mixed, a study has suggested that advanced age may be an independent negative prognostic factor for mortality [15], whereas others have indicated no significant age-related differences in survival outcomes [8, 39]. Some studies have suggested that younger women may have a higher risk of local recurrence; however, unlike older women, they do not experience worsening outcomes due to recurrence [40, 41]. In our study, age did not have a significant effect on the survival outcomes.
In the present study, prognostic analyses were conducted using pTV as the radiological factor and SUVmax as the metabolic factor. Both factors lacked statistical significance in predicting survival outcomes. Consistent with our findings, other studies consistently reported that pTV was not a statistically significant predictor of survival [13, 16]. While previous studies have demonstrated that the tumor volume reduction rate (TVRR) during treatment is a significant prognostic factor for survival, calculating TVRR requires imaging obtained during radiotherapy, such as CT or MRI [13, 16]. Because the present study aimed to evaluate only pretreatment prognostic factors, TVRR was not included in our analysis. For the same reason, MTV, which also requires post-baseline imaging data, was not incorporated into this study. Yoo et al. [42] reported that SUVmax and average SUV were not independent prognostic indicators for survival. Although a correlation was observed between tumor size and SUVmax, multivariate analysis revealed no direct association with survival. Similarly, several other studies have demonstrated that SUVmax is not significantly associated with survival in multivariate systems and shows only a borderline relationship with OS, indicating that it is not an independent prognostic factor [10, 43]. Although metabolic prognostic indicators, such as MTV and TLG, which reflect the total metabolic burden, have been reported to demonstrate greater prognostic value than SUVmax [44, 45], they are more complex and difficult to measure in routine clinical practice. Therefore, this study included only the SUVmax, which is widely measured and used in most hospitals. In our analysis, radiological and metabolic factors such as pTV and SUVmax were evaluated, but did not show independent prognostic value. This suggests that patient-related systemic factors may exert a greater influence on outcomes than tumor-based measurements. The limited independent significance of pTV and SUVmax appears to reflect their strong correlation with FIGO stage, which already incorporates major elements of tumor burden and nodal involvement. When analyzed with the FIGO stage, much of their prognostic contribution was absorbed by the stage variable. Although SUVmax is less informative than volumetric PET factors such as MTV or TLG, these measures could not be assessed because the required imaging data were unavailable. Nevertheless, SUVmax is widely reported and routinely used in clinical practice, making its inclusion as a pretreatment metabolic factor reasonable in settings where volumetric PET metrics are not accessible. The results of our multivariate analysis using all these factors confirmed that BMI and the FIGO stage were significantly associated with survival. Based on these results, we developed a risk-score stratification model. Although FIGO staging requires assessment through imaging studies, other factors, such as BMI, can be readily obtained in clinical settings, suggesting that this classification model is easily feasible and can be applied to guide treatment decisions. One of the strengths of this study is that it identifies pretreatment prognostic factors that are clinically relevant in routine practice. Building on these findings, we developed a risk-score classification model intended to aid clinicians in planning treatment. To the best of our knowledge, no previous study has integrated multiple established pretreatment prognostic factors into a single predictive model for cervical cancer. By consolidating these factors into a unified framework, this study provides a structured approach that may support more consistent and informed patient assessment before therapy.
This study has several limitations. The number of patients who met the eligibility criteria was modest, which limits the strength of the conclusions. Even so, the cohort was sufficient for the scope of the analysis because only a small number of variables were included in the multivariable Cox proportional hazards model, the events-per-variable ratio remained acceptable, and all patients were treated with a consistent CCRT protocol. However, the single-institution nature of the study suggests that the results should be interpreted with some caution. Accordingly, the prognostic tool derived from this study is intended solely to facilitate baseline risk communication and should not be used to inform or direct treatment decisions. Overall, the findings are best viewed as exploratory and will need to be confirmed in larger studies involving multiple centers.
In this study, FIGO stage and BMI were the most influential pretreatment factors for survival in patients receiving CCRT for cervical cancer. Their independent prognostic value offers a practical basis for a straightforward risk-stratification approach that may help clinicians recognize higher-risk patients and make more informed treatment decisions. Because both factors are routinely assessed before therapy, they provide a useful means of estimating prognosis at the time of diagnosis. This tool is intended solely to assist with baseline risk communication, not to guide treatment decisions. Although the model shows promise, its clinical reliability will need to be confirmed through external validation in multicenter studies and in larger patient cohorts. These findings provide a sound basis for future work to develop dependable pretreatment prognostic tools.
The datasets analyzed during the current study are available from the corresponding author on reasonable request.
SL and BO were responsible for the conceptualization and design of the study and performed the statistical analysis. Data collection was carried out by SL and HL. The interpretation of the results was contributed by HL, KL, and YK. All authors contributed to critical revision of the manuscript for important intellectual content. All authors read and approved the final manuscript. All authors have participated sufficiently in the work and agreed to be accountable for all aspects of the work.
This Institutional Review Board of Gachon University Gil Medical Center (IRB approval number: GBIRB2025-302) approved this study, which was conducted in compliance with the Declaration of Helsinki. Because this retrospective study used only de-identified clinical data that had already been collected as part of routine care prior to the initiation of the study, no additional patient contact was required; therefore, the requirement for informed consent was waived.
Not applicable.
This research received no external funding.
The authors declare no conflict of interest.
Supplementary material associated with this article can be found, in the online version, at https://doi.org/10.31083/CEOG47038.
References
Publisher’s Note: IMR Press stays neutral with regard to jurisdictional claims in published maps and institutional affiliations.