


 , Yeliz Akpinar Mayir 1
1 Department of Obstetrics and Gynecology, Antalya Training and Research Hospital, 07100 Antalya, Turkey
Abstract
This study aimed to elucidate the triglyceride to high-density lipoprotein cholesterol (TG/HDL-C), total cholesterol to high-density lipoprotein cholesterol (TC/HDL-C), low-density lipoprotein cholesterol to high density lipoprotein cholesterol (LDL-C/HDL-C), and triglyceride-glucose (TyG) indices in patients with polycystic ovary syndrome (PCOS). Moreover, we aimed to determine whether the TyG index and traditional lipid parameters could serve as indicators of insulin resistance (IR) in Turkish women.
68 patients diagnosed with PCOS who presented to the gynecology outpatient clinic of our hospital between January 2020 and June 2023 were examined retrospectively. Patients were diagnosed according to the 2003 Rotterdam criteria. Anthropometric measurements and laboratory parameters (glucose, total cholesterol, TG, HDL-C, LDL-C, glycated hemoglobin (HbA1-c), and homeostasis model assessment of insulin resistance (HOMA-IR)) were obtained from hospital records.
Receiver operating characteristic (ROC) curve analysis was performed to examine patients’ differential effects on body mass index (BMI), TyG index, TG/HDL-C, TC/HDL-C, and LDL-C/HDL-C values. A HOMA-IR value of ≥2.5 was considered a reference during these calculations. The area under the curve (AUC) and limit values for the other parameters were as follows: the TyG index was 83.8% and >4.41, the TG/HDL-C ratio was 81.7% and >1.44, and the TC/HDL-C ratio was 62.2% and >3.29. BMI and TC/HDL-C demonstrated moderate discriminatory power (AUC 70%–80%), whereas TyG index and TG/HDL-C showed strong discriminatory power (AUC 80%–90%). LDL-C/HDL-C was not statistically significant in predicting IR.
TyG index, TG/HDL-C ratio, and TC/HDL-C ratio may serve as useful indicators of IR in patients with PCOS.
Keywords
- polycystic ovary syndrome
- insulin resistance
- triglyceride-glucose index
Polycystic ovary syndrome (PCOS) is a multifactorial endocrine disorder frequently observed in women of reproductive age. It is typically defined by ovulatory disturbances, elevated androgen levels, and the presence of polycystic ovarian morphology (PCOM) detected via ultrasonography. The global prevalence of PCOS is estimated to be between 5% and 15%, and represents one of the leading causes of female infertility [1]. Although PCOS may develop in women with a normal body mass index (BMI), affecting about 50–70% of them, its occurrence is even more common in individuals with obesity. Excess insulin and androgen secretion interfere with normal follicular maturation, giving rise to menstrual irregularities, anovulatory infertility, and the accumulation of immature ovarian follicles [2].
Despite ongoing research, the underlying mechanisms of PCOS remain not fully understood. However, a substantial body of evidence implicates insulin resistance (IR) as a key factor in its development. IR is also closely linked with metabolic abnormalities, such as type 2 diabetes mellitus (T2DM), dyslipidemia, nonalcoholic fatty liver disease, and cardiovascular disorders. Strategies aimed at improving insulin sensitivity have shown beneficial effects on the clinical and metabolic manifestations of PCOS. Thus, evaluating IR in women with PCOS is essential for early detection and management of associated comorbidities [3]. Glucose metabolism disorders have been reported in 44–85% of PCOS patients. This wide range of incidence rates reflects differences in PCOS phenotypes and the ethnic backgrounds of study populations [4]. Overall, women diagnosed with PCOS have an approximately 4-fold increased risk of developing T2DM after matching for age and BMI [5]. Systematic reviews also indicate that the prevalence of impaired glucose tolerance and T2DM is greater in PCOS patients, independent of obesity, which can be observed at earlier ages. However, documenting IR in clinical settings is not always easy [6].
The hyperinsulinemic-euglycemic clamp (HEC) method is considered the gold
standard for evaluating IR. Nonetheless, its use in routine settings is limited
due to the procedure’s complexity, high-cost, and requirement for specialized
equipment and expertise. As alternatives, indices such as the homeostasis model
assessment of insulin resistance (HOMA-IR), the quantitative insulin sensitivity
check index (QUICKI), and the fasting glucose-to-insulin ratio (FG–IR) have
garnered attention in recent studies. However, these surrogate measures also
present limitations, including variability in insulin assay methods, lack of
universal standardization, and relatively high costs [7]. Consequently,
identifying a simpler, reliable, and more economical marker for assessing IR
would be highly beneficial for everyday clinical applications. In clinical
practice, HOMA-IR is the most commonly used method for assessing IR. However, the
triglyceride-glucose (TyG) index has been proposed as a reliable surrogate marker
for IR [8]. In insulin-resistant conditions, the removal of triglyceride
(TG)-rich lipoproteins from the bloodstream becomes impaired, leading to elevated
TG levels. Traditional lipid ratios—including total cholesterol to high-density
lipoprotein cholesterol (TC/HDL-C), TG to high-density lipoprotein cholesterol
(TG/HDL-C), and low-density lipoprotein cholesterol to HDL-C (LDL-C/HDL-C)—have
been shown to correlate with IR, as measured by HOMA-IR, in women with PCOS.
Moreover, the TC/HDL-C ratio has been identified as a potential indicator for
both IR and cardiovascular disease risk [4]. The TyG index has emerged as a
simple, cost-effective, and reliable surrogate marker of IR, which is a key
pathophysiological mechanism underlying a broad spectrum of metabolic and
cardiovascular disorders. Given that the TyG index is derived from routine
biochemical parameters—fasting TGs and fasting plasma glucose—it offers a
practical alternative to insulin-based indices and demonstrates a strong
correlation with the HEC. Moreover, it has been shown to predict the onset of
T2DM, assess poor glycemic control and diabetes-related complications, and
reflect pancreatic
It is well established that low-glycemic index diets, compared with high-glycemic index diets, enhance the lipid profile by improving glucose regulation, as evidenced by reductions in HOMA-IR and fasting insulin levels, and by decreasing total TC, LDL-C, and TG levels [10]. In addition, hypoglycemic agents, antiplatelet drugs, lipid-lowering agents, and antihypertensive medications have been shown to affect the TyG index and lipid ratios [11].
The relationship between lipid ratios and IR may vary across ethnicities [8], and data on Turkish women with PCOS remain limited. This study aims to evaluate the potential utility of TG/HDL-C, TC/HDL-C, LDL-C/HDL-C, and TyG indices in identifying IR (measured by HOMA-IR). The objective is to determine whether the TyG index and traditional lipid ratios could serve as practical alternatives for assessing IR in primary care settings lacking access to HOMA testing.
In this retrospective study, data from 68 women diagnosed with PCOS who attended the Obstetrics and Gynecology Clinic of Antalya Training and Research Hospital (Turkey) between January 2020 and June 2023 were analyzed. The diagnosis of PCOS was established based on the 2003 Rotterdam criteria. To confirm the diagnosis, other potential causes of hyperandrogenism and ovulatory dysfunction, such as Cushing’s syndrome, thyroid disorders, 21-hydroxylase deficiency, androgen-secreting tumors, congenital adrenal hyperplasia, and hyperprolactinemia, were ruled out. Hirsutism was evaluated using the Modified Ferriman–Gallwey (mFG) scoring method, while acne severity was determined using the Global Acne Grading System (GAGS).
All study procedures complied with institutional and national ethical guidelines, as well as the principles outlined in the Declaration of Helsinki (1975, revised in 2008). Ethical approval was obtained from the institutional review board under protocol number 2023–168. As this was a retrospective study, the requirement for informed consent was waived.
Anthropometric measurements (weight, height), complaints (oligomenorrhea, hirsutism, alopecia, acne), laboratory parameters (glucose, TC, TG, HDL-C, LDL-C, follicle-stimulating hormone [FS]), luteinizing hormone [LH], thyroid-stimulating hormone [TSH], prolactin, estradiol, 17-OH progesterone, dehydroepiandrosterone sulfate [DHEA-SO4], total testosterone, glycated hemoglobin [HbA1-c], and HOMA-IR) were obtained from hospital records. The Castelli Risk Indexes (CRI) I and II are simple ratios derived from an individual’s lipid profile and are used as screening tools to identify increased cardiovascular risk. CRI-I is calculated as the ratio of TC to HDL-C, whereas CRI-II is based on the ratio of LDL-C to HDL-C [12]. The TG/HDL-C, TC/HDL-C, and TyG indices were calculated as follows:
Patients aged 18–35 years who were diagnosed with PCOS and who applied to our hospital’s gynecology clinic were included in the study. PCOS patients with and without IR were compared via the calculation of traditional lipid ratios (TC/HDL-C, TG /HDL-C, LDL-C/HDL-C, TyG indices).
All statistical analyses were performed using IBM SPSS Statistics for MacOS,
version 29.0 (IBM Corp., Armonk, NY, USA). Categorical variables were presented
as frequencies and percentages, while continuous variables were summarized as
mean
A multivariable logistic regression analysis was performed to evaluate
independent predictors associated with IR (HOMA-IR
A total of 68 patients diagnosed with PCOS were included in this retrospective
analysis. The individuals were divided into two groups: PCOS patients with (n =
37) and without (n = 31) IR. Women with IR had significantly greater body weights [78 (60.0–88.0) kg versus 62 (56.0–66.0) kg; p
| Variables | Toplam (N = 68) | No IR (n = 31) | IR (n = 37) | p-value | |
| Age (years) | 23 (21–25) | 24 (22–26) | 22 (21–24) | 0.081 | |
| Education | 0.165 | ||||
| -Middle school | 1 (1.5) | 0 (0.0) | 1 (2.7) | ||
| -High school | 45 (66.2) | 24 (77.4) | 21 (56.8) | ||
| -University | 22 (32.4) | 7 (22.6) | 15 (40.5) | ||
| Employment status | 0.280 | ||||
| -Not working | 53 (77.9) | 26 (83.9) | 27 (73.0) | ||
| -Working | 15 (22.1) | 5 (16.1) | 10 (27.0) | ||
| Marital status | 0.566 | ||||
| -Single | 55 (80.9) | 26 (83.9) | 29 (78.4) | ||
| -Married | 13 (19.1) | 5 (16.1) | 8 (21.6) | ||
| Amenorrhea (months) | 2 (2–3) | 2 (2–3) | 2 (2–3) | 0.516 | |
| Weight (kg) | 65 (57.5–84.5) | 62 (56.0–66.0) | 78 (60.0–88.0) | 0.001 | |
| Height (cm) | 160.8 |
161.9 |
159.9 |
0.153 | |
| BMI (kg/m2) | 25.2 (22.6–32.1) | 23.1 (21.4–25.2) | 29.4 (24.1–35.5) | ||
| Hirsutism | 50 (73.5) | 23 (74.2) | 27 (73.0) | 0.910 | |
| Acne | 18 (26.5) | 4 (12.9) | 14 (37.8) | 0.020 | |
| Alopecia | 2 (2.9) | 0 (0.0) | 2 (5.4) | 0.496 | |
| Smoking | 4 (5.9) | 1 (3.2) | 3 (8.1) | 0.620 | |
| FSH (U/L) | 5.9 |
6.3 |
5.7 |
0.196 | |
| LH (U/L) | 9.9 (6.4–13.4) | 10.1 (6.5–13.8) | 9.9 (6–13) | 0.563 | |
| Estradiol (ng/L) | 40 (33–57) | 42 (34–54) | 38 (33–60) | 0.956 | |
| Total testosterone (µg/L) | 0.7 |
0.6 |
0.7 |
0.066 | |
| DHEA-SO4 (µg/dL) | 262.1 (207.8–340.3) | 249.7 (164.8–304.5) | 277.8 (226.8–360.3) | 0.095 | |
| 17-OH-progesteron | 0.6 (0.4–1.2) | 0.5 (0.4–0.9) | 0.7 (0.5–1.6) | 0.095 | |
| TSH (µIU/mL) | 1.8 (1.3–2.4) | 1.8 (1.3–2.1) | 1.8 (1.2–2.8) | 0.579 | |
| HbA1-c (%) | 5.3 (5.1–5.5) | 5.1 (5.0–5.3) | 5.4 (5.3–5.5) | ||
| Fasting insulin (IU/L) | 12.7 (6.4–17.7) | 6.3 (5.2–9.2) | 17.4 (15.2–29.1) | ||
| HOMA-IR | 2.7 (1.4–3.9) | 1.4 (1.0–1.8) | 3.7 (3.2–6.2) | ||
| Fasting glucose (mg/dL) | 86.6 |
82.3 |
90.1 |
0.003 | |
| HDL-C (mg/dL) | 52 (46–60) | 56 (47–67) | 51 (43–56) | 0.032 | |
| LDL-C (mg/dL) | 100.3 |
99.4 |
101.1 |
0.798 | |
| TG (mg/dL) | 95.5 (65–135) | 69.0 (52–100) | 112.0 (90–148) | ||
| TC (mg/dL) | 174.4 |
171.9 |
176.4 |
0.562 | |
| Prolactin (ng/mL) | 15.1 (10.8–19.4) | 16 (11.0–21.3) | 13.3 (10.7–18.0) | 0.449 | |
| TyG index | 4.5 |
4.3 |
4.6 |
||
| TG/HDL-C | 1.6 (1.2–2.6) | 1.2 (0.9–1.7) | 2.4 (1.6–2.9) | ||
| TC/HDL-C | 3.3 |
3.1 |
3.5 |
0.010 | |
| LDL-C/HDL-C | 1.9 |
1.8 |
2.0 |
0.112 | |
IR, insulin resistance; BMI, body mass index; FSH, follicle-stimulating hormone; LH, luteinizing hormone; DHEA-SO4, dehydroepiandrosterone sulfate; TSH, Thyroid-stimulating hormone; HbA1-c, glycated hemoglobin; TC, total cholesterol; TG, triglycerides; HDL-C, high-density lipoprotein cholesterol; LDL-C, low-density lipoprotein cholesterol; TyG, triglyceride-glucose; HOMA-IR, homeostasis model assessment of insulin resistance.
Categorical variables are presented as n (%), normally distributed continuous
variables as mean
The glucose-related parameters included fasting blood glucose (FBG) (90.1
Lipid-related parameters were significantly lower in the insulin-resistant
patient group HDL-C [51 (43–56) mg/dL versus 56 (47–67) mg/dL; p =
0.032], whereas TG were significantly greater [112.0 (90–148) mg/dL versus 69.0
(52–100) mg/dL; p
The LDL-C/HDL-C ratio was not significantly different between the two groups
(p = 0.112). However, all other calculations were significant. TC/HDL-C
(3.5
The results of the ROC analysis evaluating the discriminative performance of BMI
and various lipid ratios in predicting IR in women with (HOMA-IR
| Risk factors | AUC (95% CI) | Cutoff | p-value | Sensitivity (%) | Specificity (%) | PPV (%) | NPV (%) |
| BMI | 0.772 (0.658–0.886) | 64.9 | 87.1 | 85.7 | 67.5 | ||
| TyG index | 0.838 (0.746–0.931) | 83.8 | 67.7 | 75.6 | 77.8 | ||
| TG/HDL-C | 0.817 (0.715–0.919) | 81.1 | 71.0 | 76.9 | 75.9 | ||
| TC/HDL-C | 0.705 (0.577–0.833) | 0.004 | 62.2 | 80.6 | 79.3 | 64.1 | |
| LDL-C/HDL-C | 0.632 (0.496–0.767) | 0.063 | 56.8 | 74.2 | 72.4 | 59.0 |
AUC, area under curve; CI, confidence interval; PPV, positive predictive value; NPV, negative predictive value.
The AUC indicates the statistical significance of the discrimination ability of
the diagnostic test. Since the diagnostic test evaluated in our study revealed
that the patients’ HOMA-IR value was
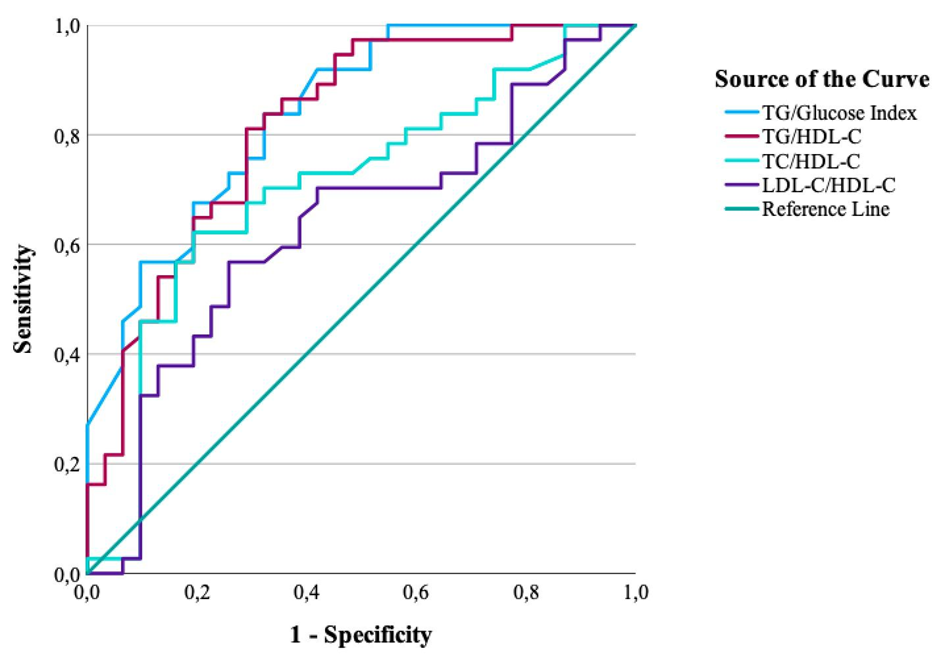 Fig. 1.
ROC curves of BMI and lipid ratios for predicting IR (HOMA-IR
To evaluate the additional diagnostic value of the TyG index over BMI, a combined logistic regression model, including BMI and TyG index values, was constructed, and the predicted probabilities of the model were subjected to ROC analysis. The combined model demonstrated the highest discriminative ability [AUC = 0.880, 95% CI: 0.792–0.968], performing significantly better than the model including BMI alone [AUC = 0.772, 95% CI: 0.658–0.886] and the model using the TyG index alone [AUC = 0.838, 95% CI:0.746–0.931]. These results indicate that the TyG index provides additional and BMI-independent diagnostic value in identifying IR in women with PCOS (Fig. 2).
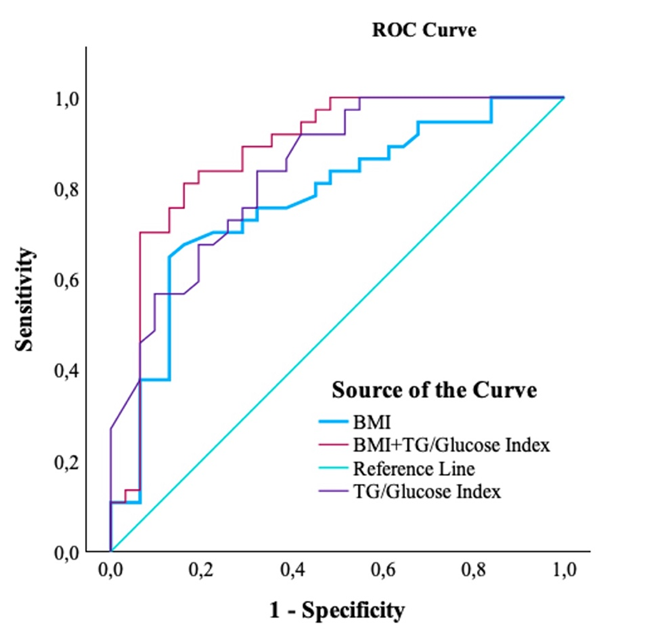 Fig. 2.
Combined ROC curve (BMI + TyG index) compared with BMI and TyG index alone for predicting IR.
A multivariable logistic regression analysis was performed to evaluate
independent predictors associated with IR (HOMA-IR
| Variable | OR* | 95% CI | p-value | |
| BMI (per 1 kg/m2) | 0.147 | 1.16 | 1.02–1.32 | 0.025 |
| TyG index (per 0.1-unit increase) | 0.657 | 1.93 | 1.34–2.77 |
*OR values were calculated after rescaling TG-glucose index by multiplying by 10 so that odds ratios represent the effect per 0.1-unit increase.
OR, odds ratio.
In recent years, the TyG index has emerged as a practical, inexpensive, and reliable indicator of IR. Owing to its simplicity and accessibility, it has attracted attention as a promising biomarker that may be useful in predicting several metabolic and systemic disorders. Furthermore, the TyG index has been associated with conditions such as diabetes mellitus, cardiovascular events, fatty liver disease, metabolic lung disorders, and gastric cancers, and it is anticipated to gain broader use in routine practice, particularly in primary healthcare settings [14, 15, 16].
Yang et al. (2023) [17] reported that the TyG index was strongly and independently associated with MS in women with PCOS. PCOS creates a facilitating environment for additional comorbidities, and according to Yang et al. [17], the TyG index is independently associated with risk factors, including hypertension, obesity, central obesity, hyperglycemia, and dyslipidemia. On the contrary, in women without PCOS, the TyG index is independently associated with only obesity and hyperglycemia. Moreover, Yang et al. [17] reported that a higher TyG index led to an increased incidence of MS in patients with PCOS.
In a study conducted in Brazil, Vasques et al. (2011) [18] demonstrated that the TyG index was slightly more effective than HOMA-IR in detecting IR. Similarly, Zheng et al. (2022) [19] found that higher TyG index levels were correlated with IR—evaluated through HOMA-IR, QUICKI, and FG-IR—among Chinese women diagnosed with PCOS. Their findings indicated that both the TyG index and TyG-BMI outperformed conventional lipid parameters and ratios in predicting IR, suggesting their potential use as diagnostic markers in this population [19]. Moreover, when compared with lipid ratios such as TG/HDL-C, the TyG index showed a higher AUC in studies involving Iranian women [20].
In our research, the AUC values of BMI and the TC/HDL-C ratio were moderate, whereas those of the TyG index and TG/HDL-C ratio demonstrated stronger predictive capacity for IR. Consistent with our observations, Kheirollahi et al. (2020) [20] also observed in Iranian women with PCOS that TG/HDL-C was significantly correlated with IR, and could serve as a useful alternate marker. Similarly, we observed that women with PCOS and IR exhibited elevated values of the TyG index, TG/HDL-C, and TC/HDL-C ratios.
The TyG index has recently gained recognition as a useful marker in patients with PCOS as well as those with T2DM. Serving as a composite indicator derived from FPG and TG levels, it has been identified as a strong predictor for both prediabetes and T2DM. In a Korean population with T2DM, the TyG index demonstrated superior performance compared with HOMA-IR in assessing IR [21]. Similarly, a study involving 3307 Colombian participants indicated that the TyG index was more effective than BMI, waist circumference (WC), and the visceral adiposity index (VAI) in identifying individuals at risk for prediabetes [22]. In addition, a cohort study by Wen et al. (2020) [23] that followed 4543 Chinese adults without baseline diabetes or prediabetes found that the TyG index showed a higher AUC for predicting prediabetes and isolated impaired glucose tolerance (IGT) compared with FPG, WC, and BMI.
This study has three main limitations. First, it was a retrospective study based on existing medical records, which may have been subject to potential data incompleteness or reporting bias. Second, the study was conducted at a single tertiary center, which may limit the generalizability of the findings. Third, the sample size was relatively small, which may limit the statistical power of the study.
The TyG index, TG/HDL-C ratio, and TC/HDL-C ratio may be utilized to identify IR in patients with PCOS. Lipid ratios appear to be more informative than lipid parameters alone. These findings suggest that lipid ratios could support the detection of IR in PCOS patients at primary healthcare facilities where HOMA testing is not accessible.
AUC, area under the curve; BMI, body mass index; CVD, cardiovascular disease; FG–IR, fasting glucose insulin ratio; FBG, fasting blood glucose; FSH, Follicle-stimulating hormone; HDL-C, high-density lipoprotein cholesterol; HOMA-IR, homeostasis model assessment for insulin resistance; IR, insulin resistance; LDL-C, low-density lipoprotein cholesterol; LH, Luteinizing hormone; MS, metabolic syndrome; PCOM, polycystic ovarian morphology; PCOS, polycystic ovary syndrome; QUICK, quantitative insulin sensitivity control index; ROC, Receiver Operating Characteristics; SPSS, Statistics Package for the Social Sciences; T2DM, type 2 diabetes mellitus; TC, total cholesterol; TG, triglycerides; TyG, triglyceride glucose index; VAI, visceral adiposity index.
The datasets analyzed in the present study are available from the corresponding author upon reasonable request.
NE and YAM have designed the study. NE has collected the data, performed statistical analysis NE and YAM prepared and reviewed the manuscript. Both authors contributed to editorial changes in the manuscript. Both authors read and approved the final manuscript. Both authors have participated sufficiently in the work and agreed to be accountable for all aspects of the work.
Ethics approval was granted by the Ethics Committee of Antalya Training and Research Hospital (Protocol No. 2023–168), and as this was a retrospective study, the requirement for informed consent was waived. The study was conducted in accordance with the guidelines of the Declaration of Helsinki.
Not applicable.
This research received no external funding.
The authors declare no conflict of interest.
References
Publisher’s Note: IMR Press stays neutral with regard to jurisdictional claims in published maps and institutional affiliations.