


 , Yujuan Weng 2,†, Baiwei Lin 2
1 Department of Ultrasound, Affiliated Hospital of Putian University & Putian Children’s Hospital, 351100 Putian, Fujian, China
2 Department of Ultrasound, Affiliated Hospital of Putian University, 351100 Putian, Fujian, China
†These authors contributed equally.
Abstract
To assess the diagnostic value of a nomogram that integrates ultrasound and clinical features to differentiate uterine sarcoma from uterine fibroids.
In this retrospective analysis, data from 60 uterine sarcoma patients and 60 uterine fibroid patients confirmed by surgical pathology at the Affiliated Hospital of Putian University (August 2024–June 2025) were examined. Clinical variables (age, disease duration, menopausal status, postmenopausal bleeding), laboratory markers (carbohydrate antigen 125 [CA125], lactate dehydrogenase [LDH]), and ultrasound characteristics (maximal diameter, margin, echogenicity, cystic change, calcification, and Adler blood flow grading) were collected. Independent predictors were determined through both univariate and multivariate logistic regression analyses. Predictive models were constructed and evaluated via receiver operating characteristic (ROC) curves, with model robustness further assessed through tenfold cross-validation and bootstrap validation.
The groups were successfully matched for key baseline characteristics (age, disease duration, menopausal status; all p > 0.05). Multivariate analysis revealed that age, postmenopausal bleeding, LDH, CA125, echogenicity, and tumor margin were independent predictors. The combined model demonstrated enhanced diagnostic ability with an area under the curve (AUC) of 0.902 (95% CI: 0.847–0.935), outperforming individual models based on clinical (AUC: 0.764), laboratory (AUC: 0.651), and ultrasound (AUC: 0.804) data. The model’s generalizability was confirmed by internal validation, showing strong maintained performance (tenfold cross-validated AUC: 0.885; bootstrap-corrected AUC: 0.887).
A nomogram based on combined clinical, laboratory, and ultrasound features provides high accuracy for differentiating uterine sarcoma from fibroids, supporting clinical decision-making.
Keywords
- uterine sarcoma
- uterine fibroids
- nomogram
- ultrasound
- differential diagnosis
Uterine sarcoma is a rare but highly aggressive malignancy of the female reproductive tract that accounts for a small proportion of uterine tumors but has a poor prognosis due to its rapid progression and early metastasis [1, 2, 3]. In contrast, uterine fibroids (leiomyomas) are benign smooth muscle tumors and represent the predominant gynecological tumors found among women of childbearing age [4, 5]. Despite considerable differences in therapeutic strategies and prognoses, differentiating uterine sarcoma from fibroids remains a significant clinical challenge, especially in the preoperative setting [6, 7]. Previous research have identified several sonographic features that may aid in distinguishing uterine sarcomas from fibroids [1, 6, 7]. A comprehensive meta-analysis systematically reviewed ultrasound characteristics that could differentiate these tumors [8]. The key distinguishing features include (1) irregular tumor margins, (2) heterogeneous internal echogenicity, (3) the presence of cystic degeneration, (4) increased vascularity with high Doppler flow indices, and (5) the presence of necrotic or hemorrhagic areas. However, no single ultrasound feature provides a definitive diagnosis, highlighting the need for a comprehensive approach. Conventional imaging modalities such as ultrasound can offer valuable information regarding tumor morphology, vascularity, and internal characteristics. However, the similarity of imaging characteristics shared by benign and malignant uterine tumors often leads to misdiagnosis [9, 10]. The integration of multidimensional data encompassing clinical factors, laboratory markers, and advanced ultrasound parameters may improve diagnostic accuracy and aid clinicians in personalized decision-making [11].
Nomogram models are widely used in oncology for risk stratification, prediction, and individualized assessment by converting complex statistical predictions into intuitive visual tools [12, 13, 14]. To date, few studies have systematically evaluated the performance of nomograms incorporating both ultrasound and clinical features in distinguishing between uterine sarcoma and fibroids.
Accordingly, this research seeks to establish and verify a nomogram incorporating clinical, laboratory, and ultrasound characteristics to improve presurgical discrimination between uterine sarcoma and fibroids, thus facilitating timely and appropriate clinical management.
The overall research process, including patient screening, data collection, and
model validation, is illustrated in Fig. 1. This study retrospectively reviewed
the clinical records collected at the Affiliated Hospital of Putian University
from August 2024 to June 2025. Sixty individuals diagnosed with uterine sarcoma
and another 60 with uterine fibroids, all confirmed by pathological examination,
were included. The inclusion criteria were as follows: (1) had a diagnosis of
uterine sarcoma or fibroid confirmed by surgical pathology; (2) all patients
underwent color Doppler ultrasound for subsequent analysis; (3) complete clinical
and laboratory data were available for all patients to ensure the accuracy and
reliability of the study; and (4) patients in all age groups, including both
premenopausal and postmenopausal women, were included. The exclusion criteria
were as follows: (1) patients with concomitant malignancies, which could
interfere with the diagnosis and analysis of uterine sarcoma or fibroids; (2)
long-term estrogen use, as estrogen may influence tumor development and cause
bias; (3) patients diagnosed with nonprimary uterine sarcoma to ensure the
specificity and consistency of the study cohort; and (4) patients who did not
undergo ultrasound examination or who had significant missing clinical or
laboratory data to ensure data validity and scientific rigor. The diagnoses of
all the patients were independently assessed by two senior pathologists in a
blinded manner and confirmed according to the 2020 World Health Organization
(WHO) classification of female genital tumors [15]. For the identification of
sarcomatoid changes, the following morphological criteria were strictly followed:
(1) prominent nuclear atypia (increased nuclear-cytoplasmic ratio, mitotic count
 Fig. 1.
Flowchart of this study.
This retrospective, single-center case-control study followed the STROBE
guidelines and employed a 1:1 matched design to minimize selection bias,
carefully matching 60 uterine sarcoma patients and 60 uterine fibroid patients
based on age (
The data were categorized into three groups, namely, clinical information, laboratory indicators, and ultrasound features, and analyzed via Python (version 3.12.3; Python Software Foundation, Beaverton, OR, USA). Independent predictors in each group were identified through univariate and multivariate analyses. Four predictive models were constructed: clinical, laboratory, ultrasound, and combined models. The diagnostic performance of each model was assessed via ROC curves to determine the AUC, sensitivity, and specificity. The DeLong test was used to compare the predictive ability of the models. To rigorously evaluate the models’ generalizability and mitigate overfitting, we employed two internal validation techniques. First, tenfold cross-validation was performed by randomly partitioning the dataset into 10 equal-sized folds. The models were trained on 9 folds and validated on the remaining fold; this process was repeated 10 times, and the performance metrics were averaged to yield a robust estimate. Second, bootstrap validation with 1000 repetitions was conducted. For each repetition, a bootstrap sample of the same size as the original dataset was drawn with replacement to train the model, which was then evaluated on the original dataset. The optimism (i.e., the difference between the bootstrap performance and the apparent performance) was calculated for each repetition and averaged to obtain an optimism-corrected estimate of the models’ performance.
All the statistical calculations were conducted via Python (version 3.12.3;
Python Software Foundation, Beaverton, OR, USA) and IBM SPSS Statistics (v 26.0;
IBM Corp., Armonk, NY, USA). The kappa test was used to assess the diagnostic
consistency among pathologists (Kappa = 0.82, p
The baseline characteristics of the study participants are summarized in Table 1. Successful matching was confirmed for age, disease duration, and menopausal
status, as no significant differences were observed between the two groups (all
p
| Characteristic | Uterine fibroids (n = 60) | Uterine sarcoma (n = 60) | p value | |
| Demographic & clinical | ||||
| Age (years), mean |
48.52 |
50.10 |
0.105 | |
| Disease duration (years), mean |
5.83 |
5.63 |
0.087 | |
| Menopausal status, n (%) | 0.754 | |||
| Premenopausal | 38 (63.3%) | 36 (60.0%) | ||
| Postmenopausal | 22 (36.7%) | 24 (40.0%) | ||
| Postmenopausal bleeding, n (%) | 4 (6.7%) | 18 (30.0%) | 0.002 | |
| Laboratory markers | ||||
| LDH (U/L), median (IQR) | 185.5 (162–210) | 245.0 (218–285) | ||
| CA125 (U/mL), median (IQR) | 28.0 (20–40) | 65.5 (45–92) | ||
| Ultrasound features | ||||
| Maximal diameter (cm), mean |
6.5 |
7.8 |
0.010 | |
| Margin, n (%) | ||||
| Regular | 52 (86.7%) | 20 (33.3%) | ||
| Irregular | 8 (13.3%) | 40 (66.7%) | ||
| Echogenicity, n (%) | 0.003 | |||
| Homogeneous | 45 (75.0%) | 28 (46.7%) | ||
| Heterogeneous | 15 (25.0%) | 32 (53.3%) | ||
| Cystic change, n (%) | 10 (16.7%) | 26 (43.3%) | 0.003 | |
| Calcification, n (%) | 12 (20.0%) | 8 (13.3%) | 0.462 | |
| Adler blood flow grade, n (%) | ||||
| Grade 1–2 | 48 (80.0%) | 22 (36.7%) | ||
| Grade 3–4 | 12 (20.0%) | 38 (63.3%) | ||
LDH, lactate dehydrogenase; CA125, carbohydrate antigen 125; IQR, interquartile range.
Univariate logistic regression analysis indicated that age (OR = 2.105,
p = 0.002), menopausal status (OR = 5.222, p
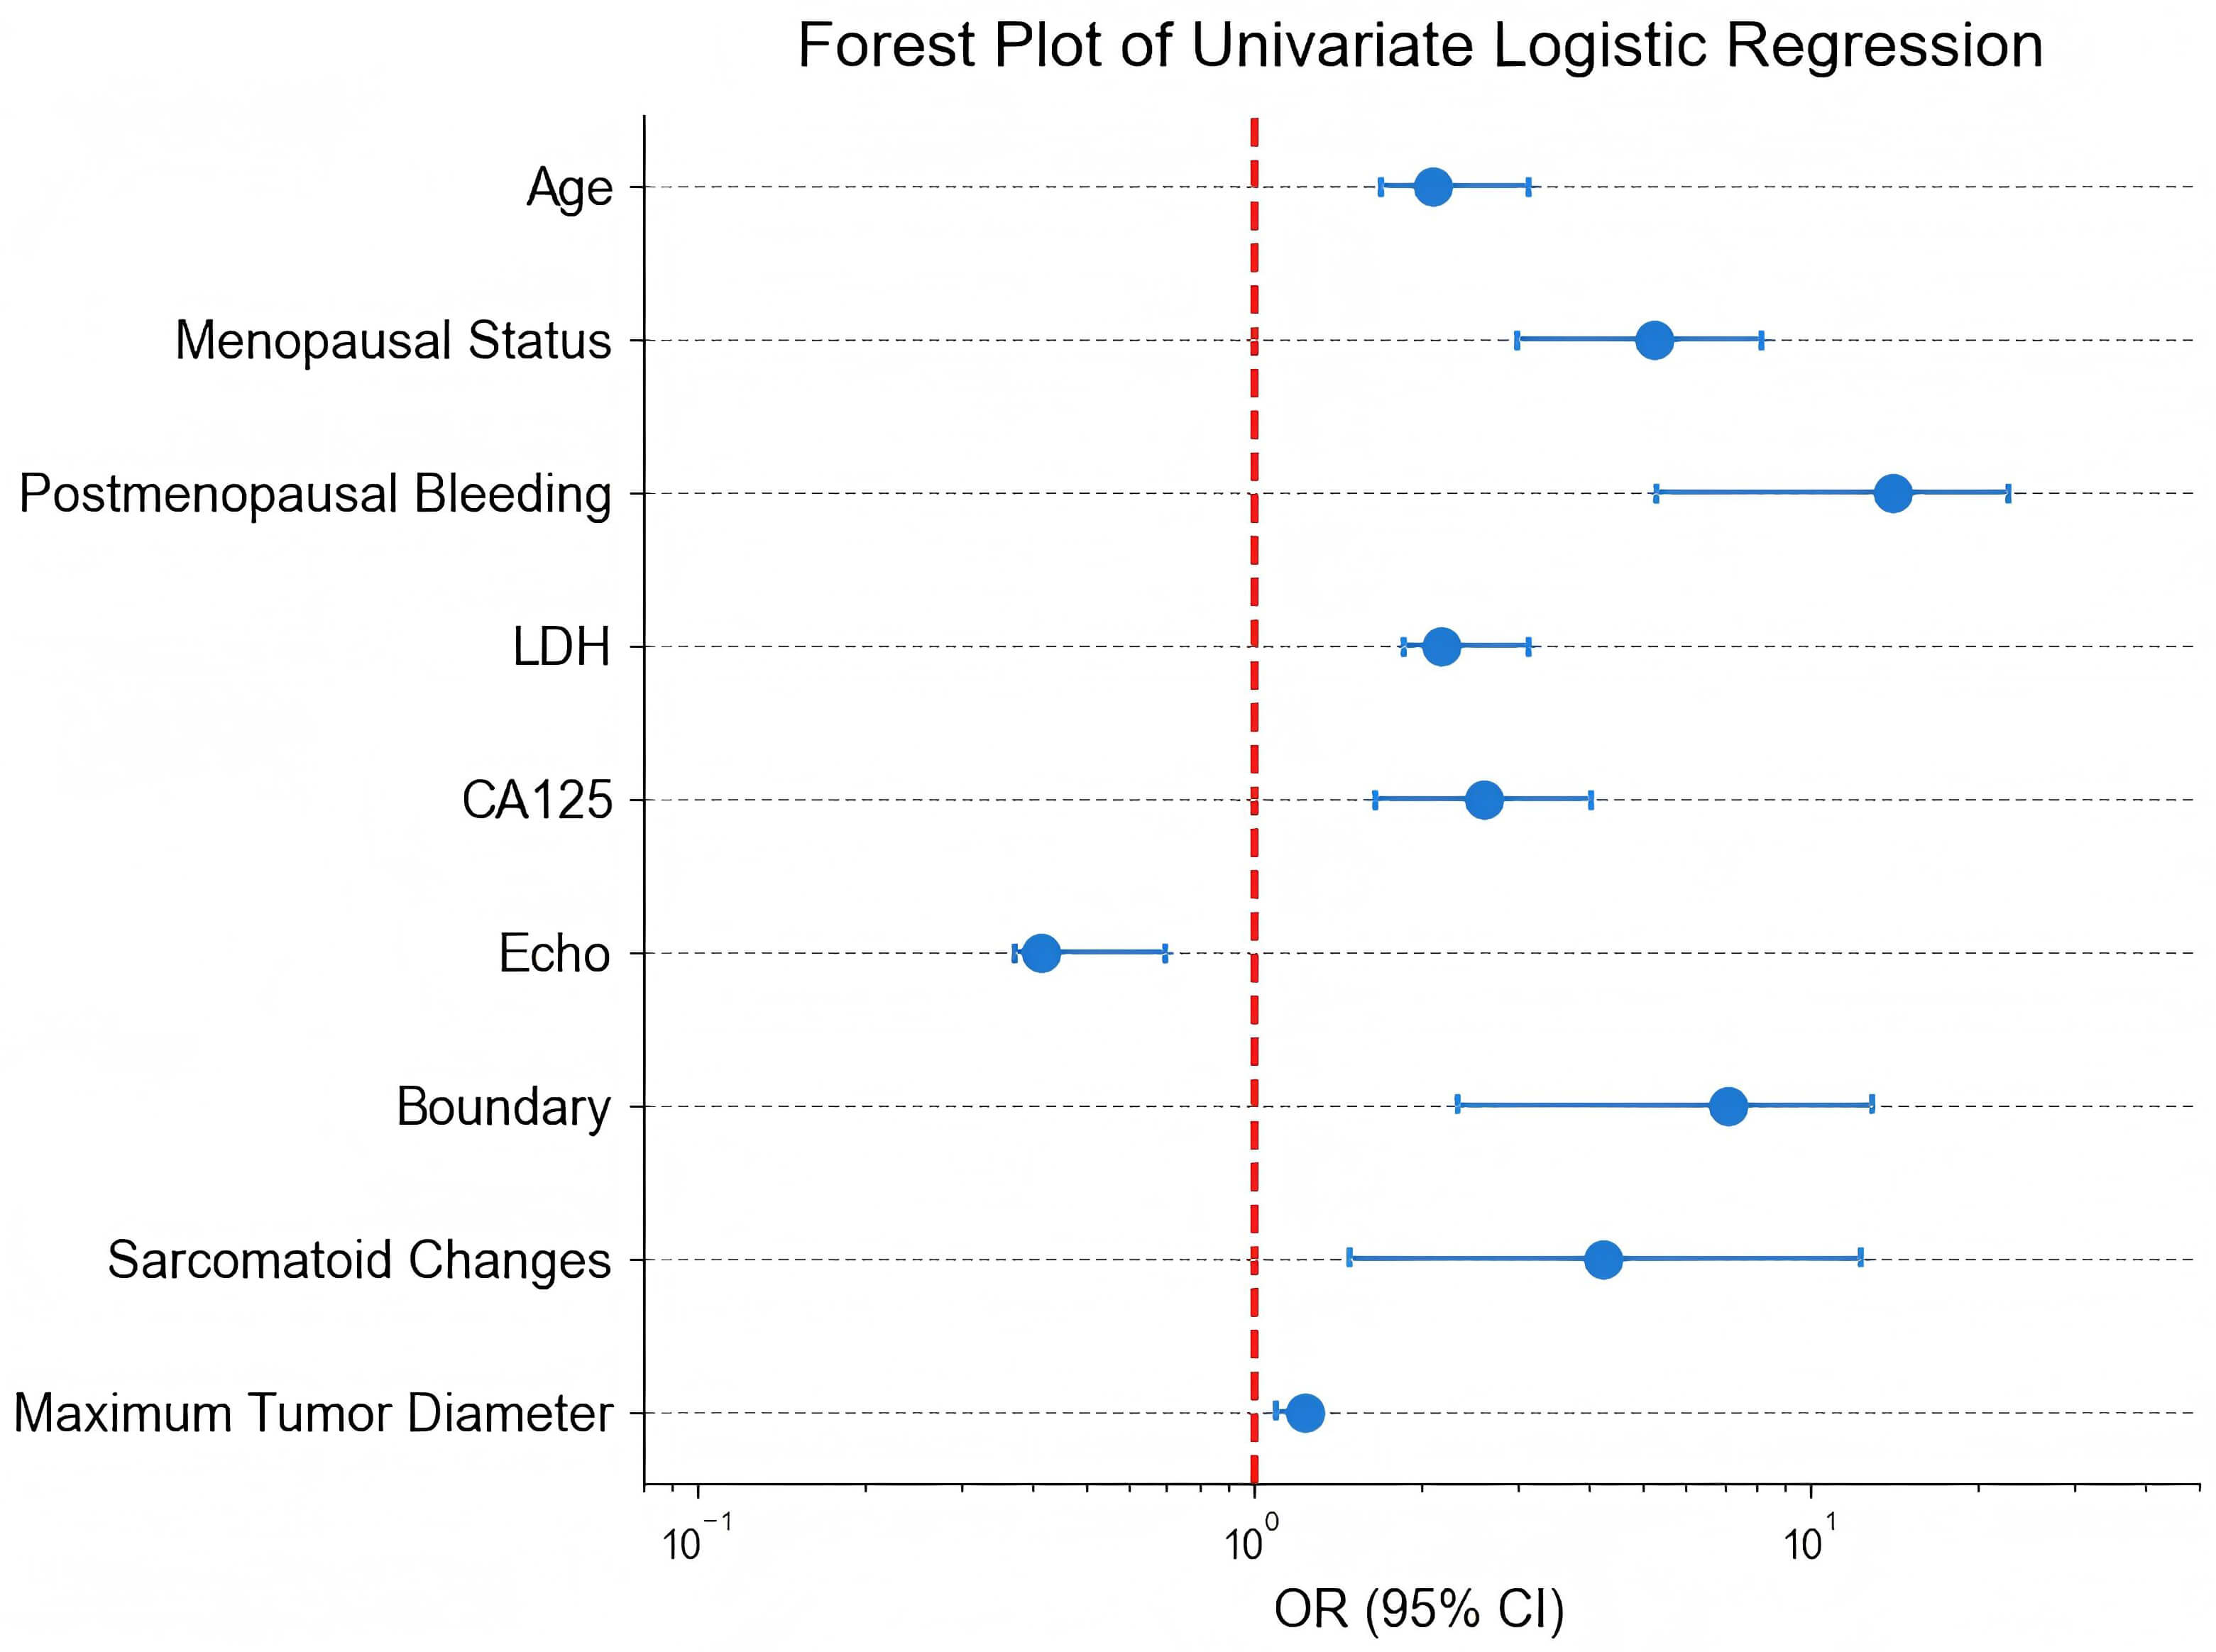 Fig. 2.
Forest plot of the univariate logistic regression analysis. OR, odds ratio; CI, confidence interval; LDH, lactate dehydrogenase; CA125, carbohydrate antigen 125.
| Feature | OR | 95% CI | p value |
| Age | 2.105 | 1.700–3.140 | 0.002 |
| Menopausal status | 5.222 | 3.000–8.200 | |
| Postmenopausal bleeding | 14.030 | 5.308–22.843 | 0.003 |
| LDH | 2.189 | 1.874–3.141 | |
| CA125 | 2.592 | 1.652–4.071 | |
| Echo | 0.415 | 0.372–0.700 | 0.011 |
| Margin | 7.094 | 2.331–13.007 | |
| Sarcomatoid changes | 4.239 | 1.503–12.343 | 0.001 |
| Maximum tumor diameter | 1.246 | 1.100–1.300 | 0.030 |
The outcomes from the multivariate logistic regression analysis are presented in
Table 3 and Fig. 3. Multiple factors, including age (OR = 1.805, 95% CI:
1.225–3.749, p
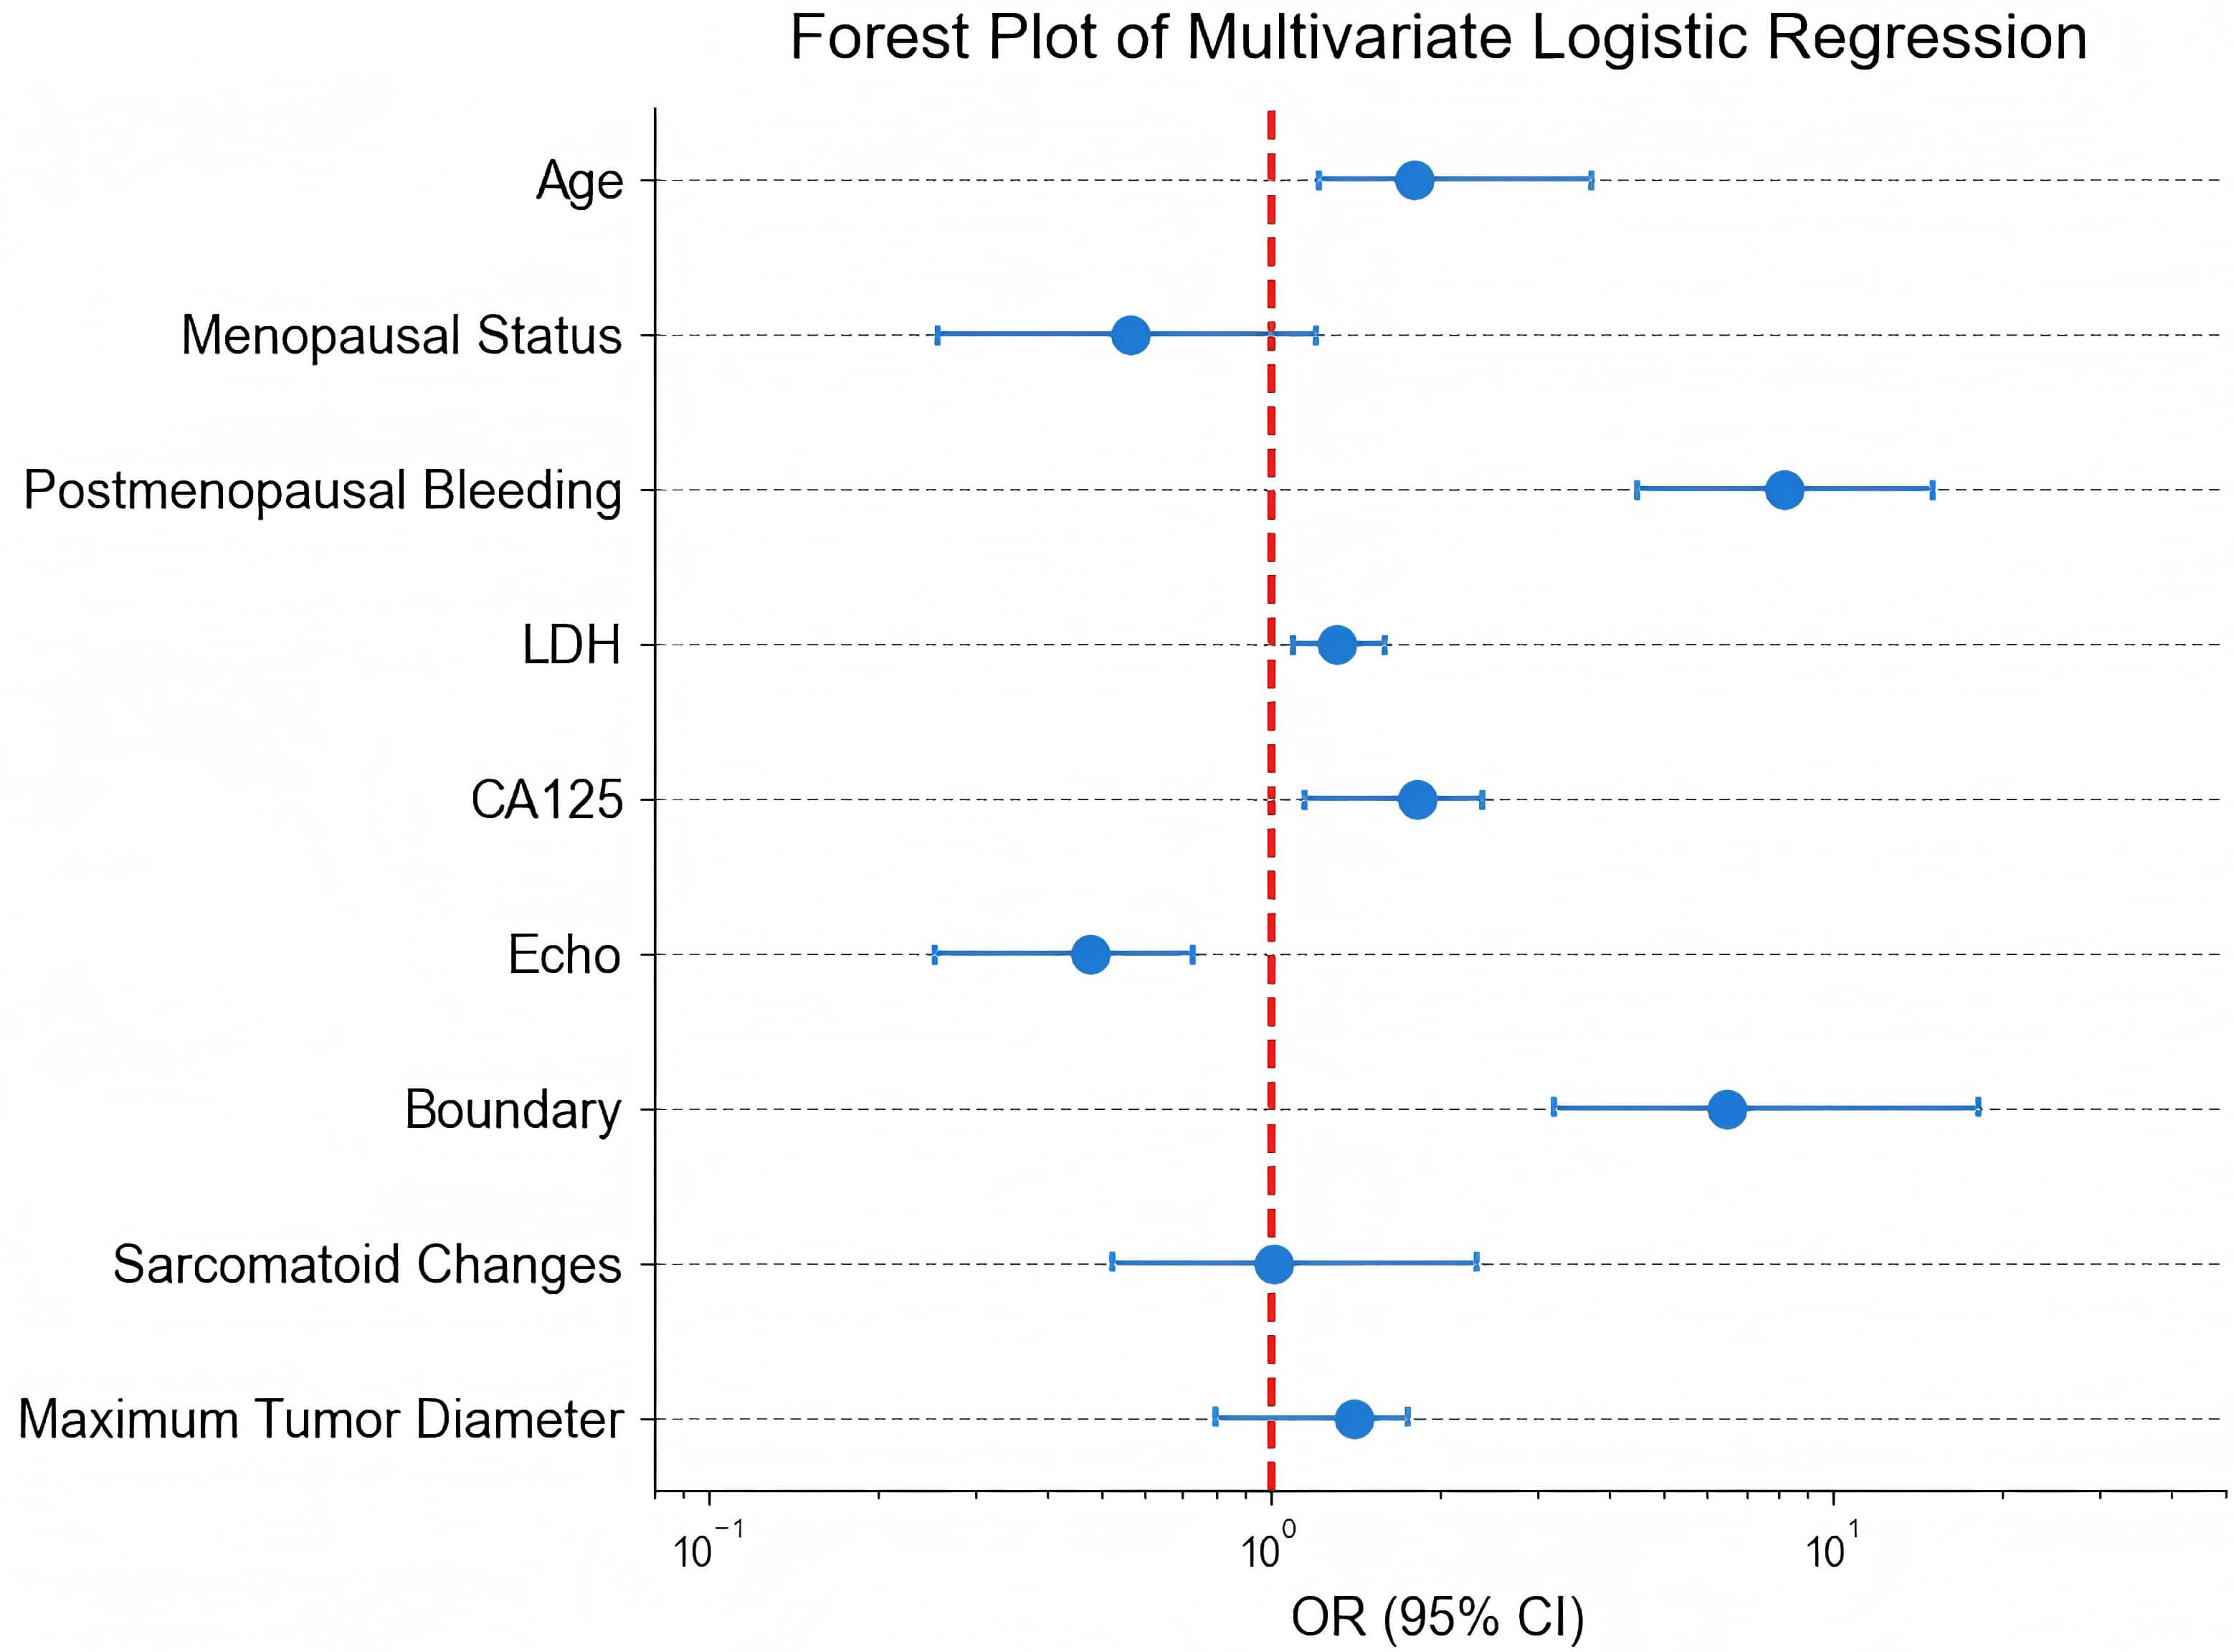 Fig. 3.
Forest plot of multivariate logistic regression analysis.
| Feature | OR | 95% CI | p value |
| Age | 1.805 | 1.225–3.749 | |
| Menopausal status | 0.565 | 0.256–1.217 | 0.802 |
| Postmenopausal bleeding | 8.182 | 4.508–15.045 | 0.002 |
| LDH | 1.316 | 1.107–1.606 | 0.007 |
| CA125 | 1.816 | 1.153–2.394 | 0.002 |
| Echo | 0.481 | 0.253–0.728 | 0.003 |
| Margin | 6.514 | 3.199–18.135 | |
| Sarcomatoid changes | 1.015 | 0.524–2.329 | 0.211 |
| Maximum tumor diameter | 1.414 | 0.803–1.761 | 0.574 |
The diagnostic performance of various models is presented in Table 4 and Fig. 4.
The apparent performance on the original dataset showed that the clinical model
yielded an AUC of 0.764, indicating good discriminative ability; the laboratory
model reached an AUC of 0.651; and the ultrasound model exhibited a higher AUC of
0.804. Importantly, the integrated clinical-laboratory-USA model achieved the
highest AUC of 0.902, significantly outperforming all single models (all DeLong
p
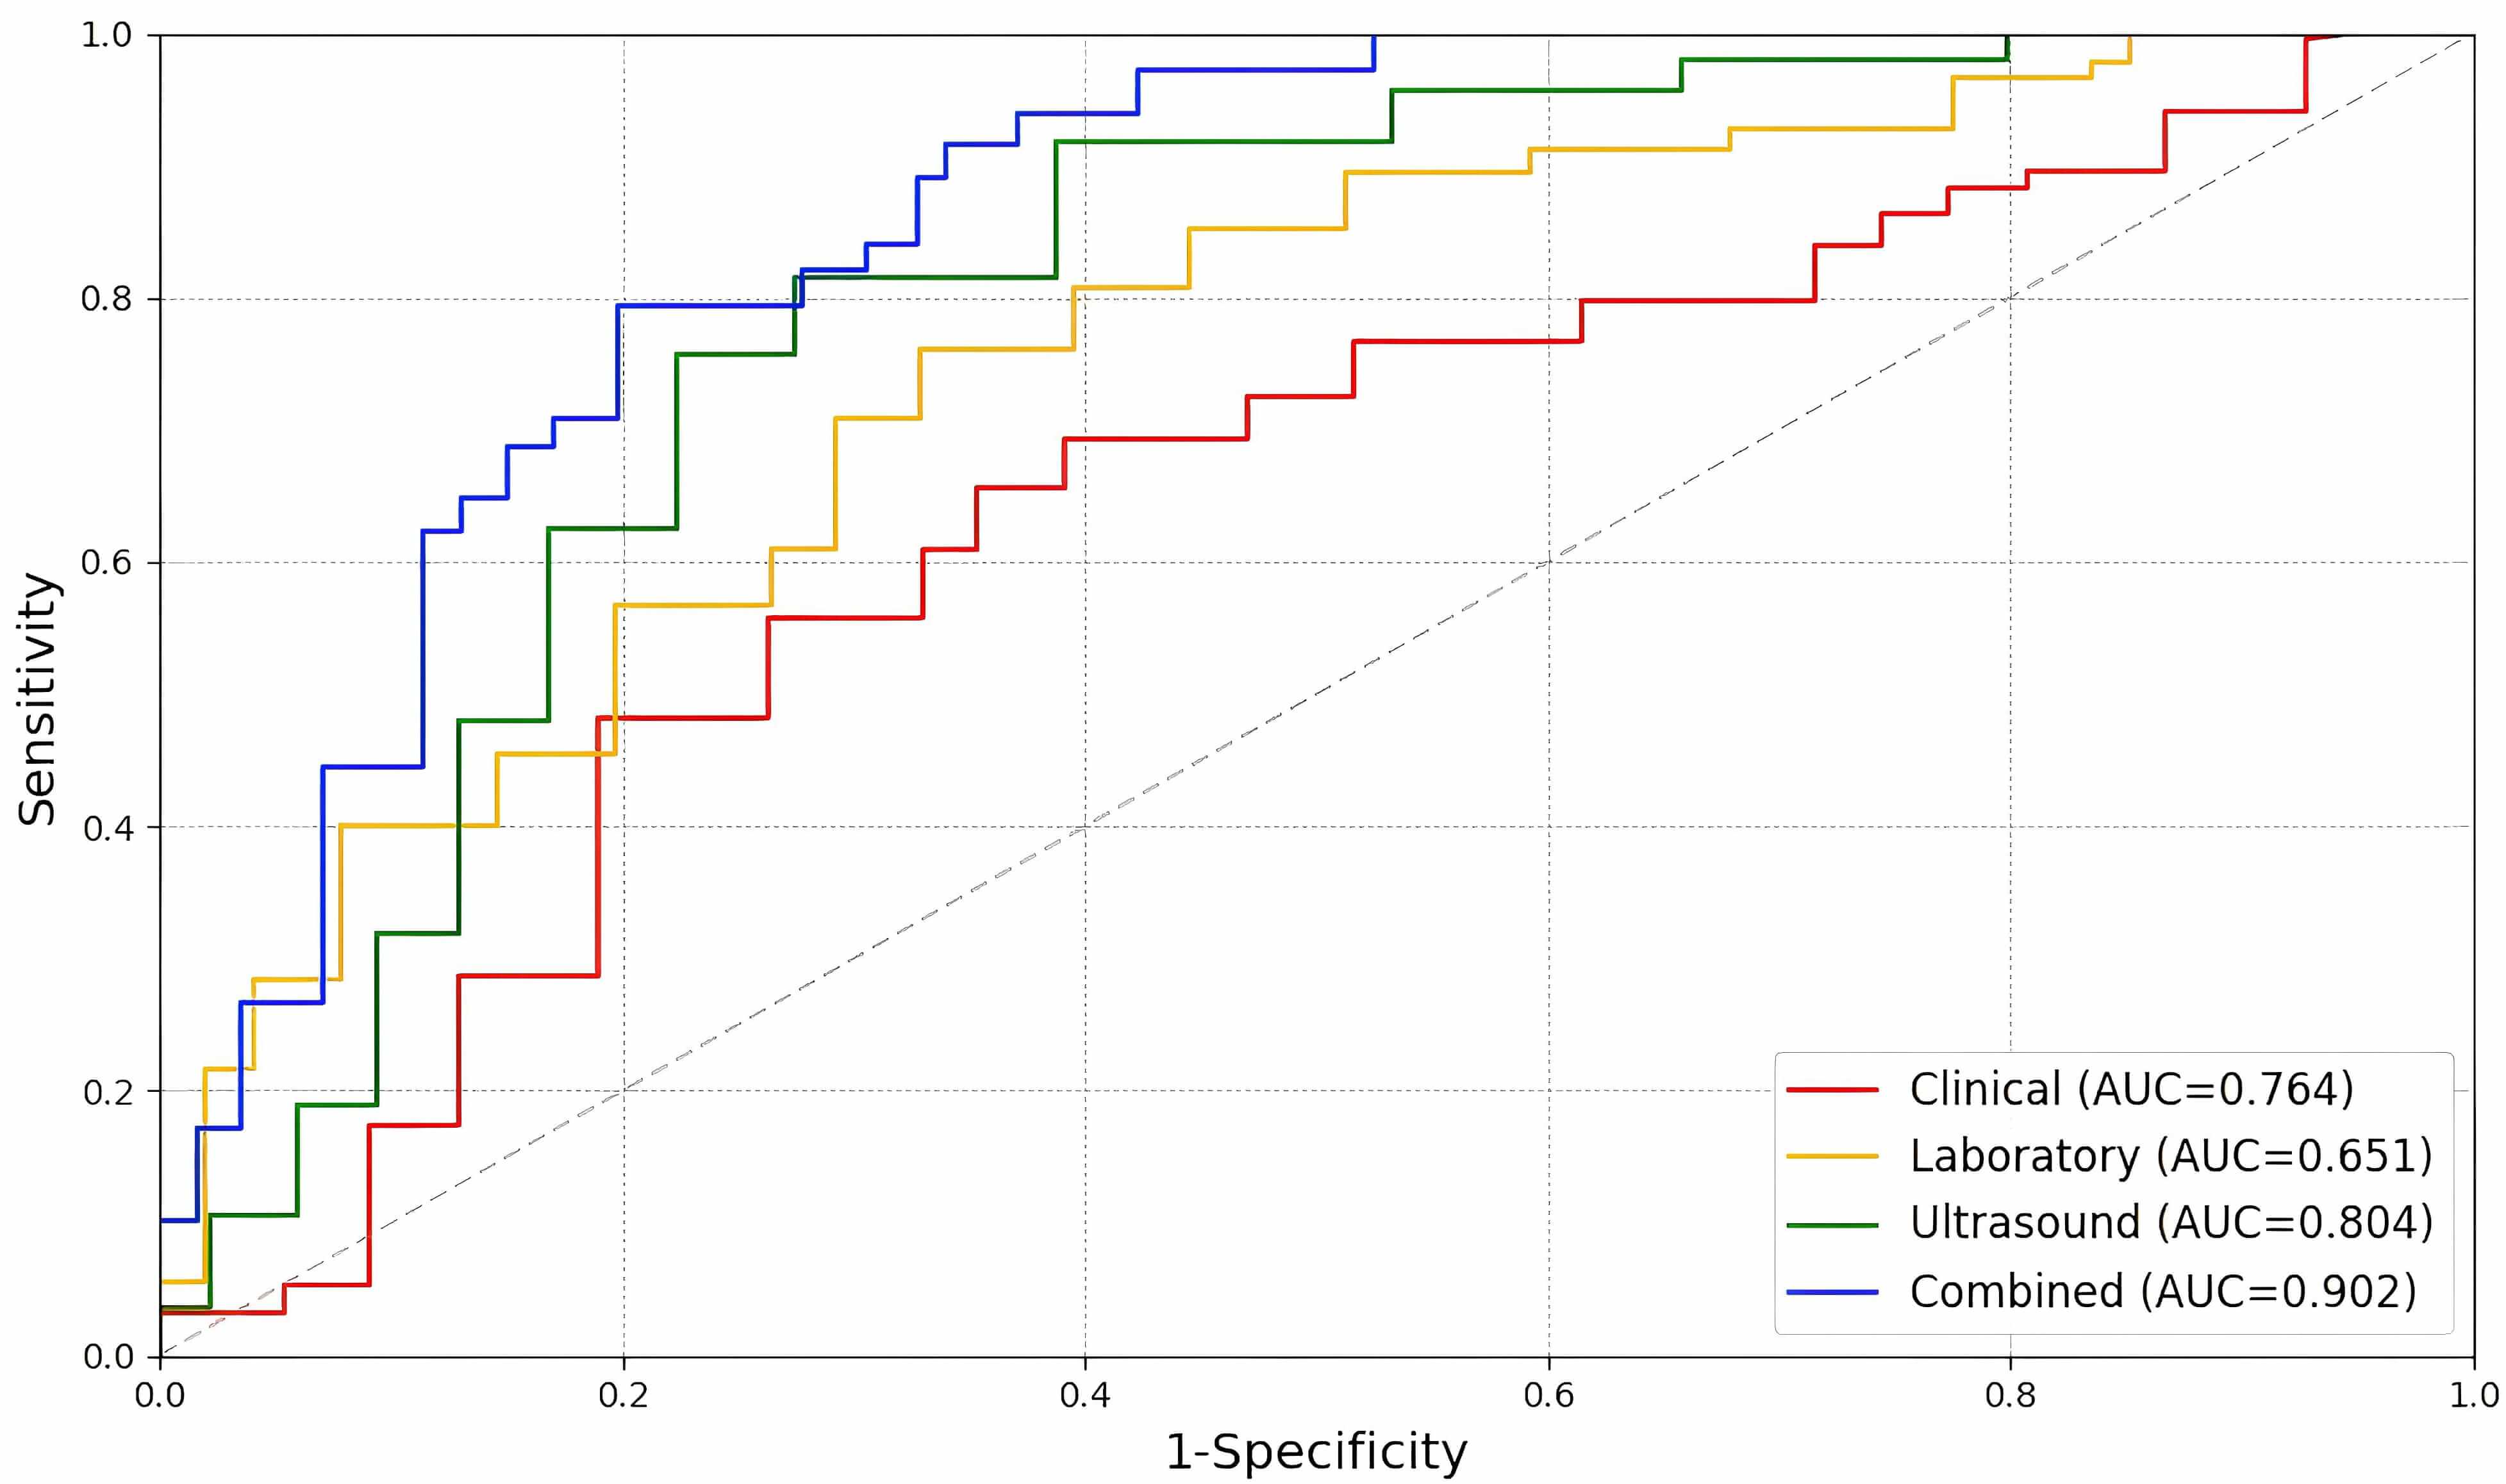 Fig. 4.
Predictive performance of the four models. AUC, area under the curve.
| Performance metric | Clinical model | Laboratory model | Ultrasound model | Combined model |
| Sensitivity, % (95% CI) | 84.5 (74.2–91.3) | 68.3 (57.5–79.1) | 70.4 (66.2–78.5) | 90.8 (83.2–94.4) |
| Specificity, % (95% CI) | 60.3 (51.8–71.3) | 65.1 (55.2–73.6) | 83.1 (75.7–90.1) | 85.8 (76.8–94.8) |
| Accuracy, % (95% CI) | 76.2 (67.5–84.9) | 66.5 (58.4–74.7) | 77.1 (69.4–83.9) | 88.3 (82.0–94.1) |
| p value | 0.005 | 0.013 | 0.002 | 0.001 |
| AUC (Apparent), (95% CI) | 0.764 (0.702–0.863) | 0.651 (0.568–0.733) | 0.804 (0.736–0.872) | 0.902 (0.847–0.935) |
| AUC (10-fold CV), (95% CI) | 0.748 (0.698–0.798) | 0.635 (0.575–0.695) | 0.789 (0.739–0.839) | 0.885 (0.845–0.925) |
| AUC (Bootstrap), (95% CI) | 0.751 (0.705–0.797) | 0.640 (0.590–0.690) | 0.791 (0.741–0.841) | 0.887 (0.852–0.922) |
AUC, area under the curve; CV, cross-validation.
To rigorously assess the models’ generalizability and correct for overoptimism, internal validation was performed (Fig. 5). The tenfold cross-validated AUCs for the clinical, laboratory, ultrasound, and combined models were 0.748, 0.635, 0.789, and 0.885, respectively. Furthermore, bootstrap validation with 1000 repetitions yielded optimism-corrected AUCs of 0.751, 0.640, 0.791, and 0.887 for the respective models. The combined model maintained the highest performance across all validation methods, demonstrating its robust diagnostic ability.
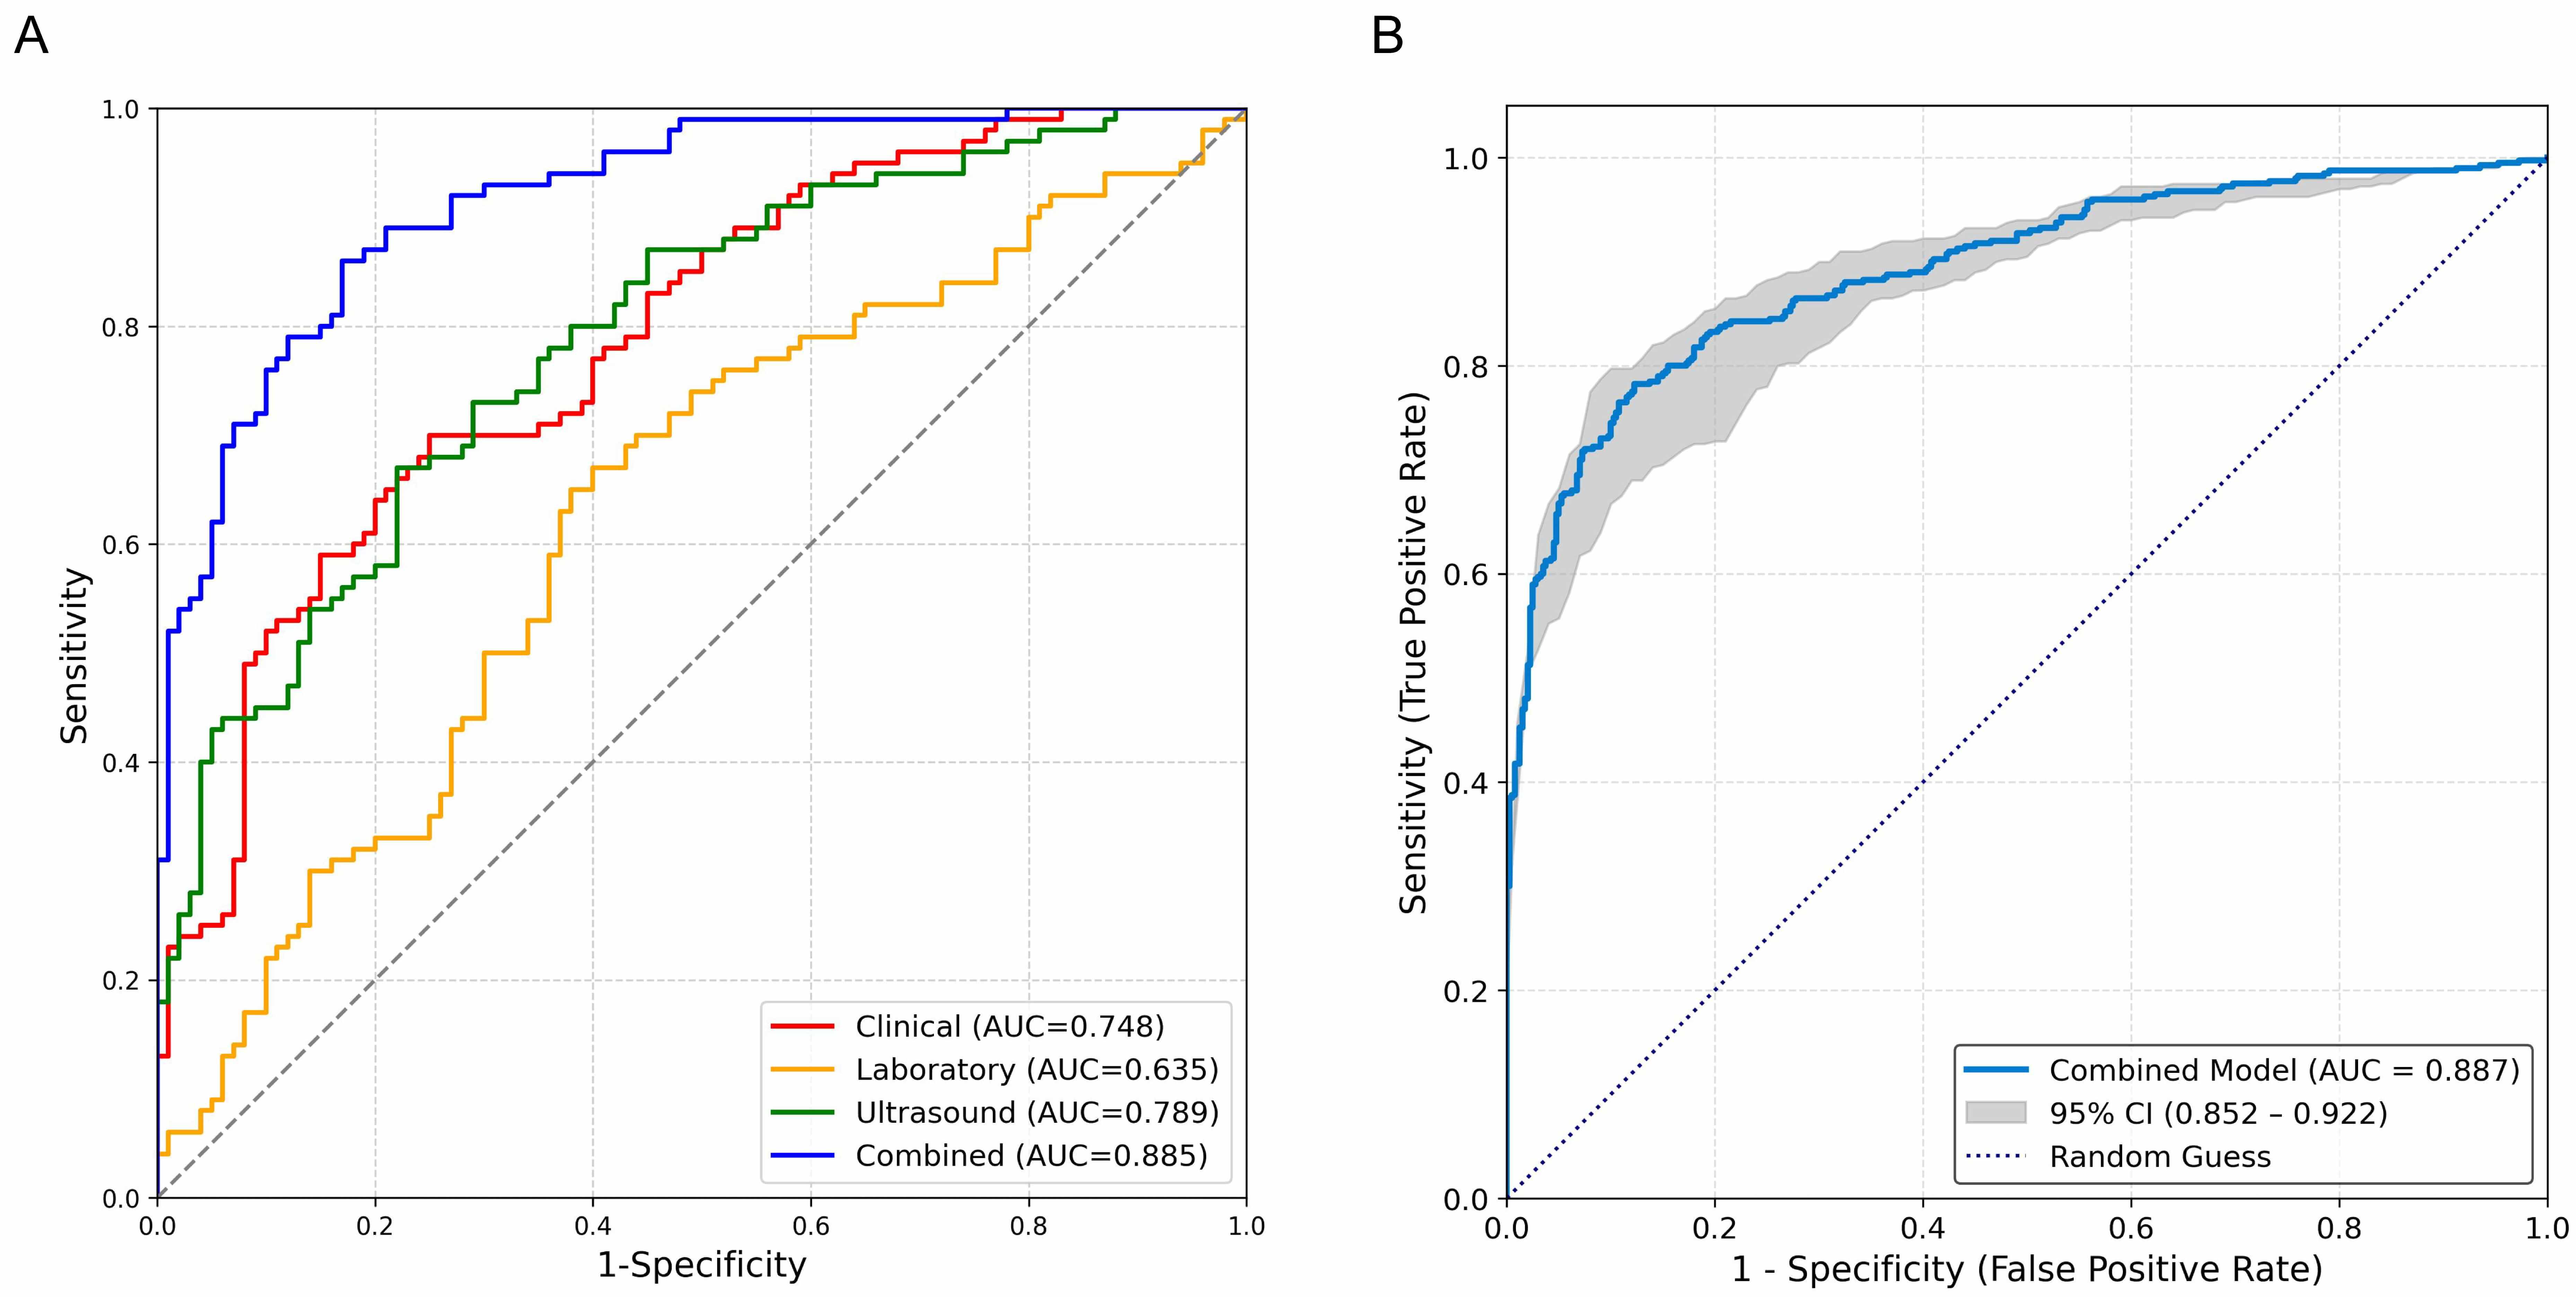 Fig. 5.
Predictive performance and internal validation of the models. (A) ROC curves from tenfold cross-validation. The lines represent the mean ROC curve for each model averaged over the 10 folds. The combined model (AUC = 0.885) demonstrates superior discriminative ability compared to the clinical (AUC = 0.748), laboratory (AUC = 0.635), and ultrasound (AUC = 0.789) models. (B) Bootstrap-validated ROC curve of the combined model. The solid line represents the optimism-corrected mean ROC curve from 1000 bootstrap repetitions (AUC = 0.887). The shaded area represents the 95% confidence interval, illustrating the model’s stable performance. ROC, receiver operating characteristic; AUC, area under the curve.
In this study, we developed and validated a nomogram that integrates readily accessible clinical, laboratory, and ultrasound features to preoperatively differentiate uterine sarcoma from fibroids. Our key findings from multivariate analysis identified age, postmenopausal bleeding, elevated LDH and CA125 levels, along with heterogeneous echogenicity and irregular tumor margins on ultrasound as independent predictors of uterine sarcoma. The core innovation of our research lies in the integration of these multidimensional parameters into a single, accessible tool.
The superior performance of our combined model, achieving an apparent AUC of 0.902, underscores the synergistic value of integrating data from different sources. This integrated approach significantly outperformed models based on clinical, laboratory, or ultrasound features alone, which is consistent with the complex nature of the disease and suggests that a single-modality assessment is insufficient for optimal discrimination. Crucially, the model’s robustness and generalizability were confirmed through rigorous internal validation. The combined model maintained high performance with a tenfold cross-validated AUC of 0.885 and a bootstrap-corrected AUC of 0.887. The narrow confidence intervals around these validated estimates provide strong evidence that the model is stable and not substantially overfitted, thereby addressing a key concern in predictive model development and enhancing its potential credibility for clinical application.
We explicitly acknowledge that magnetic resonance imaging (MRI) is a highly sensitive imaging modality for soft tissue characterization. However, our nomogram deliberately excludes MRI data for multidimensional reasons aimed at highlighting the practicality and broad applicability of the study, as detailed below.
The core objective of this study is to construct a cost-effective, easily implementable preoperative triage tool for resource-limited settings. Although MRI is highly sensitive, it has significant limitations in primary care scenarios, including high costs, poor equipment availability, and lengthy examination times. In contrast, our nomogram integrates clinical features, laboratory markers, and ultrasound parameters to provide a rapid and economical first-line screening method. This approach aims to identify high-risk patients who can then be referred for more precise MRI evaluation.
Our approach aligns with recent literature advocating the need for efficient preliminary diagnostic tools [17, 18, 19, 20]. For example, in resource-constrained areas, the low availability of MRI can lead to diagnostic delays. The nomogram, as a multidimensional integration model, can prioritize high-risk cases and optimize the allocation of medical resources. This stepwise strategy (initial screening with the nomogram followed by MRI confirmation) has been proven to enhance diagnostic efficiency and reduce unnecessary invasive procedures. This stepwise diagnostic strategy, initial risk stratification with the nomogram followed by targeted MRI confirmation in high-risk cases has the potential to enhance overall diagnostic efficiency, reduce unnecessary invasive procedures, and ensure timely referral for complex cases.
By avoiding direct reliance on MRI, our model lowers the barriers to clinical implementation. Ultrasound and clinical data are more readily accessible and easier to implement in primary healthcare settings, which aligns with the global health equity concept. Future multicenter studies can further validate the complementary value of this model when it is used in conjunction with MRI.
In summary, the exclusion of MRI is based on a comprehensive consideration of practicality, cost-effectiveness, and accessibility. Our nomogram aims to bridge the gap between primary screening and advanced imaging, providing efficient support for clinical decision-making.
Comparing our study with the literature, we observed significant parallels and distinctions [21, 22]. One study developed a similar diagnostic model with an AUC of 0.82, which is comparable to our integrated model’s performance (AUC = 0.902) [23]. Our research extends this approach by integrating ultrasound characteristics, demonstrating improved diagnostic accuracy [24, 25, 26]. Our research extends this approach not only by integrating ultrasound characteristics but also by subjecting the model to more rigorous validation, thereby providing a more reliable estimate of its future performance. Unlike previous studies that relied primarily on single-modality assessments, our nomogram’s strength lies in its multidimensional data integration, which significantly enhances diagnostic precision. These comparisons underscore the innovative nature of our approach and its potential clinical utility in differentiating uterine sarcomas from fibroids.
Despite these promising results, this study has several limitations that should be acknowledged. First, its retrospective and single-center design may introduce selection bias and limit the generalizability of our findings. Although we employed a 1:1 matched design to mitigate this risk, future prospective, multicenter studies with larger sample sizes are warranted to validate and refine our nomogram.
Second, the relatively small sample size, particularly for rare uterine sarcoma cases, may affect the stability and statistical power of the predictive model. Expanding the cohort in future research would help enhance the model’s robustness.
Third, while the nomogram demonstrates high diagnostic accuracy, it is intended as a preoperative triage tool rather than a replacement for definitive diagnostic methods such as MRI or histopathological examination. Its performance in routine clinical practice needs further evaluation.
In summary, our study demonstrates that integrating clinical, laboratory, and ultrasound features substantially improves the diagnostic accuracy for differentiating uterine sarcoma from fibroids. The combined predictive model holds significant potential for improving clinical decision-making and patient prognosis.
The experimental data used to support the findings of this study are available from the corresponding author upon request.
CZH contributed to the study conception and drafted the manuscript; YJW performed the data analysis; BWL designed the research project and collected the data. All authors have read and approved the final manuscript. All authors contributed to editorial changes in the manuscript. All authors have participated sufficiently in the work and agreed to be accountable for all aspects of the work.
This study was conducted in accordance with the guidelines of the Declaration of Helsinki, and the research protocol has been approved by the Ethics Committee of the Affiliated Hospital of Putian University (Ethical approval number: 2025282). All patients provided informed consent before participating in the study.
Not applicable.
This research received no external funding.
The authors declare no conflict of interest.
During the preparation of this work the authors used ChatGpt-3.5 in order to check spell and grammar. After using this tool, the authors reviewed and edited the content as needed and takes full responsibility for the content of the publication.
Supplementary material associated with this article can be found, in the online version, at https://doi.org/10.31083/CEOG45628.
References
Publisher’s Note: IMR Press stays neutral with regard to jurisdictional claims in published maps and institutional affiliations.